
688090 (Guangzhou Risong Intelligent Technology Holding Co Ltd) — 06-May-2026 Technical Stance: Short-Term Bullish, Broader Neutral
Guangzhou Risong Intelligent Technology Holding Co Ltd (688090) sits in a mixed regime: short-horizon KGNAI ranks lean constructive while broader horizons remain neutral, suggesting recent relative strength has not fully propagated into a higher-confidence mid/long profile. In trend terms, the moving-average structure is supportive (Close vs MA50 = Bullish, MA50 vs MA200 = Bullish), yet momentum is not decisively aligned—RSI remains Neutral and the MACD histogram at -0.4006 highlights lingering downside impulse. Volatility conditions are moderate with Bollinger Bandwidth at 0.1092, implying the market may still be “set up” for expansion but is not currently displaying extreme compression. Key decision zones are clearly defined by support near 47.7550 and resistance near 76.6000; how price behaves around these levels should be treated as confirmation/invalidation boundaries rather than forecasts. News flow is largely non-specific to the instrument and reads broadly neutral (avg sentiment -0.013).
Key Takeaways
- Rank stance: Short-term Bullish (Daily #83; Weekly #206) | Mid-term Neutral (Monthly #994) | Long-term Neutral (3–6M #1028/#1011)
- Technical confluence: Neutral (18-signal confluence 0.111; overall blended 0.271) despite DRL technical rank #231 labeled Bullish
- Key levels: Support ~ 47.7550 | Resistance ~ 76.6000
- News sentiment bias: Neutral (avg -0.013; Neutral 94%; Negative 6%; Positive 0%)
- Confirmation / invalidation: Continuation evidence improves on a break above 76.6000 with volume; deterioration risk increases on a close below 47.7550.
What KGNAI Measures
KGNAI evaluates assets using large cross-sectional datasets built from millions of structured data points. Inputs incorporate fundamental metrics, technical structures, and systematically processed news sentiment. Statistical models, machine learning, and AI frameworks are used to assess relative positioning, signal alignment, and probabilistic behavior across broad universes.
How to Read This Report
- Ranks are comparative across the tracked universe, not absolute price targets.
- Confluence reflects alignment among independent signal groups.
- Support/resistance levels are probabilistic decision zones, not guarantees.
- Sentiment provides contextual bias within the broader analytical framework.
1) KGNAI AI Analysis
Region: CHINA
Total universe size: 1292 ranked instruments
- Daily rank: #83 out of 1292 — Bullish
- Weekly rank: #206 out of 1292 — Bullish
- Monthly rank: #994 out of 1292 — Neutral
- 3-Monthly rank: #1028 out of 1292 — Neutral
- 6-Monthly rank: #1011 out of 1292 — Neutral
- Yearly rank: Not available for this horizon — Not available
The rank profile is best characterized as front-end strength with back-end neutrality. A daily rank of #83 places 688090 in roughly the top decile of the 1292-instrument universe, and the weekly rank of #206 remains in the upper portion of the distribution—consistent with near-term resilience. By contrast, the monthly rank at #994, alongside #1028 (3-month) and #1011 (6-month), sits in the lower third, signaling that the broader cross-sectional setup has not transitioned into a stronger medium-horizon regime.
This divergence often matters more than any single horizon: strong short-term ranks can reflect localized momentum, positioning shifts, or recent volatility dynamics, while weak-to-neutral medium horizons imply that the same behavior has not been persistent enough to register as a sustained advantage. In that context, the current “Bullish–Bullish–Neutral–Neutral–Neutral” ladder favors a tactical bias rather than a structural one.
The yearly horizon is Not available in the provided data. As a result, long-cycle confirmation must be inferred from the existing 3–6 month ranks and the technical sections below rather than an explicit annual score.
Term view: Short-term: Bullish. Mid-term: Neutral. Long-term: Neutral.
Want the full universe and complete rank tables? Unlock full access on KGNAI: https://www.kgnai.com/pricing
2) Price & trend overview
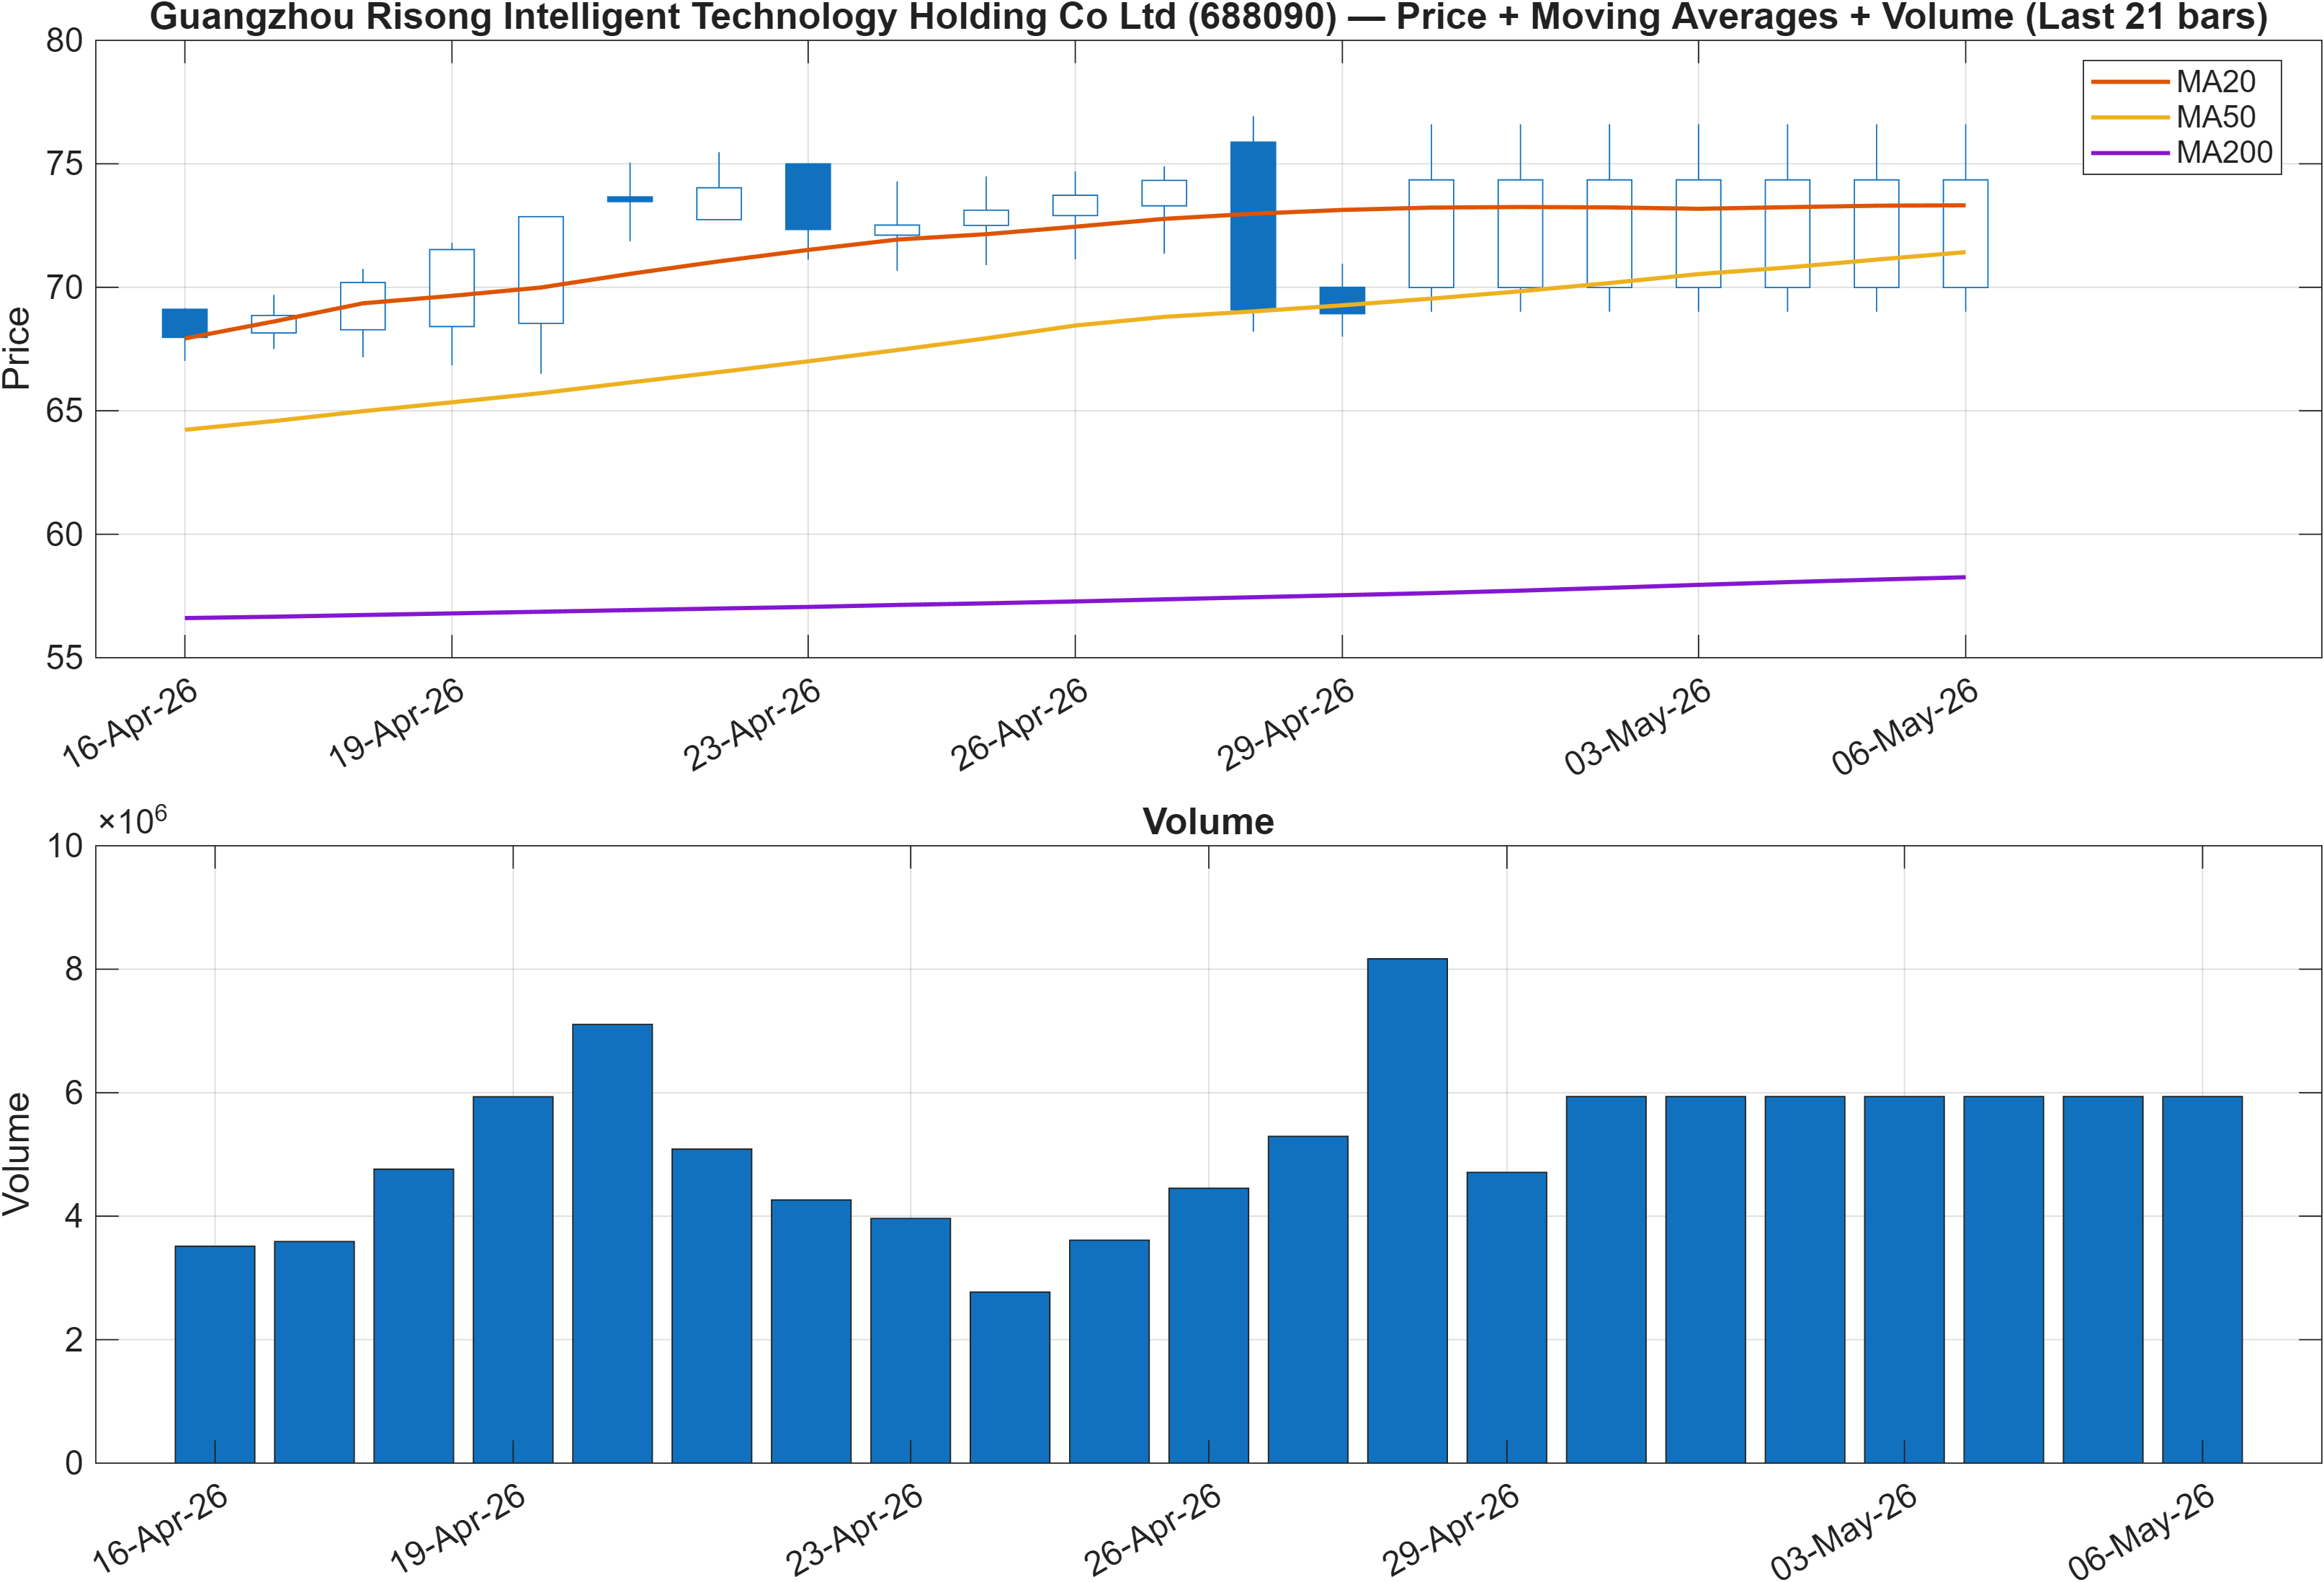
The moving-average configuration is unambiguously constructive: Close vs MA50 = Bullish and MA50 vs MA200 = Bullish. In practice, this combination typically indicates that price is holding above an intermediate trend measure while the intermediate trend remains above the longer trend measure—an alignment that often supports trend persistence.
However, the broader KGNAI horizon ladder tempers the interpretation. With the daily and weekly ranks strong (#83, #206) but the monthly and 3–6 month ranks neutral and elevated (#994, #1028, #1011), the trend structure may be better viewed as recovering rather than fully established across timeframes. This matters because moving-average alignment can remain “bullish” even while the market transitions through choppy consolidation phases.
From a market-structure perspective, the decision framework is to treat trend alignment as a supportive backdrop and look for additional confirmation from momentum/participation (Section 3) and level behavior (Section 4). The moderate volatility state (Bandwidth 0.1092) further supports the idea that the chart can remain orderly until a catalyst pushes a larger expansionary move.
Interpretation: Close vs MA50 = Bullish, MA50 vs MA200 = Bullish.
3) Momentum & volatility dashboard
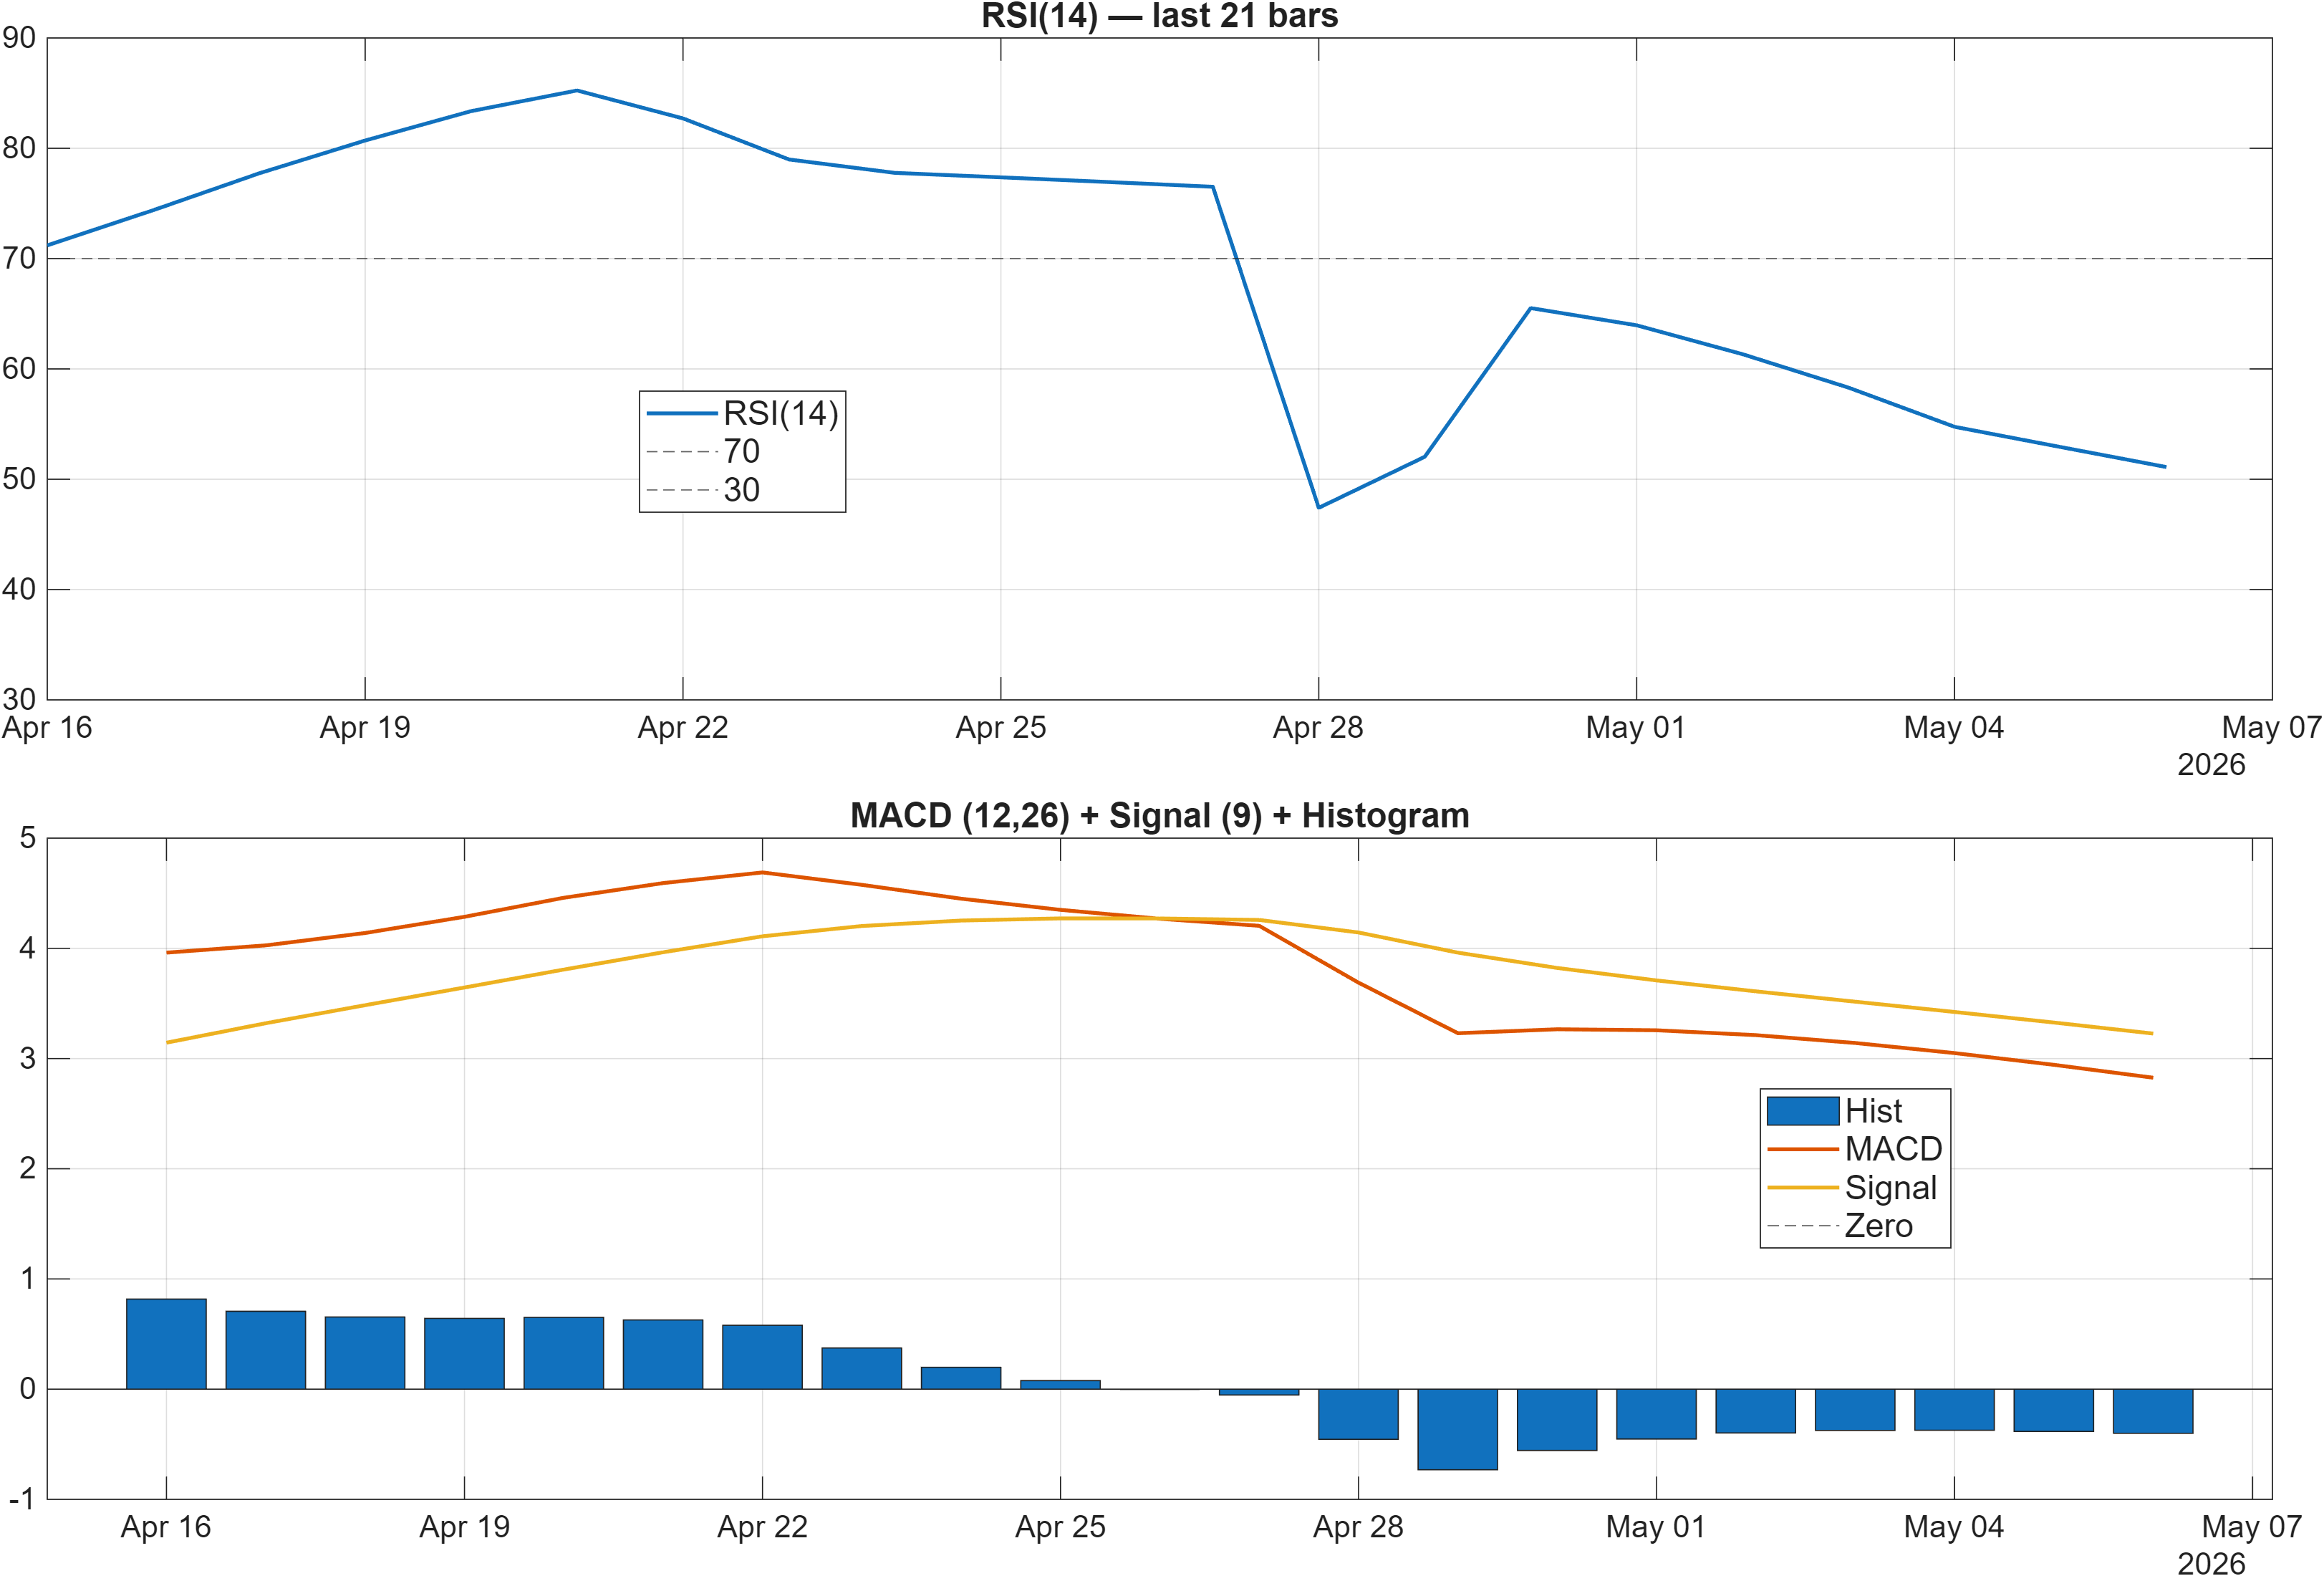
Momentum signals are mixed rather than synchronized. RSI bias is Neutral, and the RSI(14) at 51.1 sits close to the midline—consistent with balance between buying and selling pressure rather than directional dominance. At the same time, the MACD histogram at -0.4006 keeps a mild bearish tilt in the momentum impulse, suggesting upside progress may be encountering friction.
The internal momentum table provides a useful nuance: TS Mom(20) = 5.49 and ROC(20) = 7.973 are flagged Bullish, implying that recent rate-of-change and time-series momentum remain constructive even as the MACD histogram stays negative. This combination can occur when a prior advance is still present in shorter lookbacks, while the incremental push is decelerating—consistent with an “indecision persists” backdrop.
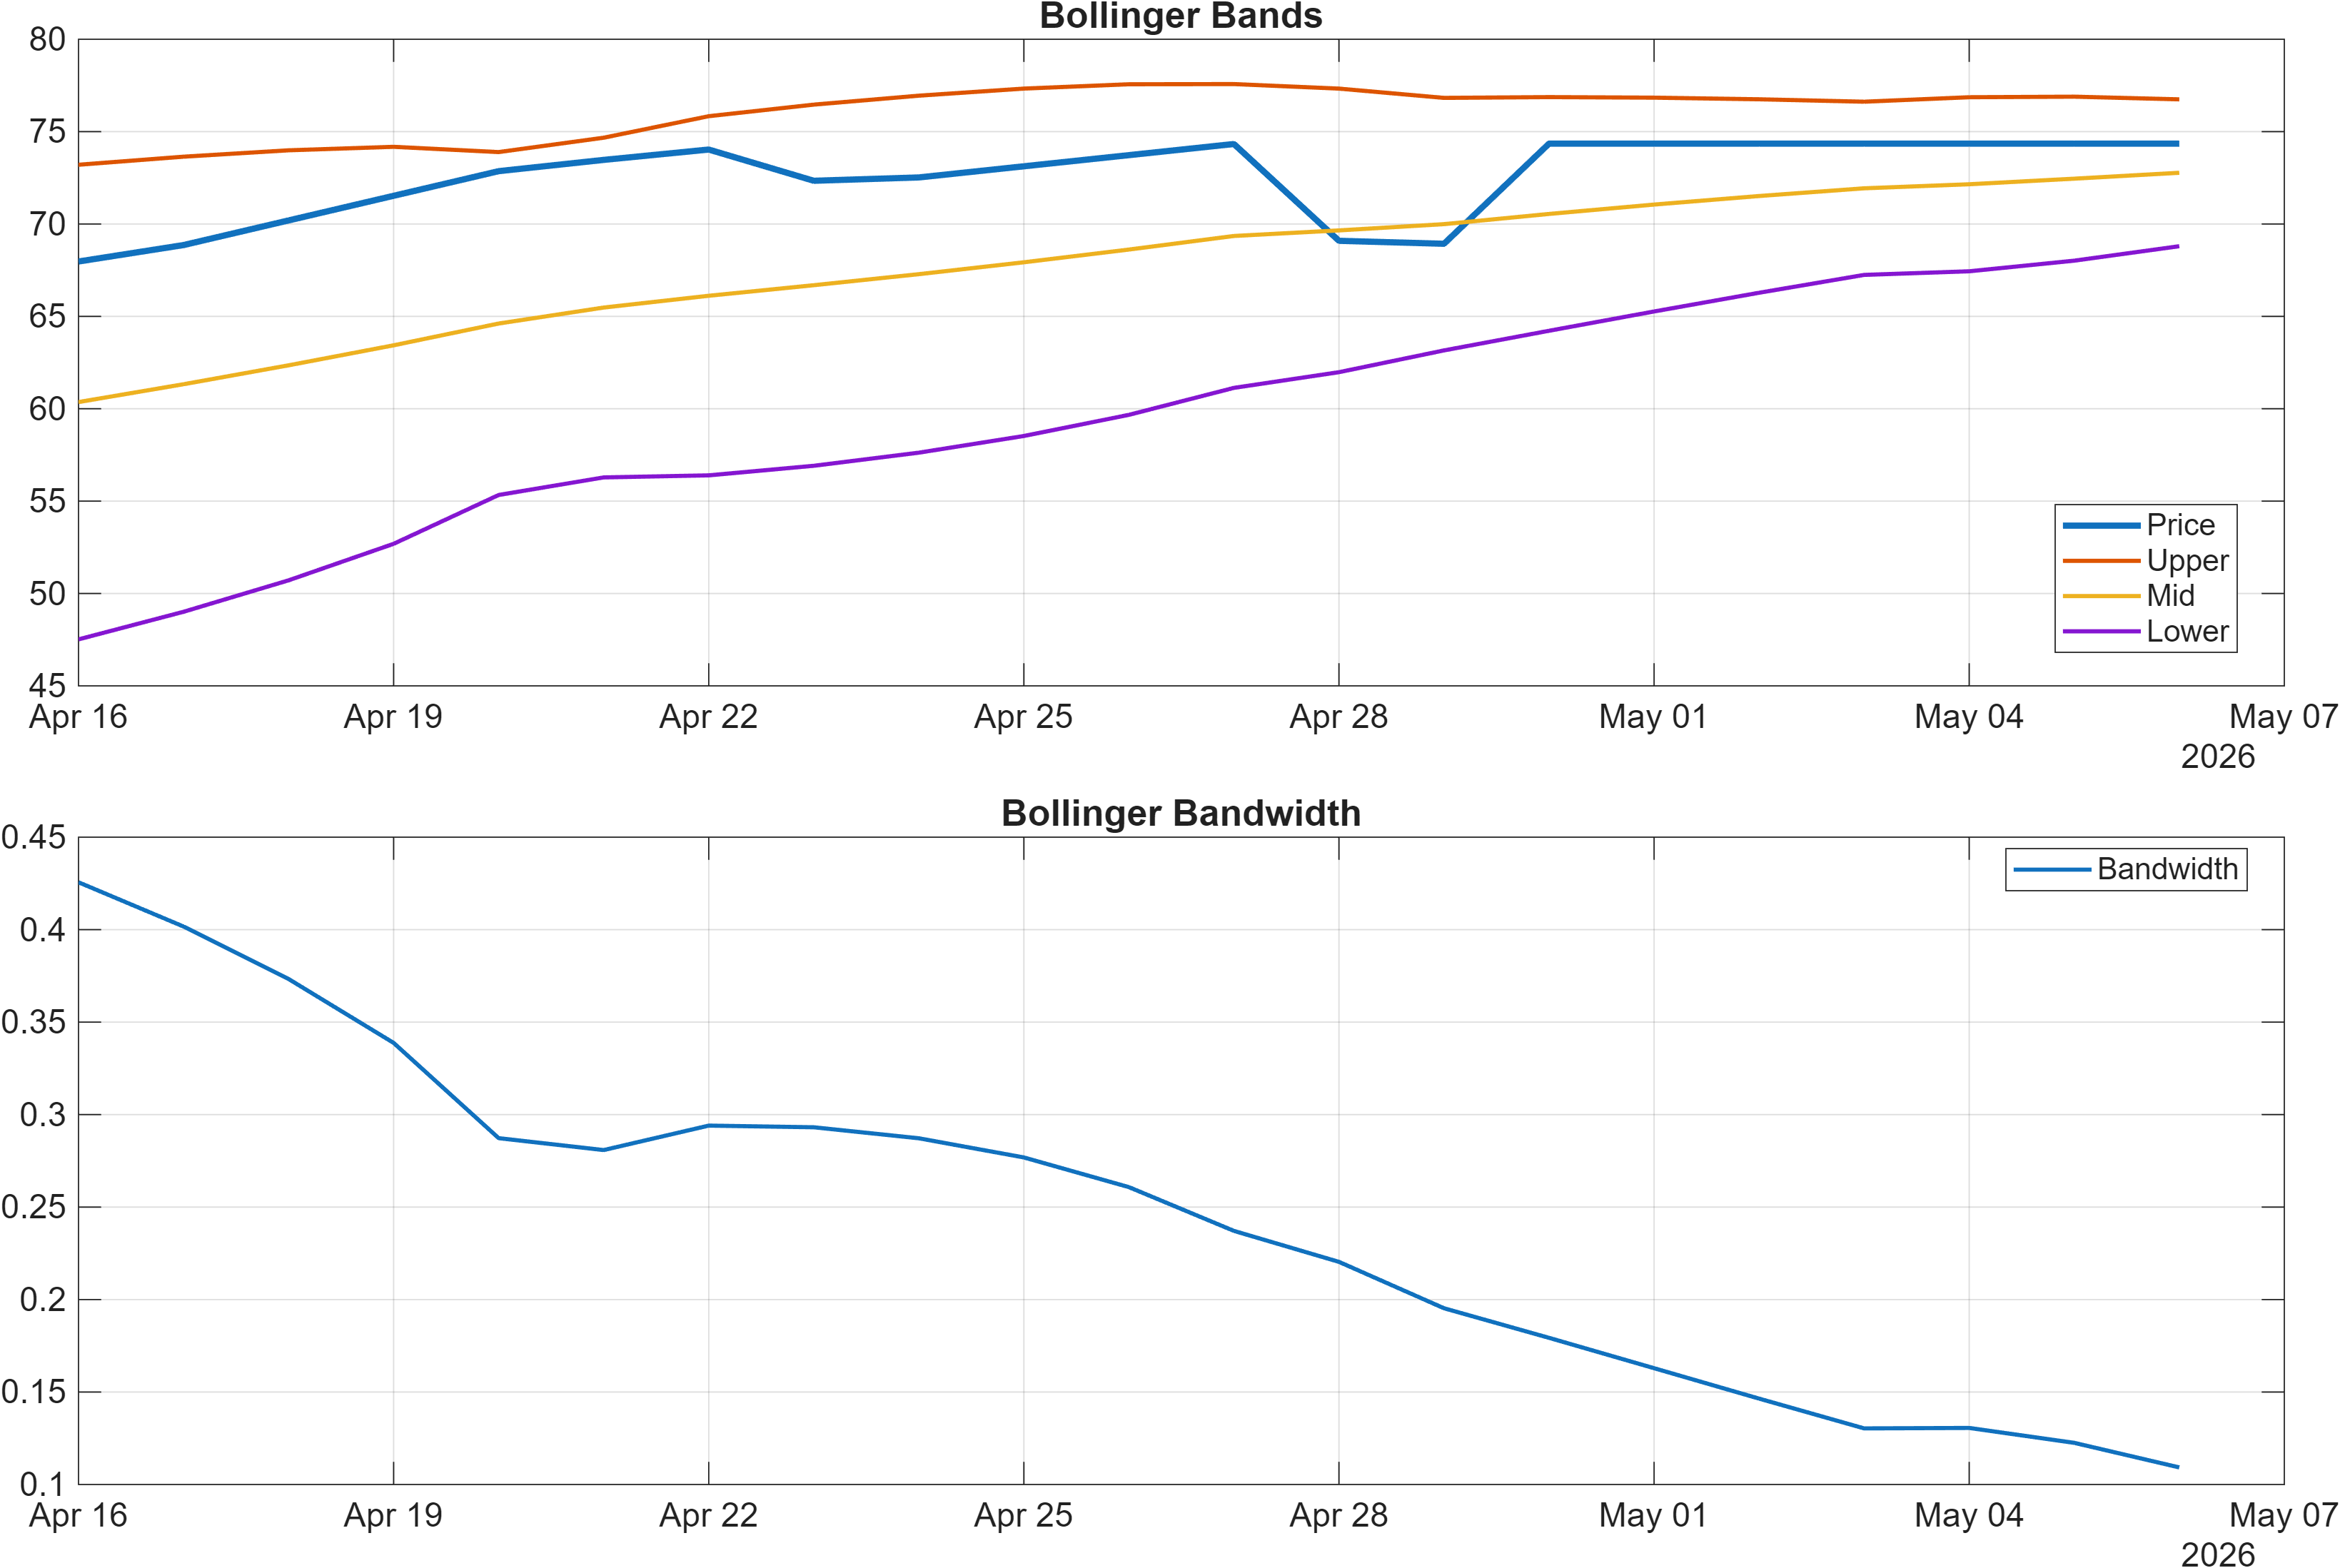
Volatility conditions are not extreme. Bollinger Bandwidth at 0.1092 indicates a moderate regime—neither highly compressed nor clearly expanding. In that setting, price can remain range-bound until a level break (Section 4) coincides with renewed momentum confirmation (e.g., MACD histogram improvement from -0.4006 toward positive territory). Until then, the more reliable read is that the market is organized but not decisive.
Interpretation: RSI bias = Neutral, MACD hist = -0.4006.
Interpretation: Bandwidth (volatility regime) latest = 0.1092.
4) Support / Resistance zones
Support ~ 47.7550 | Resistance ~ 76.6000
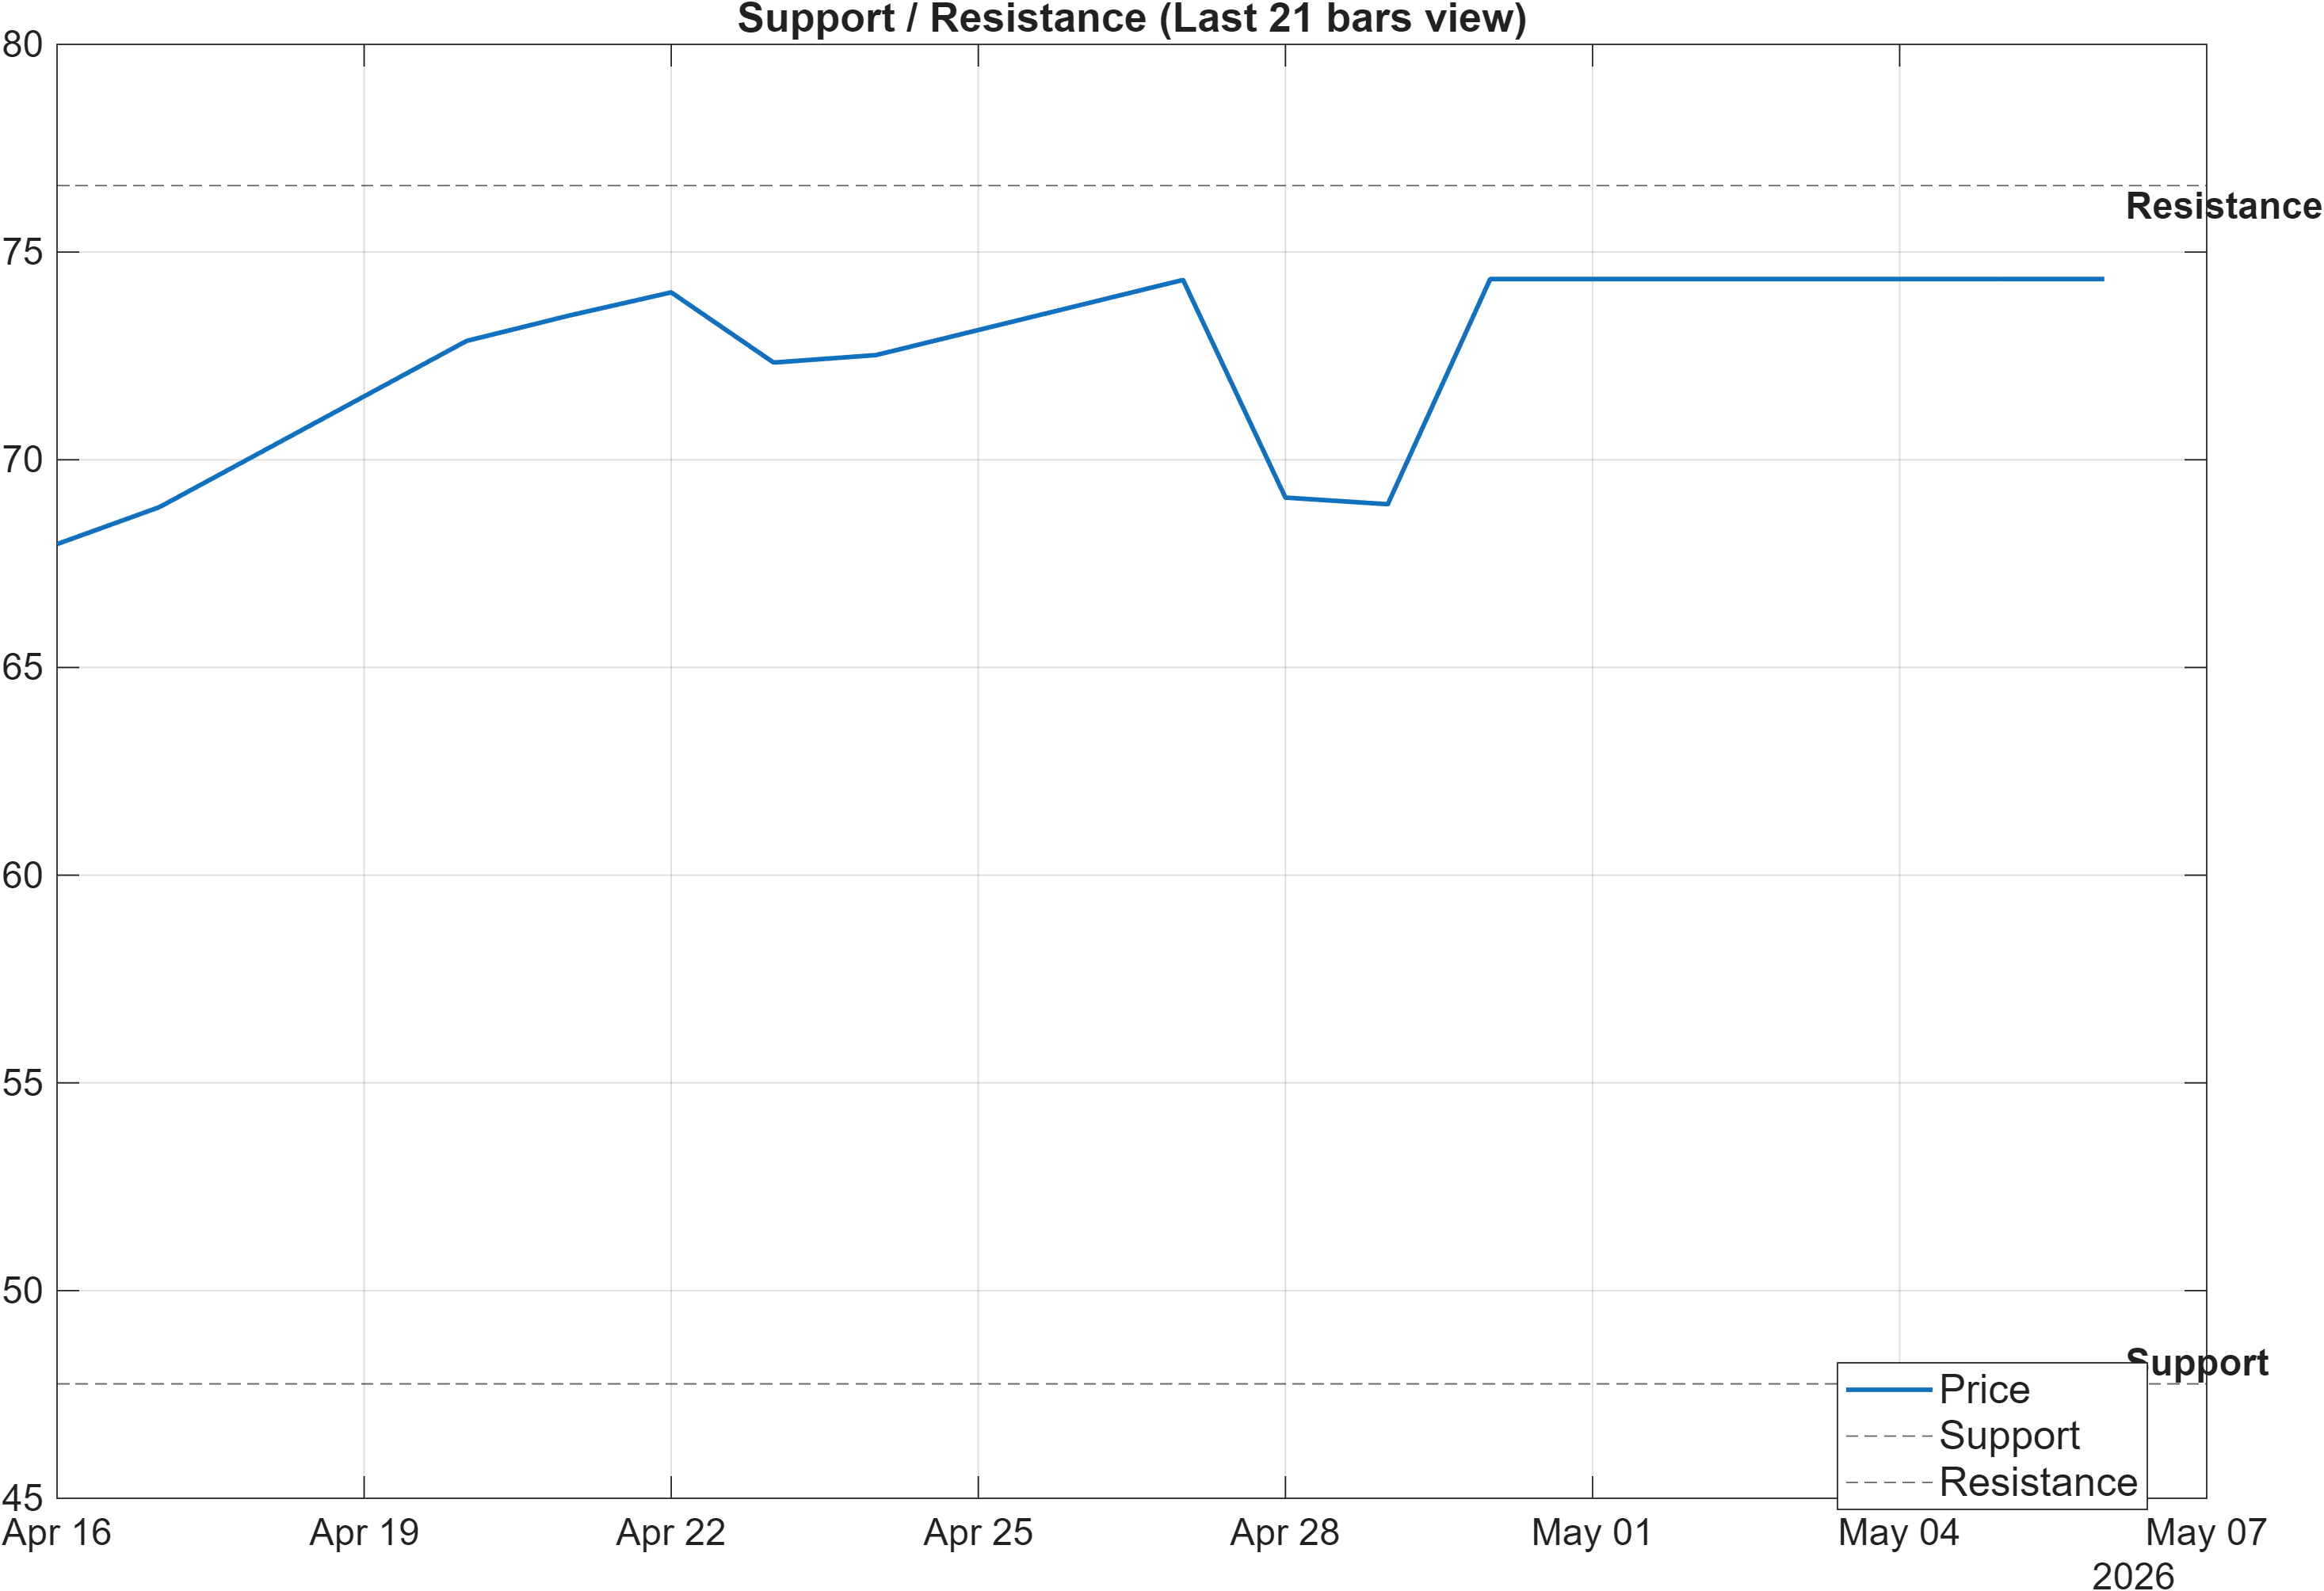
The level map is wide, which is consistent with a market that can alternate between trend-following behavior and mean reversion depending on participation. The lower boundary at 47.7550 functions as the primary invalidation zone in the current framework: a close below support would align with the negative elements already present in momentum (MACD histogram -0.4006) and could pressure the otherwise bullish moving-average setup.
The upper boundary at 76.6000 is the regime confirmation zone. A break above resistance with volume would more cleanly reconcile the constructive trend structure with the currently neutral confluence readings and the mixed horizon ranks (strong daily/weekly vs neutral monthly/3–6 month). Put differently, the resistance level is where the market must demonstrate that short-term strength can convert into more durable positioning.
The support/resistance framework also helps contextualize volatility. With Bandwidth at 0.1092, an eventual transition from moderate volatility to expansion often arrives alongside a decisive level event. Until a level is resolved, the more disciplined stance is to treat moves within the band as testing rather than confirming.
Scenario view: Break above resistance with volume → continuation. Close below support → signal deterioration risk.
5) Quant Technical Dashboard (18 Signals)
KGNAI AI Technical Analysis Score (Deep Reinforcement Learning): Rank #231 out of 1292 (Rank 1 represents the strongest technical positioning and a higher probability of favorable price behavior. As ranks increase toward the maximum, the probability of favorable outcomes weakens and bearish positioning becomes more dominant.) | Label: Bullish | Score: 0.642
18-Signal Technical Confluence Score: 0.111 (Neutral)
Overall Technical Score (18-signal confluence + DRL rank blend): 0.271 (Neutral)
Note: The blended score reflects signal strength weighted against broader AI technical ranking, which may temporarily diverge.
Blended technical score breakdown: 0.271 (Neutral | Bull 8 / Bear 6 / Neutral 4)
The technical stack is best read as model-level bullishness constrained by indicator-level neutrality. The Deep Reinforcement Learning technical rank is #231 (labeled Bullish) with a score of 0.642, placing the instrument in the stronger segment of the cross-sectional technical universe. Yet the 18-signal confluence score is only 0.111 (Neutral), and the blended overall technical score remains 0.271 (Neutral). That spread matters: it indicates the AI rank model is detecting favorable structure relative to peers, while the classical indicator panel is not providing a decisive confirmation.
The breakdown (Bull 8 / Bear 6 / Neutral 4) reinforces the “indecision” label. There are bullish elements tied to momentum and flow—such as ROC(20) at 7.973 and ADOSC at 78.72—but they are offset by bearish components in key areas of incremental impulse and some volume slopes, including the MACD histogram at -0.4006 and OBV slope(10) at -1.648e+06. When both camps are meaningfully represented, directional outcomes typically depend more on level resolution than on attempting to “average” the signals.
Volatility is also part of the confluence story. BB Width at 0.1092 is flagged Bullish in the signal table, but that does not imply an up move; it is more consistent with a regime that can support continuation if price action confirms. In this setup, the support 47.7550 and resistance 76.6000 zones remain the cleanest ways to validate whether the blended neutrality is transitioning into a clearer risk-on or risk-off configuration.
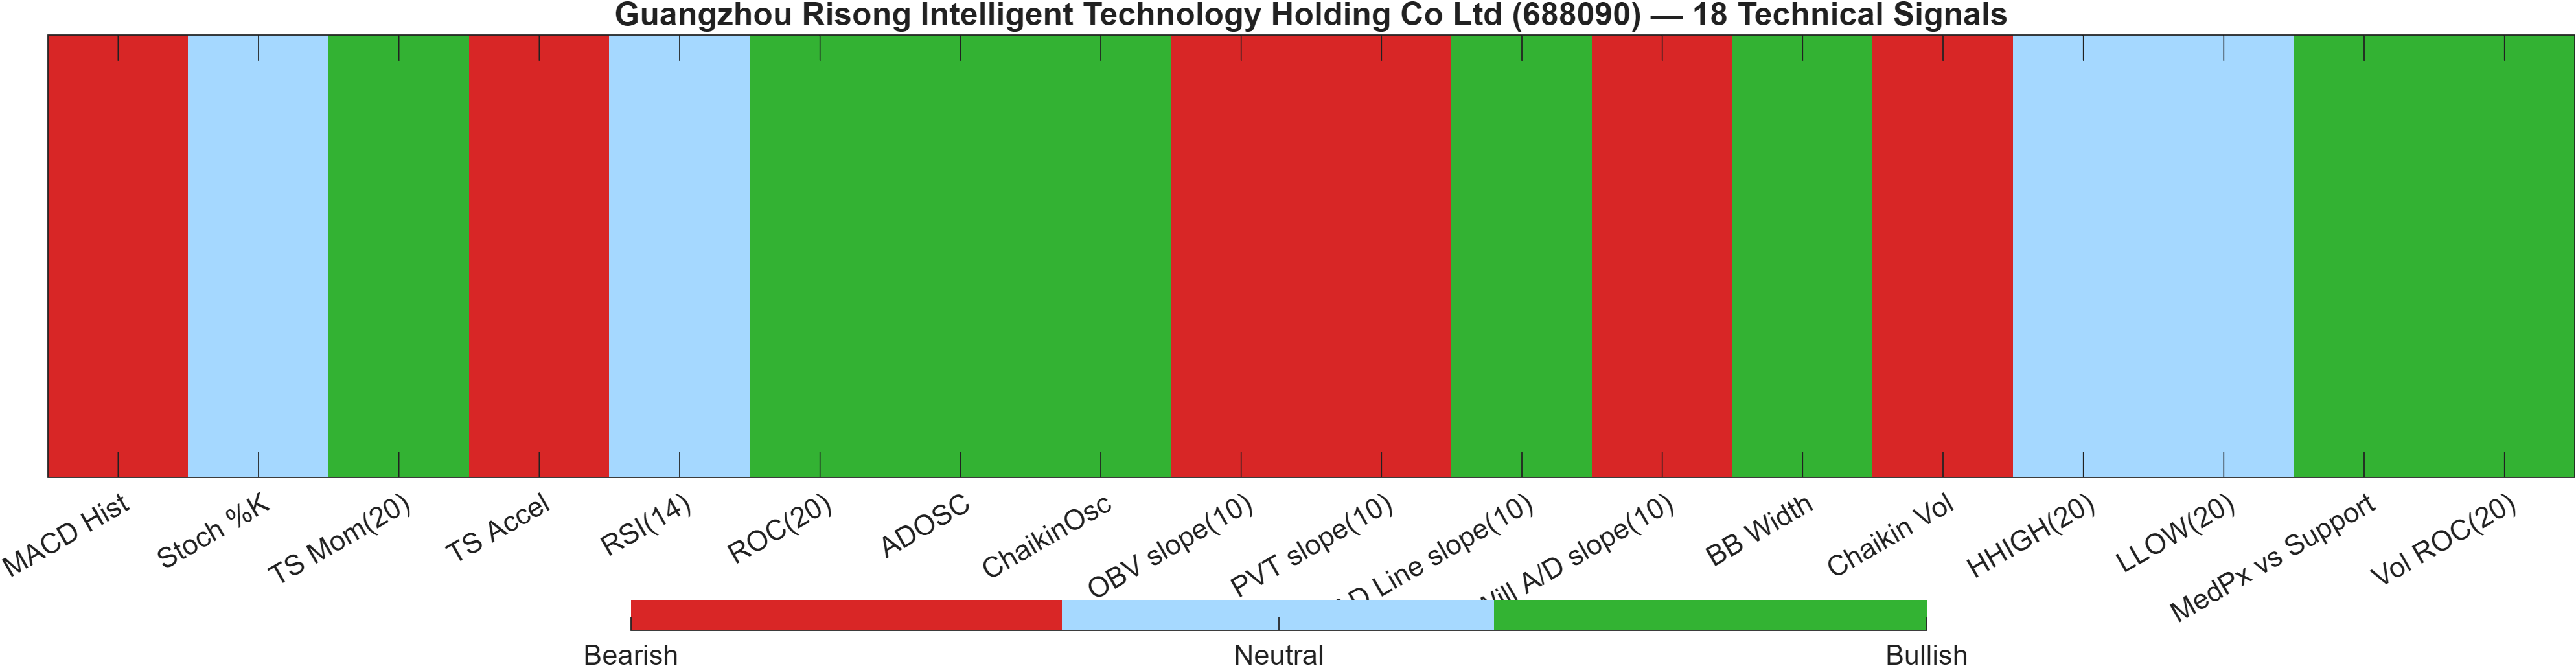
Signal table (Bull/Bear/Neutral)
| Indicator | Value | Signal |
|---|---|---|
| MACD Hist | -0.4006 | Bearish |
| Stoch %K | 71.11 | Neutral |
| TS Mom(20) | 5.49 | Bullish |
| TS Accel | -13.66 | Bearish |
| RSI(14) | 51.1 | Neutral |
| ROC(20) | 7.973 | Bullish |
| ADOSC | 78.72 | Bullish |
| ChaikinOsc | 5.615e+06 | Bullish |
| OBV slope(10) | -1.648e+06 | Bearish |
| PVT slope(10) | -7.66e+04 | Bearish |
| AD Line slope(10) | 1.229e+07 | Bullish |
| Will A/D slope(10) | -1.47 | Bearish |
| BB Width | 0.1092 | Bullish |
| Chaikin Vol | 83.74 | Bearish |
| HHIGH(20) | 76.93 | Neutral |
| LLOW(20) | 66.5 | Neutral |
| MedPx vs Support | 25.05 | Bullish |
| Vol ROC(20) | 65.39 | Bullish |
Interpretation: Indicator-level signals form the base confluence, which is then adjusted using a separate AI-driven technical ranking model. The final technical score summarizes this combined view.
6) News sentiment + extractive gist
Note: Instrument-specific news matches were not found, so the digest includes broader market/sector headlines. Links are provided for verification.
Sentiment score (avg): -0.013 | Positive: 0% | Neutral: 94% | Negative: 6%
KGNAI AI News Sentiment Score (normalized -1 to +1): Not available (as of —) | Label: Not available | Overall news score: -0.01
Positive Developments
Recent coverage across major financial outlets indicates a broadly steady information backdrop with limited asset-specific catalysts. The distribution of sentiment—94% neutral and an average score of -0.013—suggests the tape is being driven more by market mechanics than narrative. In that context, “positive” here should be interpreted as the absence of persistent negative pressure rather than the presence of strong supportive drivers. For 688090, this matters because the technical state is already mixed: short-term ranks are constructive (Daily #83, Weekly #206), while the blended technical score remains 0.271 (Neutral). A neutral-to-slightly constructive news backdrop can allow level-driven price discovery to play out without frequent headline interruption, increasing the importance of observing the defined decision zones at 47.7550 and 76.6000.
Neutral / Mixed Developments
The news digest is primarily macro and cross-market in nature, which aligns with the report note that instrument-specific matches were not found. As a result, sentiment should be treated as contextual rather than explanatory for any single-day move in 688090. The overall news score is -0.01 and the platform’s normalized news sentiment score is Not available in the provided data, limiting precision in cross-asset comparability on this dimension. With volatility in a moderate regime (Bandwidth 0.1092) and RSI holding Neutral at 51.1, a mixed news backdrop is consistent with a market that can oscillate until a technical trigger (such as a resistance break) establishes a clearer directional regime.
Negative / Risk Signals
Risk signals in the digest are better read as headline risk potential than as issuer-specific deterioration. The sentiment split still includes 6% negative items, and the average score remains slightly below zero (-0.013), which can be enough to keep marginal demand cautious when the technical picture is not fully aligned. This is relevant because momentum already shows friction via a MACD histogram of -0.4006, and several participation measures in the signal table are bearish (e.g., OBV slope(10) -1.648e+06). If negative macro headlines coincide with a technical failure at support (47.7550), the combined effect would be a more coherent deterioration signal than either component alone.
- Whether sentiment remains overwhelmingly neutral (near 94%) or shifts toward a higher negative share.
- Any reappearance of instrument-specific coverage (currently not found per the provided data).
- Whether volatility changes materially from 0.1092 alongside a level break at 76.6000 or 47.7550.
Sources referenced: Reuters, Bloomberg, Yahoo Finance, MarketWatch, Investing.com
7) Sources
Not available in the provided data.
You may also like: How KGNAI AI ranks instruments across global markets
Disclaimer: KGNAI provides AI-generated analytics and educational market commentary only. This is not financial advice. Markets involve risk. Always do your own research.