
Keboda Technology Co Ltd (603786) — 10-May-2026 Technical Confluence Bullish, Ranks Mixed
Keboda Technology Co Ltd (603786) enters 10-May-2026 with a notably asymmetric profile across horizons: the monthly rank is #3 (top decile), while the daily rank is #751 (lower half), implying that near-term noise may be masking a stronger medium-horizon structure. The technical layer is more constructive than the short-term rank suggests: the 18-signal confluence is 0.556 (Bullish) and the overall blended technical score is 0.565 (Bullish), supported by a positive MACD histogram (0.4390) and a bullish RSI bias. Volatility is not extreme, with Bollinger bandwidth at 0.1111, framing the current regime as neither compressed nor fully expanded. Key decision zones remain clearly defined at support ~52.4838 and resistance ~59.1250. News sentiment is broadly neutral (avg 0.013; 94% neutral), providing limited directional bias.
- Rank stance: Short-term Neutral (daily #751); Mid-term Bullish (weekly #165; monthly #3; 3-month #22); Long-term Neutral (6-month #456) with a supportive yearly (#215).
- Technical confluence: Bullish (18-signal 0.556; blended 0.565) despite a neutral DRL technical rank (#266).
- Key levels: Support 52.4838 and resistance 59.1250 remain the primary decision zones.
- News sentiment bias: Neutral (avg 0.013; 94% neutral; 0% negative).
- Confirmation / invalidation: A break above 59.1250 with volume favors continuation conditions; a close below 52.4838 increases deterioration risk per the scenario framework.
What KGNAI Measures
KGNAI evaluates assets using large cross-sectional datasets built from millions of structured data points. Inputs incorporate fundamental metrics, technical structures, and systematically processed news sentiment. Statistical models, machine learning, and AI frameworks are used to assess relative positioning, signal alignment, and probabilistic behavior across broad universes.
How to Read This Report
- Ranks are comparative across the tracked universe, not absolute price targets.
- Confluence reflects alignment among independent signal groups.
- Support/resistance levels are probabilistic decision zones, not guarantees.
- Sentiment provides contextual bias within the broader analytical framework.
1) KGNAI AI Analysis
Region: CHINA
Total universe size: 1292 ranked instruments
- Daily rank: #751 out of 1292 — Neutral
- Weekly rank: #165 out of 1292 — Bullish
- Monthly rank: #3 out of 1292 — Bullish
- 3-Monthly rank: #22 out of 1292 — Bullish
- 6-Monthly rank: #456 out of 1292 — Neutral
- Yearly rank: #215 out of 1292 — Bullish
The rank curve is best read as time-horizon divergence. The short-term read is neutral (daily #751), but the mid-term block is consistently strong: monthly #3 and 3-month #22 sit firmly in the top tier of the 1292-instrument universe. That pattern typically reflects a market that has already established a constructive structure, even if near-term conditions are choppy enough to push the daily comparator toward the middle.
A second feature is non-linearity across horizons. The 6-month rank (#456) returns to neutral territory while the yearly rank (#215) is bullish, suggesting the longer window is supportive but not uniformly reinforced across intermediate regimes. In practical portfolio terms, this is the kind of profile where timing risk (entry/scale discipline) matters more than the directional thesis implied by the monthly rank alone.
The report’s own term summary captures that balance: Short-term Neutral, Mid-term Bullish, Long-term Neutral. Given the unusually strong monthly comparator (#3), a key analytical question is whether short-term ranking weakness is merely a consolidation phase or a genuine deterioration signal. The later technical sections (RSI/MACD, bandwidth, and the 18-signal blend) become particularly important to distinguish consolidation from breakdown risk without relying on any single indicator.
2) Price & trend overview
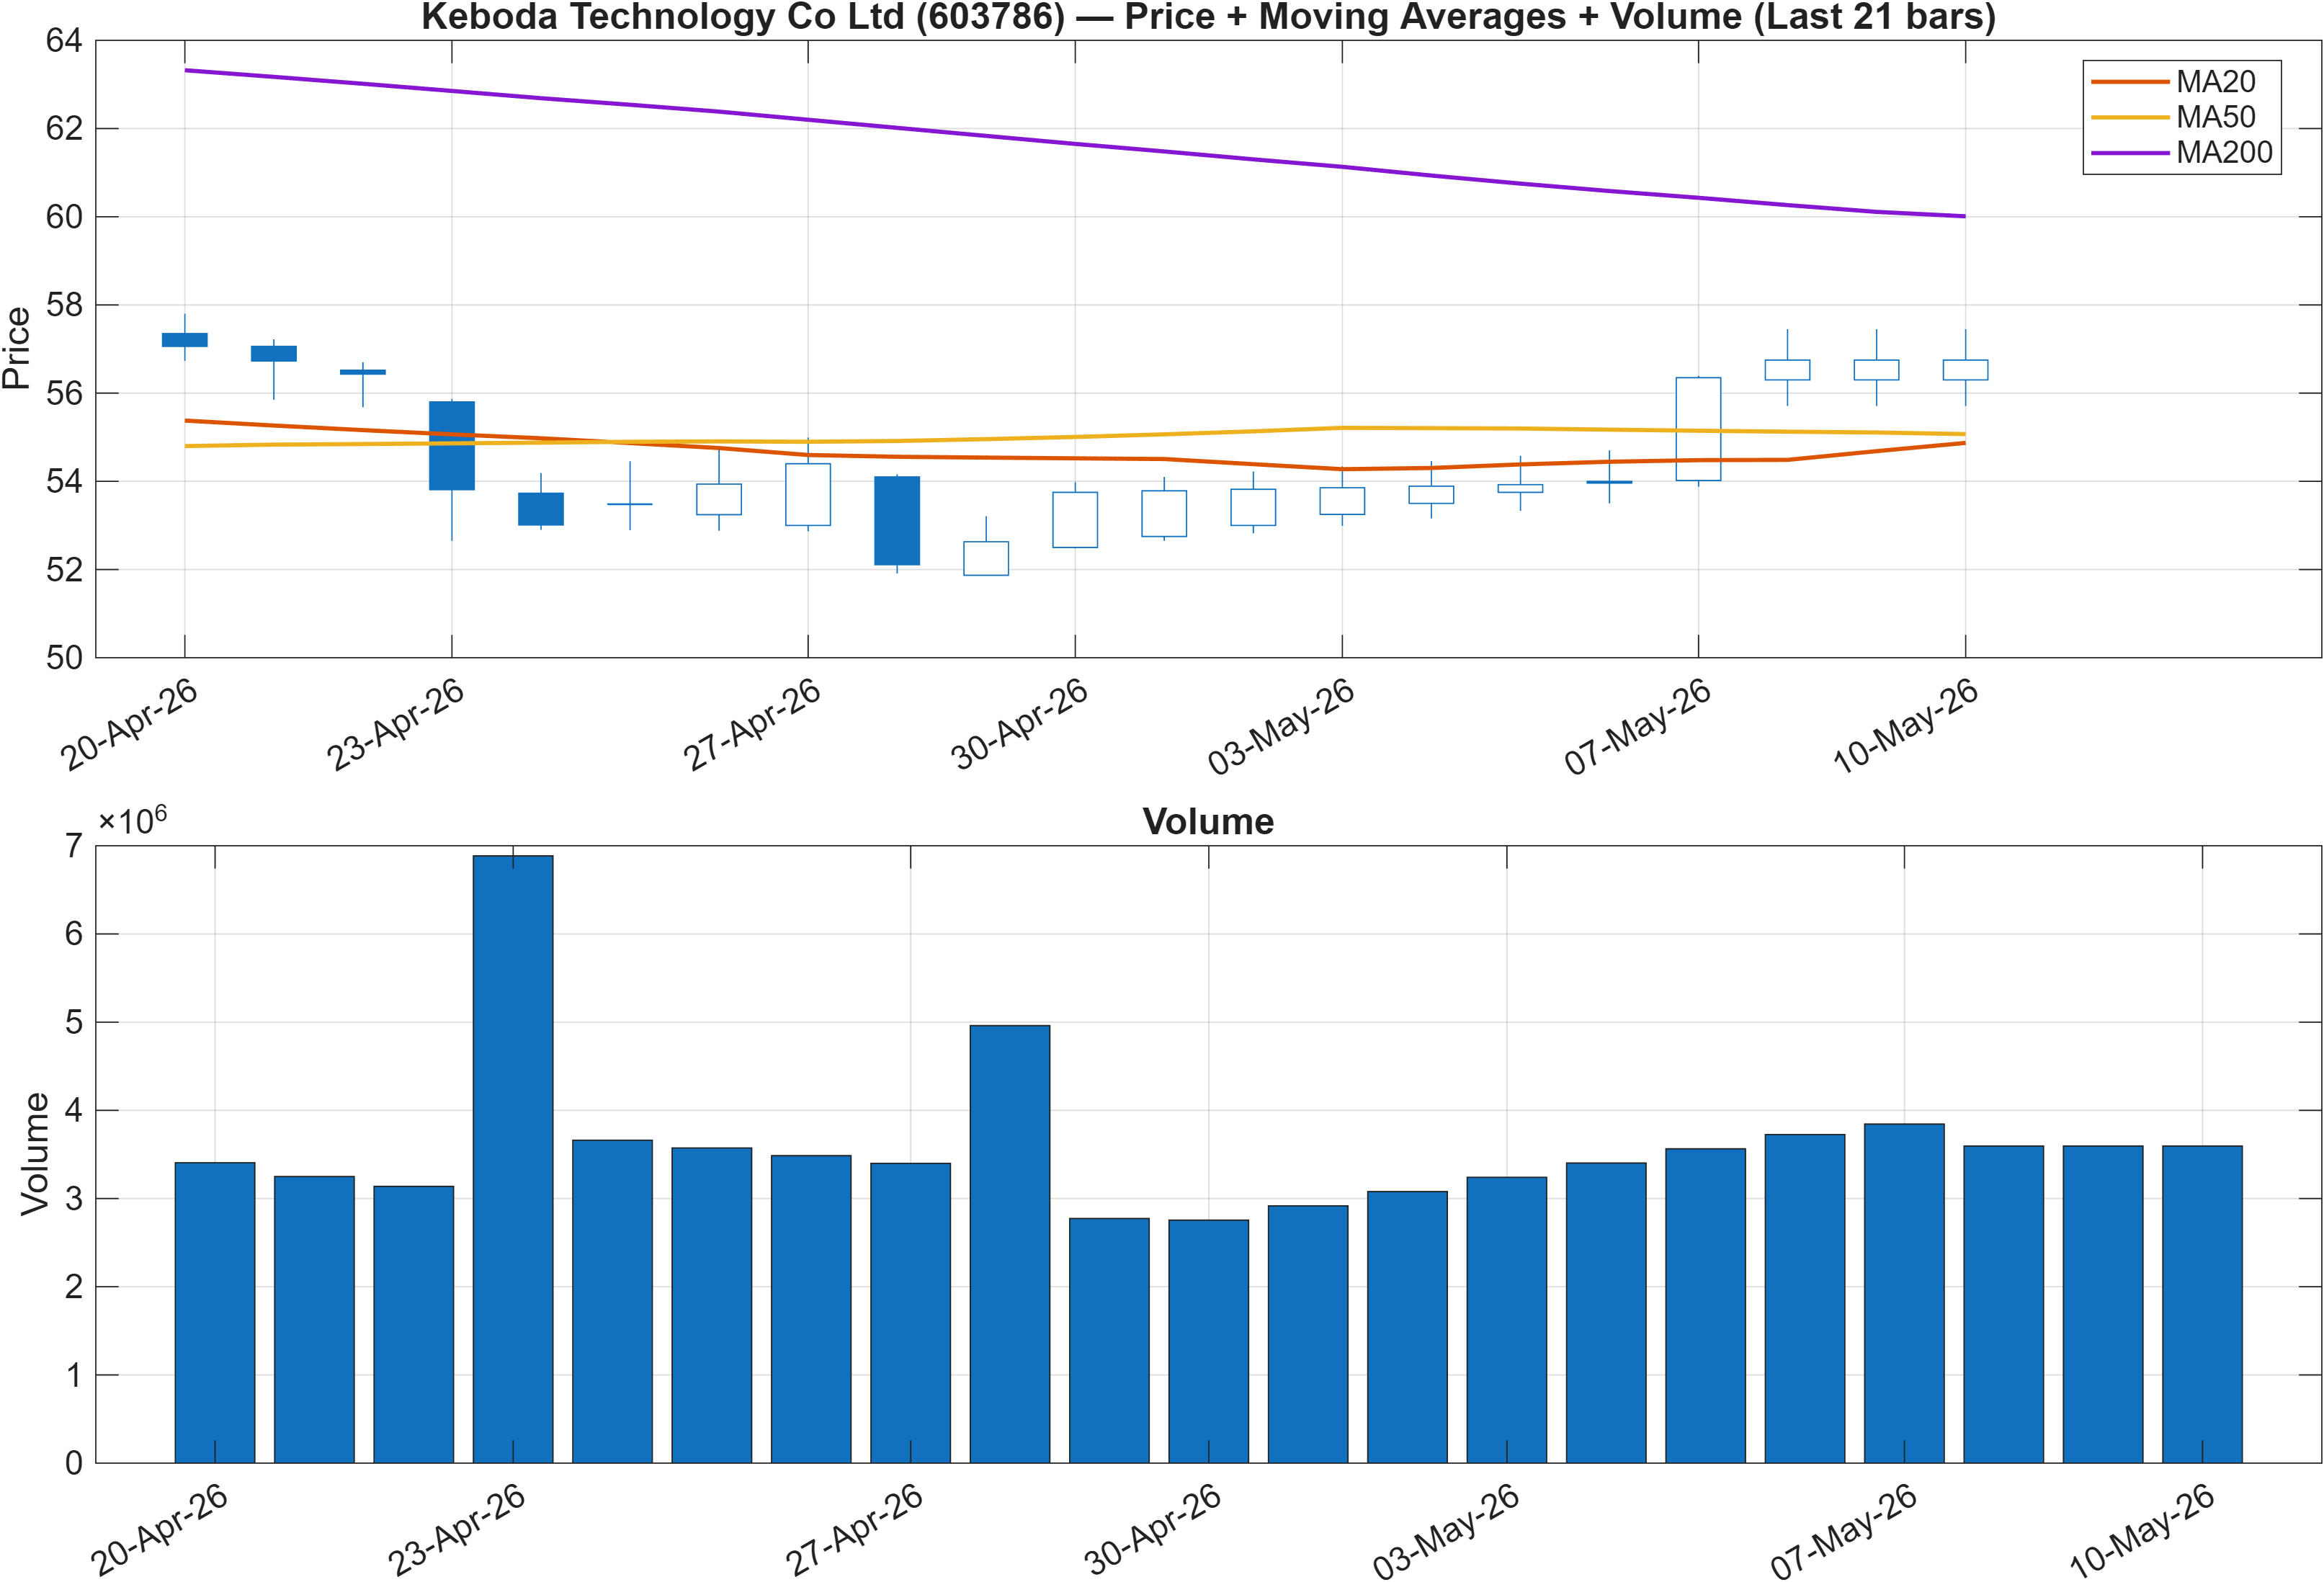
Interpretation: Close vs MA50 = Bullish, MA50 vs MA200 = Bearish.
Trend alignment vs regime friction
The moving-average interpretation points to a mixed trend regime: price is positioned bullishly versus the MA50, while the MA50 remains bearish versus the MA200. This is a classic configuration where the market can still be “working off” a prior downtrend even as the nearer-term trend improves. In that context, the strong mid-horizon ranks (monthly #3; 3-month #22) are consistent with a recovery phase, but they do not remove the structural friction implied by the longer moving-average relationship.
When ranks and trend structure diverge like this, the practical read is to focus on trend persistence signals rather than impulse. A bullish close vs MA50 provides local support for the medium-term bullishness, but the bearish MA50 vs MA200 warns that the longer-cycle trend may not be fully repaired. That helps reconcile why the 6-month rank is only neutral (#456) even as the yearly rank remains bullish (#215).
The key levels from the market structure section also fit this framework. With support at 52.4838 and resistance at 59.1250, the current price-trend state can be viewed as a market attempting to extend constructive behavior within a still-recovering long-cycle backdrop. A failure that pressures the support zone would better align with the bearish MA50–MA200 relationship; sustained trade that challenges the resistance zone would better align with the bullish mid-term ranking cluster.
3) Momentum & volatility dashboard
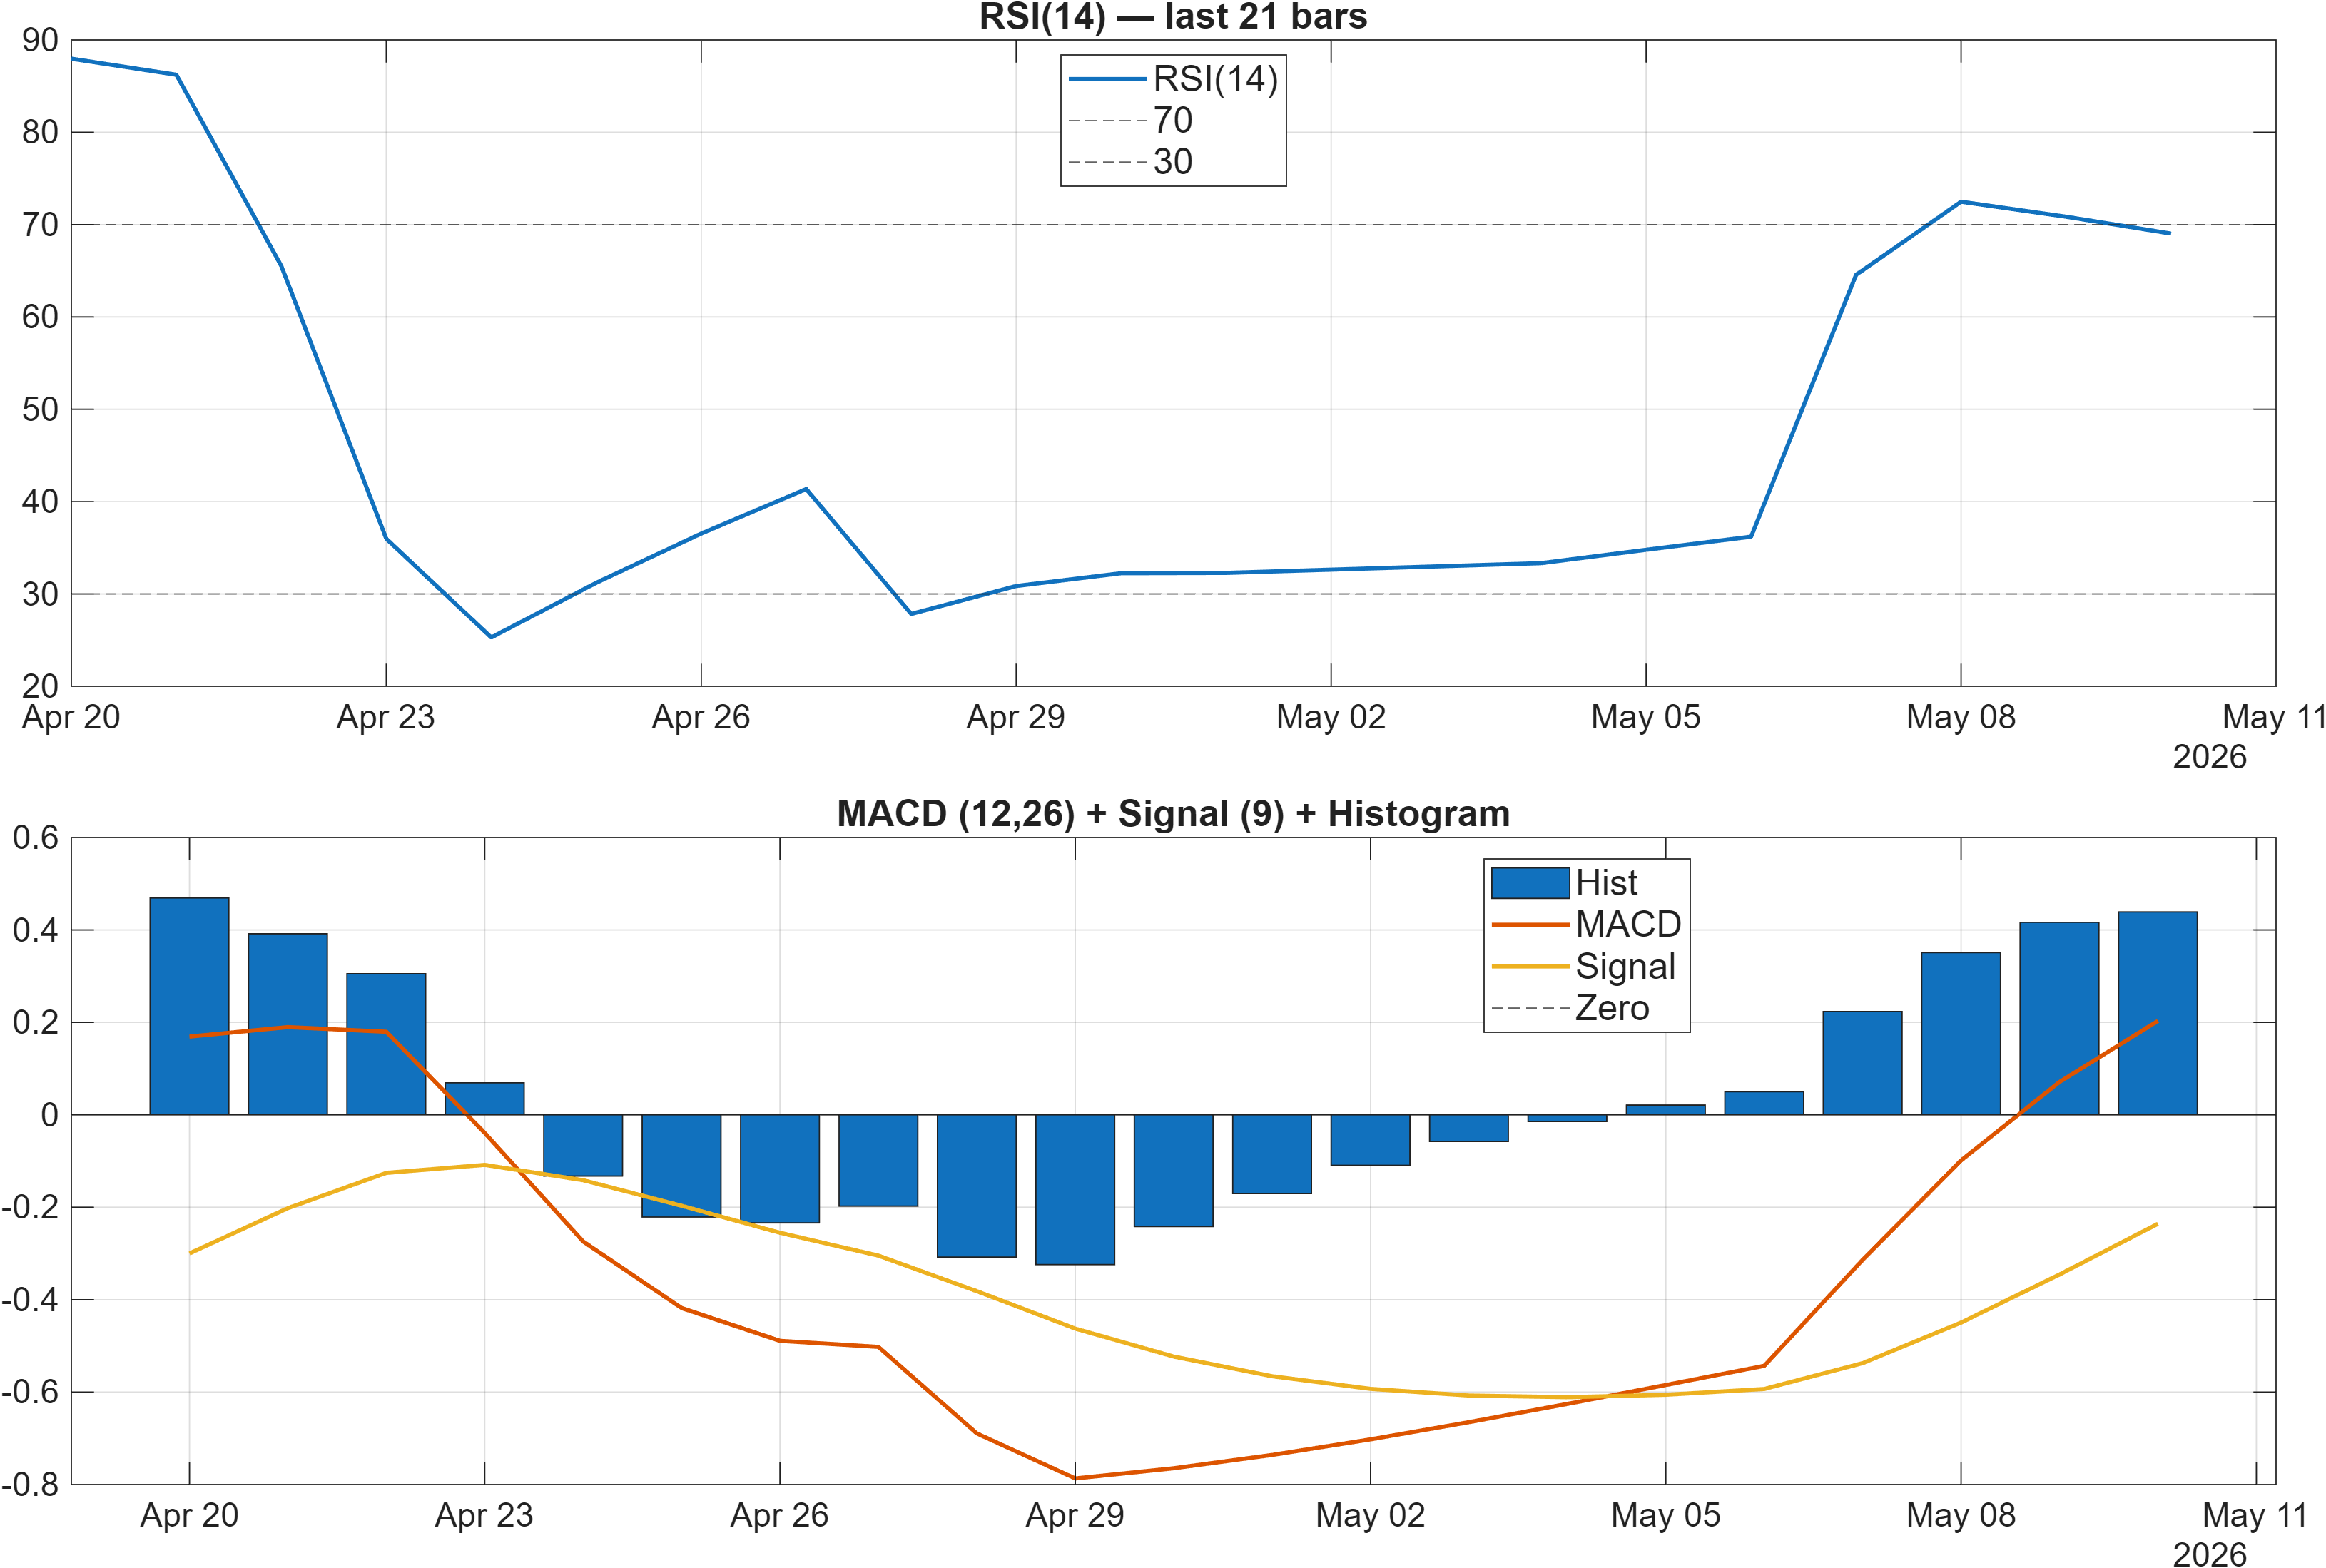
Interpretation: RSI bias = Bullish, MACD hist = 0.4390.
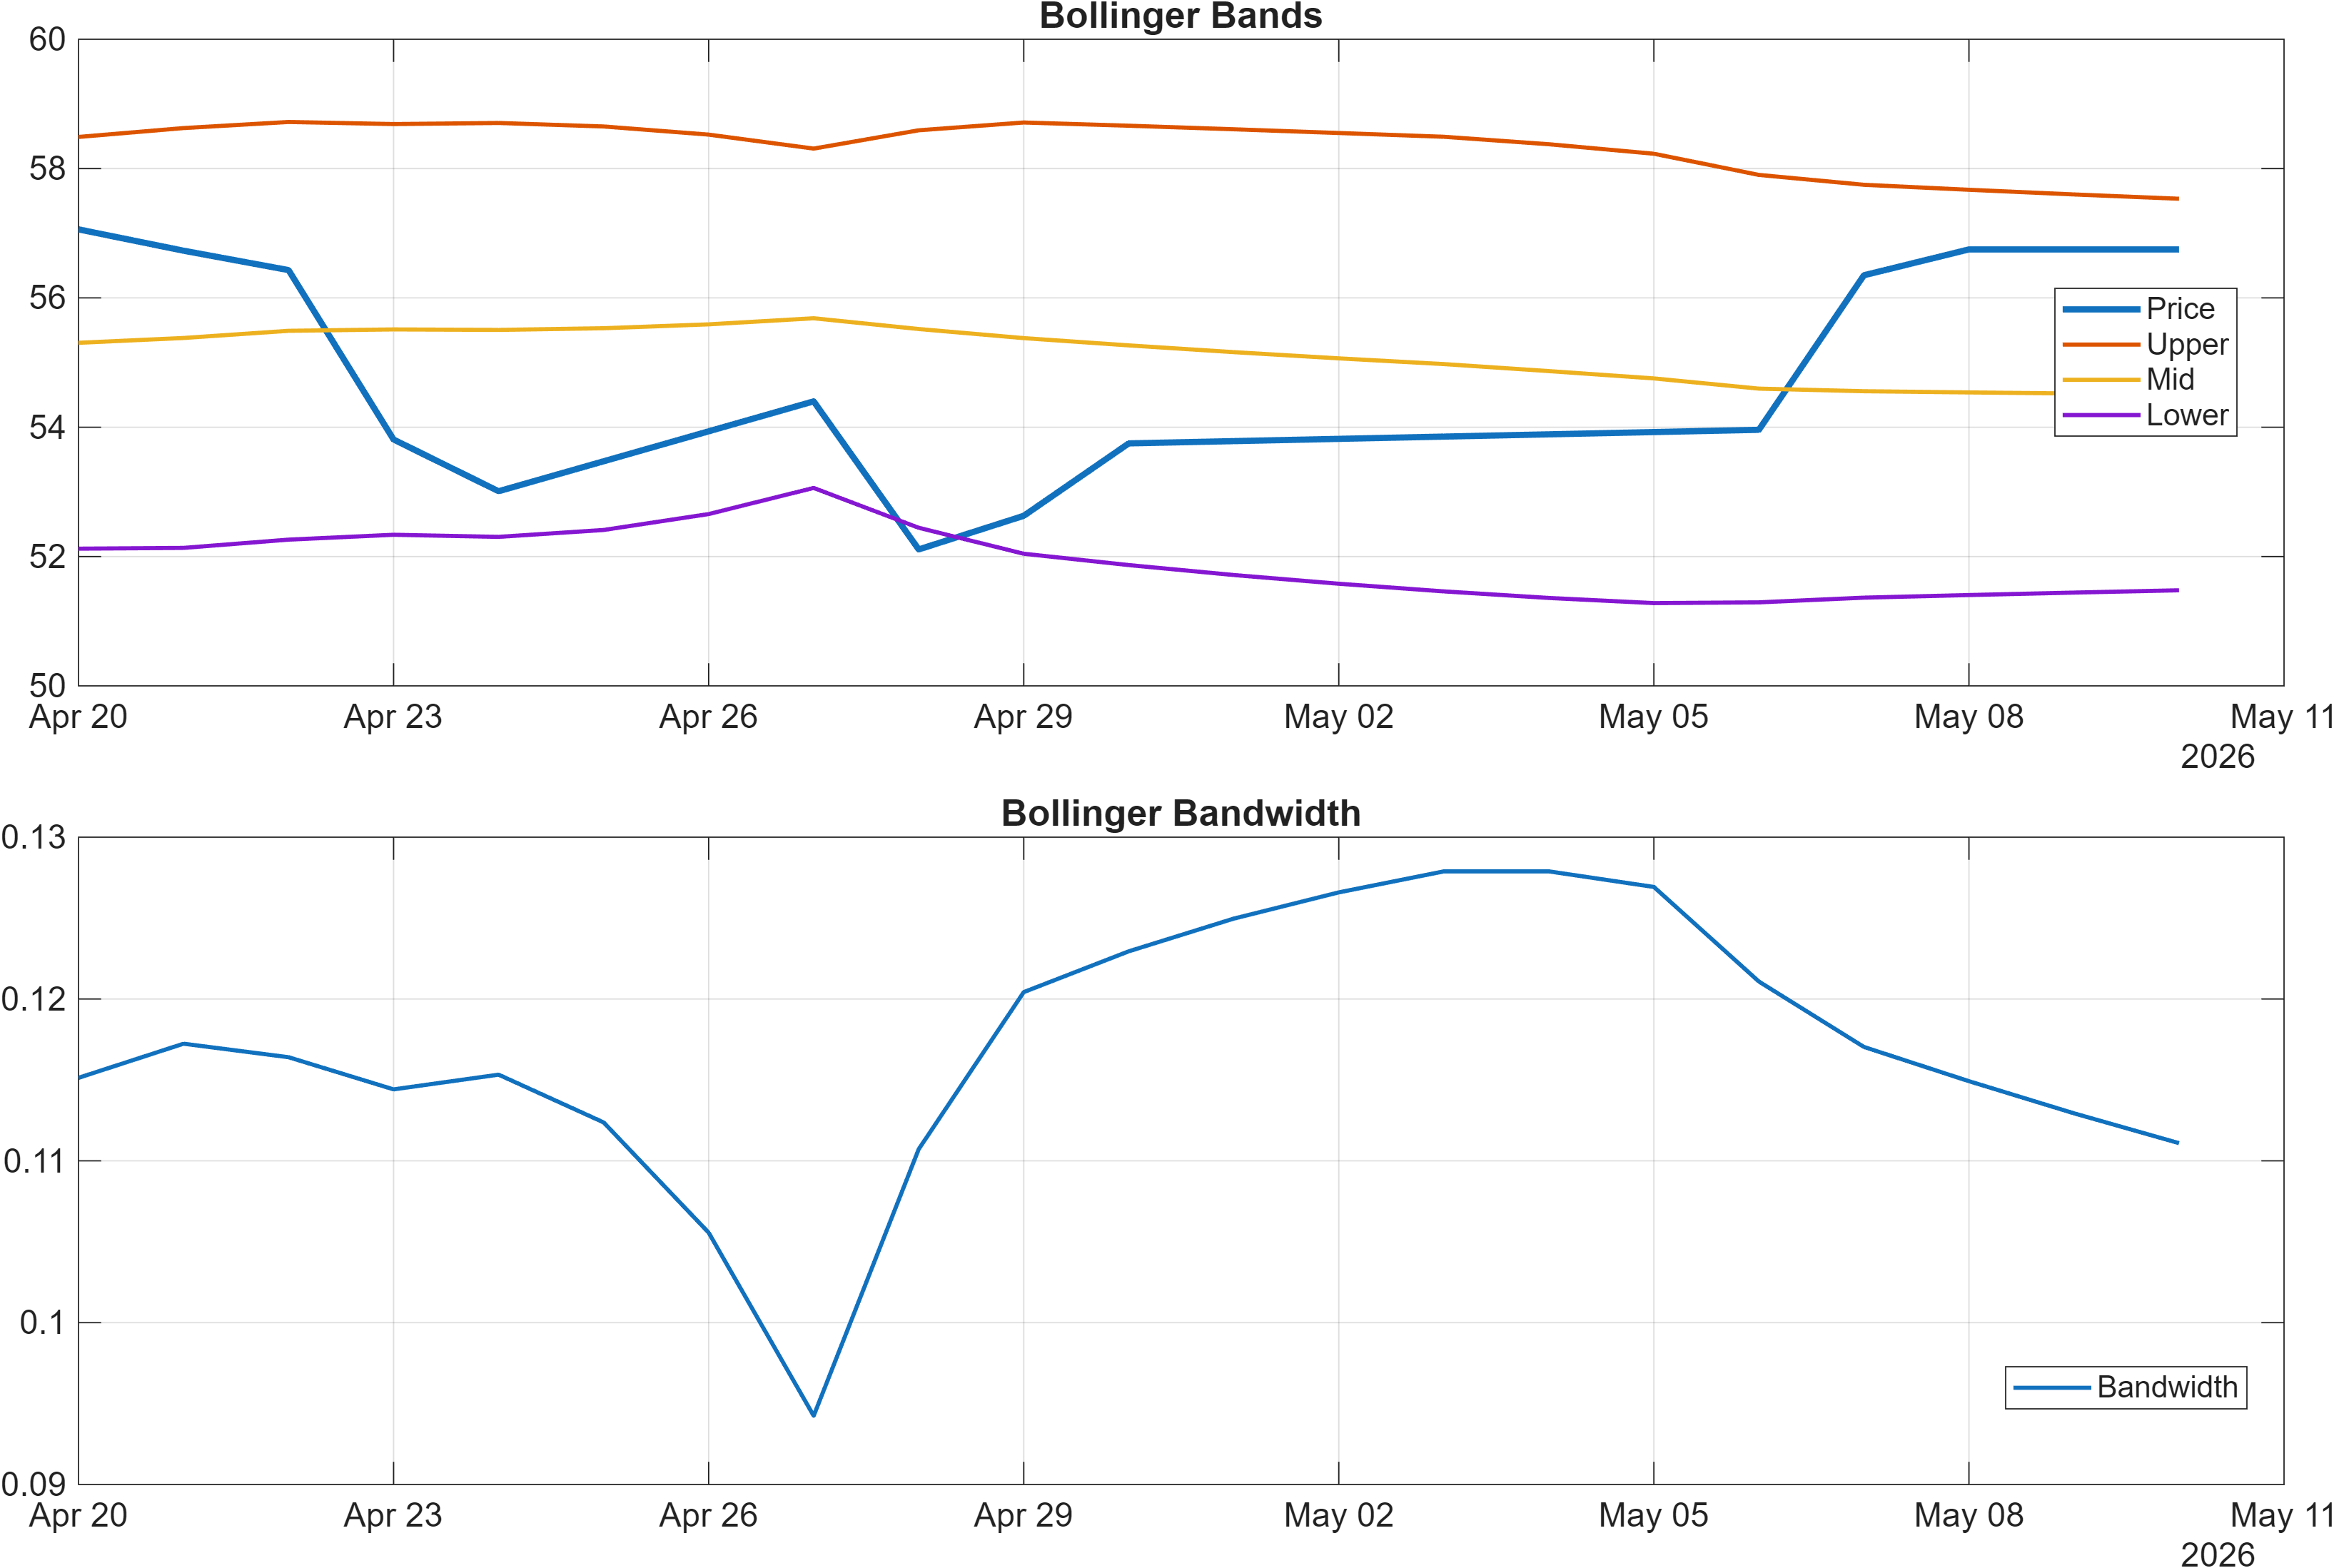
Interpretation: Bandwidth (volatility regime) latest = 0.1111.
Momentum strength with selective exhaustion risk
Momentum is broadly supportive. The RSI bias is flagged bullish, and the MACD histogram is positive at 0.4390, a combination that typically aligns with ongoing upside pressure rather than a purely mean-reverting bounce. This also coheres with the mid-term ranking strength (weekly #165; monthly #3), which tends to reward consistent momentum more than single-session acceleration.
The volatility regime provides an important qualifier. Bollinger bandwidth at 0.1111 does not signal an extreme compression. That matters because breakouts from highly compressed bandwidth can drive abrupt expansion; here, the configuration instead suggests a market that may be trending without being forced into a volatility “release valve” event. In other words, continuation—if it occurs—may be more dependent on follow-through and volume confirmation than on volatility mechanics alone.
Still, the dashboard is not one-way. RSI being bullish alongside a positive MACD can coexist with short-horizon churn—consistent with the daily rank sitting at #751. That combination often shows up when momentum remains intact but becomes more sensitive to pullbacks and failed pushes near resistance. In that setting, the resistance level at 59.1250 becomes the natural area where momentum either converts into trend extension or begins to show fatigue. Conversely, a sustained deterioration that takes price toward 52.4838 would be a clear test of whether the bullish momentum read was merely late-cycle.
4) Support / Resistance zones
Support ~ 52.4838 | Resistance ~ 59.1250
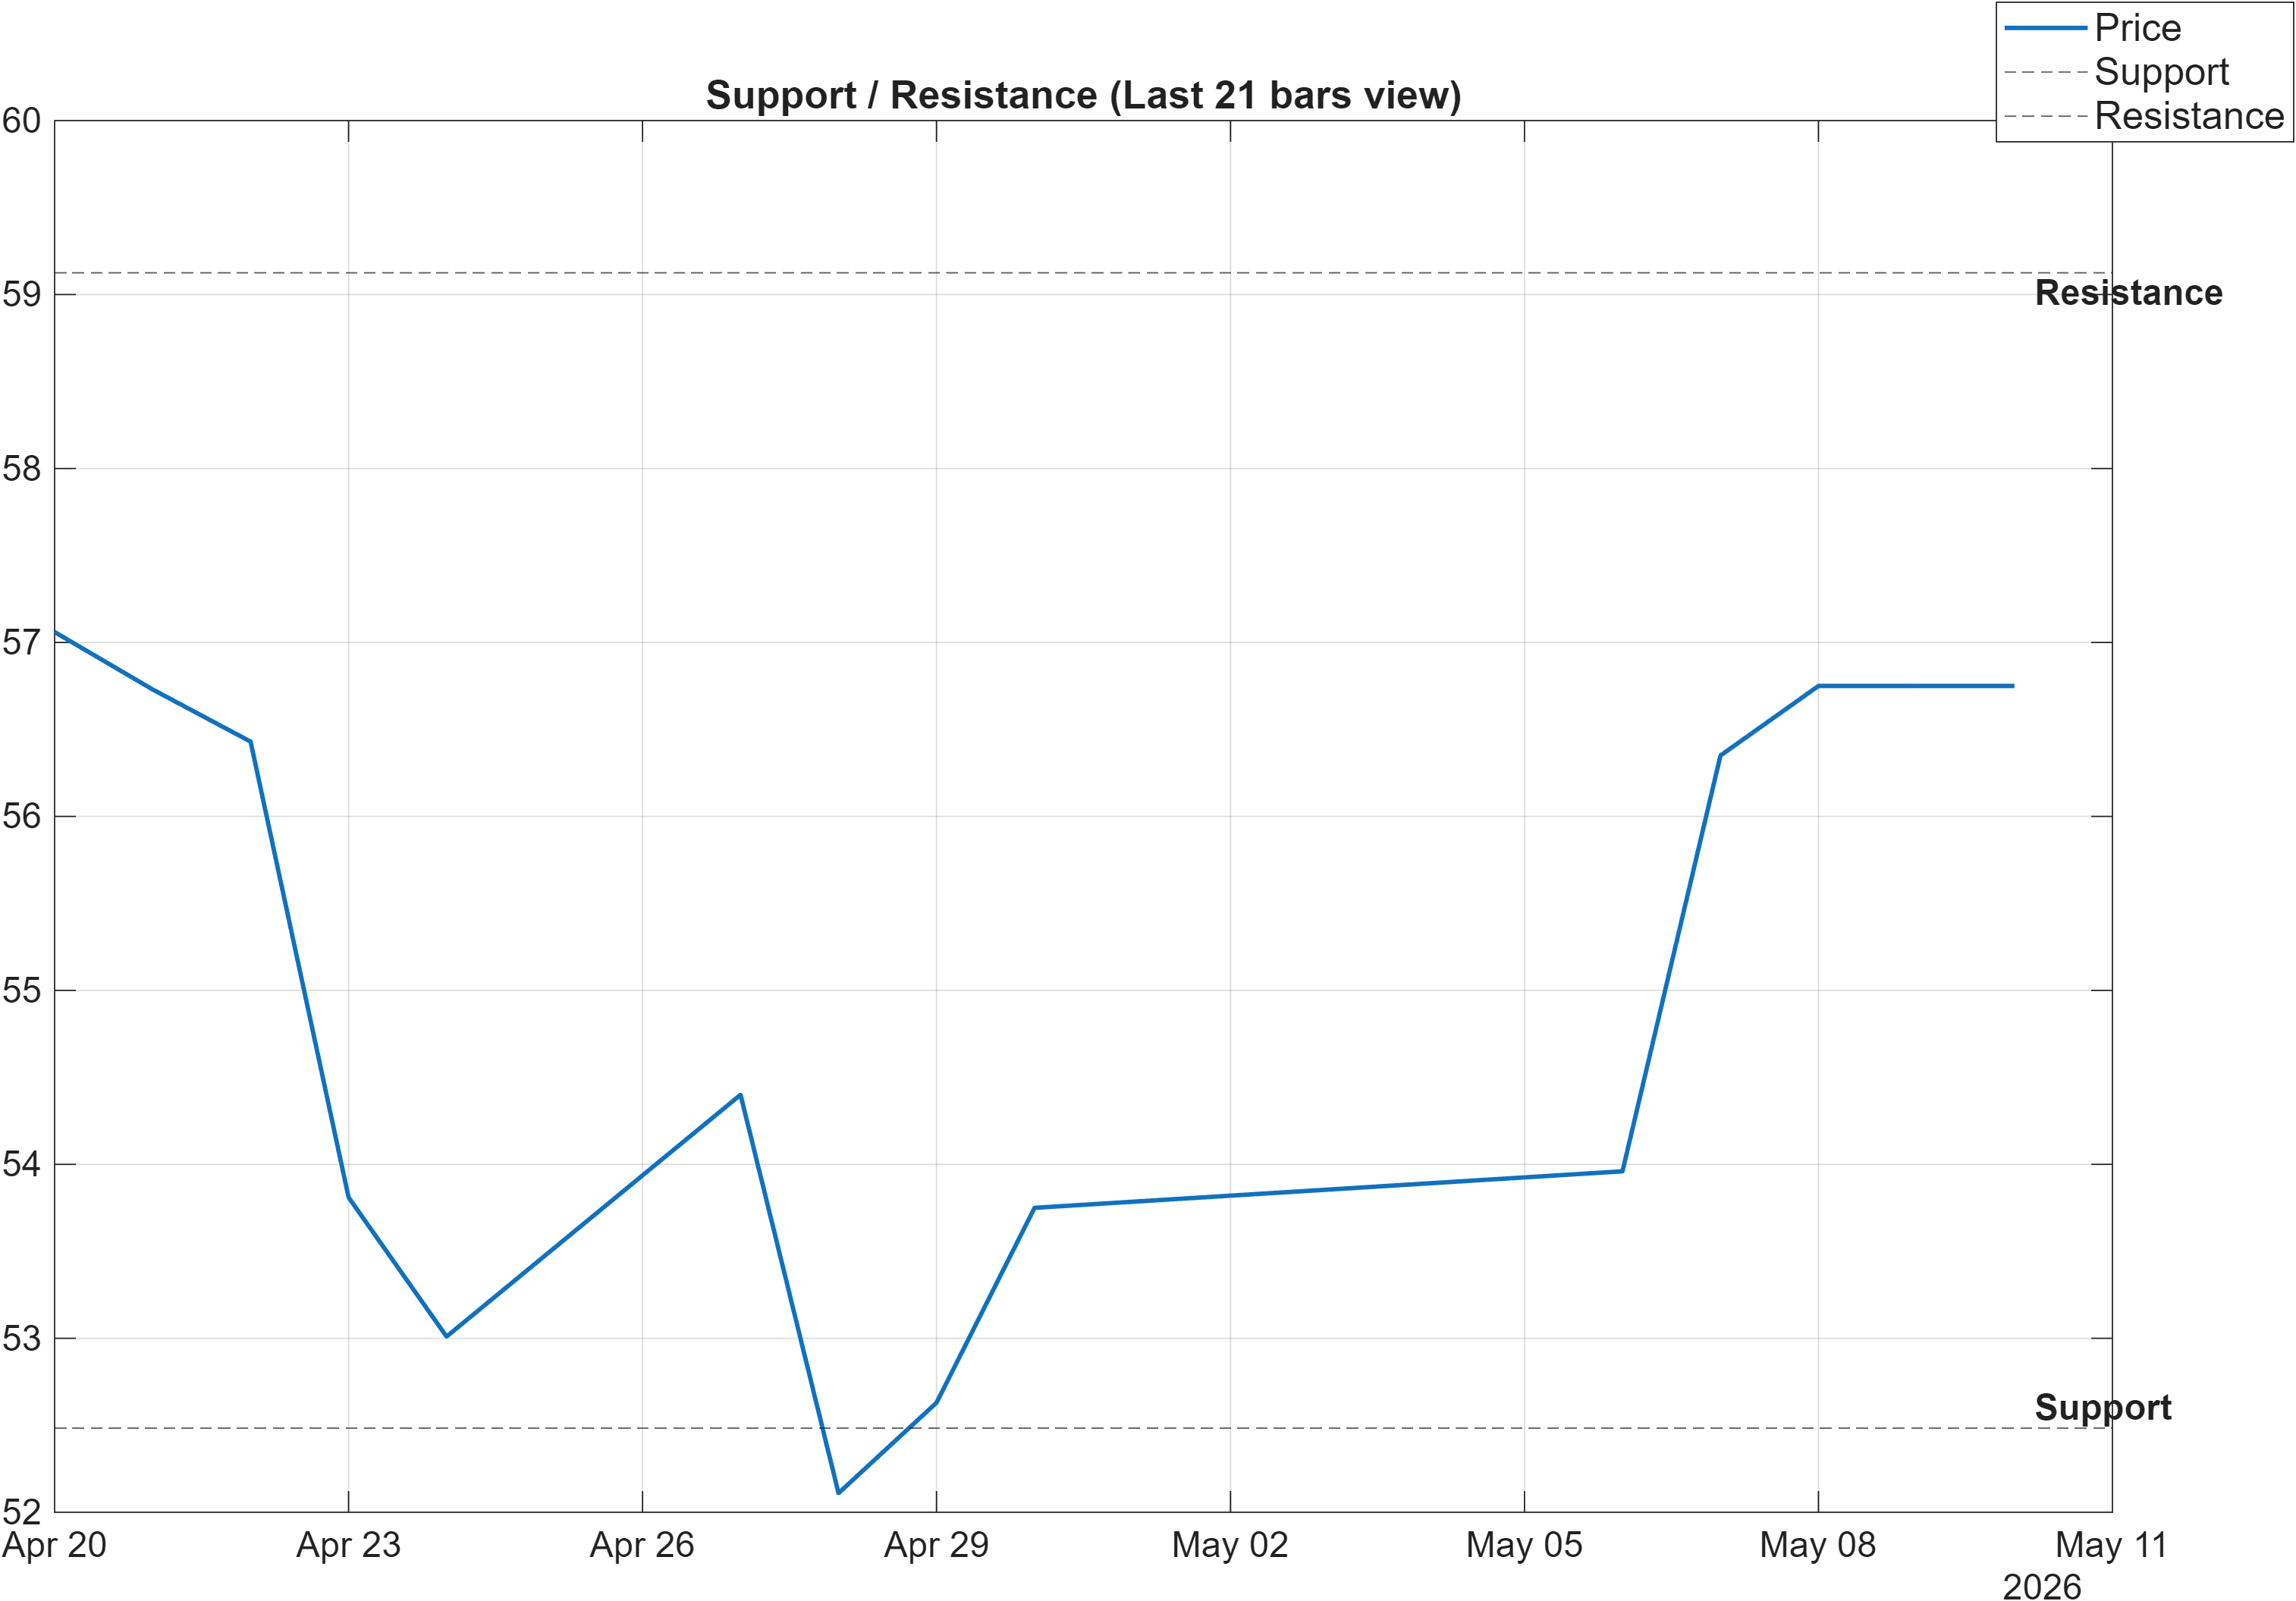
Scenario view: Break above resistance with volume → continuation. Close below support → signal deterioration risk.
Decision zones as validation gates for the mixed rank stack
With the rank structure split between very strong mid-term (monthly #3; 3-month #22) and neutral short-term (daily #751), the most robust way to interpret levels is as validation gates rather than targets. The resistance zone at 59.1250 is the market’s primary “proof point” for whether the bullish confluence can translate into sustained continuation. The framework explicitly conditions that read on volume, which is consistent with avoiding false breakouts in mixed-regime environments.
The support zone at 52.4838 carries more than a simple downside reference. A close below support would not only weaken the price structure, it would also create tighter alignment between the neutral daily rank and the more cautious elements elsewhere (for example, the bearish MA50 vs MA200 read). In that sense, 52.4838 serves as an operational boundary where medium-term strength must prove it can absorb near-term volatility.
The volatility context also matters here. With Bollinger bandwidth at 0.1111, the market is not in an extreme squeeze, so a move through either level is less likely to be “forced” by volatility release alone. That increases the importance of confirmation: a break above 59.1250 that fails quickly can be more informative than the break itself, while a controlled defense above 52.4838 can preserve the bullish mid-term ranking signal even if daily metrics remain indecisive.
5) Quant Technical Dashboard (18 Signals)
KGNAI AI Technical Analysis Score (Deep Reinforcement Learning): Rank #266 out of 1292 (Rank 1 represents the strongest technical positioning and a higher probability of favorable price behavior. As ranks increase toward the maximum, the probability of favorable outcomes weakens and bearish positioning becomes more dominant.) | Label: Neutral | Score: 0.588
18-Signal Technical Confluence Score: 0.556 (Bullish)
Overall Technical Score (18-signal confluence + DRL rank blend): 0.565 (Bullish)
Note: The blended score reflects signal strength weighted against broader AI technical ranking, which may temporarily diverge.
Blended technical score breakdown: 0.565 (Bullish | Bull 13 / Bear 3 / Neutral 2)
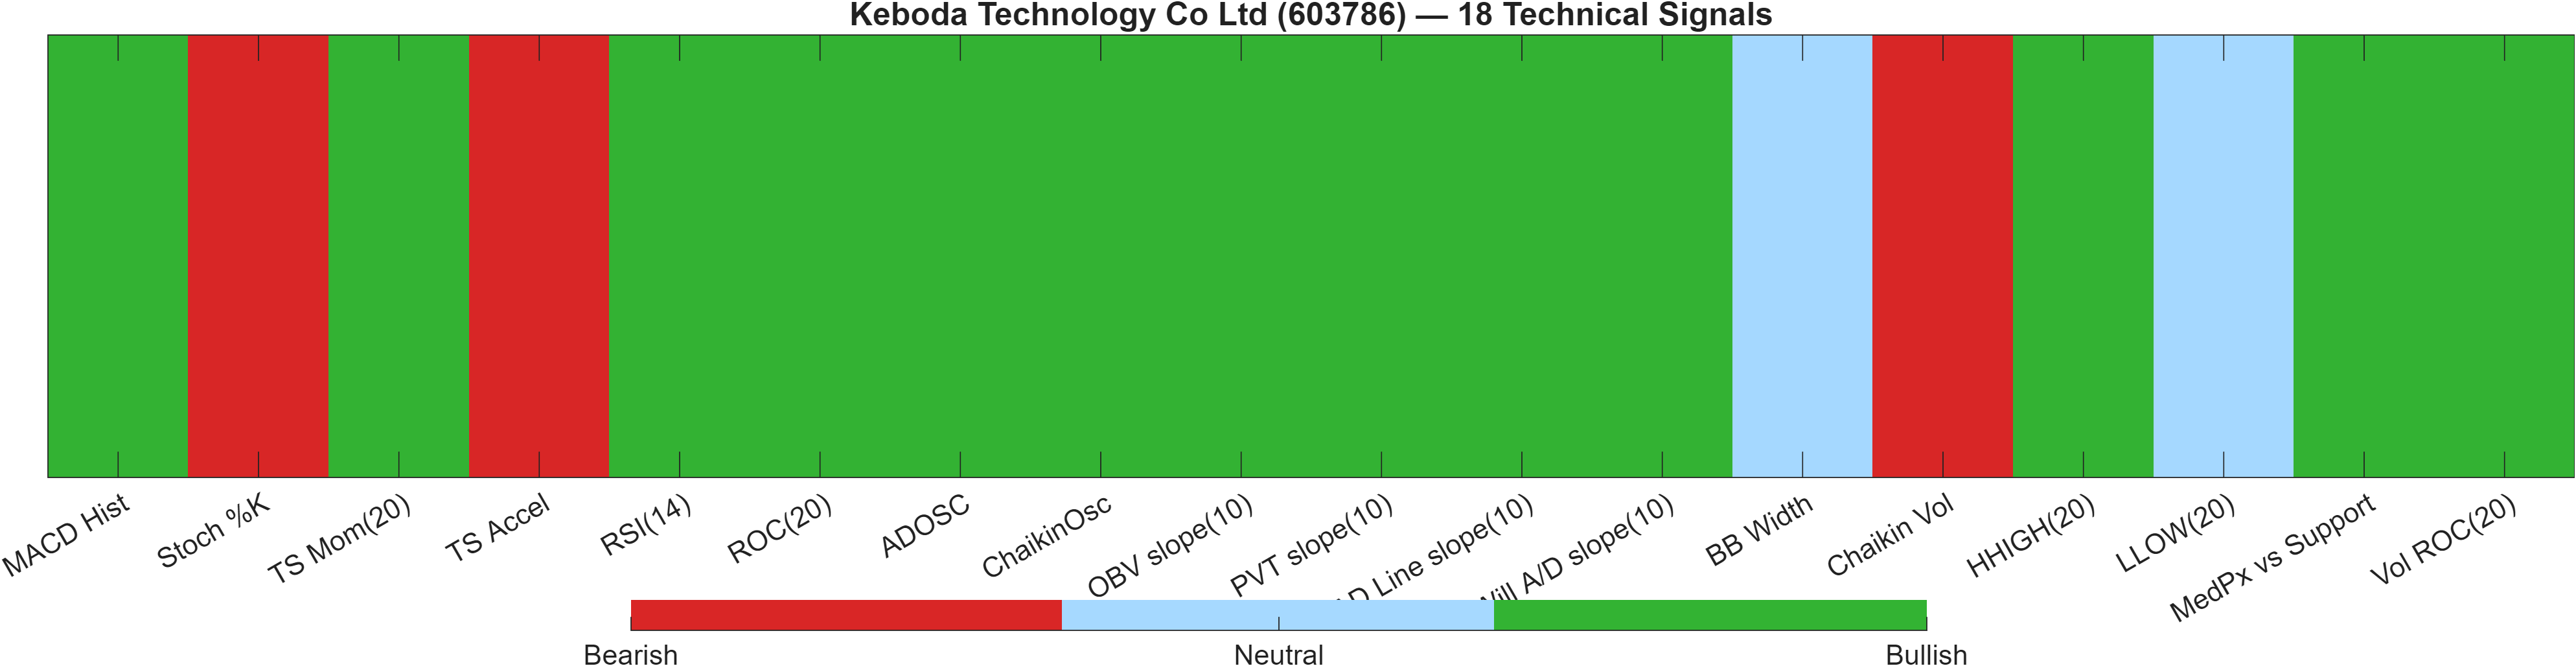
Signal table (Bull/Bear/Neutral)
| Indicator | Value | Signal |
|---|---|---|
| MACD Hist | 0.439 | Bullish |
| Stoch %K | 85.42 | Bearish |
| TS Mom(20) | 0.02 | Bullish |
| TS Accel | -2.5 | Bearish |
| RSI(14) | 69.03 | Bullish |
| ROC(20) | 0.03525 | Bullish |
| ADOSC | 62.93 | Bullish |
| ChaikinOsc | 2.48e+06 | Bullish |
| OBV slope(10) | 2.737e+07 | Bullish |
| PVT slope(10) | 2.088e+05 | Bullish |
| AD Line slope(10) | 9.089e+06 | Bullish |
| Will A/D slope(10) | 8.295 | Bullish |
| BB Width | 0.1111 | Neutral |
| Chaikin Vol | 2.268 | Bearish |
| HHIGH(20) | 57.45 | Bullish |
| LLOW(20) | 51.87 | Neutral |
| MedPx vs Support | 4.096 | Bullish |
| Vol ROC(20) | 10.65 | Bullish |
Interpretation: Indicator-level signals form the base confluence, which is then adjusted using a separate AI-driven technical ranking model. The final technical score summarizes this combined view.
Confluence strength vs model-ranked neutrality
The technical stack shows a constructive breadth profile. The 18-signal confluence is 0.556 (Bullish), and the blended technical score rises to 0.565 (Bullish) with a Bull 13 / Bear 3 / Neutral 2 split. This breadth matters because it reduces reliance on any single indicator (e.g., RSI or MACD) and typically improves robustness during consolidations.
At the same time, the Deep Reinforcement Learning technical rank is #266 with a Neutral label (score 0.588). That is not a contradiction so much as a model-vs-signal divergence: the indicator suite is currently supportive, while the broader AI-ranked technical positioning is not strong enough to be classified bullish. This type of divergence often appears when trend quality is improving but still carries structural blemishes—consistent with the MA50 vs MA200 bearish read and the mixed horizon ranks (daily #751 vs monthly #3).
Within the signal set, the momentum core supports the bullish read (e.g., RSI(14) 69.03 bullish and MACD histogram 0.439 bullish). Offsetting that, there are clear “tension” flags: Stoch %K 85.42 is bearish and TS Accel -2.5 is bearish, both consistent with late-swing fatigue risk. Netting these together, the dashboard is best read as trend-leaning with selective exhaustion risk, making the support/resistance validation at 52.4838 and 59.1250 especially informative.
6) News sentiment + extractive gist
Note: Instrument-specific news matches were not found, so the digest includes broader market/sector headlines. Links are provided for verification.
Sentiment score (avg): 0.013 | Positive: 6% | Neutral: 94% | Negative: 0%
KGNAI AI News Sentiment Score (normalized -1 to +1): Not available (as of —) | Label: Not available | Overall news score: 0.01
Positive Developments
Recent coverage across major financial outlets leans mildly constructive at the macro tone level, which is consistent with the sentiment mix showing 6% positive and an average score of 0.013. The positive skew appears driven more by broad risk context than by company-specific catalysts, since instrument-specific matches were not found in the provided data. From a market-structure perspective, this matters because a lightly constructive tape can help bullish technical conditions persist, particularly when the technical dashboard is already supportive (overall blended technical score 0.565 and MACD histogram 0.4390). However, the neutrality dominance suggests that any constructive impulse is likely to be incremental rather than decisive, leaving price action around 59.1250 and 52.4838 to do most of the confirmation work.
Neutral / Mixed Developments
The dominant feature of the news read is the absence of strong directional pressure: 94% of items are neutral and 0% negative, which typically indicates a background information flow rather than a catalyst regime. The normalized KGNAI AI News Sentiment Score is Not available in the provided data, so the digest should be treated as contextual rather than model-validated. In this environment, markets often defer to technicals—consistent with the current setup where indicator confluence is bullish (0.556) but the AI technical rank is only neutral (#266). That mix can produce orderly continuation, but it can also produce range behavior until a clear price/volume signal emerges.
Negative / Risk Signals
Although the sentiment breakdown shows 0% negative, risk is still present in the form of headline irrelevance to the instrument and the potential for sudden global-risk repricing. With no instrument-specific news matches, the informational edge from this section is primarily about recognizing that the current rank/technical state may be more sensitive to market-wide shifts than to single-name developments. That sensitivity is particularly relevant given the mixed horizon ranks (daily #751 versus monthly #3) and the mixed trend interpretation (close vs MA50 bullish; MA50 vs MA200 bearish). In practice, the most actionable risk signal in the provided data remains technical: a close below 52.4838 would represent a deterioration condition in the scenario framework, regardless of the largely neutral news tape.
- Price/volume behavior on approaches to 59.1250 (continuation confirmation condition).
- Whether pullbacks hold above 52.4838 on a closing basis (deterioration risk threshold).
- Momentum stability if RSI remains elevated while Stoch %K stays high (85.42) alongside mixed acceleration (TS Accel -2.5).
Sources referenced: Reuters, Bloomberg, Yahoo Finance, MarketWatch, Investing.com
Snapshot: AI Rank (Short–Mid–Long): Mixed (Neutral–Bullish–Neutral) · Technical Confluence: Bullish · Key Levels: Support ~52.48 | Resistance ~59.12 · News Sentiment: Neutral
7) Sources
Not available in the provided data.
You may also like: How KGNAI AI ranks instruments across global markets
Disclaimer: KGNAI provides AI-generated analytics and educational market commentary only. This is not financial advice. Markets involve risk. Always do your own research.