
603881 (Shanghai AtHub Co Ltd) Technical & Rank Dashboard — 18-Feb-2026 | Neutral-to-Bearish Bias with Bullish Signal Confluence
KGNAI Signal + Technical Snapshot + News Sentiment Digest
As of: 18-Feb-2026
Ticker: 603881
Shanghai AtHub Co Ltd (603881) currently presents a mixed cross-horizon profile: short-term ranks sit near the middle of the China universe, while the mid-term view leans weaker, and the longer view returns to neutral. On the chart, the trend stack remains constructive (Close vs MA50 = Bullish; MA50 vs MA200 = Bullish), but momentum is elevated with RSI(14) at 86.38, which can coincide with strong trends while also increasing sensitivity to pullbacks. The technical dashboard shows a Bullish 18-signal confluence (0.556), yet the separate Deep Reinforcement Learning technical rank is #1083 out of 1294 with a Bearish label—an important divergence that often marks regime transition risk. Key decision zones remain clearly defined at Support ~ 29.9100 and Resistance ~ 45.0550. News sentiment is broadly neutral (avg 0.024) and currently provides limited directional edge.
- Rank stance: Short-term Neutral | Mid-term Bearish | Long-term Neutral
- Technical confluence: Bullish (18-signal score 0.556), but blended overall is Neutral at 0.187
- Levels: Support 29.9100 | Resistance 45.0550
- News sentiment bias: Neutral (avg 0.024; Neutral 81%)
- Confirmation / invalidation: Break above 45.0550 with volume supports continuation; close below 29.9100 raises deterioration risk.
KGNAI evaluates instruments through relative positioning across large universes, combining rank behavior with independent technical confirmations. The goal is to identify where multiple signals align—or diverge—while keeping interpretation symmetric across bullish and bearish regimes. Results are expressed as probabilistic behavior tendencies rather than point forecasts.
- Ranks are comparative within the stated universe size (1294 instruments), not absolute valuations.
- Confluence scores summarize signal agreement across indicators (RSI, MACD, Bollinger Bands, volume/flow measures).
- Support/resistance levels are decision zones where follow-through or failure tends to concentrate.
- Sentiment provides contextual bias; it is not a standalone trading signal.
1) KGNAI AI Analysis
Region: CHINA
Total universe size: 1294 ranked instruments
- Daily rank: #627 out of 1294 — Neutral
- Weekly rank: #1016 out of 1294 — Neutral
- Monthly rank: #1118 out of 1294 — Bearish
- 3-Monthly rank: #930 out of 1294 — Neutral
- 6-Monthly rank: #991 out of 1294 — Neutral
- Yearly rank: #962 out of 1294 — Neutral
The rank structure suggests near-term stabilization with a softer mid-term posture. The daily rank of #627 sits close to the center of the 1294-instrument universe, consistent with a neutral short-term read rather than leadership. By contrast, the monthly rank at #1118 places 603881 in the weaker part of the distribution, aligning with the stated mid-term Bearish stance and implying relative underperformance pressure in that horizon. The 3-month figure of #930 and the yearly rank of #962 return to neutral territory, which can occur when price action improves locally while broader relative strength remains incomplete.
This cross-horizon dispersion matters because it often reflects a market that is attempting to transition rather than trending cleanly. In practice, the short-term neutrality can coexist with strong technical readings (momentum and trend), but the weaker monthly ranking flags that the broader model set still detects unfavorable characteristics relative to peers. As a result, the more informative approach is to treat rank movement as a confirmation tool: sustained improvement would typically show up as monthly and weekly ranks migrating toward the upper quartile rather than remaining clustered around #1016 and #1118.
KGNAI ranks each instrument across large universes using multiple proprietary AI tests and statistical models (millions of data points). Lower ranks generally indicate stronger probability of favorable performance behavior, while higher ranks indicate weaker probability and more bearish positioning.
Term view: Short-term: Neutral. Mid-term: Bearish. Long-term: Neutral.
Want the full universe and complete rank tables? Unlock full access on KGNAI: https://www.kgnai.com/pricing
2) Price & trend overview
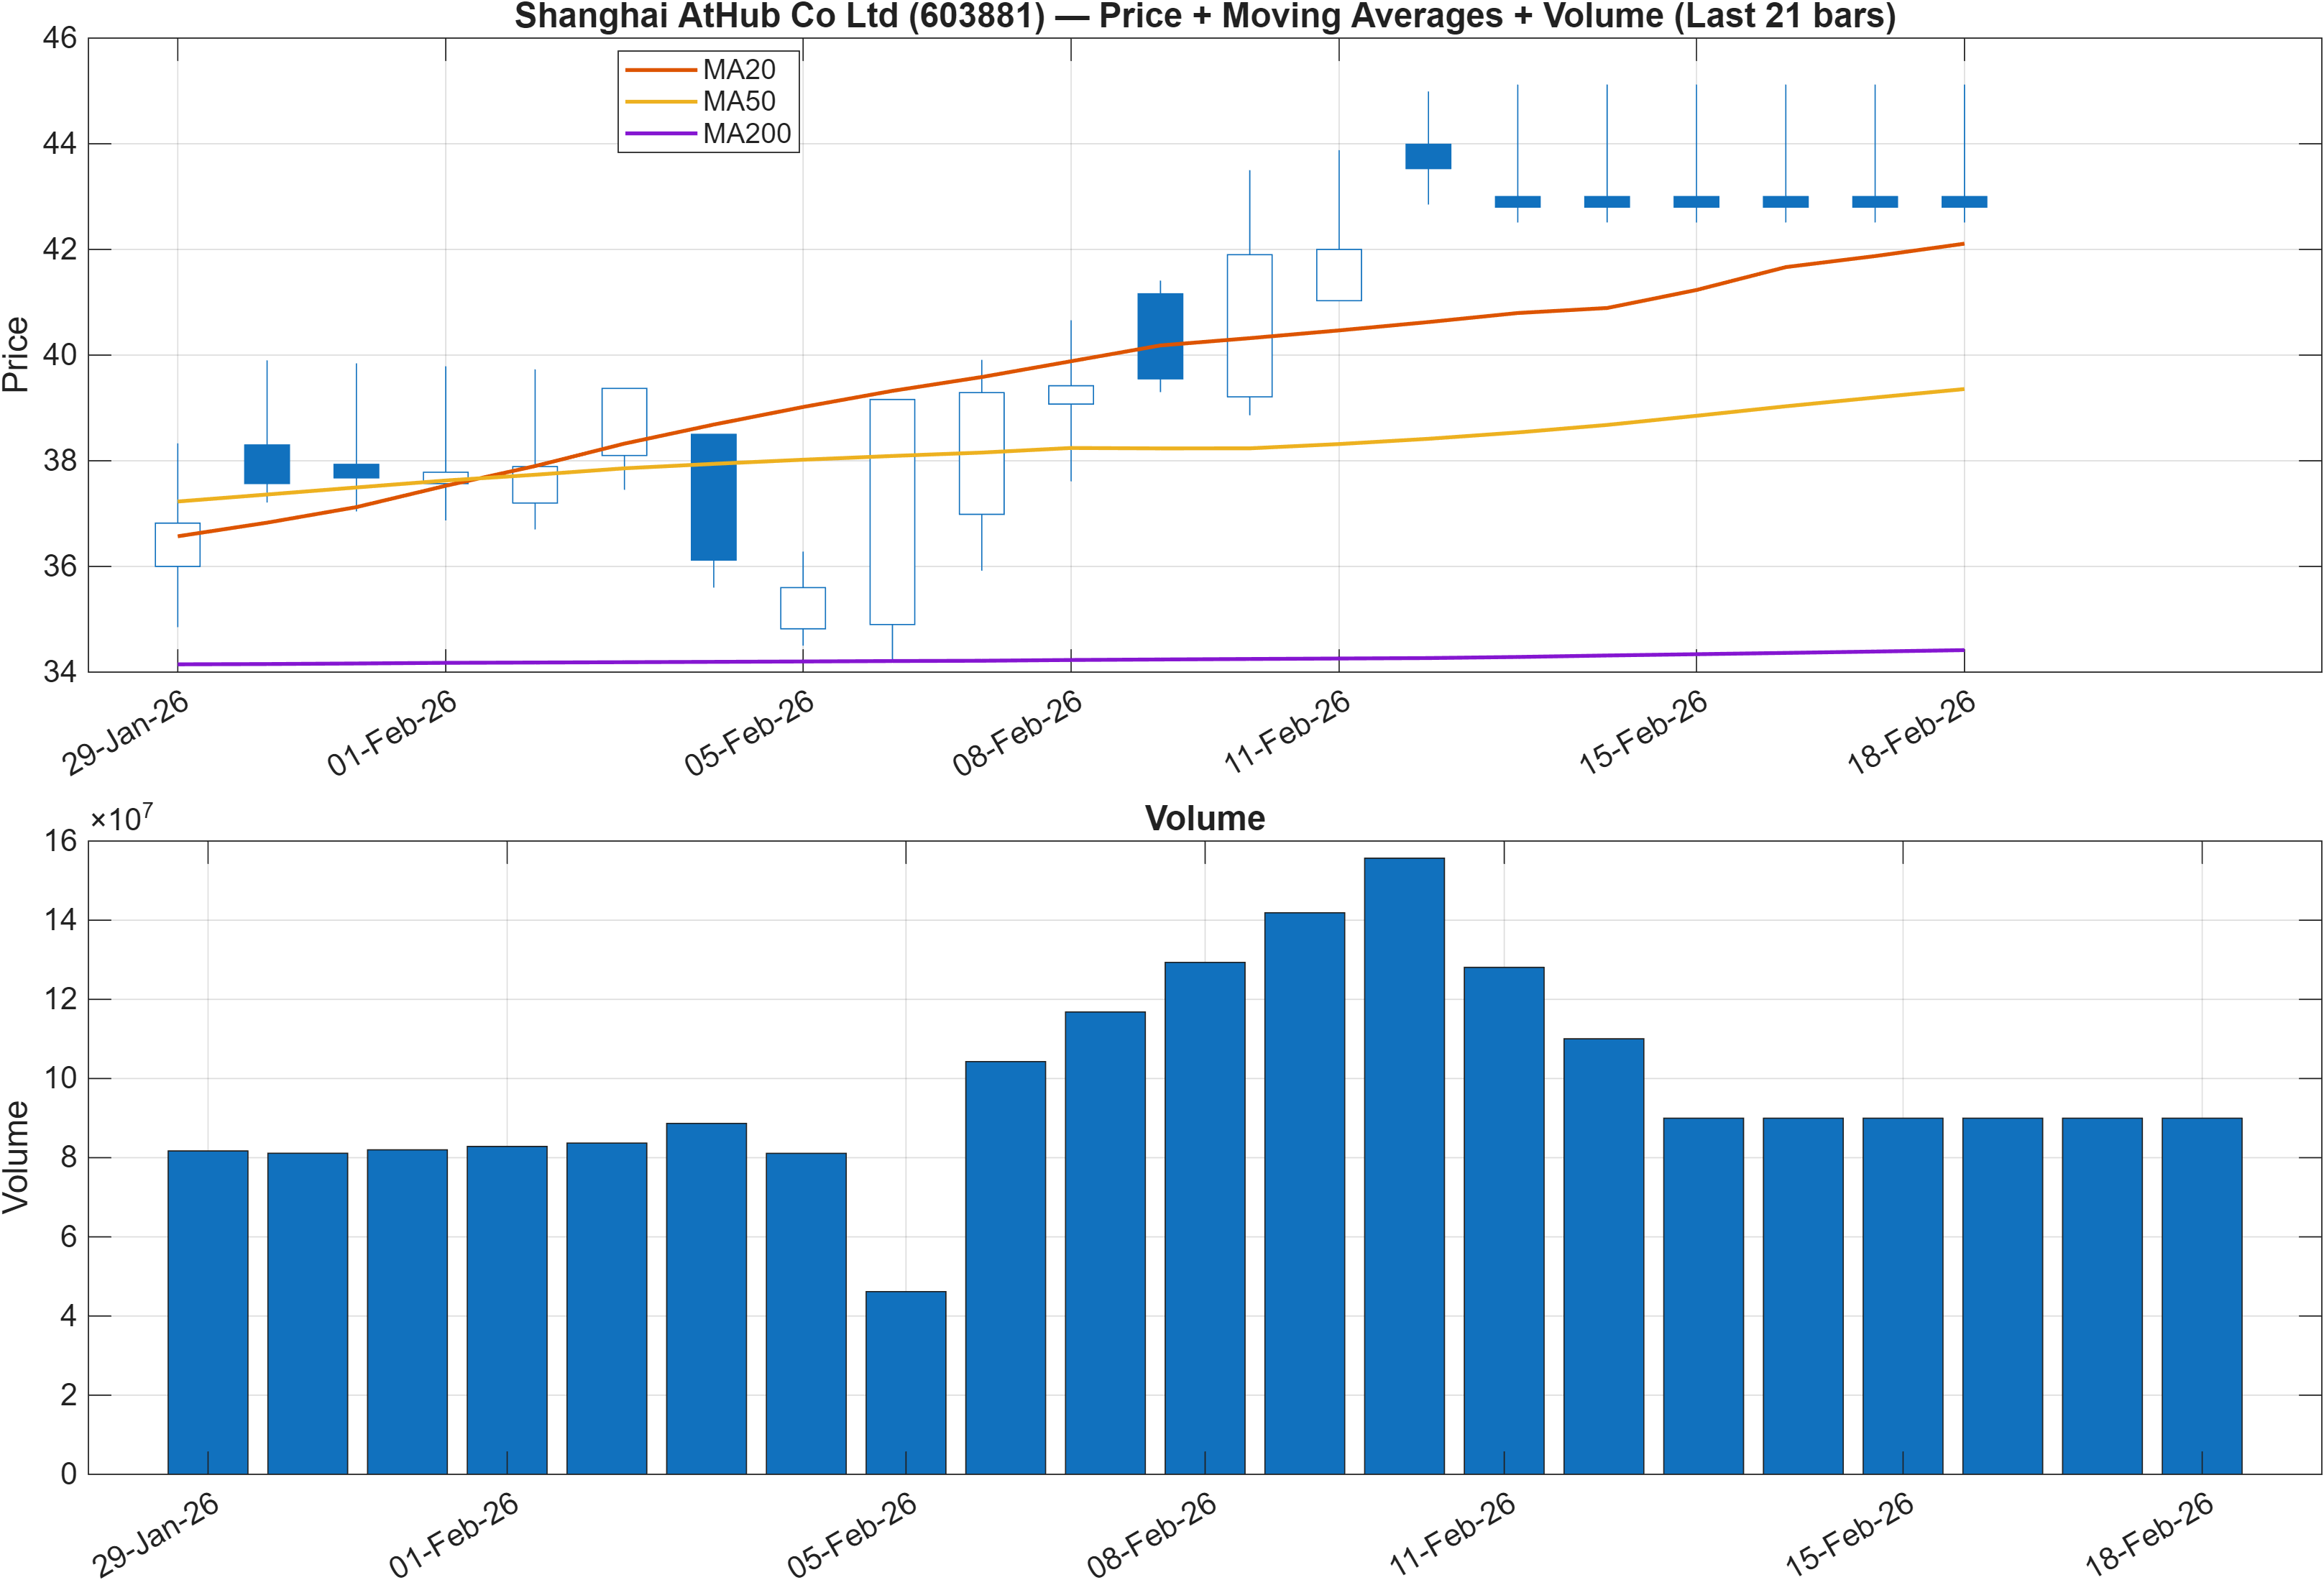
Trend conditions remain constructive under the moving-average framework: Close vs MA50 = Bullish and MA50 vs MA200 = Bullish. This pairing typically reflects both a positive intermediate slope and a longer-term trend foundation, reducing the odds that strength is purely a short-lived bounce. However, trend strength should be read alongside rank context: the monthly rank of #1118 suggests that—even with a supportive MA structure—relative positioning can still lag peers, which may lead to choppier continuation.
One implication is that price may be in a phase where trend persistence is present, but trend quality (breadth/relative leadership) is still being tested. With defined levels at Support ~ 29.9100 and Resistance ~ 45.0550, the moving-average stack can be treated as a tailwind, while the horizontal levels act as the more immediate decision map for follow-through versus retracement risk.
From a structure standpoint, bullish MA alignment tends to work best when momentum indicators confirm without becoming excessively stretched. Here, momentum is clearly positive (see RSI and MACD in the next section), which supports the trend reading. The trade-off is that elevated momentum can increase the market’s sensitivity to failed breakouts or rapid mean-reversion swings—making the reaction around 45.0550 and behavior above/below the MA50 especially informative for assessing whether this is steady continuation or a late-stage push.
Interpretation: Close vs MA50 = Bullish, MA50 vs MA200 = Bullish.
3) Momentum & volatility dashboard
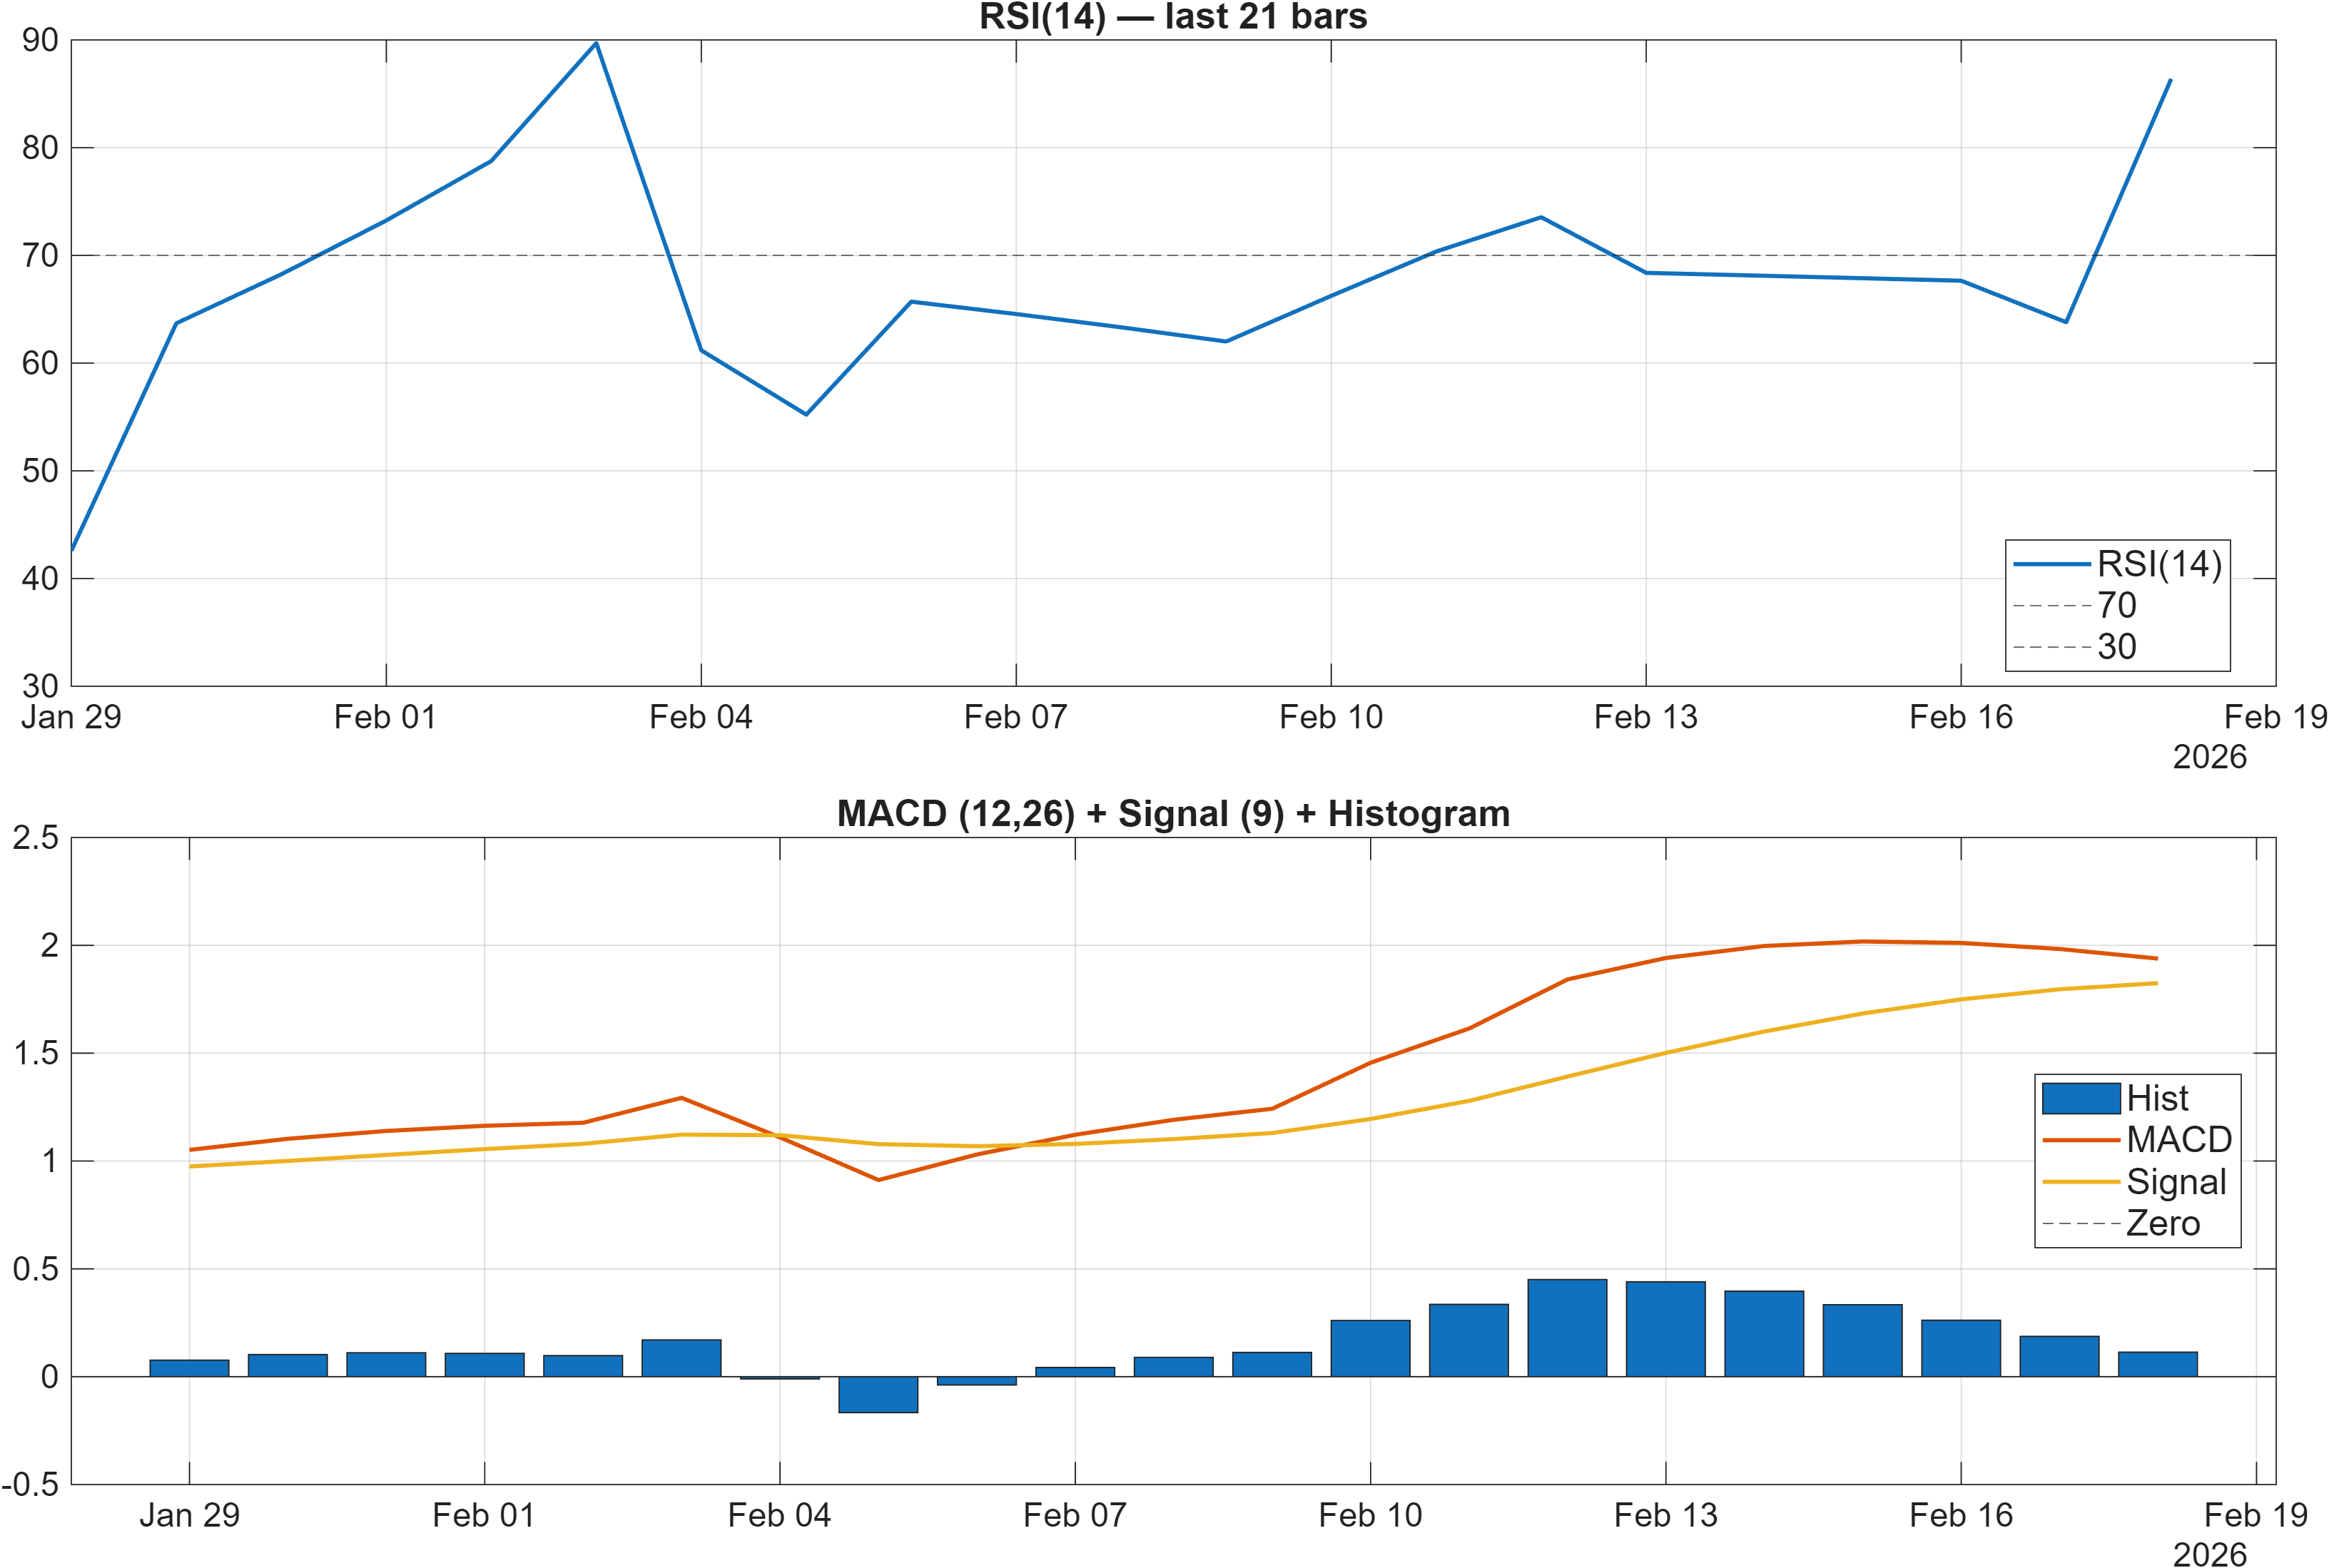
Momentum is decisively positive. The dashboard flags RSI bias = Bullish and shows MACD hist = 0.1138, a configuration typically associated with upside impulse still present. At the same time, the signal table records RSI(14) = 86.38, which is elevated and often coincides with either strong trend continuation or a short-term “crowded” condition where pullbacks become sharper if buying pressure pauses. This is less a reversal call than a reminder that trend-following conditions can become asymmetric: upside may continue, but downside reactions can be abrupt if momentum cools.
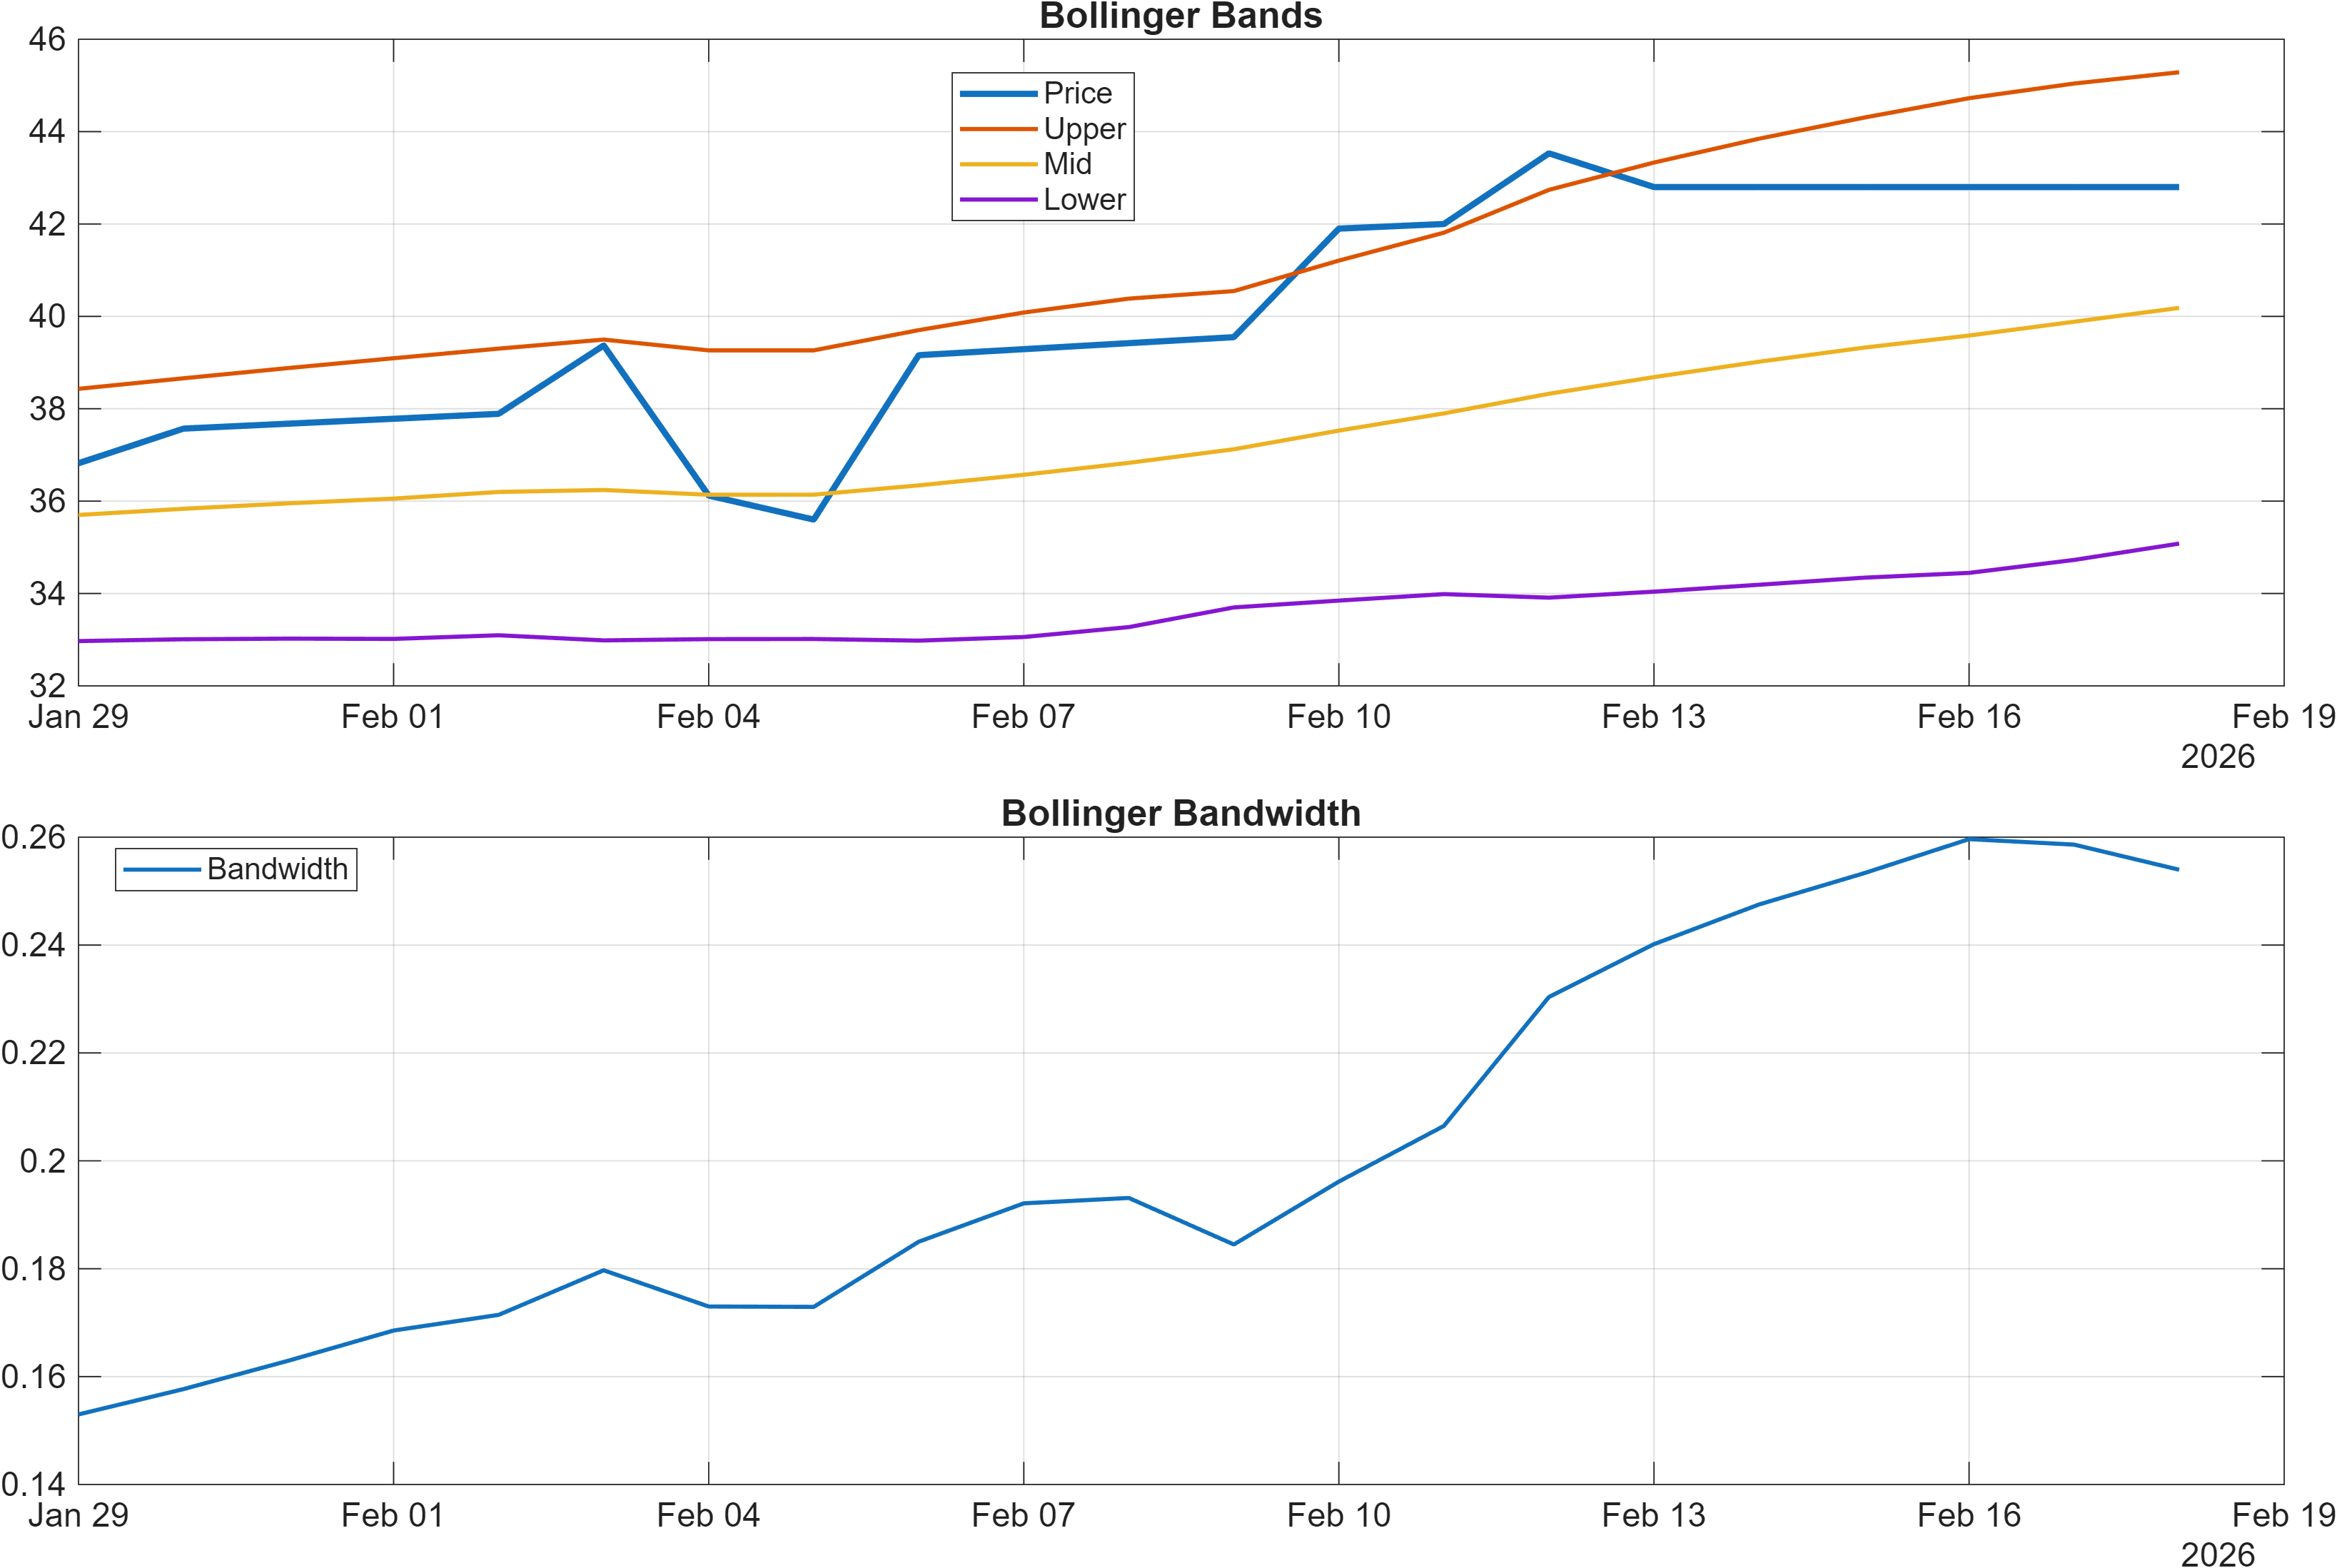
Volatility context is captured by Bollinger Bandwidth, with the latest reading at 0.2540. This indicates a measurable volatility regime that can support directional movement, but it also means position outcomes may be more dependent on execution around levels. When bandwidth is not extremely compressed, breakouts can travel; when combined with an elevated RSI like 86.38, the path often alternates between strong pushes and fast consolidations.
The practical takeaway is that momentum and volatility are aligned enough to keep trend continuation “on the table,” but the risk profile is not purely benign. Confirmation is best sought through continuing positive MACD histogram behavior (remaining above 0.1138 or at least holding positive) while price respects nearby structure. If momentum fades while volatility stays elevated, the same bandwidth that enables upside extension can amplify drawdowns during pullbacks.
Interpretation: RSI bias = Bullish, MACD hist = 0.1138.
Interpretation: Bandwidth (volatility regime) latest = 0.2540.
4) Support / Resistance zones
Support ~ 29.9100 | Resistance ~ 45.0550
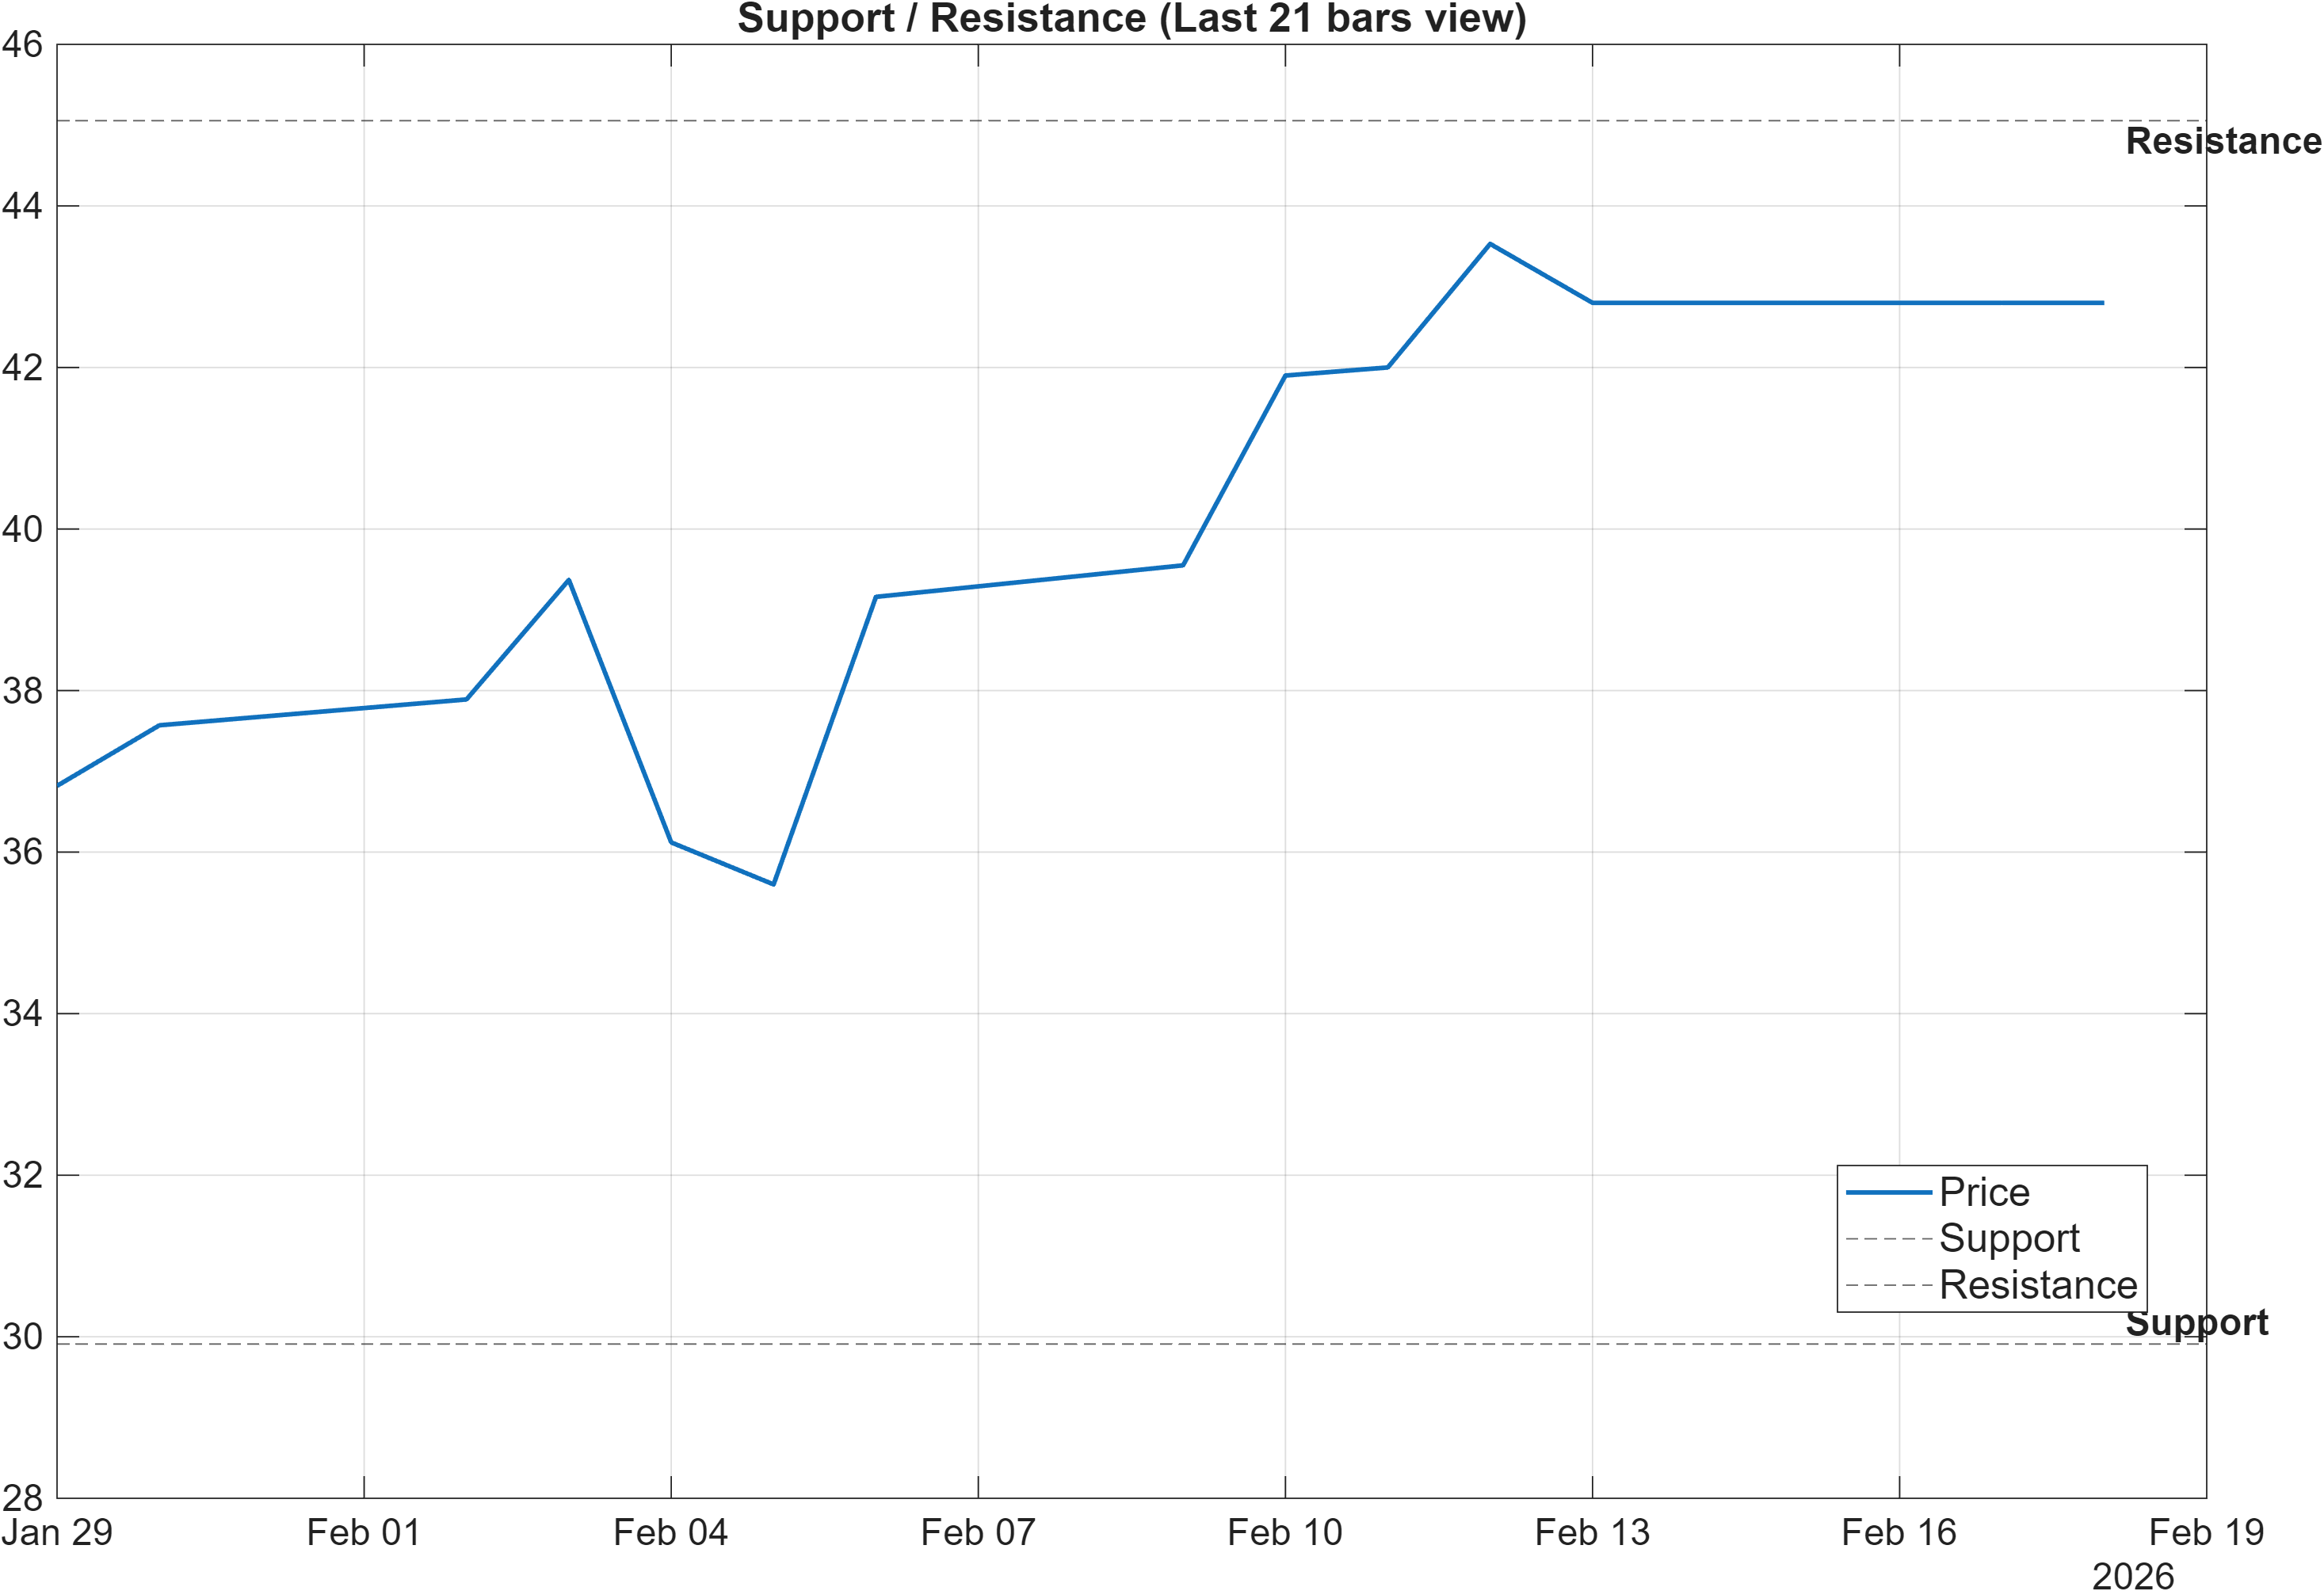
The level map is unusually clean: 29.9100 defines the primary support zone, while 45.0550 represents the main overhead resistance. With momentum strong (MACD hist 0.1138; RSI(14) 86.38) and the moving-average stack bullish, resistance is best treated as the confirmation boundary for continuation rather than a cap by default. A convincing acceptance above 45.0550, especially if aligned with volume confirmation (per the scenario note), tends to reduce ambiguity around trend persistence.
The more consequential risk boundary is support. A close below 29.9100 would not only violate the defined floor but would also increase the probability that the mid-term weakness flagged by the monthly rank #1118 is reasserting itself. In that case, bullish momentum signals can deteriorate quickly—e.g., MACD histogram compressing toward zero and RSI mean-reverting from elevated levels—without needing a dramatic macro catalyst.
Between these two levels, conditions can be interpreted as a range of negotiation where momentum remains constructive but must repeatedly prove itself. Given Bollinger bandwidth at 0.2540, moves between zones may be meaningful rather than incremental, so the market’s reaction (rejection vs acceptance) around 45.0550 and 29.9100 should carry more analytical weight than minor indicator fluctuations.
Scenario view: Break above resistance with volume → continuation. Close below support → signal deterioration risk.
5) Quant Technical Dashboard (18 Signals)
KGNAI AI Technical Analysis Score (Deep Reinforcement Learning): Rank #1083 out of 1294 (Rank 1 represents the strongest technical positioning and a higher probability of favorable price behavior. As ranks increase toward the maximum, the probability of favorable outcomes weakens and bearish positioning becomes more dominant.) | Label: Bearish | Score: -0.674
18-Signal Technical Confluence Score: 0.556 (Bullish)
Overall Technical Score (18-signal confluence + DRL rank blend): 0.187 (Neutral)
Note: The blended score reflects signal strength weighted against broader AI technical ranking, which may temporarily diverge.
Blended technical score breakdown: 0.187 (Neutral | Bull 12 / Bear 2 / Neutral 4)
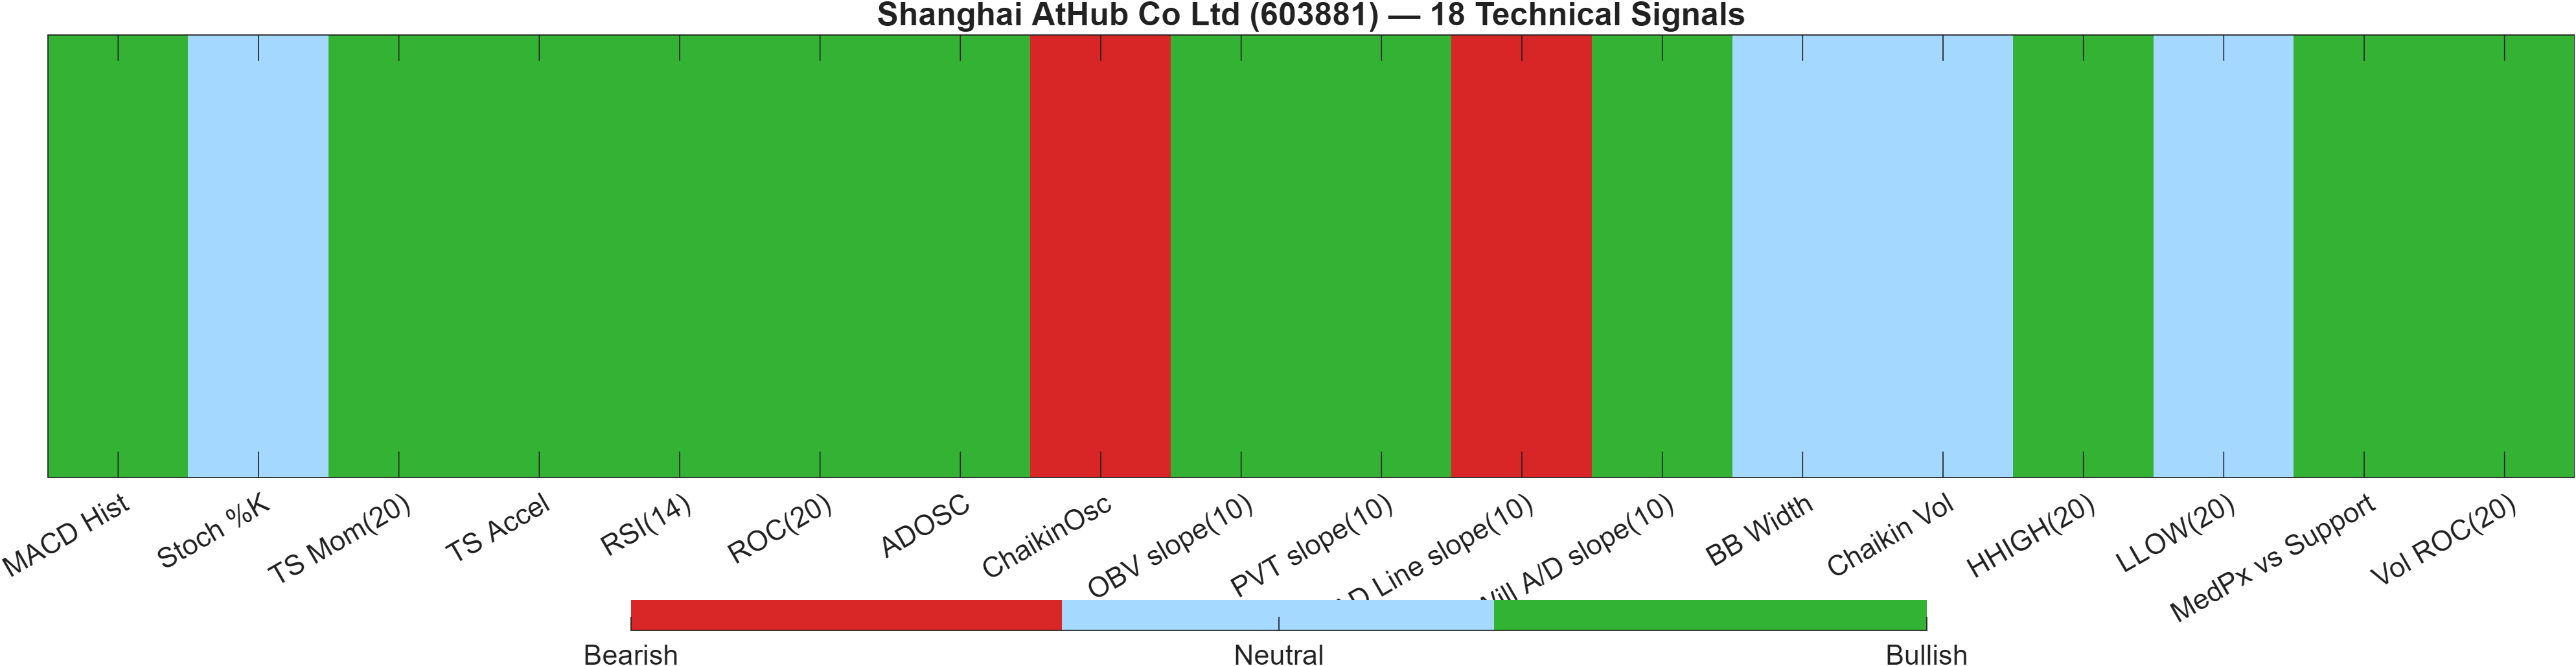
The technical stack contains a key tension: bottom-up indicators are broadly constructive, but the higher-level AI technical rank is weak. On one hand, the 18-signal confluence score is 0.556 (Bullish) with Bull 12 / Bear 2 / Neutral 4, consistent with a market displaying positive breadth across momentum, trend, and certain flow proxies. On the other hand, the Deep Reinforcement Learning model places the instrument at Rank #1083 out of 1294 with a Bearish label and Score -0.674, which pulls the Overall Technical Score down to 0.187 (Neutral).
Divergences like this often appear when indicators respond quickly to recent price strength, while the broader model remains anchored to pattern characteristics that historically correlate with weaker forward behavior. The confluence includes positive momentum inputs such as MACD Hist 0.1138 and TS Mom(20) 5.23, yet the existence of bearish readings in flow/breadth components (e.g., AD Line slope(10) -5.609e+08 and ChaikinOsc -1.605e+08) highlights that participation can be uneven. That mixed internal structure can explain why the blended score is neutral despite bullish surface signals.
Operationally, the dashboard encourages a confirmation-first approach: allow bullish confluence to remain constructive, but require that price action validates it at key levels (notably 45.0550) and avoids invalidation at 29.9100. If bullish indicators stay strong while the DRL rank remains as weak as #1083, the market is effectively signaling that the move may be tradable but not yet statistically “clean” relative to the broader technical opportunity set.
Signal table (Bull/Bear/Neutral)
| Indicator | Value | Signal |
|---|---|---|
| MACD Hist | 0.1138 | Bullish |
| Stoch %K | 62.94 | Neutral |
| TS Mom(20) | 5.23 | Bullish |
| TS Accel | 2.973 | Bullish |
| RSI(14) | 86.38 | Bullish |
| ROC(20) | 13.92 | Bullish |
| ADOSC | 46.17 | Bullish |
| ChaikinOsc | -1.605e+08 | Bearish |
| OBV slope(10) | 4.457e+08 | Bullish |
| PVT slope(10) | 1.252e+07 | Bullish |
| AD Line slope(10) | -5.609e+08 | Bearish |
| Will A/D slope(10) | 3.47 | Bullish |
| BB Width | 0.254 | Neutral |
| Chaikin Vol | -5.611 | Neutral |
| HHIGH(20) | 45.12 | Bullish |
| LLOW(20) | 34.23 | Neutral |
| MedPx vs Support | 13.9 | Bullish |
| Vol ROC(20) | 10.92 | Bullish |
Interpretation: Indicator-level signals form the base confluence, which is then adjusted using a separate AI-driven technical ranking model. The final technical score summarizes this combined view.
6) News sentiment + extractive gist
Note: Instrument-specific news matches were not found, so the digest includes broader market/sector headlines. Links are provided for verification.
Sentiment score (avg): 0.024 | Positive: 12% | Neutral: 81% | Negative: 6%
KGNAI AI News Sentiment Score (normalized -1 to +1): Not available (as of —) | Label: Not available | Overall news score: 0.02
Positive Developments
Recent coverage across major financial outlets indicates a generally constructive backdrop for select China-facing themes tied to technology interest and consumer engagement, which can indirectly support risk appetite in related equities. Commentary has highlighted ongoing attention around AI and open ecosystems, and visible consumer-facing activity that can strengthen near-term sentiment even when it is not issuer-specific. In this context, the measured positive share (12%) aligns with a market narrative that is more supportive than adverse, though still far from strongly upbeat. For 603881, the relevance is contextual rather than fundamental: a mildly constructive tape can help technical setups follow through, especially when trend signals are already supportive (e.g., Close vs MA50 = Bullish) and momentum remains positive (MACD hist 0.1138).
Neutral / Mixed Developments
The dominant feature of the news mix is its neutrality: 81% of items are classified as neutral, and the average score remains close to flat at 0.024. Recent coverage appears oriented toward general events and informational updates rather than market-moving developments for the instrument, consistent with the note that instrument-specific matches were not found. For positioning, this typically means technical levels and ranking dynamics should carry more weight than narratives. A neutral news environment can still allow for volatility-driven moves—particularly with Bollinger bandwidth at 0.2540—but it tends to reduce the probability that an external catalyst overwhelms the existing support/resistance map.
Negative / Risk Signals
Negative tone is present but limited (6%), suggesting risk signals are more about background uncertainty than a concentrated adverse story. In neutral-to-quiet news regimes, downside risk often expresses through technical failure rather than headlines—especially when momentum is stretched, such as RSI(14) at 86.38. For 603881, the most relevant “risk signal” is therefore a potential mismatch between bullish indicator confluence (0.556) and the weaker AI technical rank (#1083), which can coincide with choppier follow-through. If market risk tone deteriorates broadly, price sensitivity around 29.9100 (support) becomes the practical line separating controlled consolidation from deeper technical damage.
- Whether price acceptance develops above 45.0550 alongside improving rank behavior (weekly #1016 and monthly #1118).
- Whether momentum cools while remaining constructive (MACD histogram staying positive from 0.1138 and RSI avoiding sharp mean reversion from 86.38).
- Whether the instrument holds 29.9100 during any volatility expansion (bandwidth 0.2540).
Sources referenced: Reuters, Bloomberg, Yahoo Finance, MarketWatch, Investing.com
Snapshot: AI Rank (Short–Mid–Long): Mixed (Neutral–Bearish–Neutral) · Technical Confluence: Bullish · Key Levels: Support ~29.91 | Resistance ~45.05 · News Sentiment: Neutral
7) Sources
Not available in the provided data.
You may also like: How KGNAI AI ranks instruments across global markets
Disclaimer: KGNAI provides AI-generated analytics and educational market commentary only. This is not financial advice. Markets involve risk. Always do your own research.