
600221 (Hainan Airlines Co Ltd A) — 20-Mar-2026 Neutral-to-Bearish Technical Posture Within a Still-Neutral Multi-Horizon Rank Profile
As of 20-Mar-2026, KGNAI’s cross-sectional ranking for Hainan Airlines Co Ltd A (600221) stays broadly Neutral beyond the very near term, while the shortest-horizon read is materially weaker. The Daily rank (#1127 of 1293) places the name in the lower tier of the tracked universe, contrasting with a more stable Yearly rank (#639 of 1293). Technically, the moving-average structure remains pressured (Close vs MA50 = Bearish; MA50 vs MA200 = Bearish), and the blended technical framework leans Bearish despite a Neutral 18-signal confluence. Momentum signals show late-stage stress (e.g., RSI(14) at 29.41) while volatility is contained (Bollinger bandwidth 0.0876), creating a setup where confirmation tends to come from decisive behavior around key structural levels. With news sentiment readings showing 0.000 average and an all-neutral classification, the current bias is driven more by market microstructure and technical alignment than by instrument-specific headlines.
- Rank stance: Short-term Bearish | Mid-term Neutral | Long-term Neutral
- Technical confluence label: 18-signal score -0.278 Neutral; blended overall technical score -0.433 Bearish
- Key levels: Support ~ 1.5300 | Resistance ~ 1.7483
- News sentiment bias: Neutral (avg 0.000; Neutral 100%)
- Confirmation / invalidation condition: Strength confirmation typically requires a break above 1.7483 with volume; deterioration risk increases on a close below 1.5300.
What KGNAI Measures
KGNAI evaluates assets using large cross-sectional datasets built from millions of structured data points. Inputs incorporate fundamental metrics, technical structures, and systematically processed news sentiment. Statistical models, machine learning, and AI frameworks are used to assess relative positioning, signal alignment, and probabilistic behavior across broad universes.
How to Read This Report
- Ranks are comparative across the tracked universe, not absolute price targets.
- Confluence reflects alignment among independent signal groups.
- Support/resistance levels are probabilistic decision zones, not guarantees.
- Sentiment provides contextual bias within the broader analytical framework.
1) KGNAI AI Analysis
Region: CHINA
Total universe size: 1293 ranked instruments
- Daily rank: #1127 out of 1293 — Bearish
- Weekly rank: #943 out of 1293 — Neutral
- Monthly rank: #830 out of 1293 — Neutral
- 3-Monthly rank: #843 out of 1293 — Neutral
- 6-Monthly rank: #854 out of 1293 — Neutral
- Yearly rank: #639 out of 1293 — Neutral
Cross-horizon positioning: short-term weakness vs longer-horizon stabilization
The rank stack shows a clear horizon asymmetry: the Daily rank (#1127/1293) sits deep in the weaker portion of the universe, while the Yearly rank (#639/1293) is materially less negative. That spread matters because it frames the current tape as a short-term stress episode inside a broader profile that has not fully deteriorated across higher timeframes.
The intermediate horizon reads—Weekly (#943), Monthly (#830), and 3-Monthly (#843)—cluster in a relatively tight band, consistent with a market that is not strongly trending in a favorable direction but also not uniformly collapsing across all time compressions. This clustering often appears when price action is range-bound with negative drift or when a prior down move is being digested without a clean reversal structure.
KGNAI’s term view summarizes this as Short-term: Bearish, Mid-term: Neutral, Long-term: Neutral. Practically, that mix increases the importance of confirmation from independent signal groups—particularly moving-average structure, momentum, and volume-linked indicators—because rank stabilization on longer horizons can coexist with short-lived downside continuation.
KGNAI ranks each instrument across large universes using multiple proprietary AI tests and statistical models (millions of data points). Lower ranks generally indicate stronger probability of favorable performance behavior, while higher ranks indicate weaker probability and more bearish positioning.
Want the full universe and complete rank tables? Unlock full access on KGNAI: https://www.kgnai.com/pricing
2) Price & trend overview
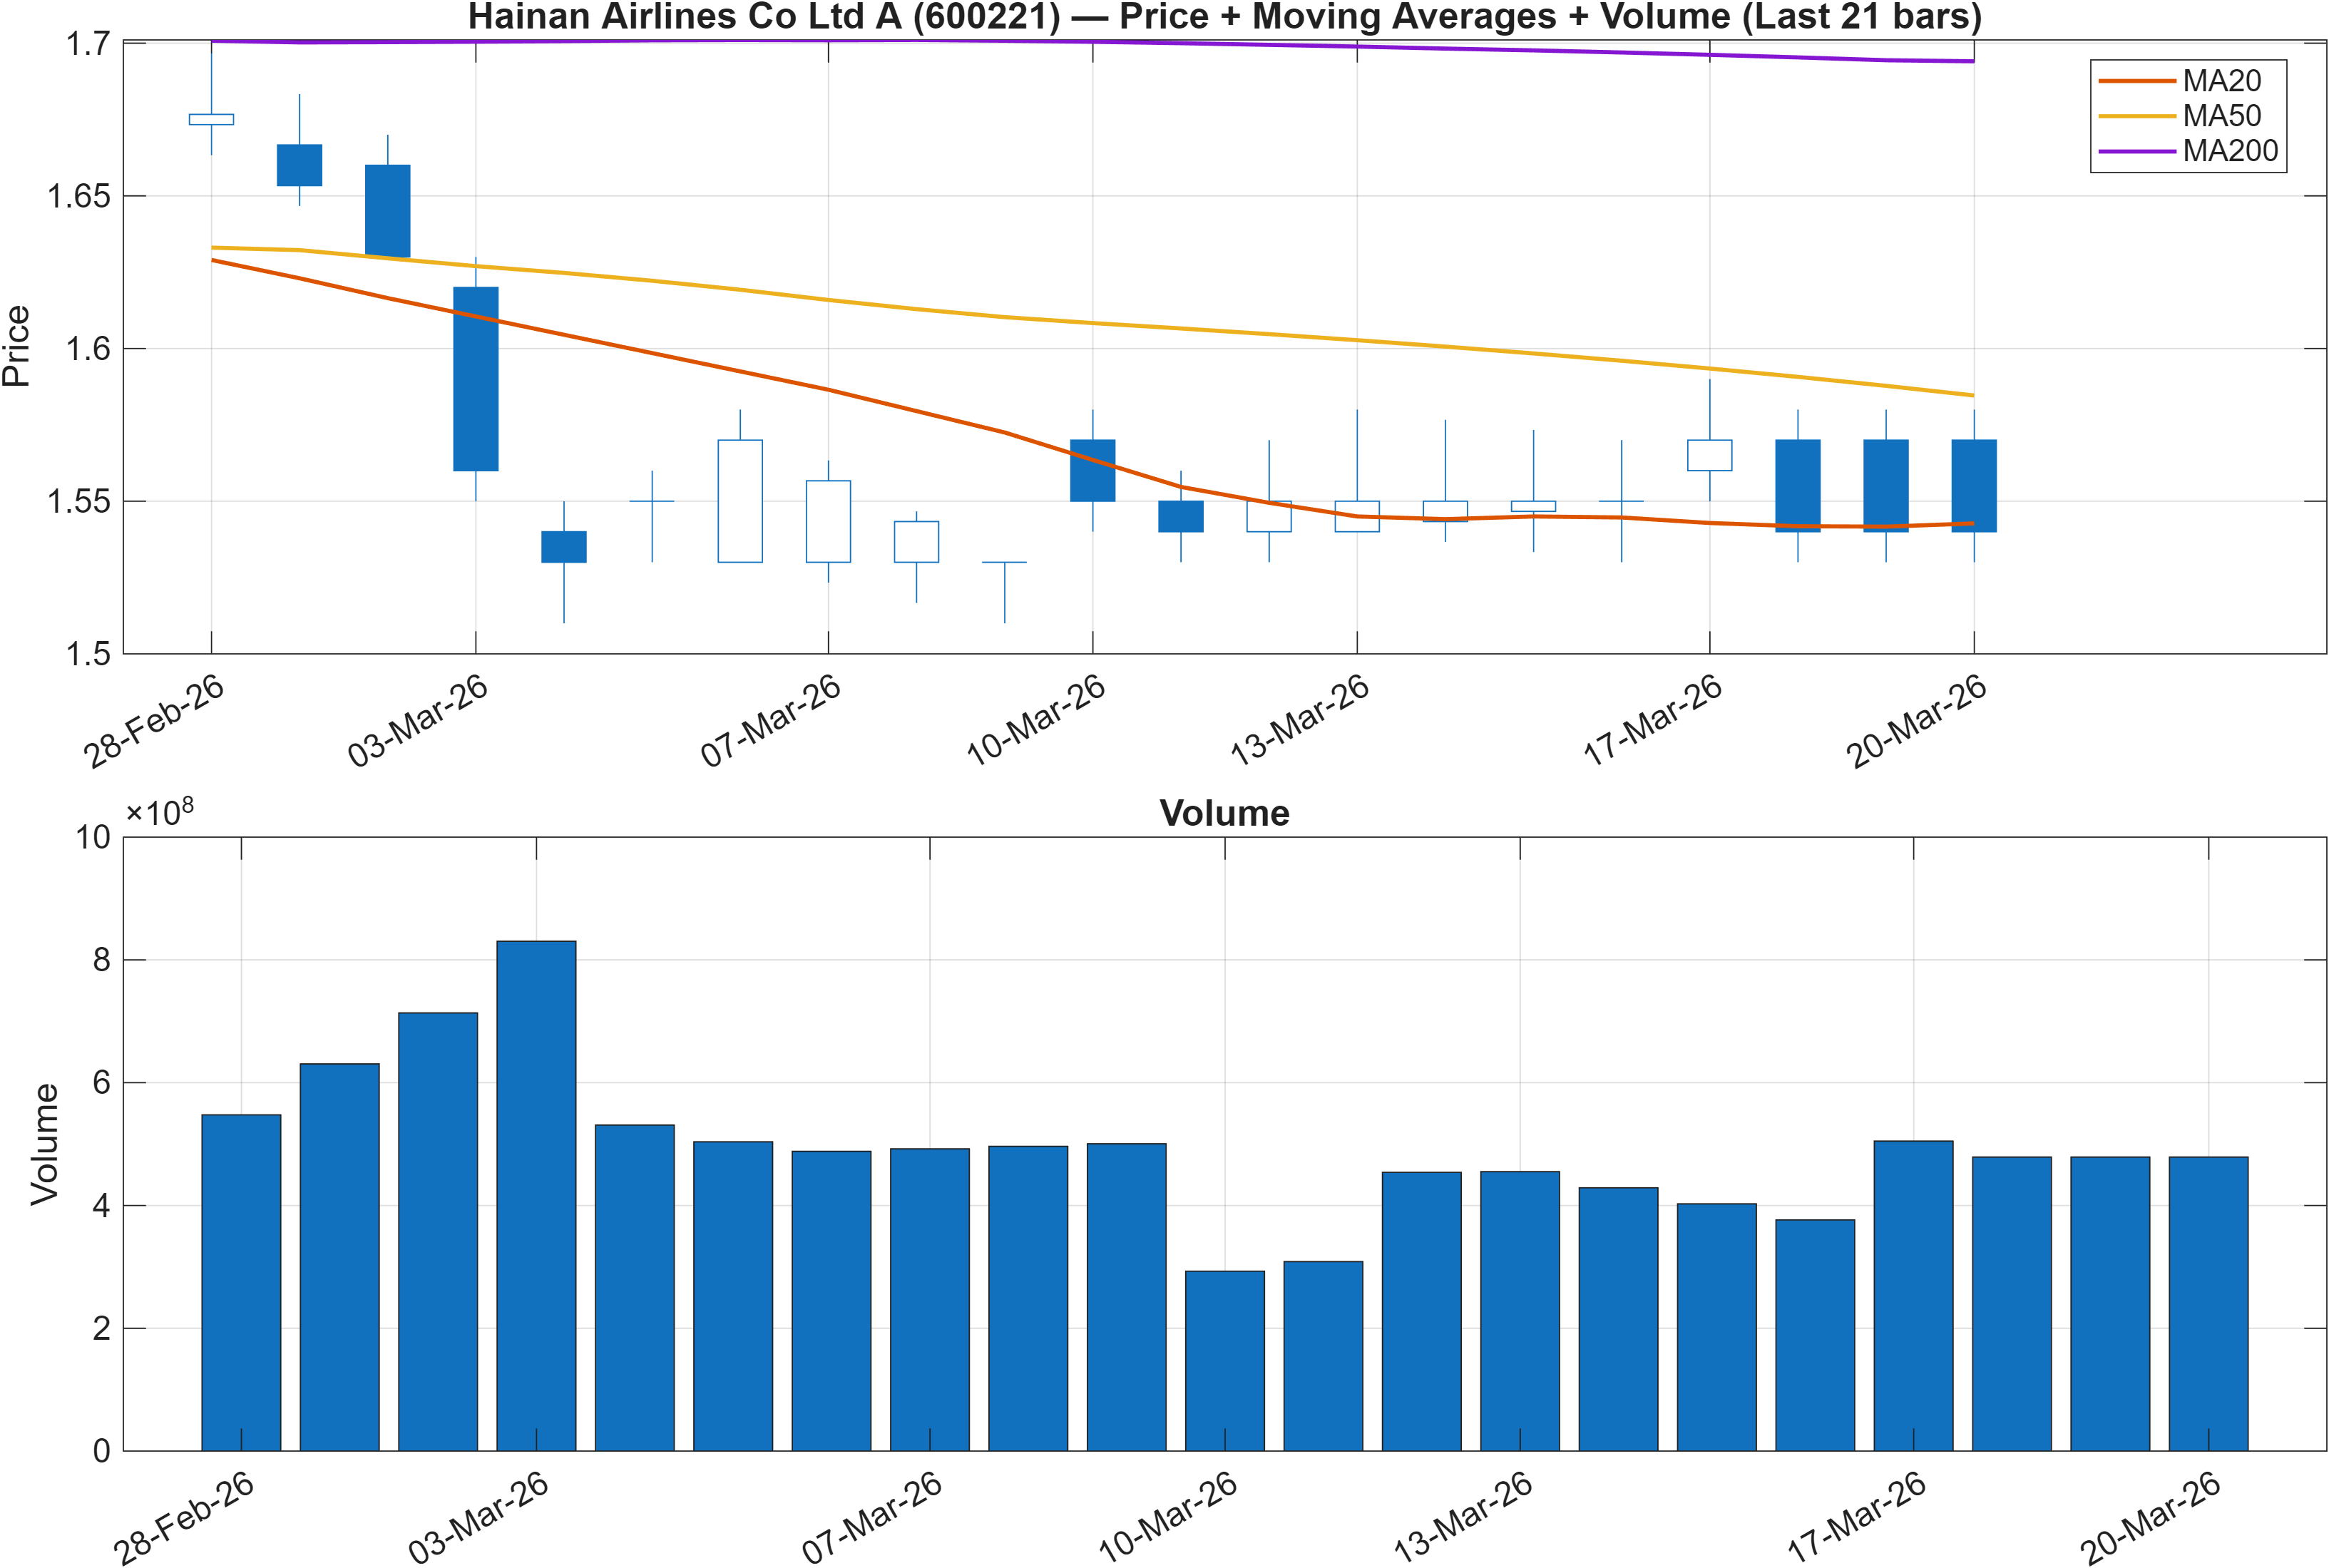
Interpretation: Close vs MA50 = Bearish, MA50 vs MA200 = Bearish.
Trend regime: bearish moving-average stack with limited evidence of reversal
The trend lens is currently dominated by a bearish moving-average configuration: price is below the MA50, and the MA50 is also below the MA200. This combination tends to reflect a market that is still operating in a downtrend regime rather than a neutral consolidation with a rising base.
What makes the setup more nuanced is the broader rank profile, where the Yearly rank (#639) is not as weak as the Daily rank (#1127). When short-term weakness appears against a less-negative long horizon, the technical question becomes whether the market is forming a base-building process or simply pausing within a larger downtrend. In this context, the next decisive information usually comes from the interaction between trend and structure: whether rebounds can reclaim key levels and hold above them.
The report’s key zones provide that structural scaffold: support near 1.5300 and resistance near 1.7483. Under bearish moving averages, rallies that stall below resistance often remain corrective. Conversely, sustained acceptance back above resistance—especially with improving participation—can signal that the trend regime is transitioning.
In short, the moving-average stack keeps the baseline bias cautious, while the multi-horizon ranks argue for monitoring whether downside is becoming exhaustive rather than persistent. The evidence for either outcome should be judged by price behavior around 1.5300 and 1.7483, not by any single indicator in isolation.
3) Momentum & volatility dashboard
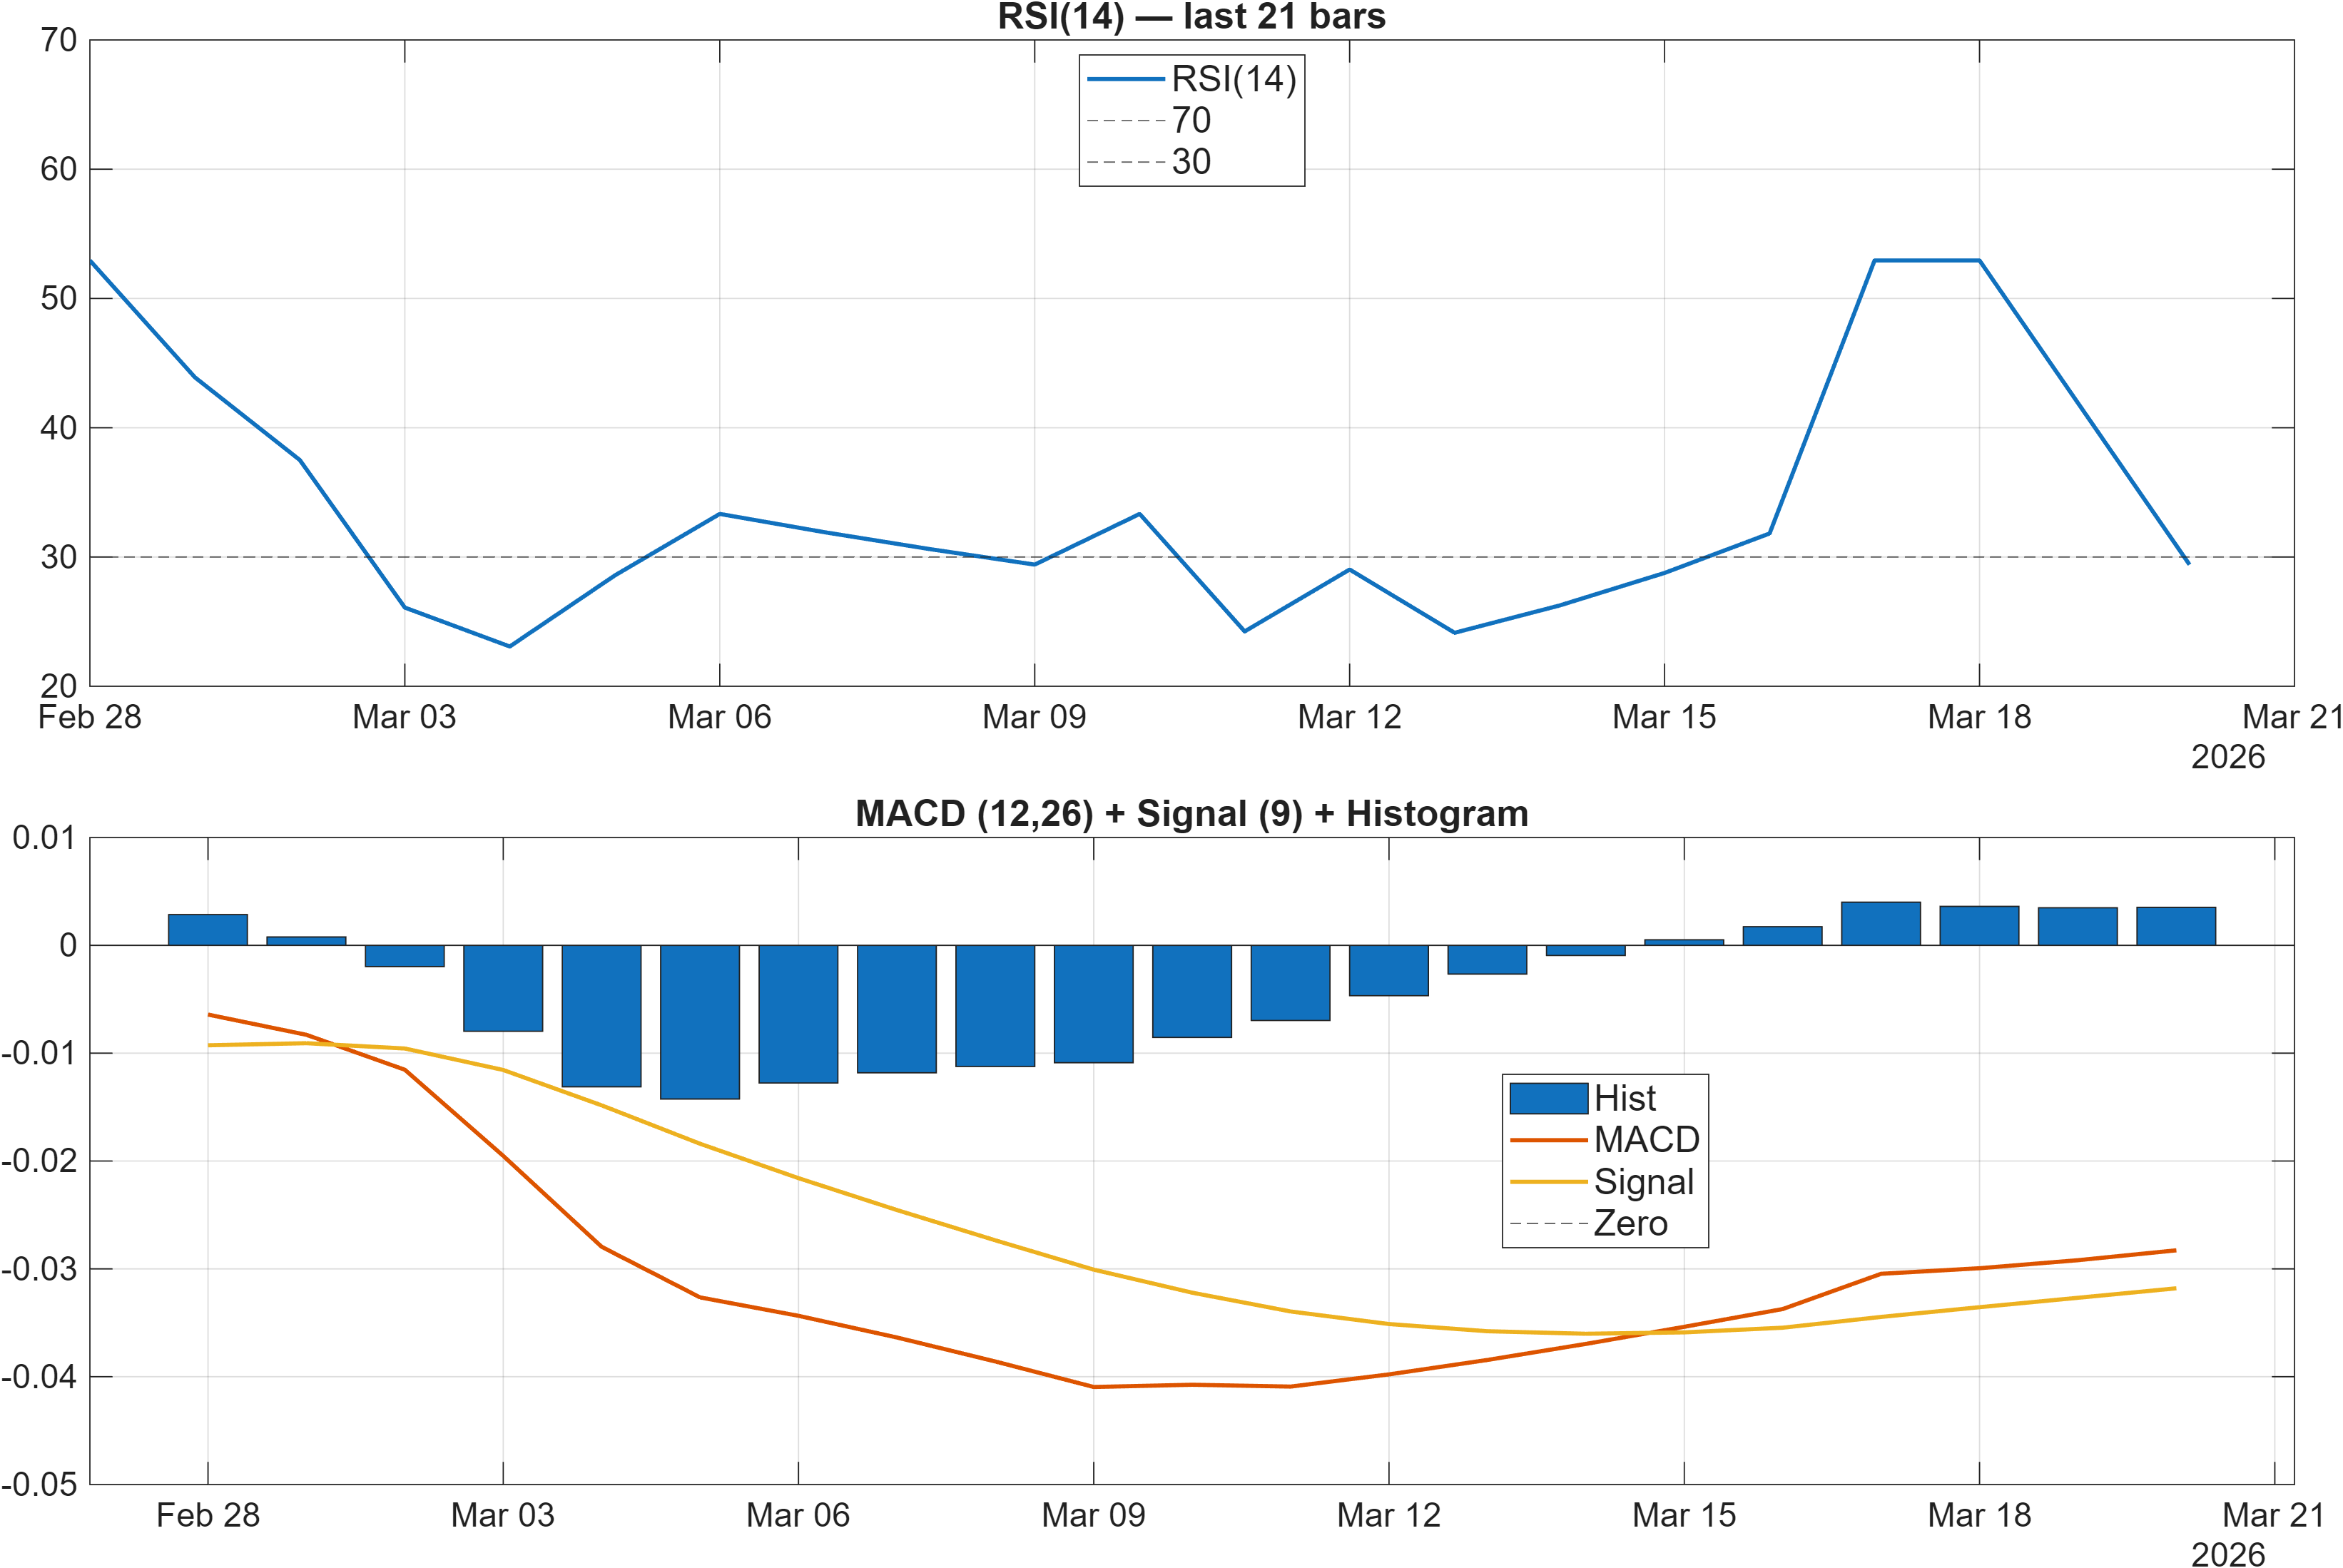
Interpretation: RSI bias = Bearish, MACD hist = 0.0035.
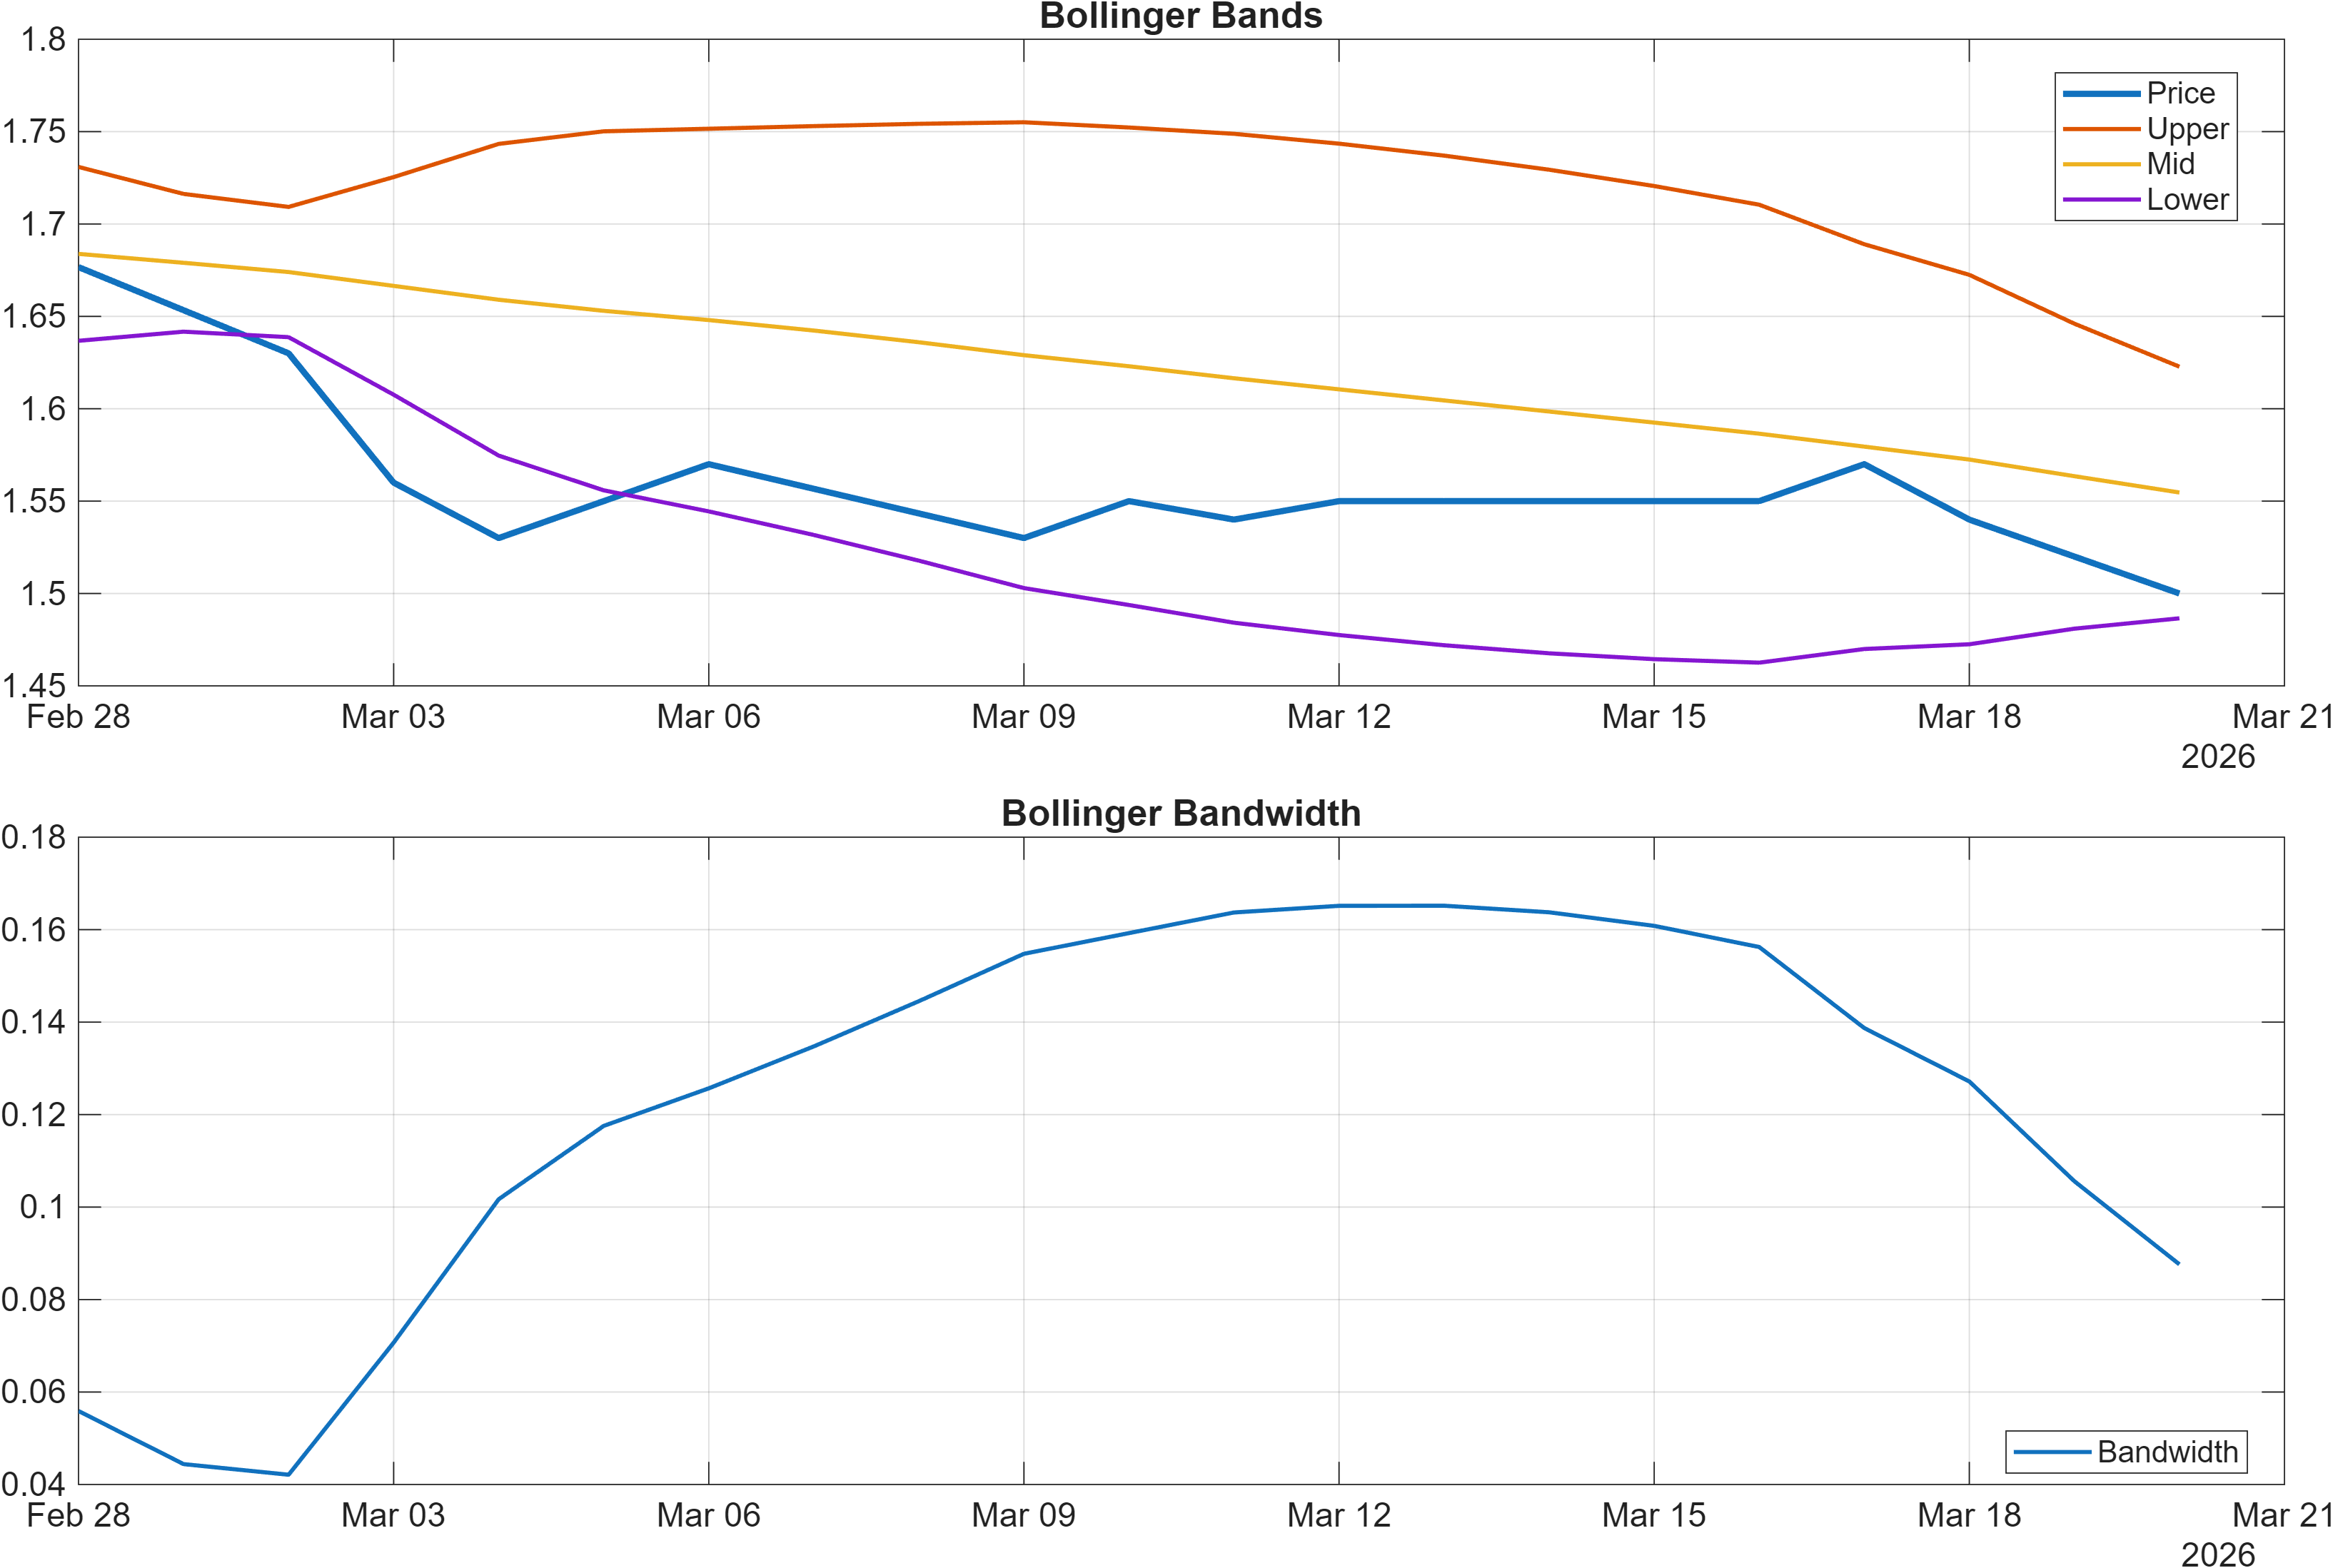
Interpretation: Bandwidth (volatility regime) latest = 0.0876.
Momentum/volatility mix: oversold pressure with early stabilization signals
Momentum and volatility are sending a mixed, but interpretable, message. On one hand, RSI(14) at 29.41 sits in a region typically associated with bearish momentum and potential oversold conditions. That aligns with the weak short-horizon rank posture and the bearish moving-average structure.
On the other hand, the MACD histogram at 0.0035 is marginally positive, which can occur when downside momentum is decelerating even if price remains technically weak. This is not, by itself, a reversal confirmation—particularly when trend filters (MA relationships) still point lower—but it does suggest the market may be transitioning from acceleration to a more two-sided phase.
Volatility provides additional context. A Bollinger bandwidth of 0.0876 implies a relatively contained volatility regime rather than a fully expanded, disorderly selloff. When RSI is depressed but bandwidth remains moderate, markets sometimes shift into compression—a state where directional resolution tends to depend on whether price can reclaim nearby resistance or instead breaks support with renewed range expansion.
The higher-level takeaway is a tension between trend persistence (bearish MA stack) and momentum exhaustion risk (low RSI with a slightly positive MACD histogram). For risk framing, the cleanest arbiter remains structural: whether the market holds above 1.5300 during any retests, and whether rebounds can build acceptance toward 1.7483.
4) Support / Resistance zones
Support ~ 1.5300 | Resistance ~ 1.7483
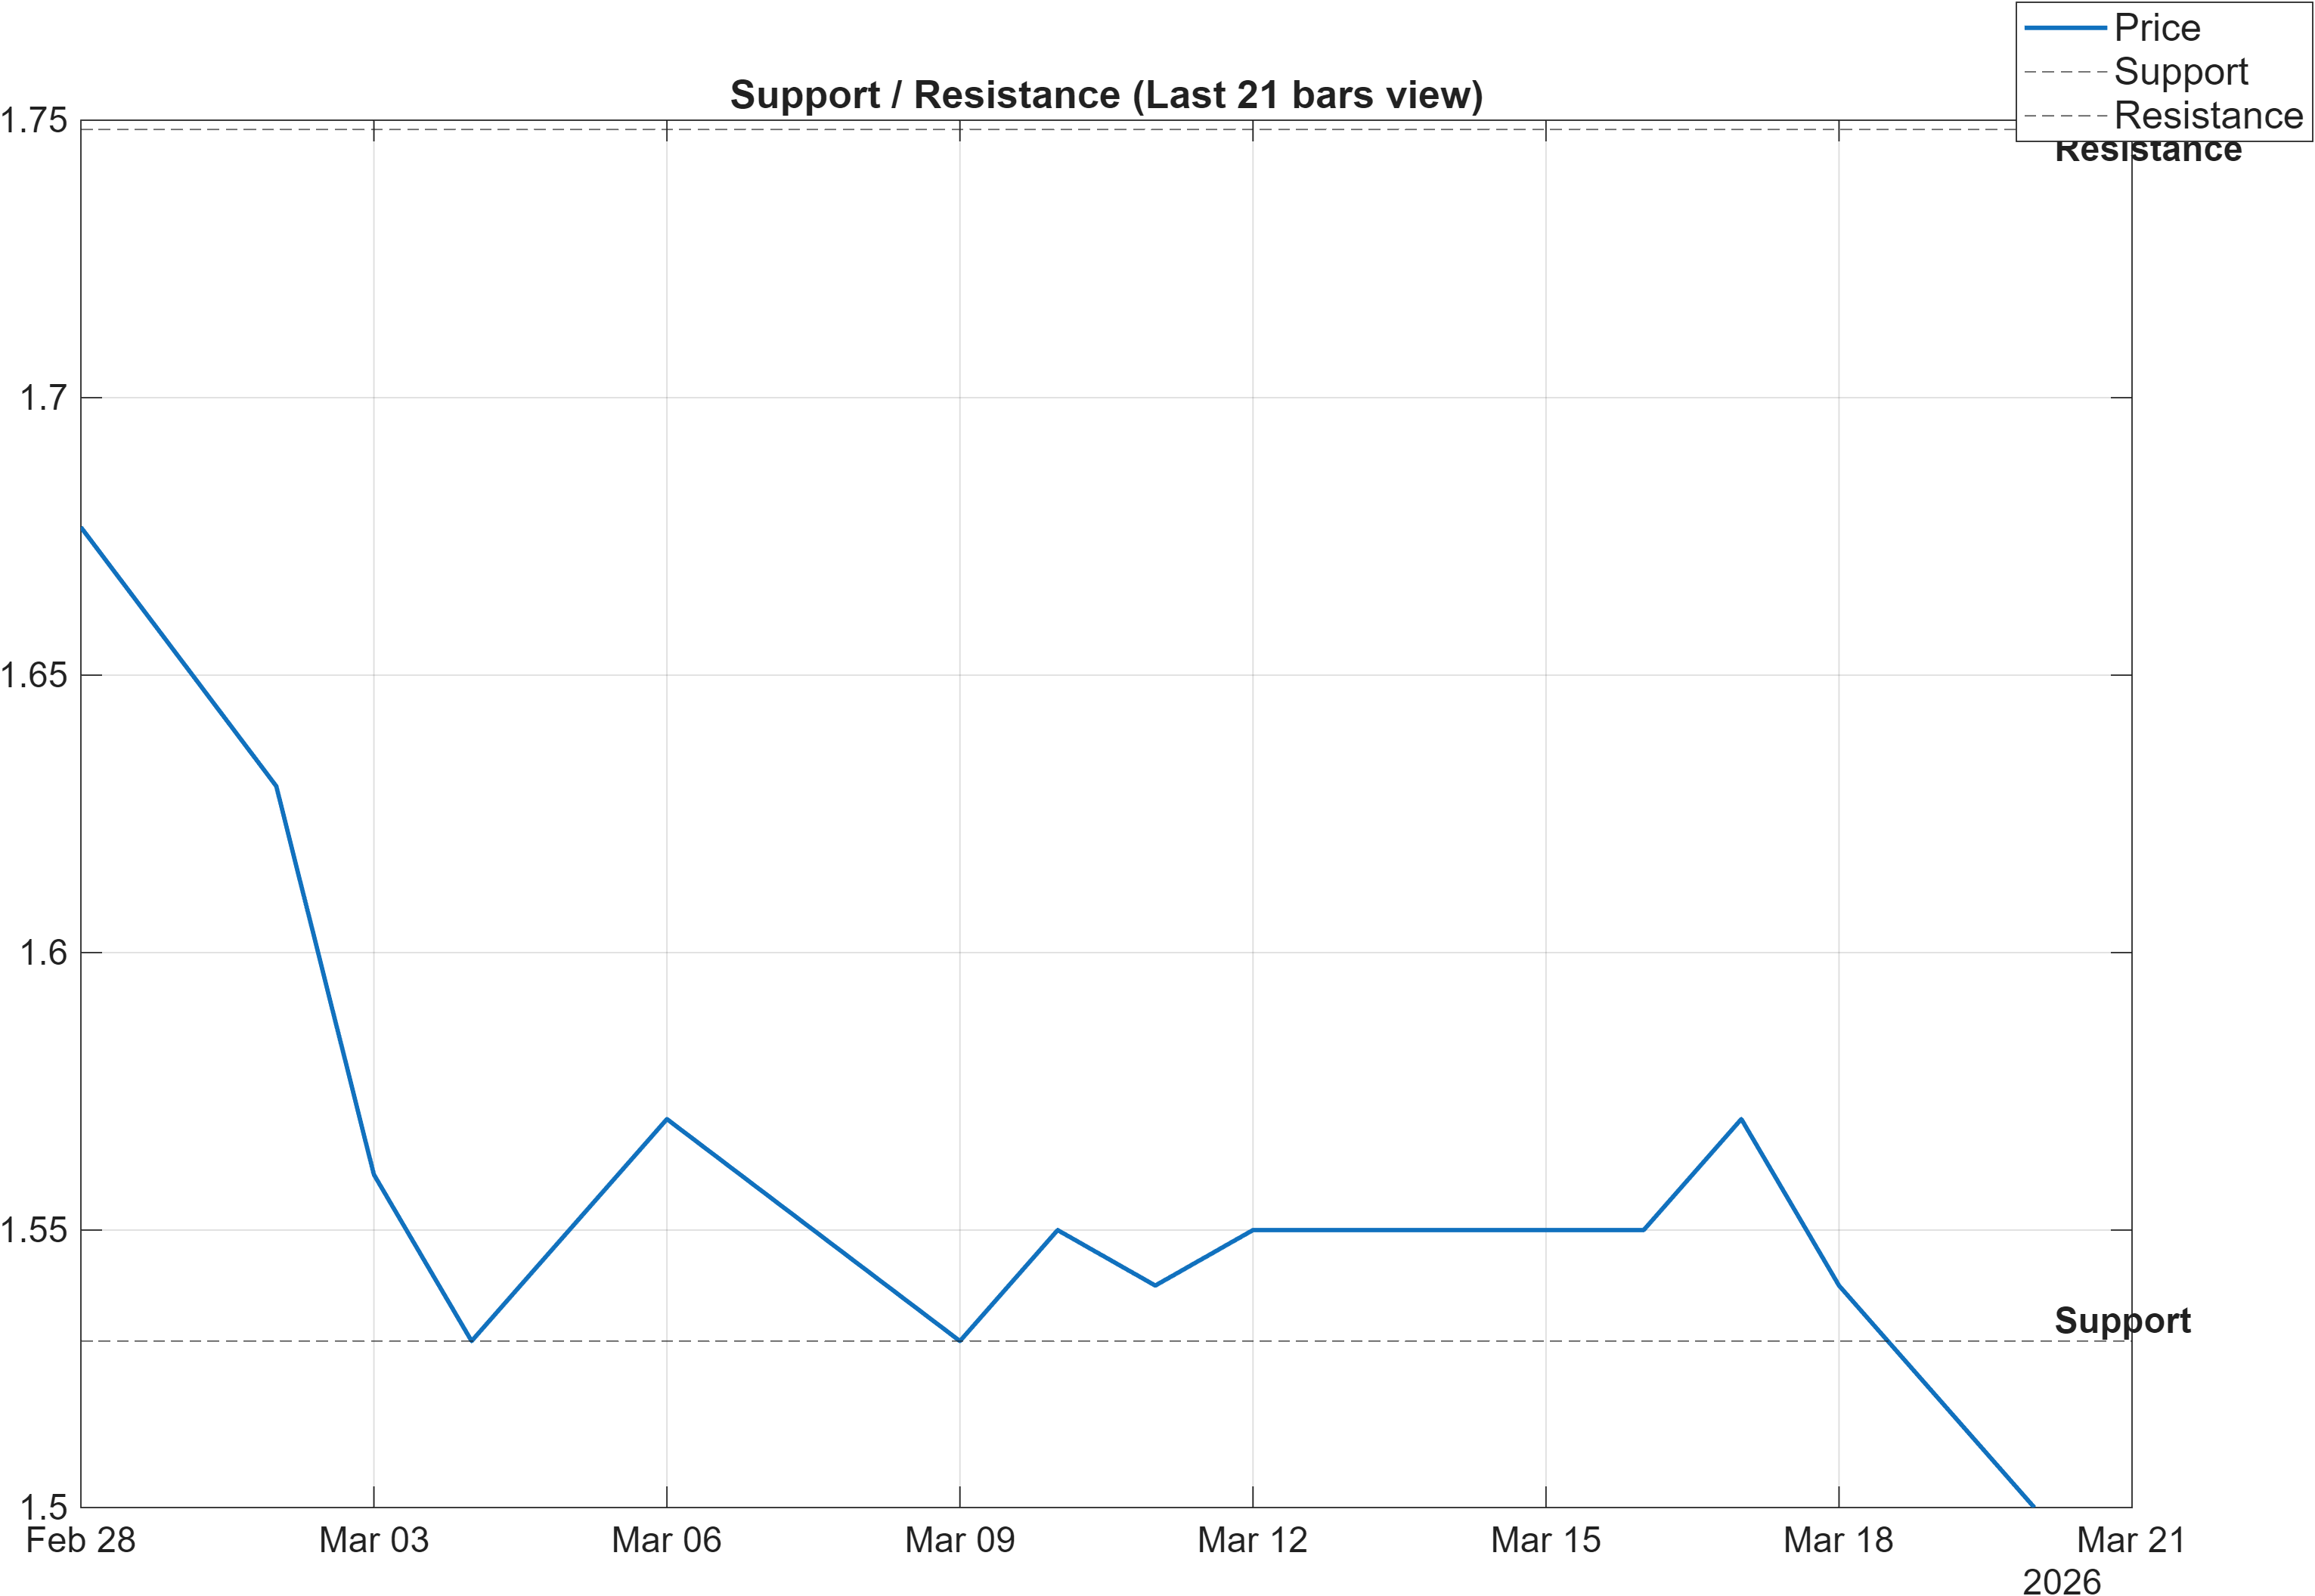
Scenario view: Break above resistance with volume → continuation. Close below support → signal deterioration risk.
Decision zones: where probability shifts tend to cluster
The current structure is anchored by a well-defined band between 1.5300 (support) and 1.7483 (resistance). With the moving-average read still bearish, these levels function less as “targets” and more as decision zones where positioning tends to change: support as the line between stabilization and renewed deterioration, and resistance as the threshold between corrective bounces and trend repair.
The momentum backdrop strengthens the importance of these zones. A depressed RSI(14) of 29.41 often coincides with higher sensitivity around support: failures can produce quick follow-through, while successful holds can lead to sharp, mean-reverting rebounds. Meanwhile, the modestly positive MACD histogram (0.0035) suggests that if price can reclaim and hold above resistance, the market may be shifting away from pure downside acceleration toward a more balanced regime.
Volatility being contained (bandwidth 0.0876) reinforces the idea that the next informative move may be a breakout from compression. In compression, false breaks are possible; therefore, confirmation quality matters. The embedded scenario guidance is appropriately conditional: a break above 1.7483 with volume is treated as continuation confirmation, while a close below 1.5300 increases deterioration risk.
Structurally, this creates a clean framework for interpreting subsequent signals: improvements in ranks and technical scores are more credible if they occur alongside acceptance above 1.7483; conversely, a breakdown below 1.5300 would align the multi-signal dashboard with the weakest short-horizon rank behavior.
5) Quant Technical Dashboard (18 Signals)
KGNAI AI Technical Analysis Score (Deep Reinforcement Learning): Rank #1161 out of 1293 (Rank 1 represents the strongest technical positioning and a higher probability of favorable price behavior. As ranks increase toward the maximum, the probability of favorable outcomes weakens and bearish positioning becomes more dominant.) | Label: Bearish | Score: -0.796
18-Signal Technical Confluence Score: -0.278 (Neutral)
Overall Technical Score (18-signal confluence + DRL rank blend): -0.433 (Bearish)
Note: The blended score reflects signal strength weighted against broader AI technical ranking, which may temporarily diverge.
Blended technical score breakdown: -0.433 (Bearish | Bull 5 / Bear 10 / Neutral 3)
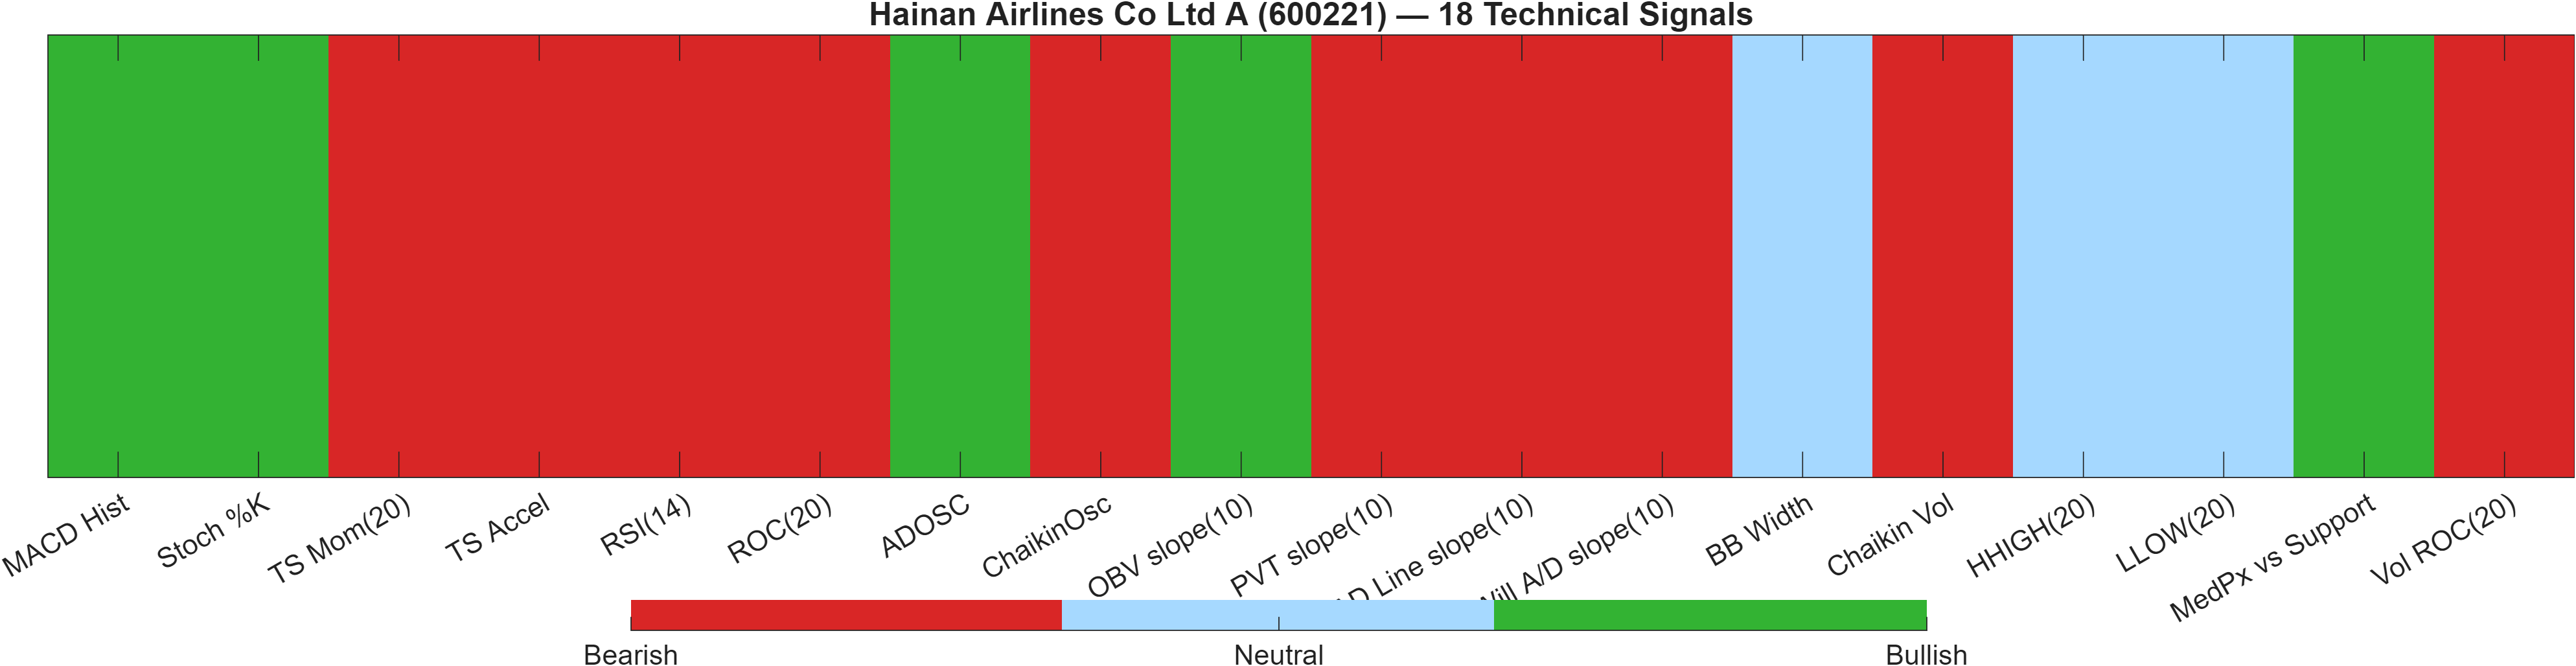
Confluence vs AI rank blend: why “Neutral” can still resolve Bearish
The dashboard highlights a meaningful divergence between signal-level confluence and the broader AI technical rank overlay. The 18-signal confluence score (-0.278) is labeled Neutral, yet the Overall Technical Score (-0.433) shifts to Bearish. This is consistent with the DRL technical rank (#1161 of 1293), which places the technical posture in a weak cross-sectional context even if a subset of indicators is attempting to stabilize.
Internally, the blend breakdown (Bull 5 / Bear 10 / Neutral 3) explains the bias: bearish signals dominate enough to outweigh incremental bullish pockets. The indicator mix also aligns with the momentum/trend discussion: depressed momentum (e.g., RSI(14) 29.41) and negative rate-of-change readings (e.g., ROC(20) -9.274) are consistent with a market still repairing from weakness, even when some oscillators and histogram measures begin to improve.
From a regime perspective, this is a classic transition-risk configuration: the tape can produce short, sharp mean-reversion rallies, but the model blend remains cautious until broader participation and trend filters improve. With BB Width 0.08761 marked Neutral, the market is not presenting as a high-volatility breakout; therefore, the burden of proof shifts to structural confirmation around the resistance zone.
Signal table (Bull/Bear/Neutral)
| Indicator | Value | Signal |
|---|---|---|
| MACD Hist | 0.003522 | Bullish |
| Stoch %K | 16.67 | Bullish |
| TS Mom(20) | -0.1133 | Bearish |
| TS Accel | -0.03667 | Bearish |
| RSI(14) | 29.41 | Bearish |
| ROC(20) | -9.274 | Bearish |
| ADOSC | 20 | Bullish |
| ChaikinOsc | -3.961e+08 | Bearish |
| OBV slope(10) | 1.714e+08 | Bullish |
| PVT slope(10) | -1.679e+06 | Bearish |
| AD Line slope(10) | -1.402e+09 | Bearish |
| Will A/D slope(10) | -0.02 | Bearish |
| BB Width | 0.08761 | Neutral |
| Chaikin Vol | 23.97 | Bearish |
| HHIGH(20) | 1.683 | Neutral |
| LLOW(20) | 1.51 | Neutral |
| MedPx vs Support | 0.025 | Bullish |
| Vol ROC(20) | -24.07 | Bearish |
Interpretation: Indicator-level signals form the base confluence, which is then adjusted using a separate AI-driven technical ranking model. The final technical score summarizes this combined view.
6) News sentiment + extractive gist
Note: Instrument-specific news matches were not found, so the digest includes broader market/sector headlines. Links are provided for verification.
Sentiment score (avg): 0.000 | Positive: 0% | Neutral: 100% | Negative: 0%
KGNAI AI News Sentiment Score (normalized -1 to +1): Not available (as of —) | Label: Not available | Overall news score: 0.00
Positive Developments
Recent coverage across major financial outlets is not presenting instrument-specific catalysts for 600221 in the provided dataset, but the broader flow remains largely non-directional and therefore can be viewed as indirectly supportive for a technically fragile tape. With the sentiment distribution at Neutral 100% and the average score at 0.000, the news backdrop is not adding incremental pressure to an already bearish short-term rank setup. In regimes where the moving-average structure is weak (Close vs MA50 = Bearish; MA50 vs MA200 = Bearish) and momentum is stressed (RSI(14) 29.41), the absence of negative narrative reinforcement can matter: it reduces the probability that technical breaks are immediately amplified by adverse headline shocks. This does not create a bullish thesis; rather, it maintains a cleaner environment for evaluating price acceptance around support 1.5300 and resistance 1.7483 without heavy event-driven distortion.
Neutral / Mixed Developments
The dataset’s news mapping indicates no instrument-specific matches, and the sentiment module reflects an evenly neutral posture: 0% positive, 0% negative, and 100% neutral. That is consistent with a market state where price discovery is being led by technical structure and positioning rather than fresh fundamental updates. From an interpretation standpoint, this neutrality aligns with the mid- and longer-horizon ranks that sit in the Neutral zone (e.g., Monthly #830 and Yearly #639), even as the short horizon remains weak. With volatility contained (bandwidth 0.0876), neutral news often coincides with range-defined trading, where the most reliable signals come from level interaction and follow-through rather than narrative.
Negative / Risk Signals
The primary risk signal in this section is informational absence: the KGNAI AI News Sentiment Score is marked as Not available (as of —), and the digest is explicitly built from broader market/sector items rather than company-linked coverage. In practice, that limitation increases reliance on price-based validation. When the technical blend is already Bearish (overall technical score -0.433 and DRL rank #1161), a lack of instrument-level news can leave the market more sensitive to purely technical breakdowns—particularly a close below 1.5300 as flagged in the scenario view. Additionally, a “flat” sentiment reading (0.000) should not be interpreted as safety; it simply implies the model is not detecting directional tone in the mapped coverage, which may lag fast changes in tape behavior.
- What to monitor next: Whether price can reclaim 1.7483 with observable participation (volume confirmation).
- What to monitor next: Any retest behavior around 1.5300 and whether closes remain above that zone.
- What to monitor next: Whether momentum improves from RSI(14) 29.41 without volatility expansion beyond bandwidth 0.0876.
Snapshot: AI Rank (Short–Mid–Long): Mixed (Bearish–Neutral–Neutral) · Technical Confluence: Neutral · Key Levels: Support ~1.53 | Resistance ~1.75 · News Sentiment: Neutral
Sources referenced: Reuters, Bloomberg, Yahoo Finance, MarketWatch, Investing.com
7) Sources
Not available in the provided data.
You may also like: How KGNAI AI ranks instruments across global markets
Disclaimer: KGNAI provides AI-generated analytics and educational market commentary only. This is not financial advice. Markets involve risk. Always do your own research.