
688158 — UCloud Technology Co Ltd (18-Mar-2026) | Bearish rank profile with neutral technical confluence
KGNAI’s latest read on UCloud Technology Co Ltd (688158) combines cross-universe ranks, multi-signal technical structure, and systematically processed news sentiment as of 18-Mar-2026. The rank profile is weak across key horizons, with the Daily rank #1110 and Monthly rank #1141 sitting in the lower tail of a 1293-instrument China universe—consistent with a cautious stance despite pockets of near-term technical firmness. On charts, moving-average positioning is constructive (Close vs MA50 bullish and MA50 vs MA200 bullish), while momentum and participation measures are less uniform: RSI(14) at 62.75 leans supportive, but MACD histogram at -0.2662 remains a drag. Volatility is not compressed, with Bollinger bandwidth at 0.4436, keeping level-defined execution relevant. Key decision zones are clearly framed by support ~30.7717 and resistance ~45.6727.
- Rank stance: Short-term Bearish | Mid-term Bearish | Long-term Neutral
- Technical confluence: Neutral (18-signal confluence 0.000; blended technical -0.049)
- Key levels: Support 30.7717 | Resistance 45.6727
- News sentiment bias: Neutral (avg 0.000; Positive 6% / Neutral 88% / Negative 6%)
- Confirmation / invalidation: A break above 45.6727 with volume supports continuation; a close below 30.7717 raises deterioration risk.
KGNAI evaluates assets using large cross-sectional datasets built from millions of structured data points. Inputs incorporate fundamental metrics, technical structures, and systematically processed news sentiment. Statistical models, machine learning, and AI frameworks are used to assess relative positioning, signal alignment, and probabilistic behavior across broad universes.
- Ranks are comparative across the tracked universe, not absolute price targets.
- Confluence reflects alignment among independent signal groups.
- Support/resistance levels are probabilistic decision zones, not guarantees.
- Sentiment provides contextual bias within the broader analytical framework.
1) KGNAI AI Analysis
Region: CHINA
Total universe size: 1293 ranked instruments
- Daily rank: #1110 out of 1293 — Bearish
- Weekly rank: #936 out of 1293 — Neutral
- Monthly rank: #1141 out of 1293 — Bearish
- 3-Monthly rank: #1037 out of 1293 — Bearish
- 6-Monthly rank: #1018 out of 1293 — Neutral
- Yearly rank: Not available for this horizon — Not available
The cross-horizon rank pattern places 688158 in the lower segment of the tracked universe on the most decision-sensitive windows. A Daily rank of #1110 and Monthly rank of #1141 imply persistent relative weakness versus peers, even though the Weekly rank (#936) and 6-Monthly rank (#1018) sit closer to the middle of the distribution and are labeled Neutral. This shape—bearish at short and medium horizons with a less negative longer window—often appears when a market is attempting to stabilize, but has not yet earned broad confirmation across independent tests.
The stated term view summarizes that balance directly: Short-term Bearish, Mid-term Bearish, Long-term Neutral. From a market-structure lens, that configuration typically increases sensitivity to level breaks and participation quality: improvements can register quickly in shorter horizons, but the monthly/three-month ranks suggest the broader cross-sectional signal set still penalizes the instrument.
KGNAI ranks each instrument across large universes using multiple proprietary AI tests and statistical models (millions of data points). Lower ranks generally indicate stronger probability of favorable performance behavior, while higher ranks indicate weaker probability and more bearish positioning. Within this framework, the current placement argues for selectivity—favoring clearer technical confirmation before treating short-term strength as regime change.
Want the full universe and complete rank tables? Unlock full access on KGNAI: https://www.kgnai.com/pricing
2) Price & trend overview
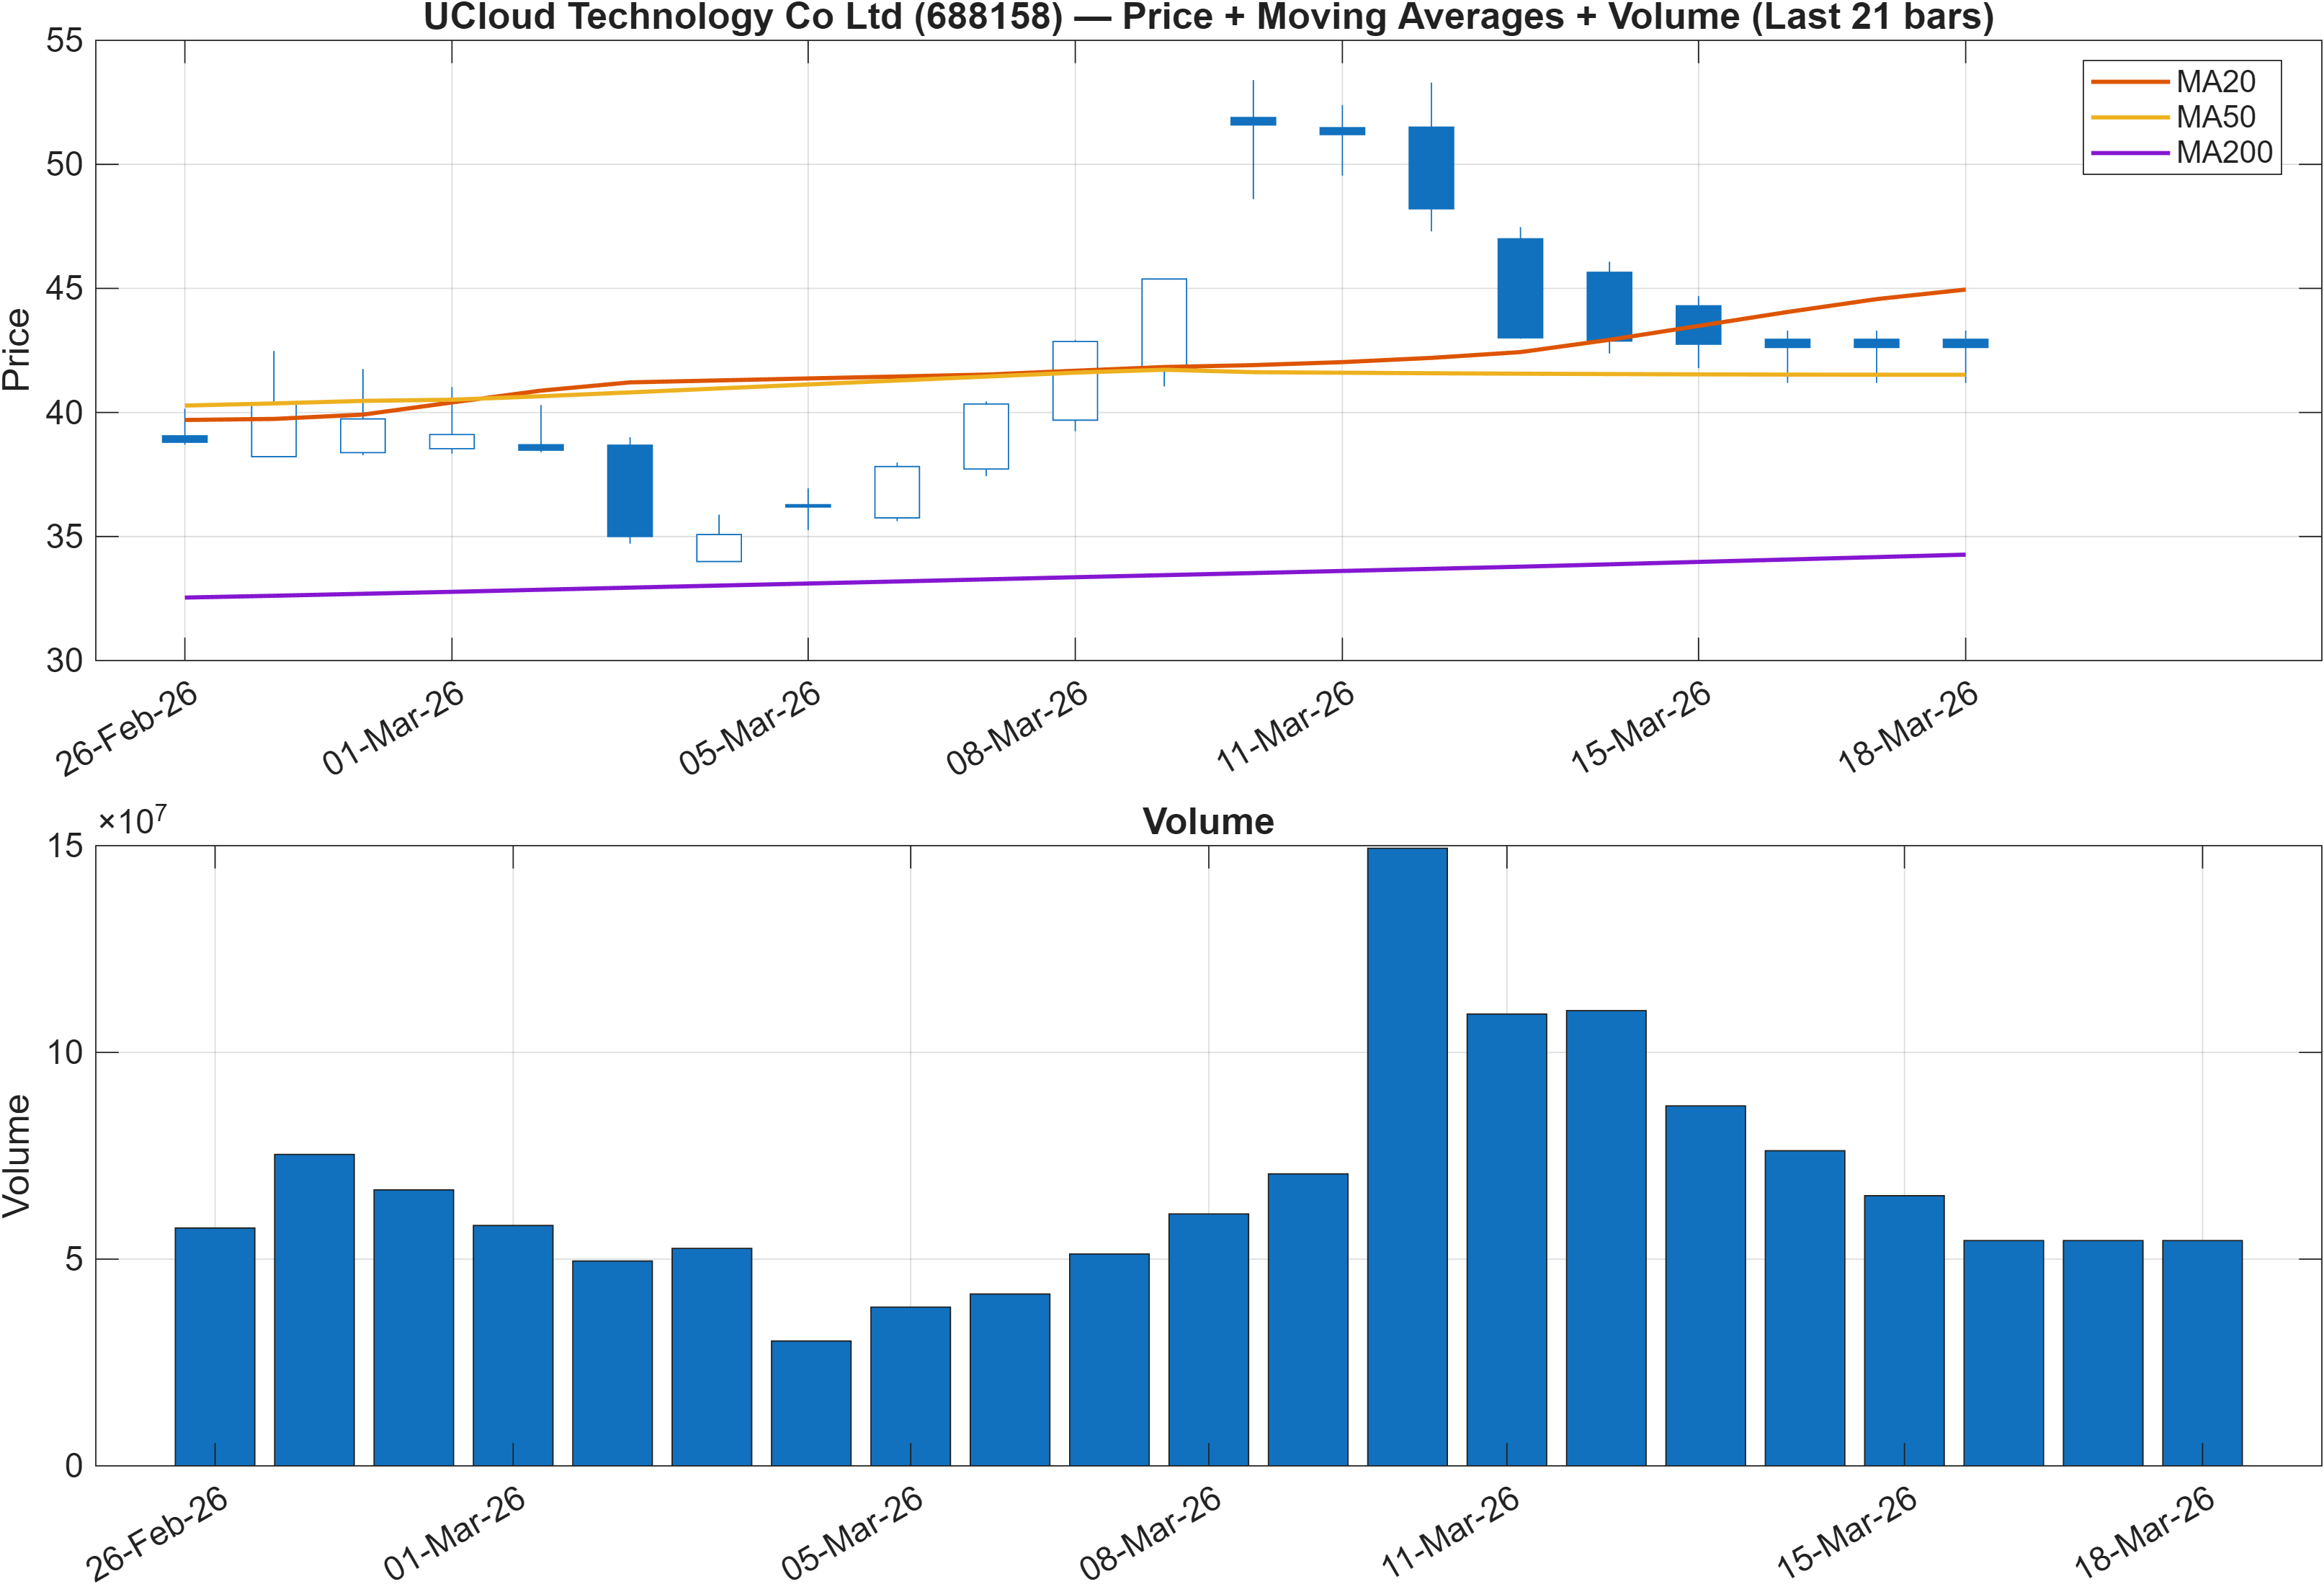
Trend diagnostics show an important split between trend structure and cross-sectional rank positioning. On the chart overlay, both moving-average conditions are flagged bullish: Close vs MA50 is bullish and MA50 vs MA200 is bullish. In isolation, that combination is commonly associated with constructive trend persistence and a market that has managed to keep price above an intermediate anchor while maintaining a positive longer-term slope relationship.
However, the broader rank stack (notably #1110 daily and #1141 monthly) suggests that—relative to the 1293-instrument universe—this trend structure has not translated into consistently favorable behavior across the full set of tests KGNAI applies. This is often the signature of a trend that is narrow (supported by fewer confirming dimensions) or fragile (sensitive to marginal changes in flow or volatility).
The practical implication is not that the moving-average read is “wrong,” but that it may be incompletely confirmed by other families of signals (momentum quality, participation, volatility regime, and level interactions). With clearly defined zones later in the report—30.7717 support and 45.6727 resistance—trend-following interpretation becomes conditional: continuation is more credible when price behavior respects those zones and volume/participation indicators stop diverging.
Interpretation: Close vs MA50 = Bullish, MA50 vs MA200 = Bullish.
3) Momentum & volatility dashboard
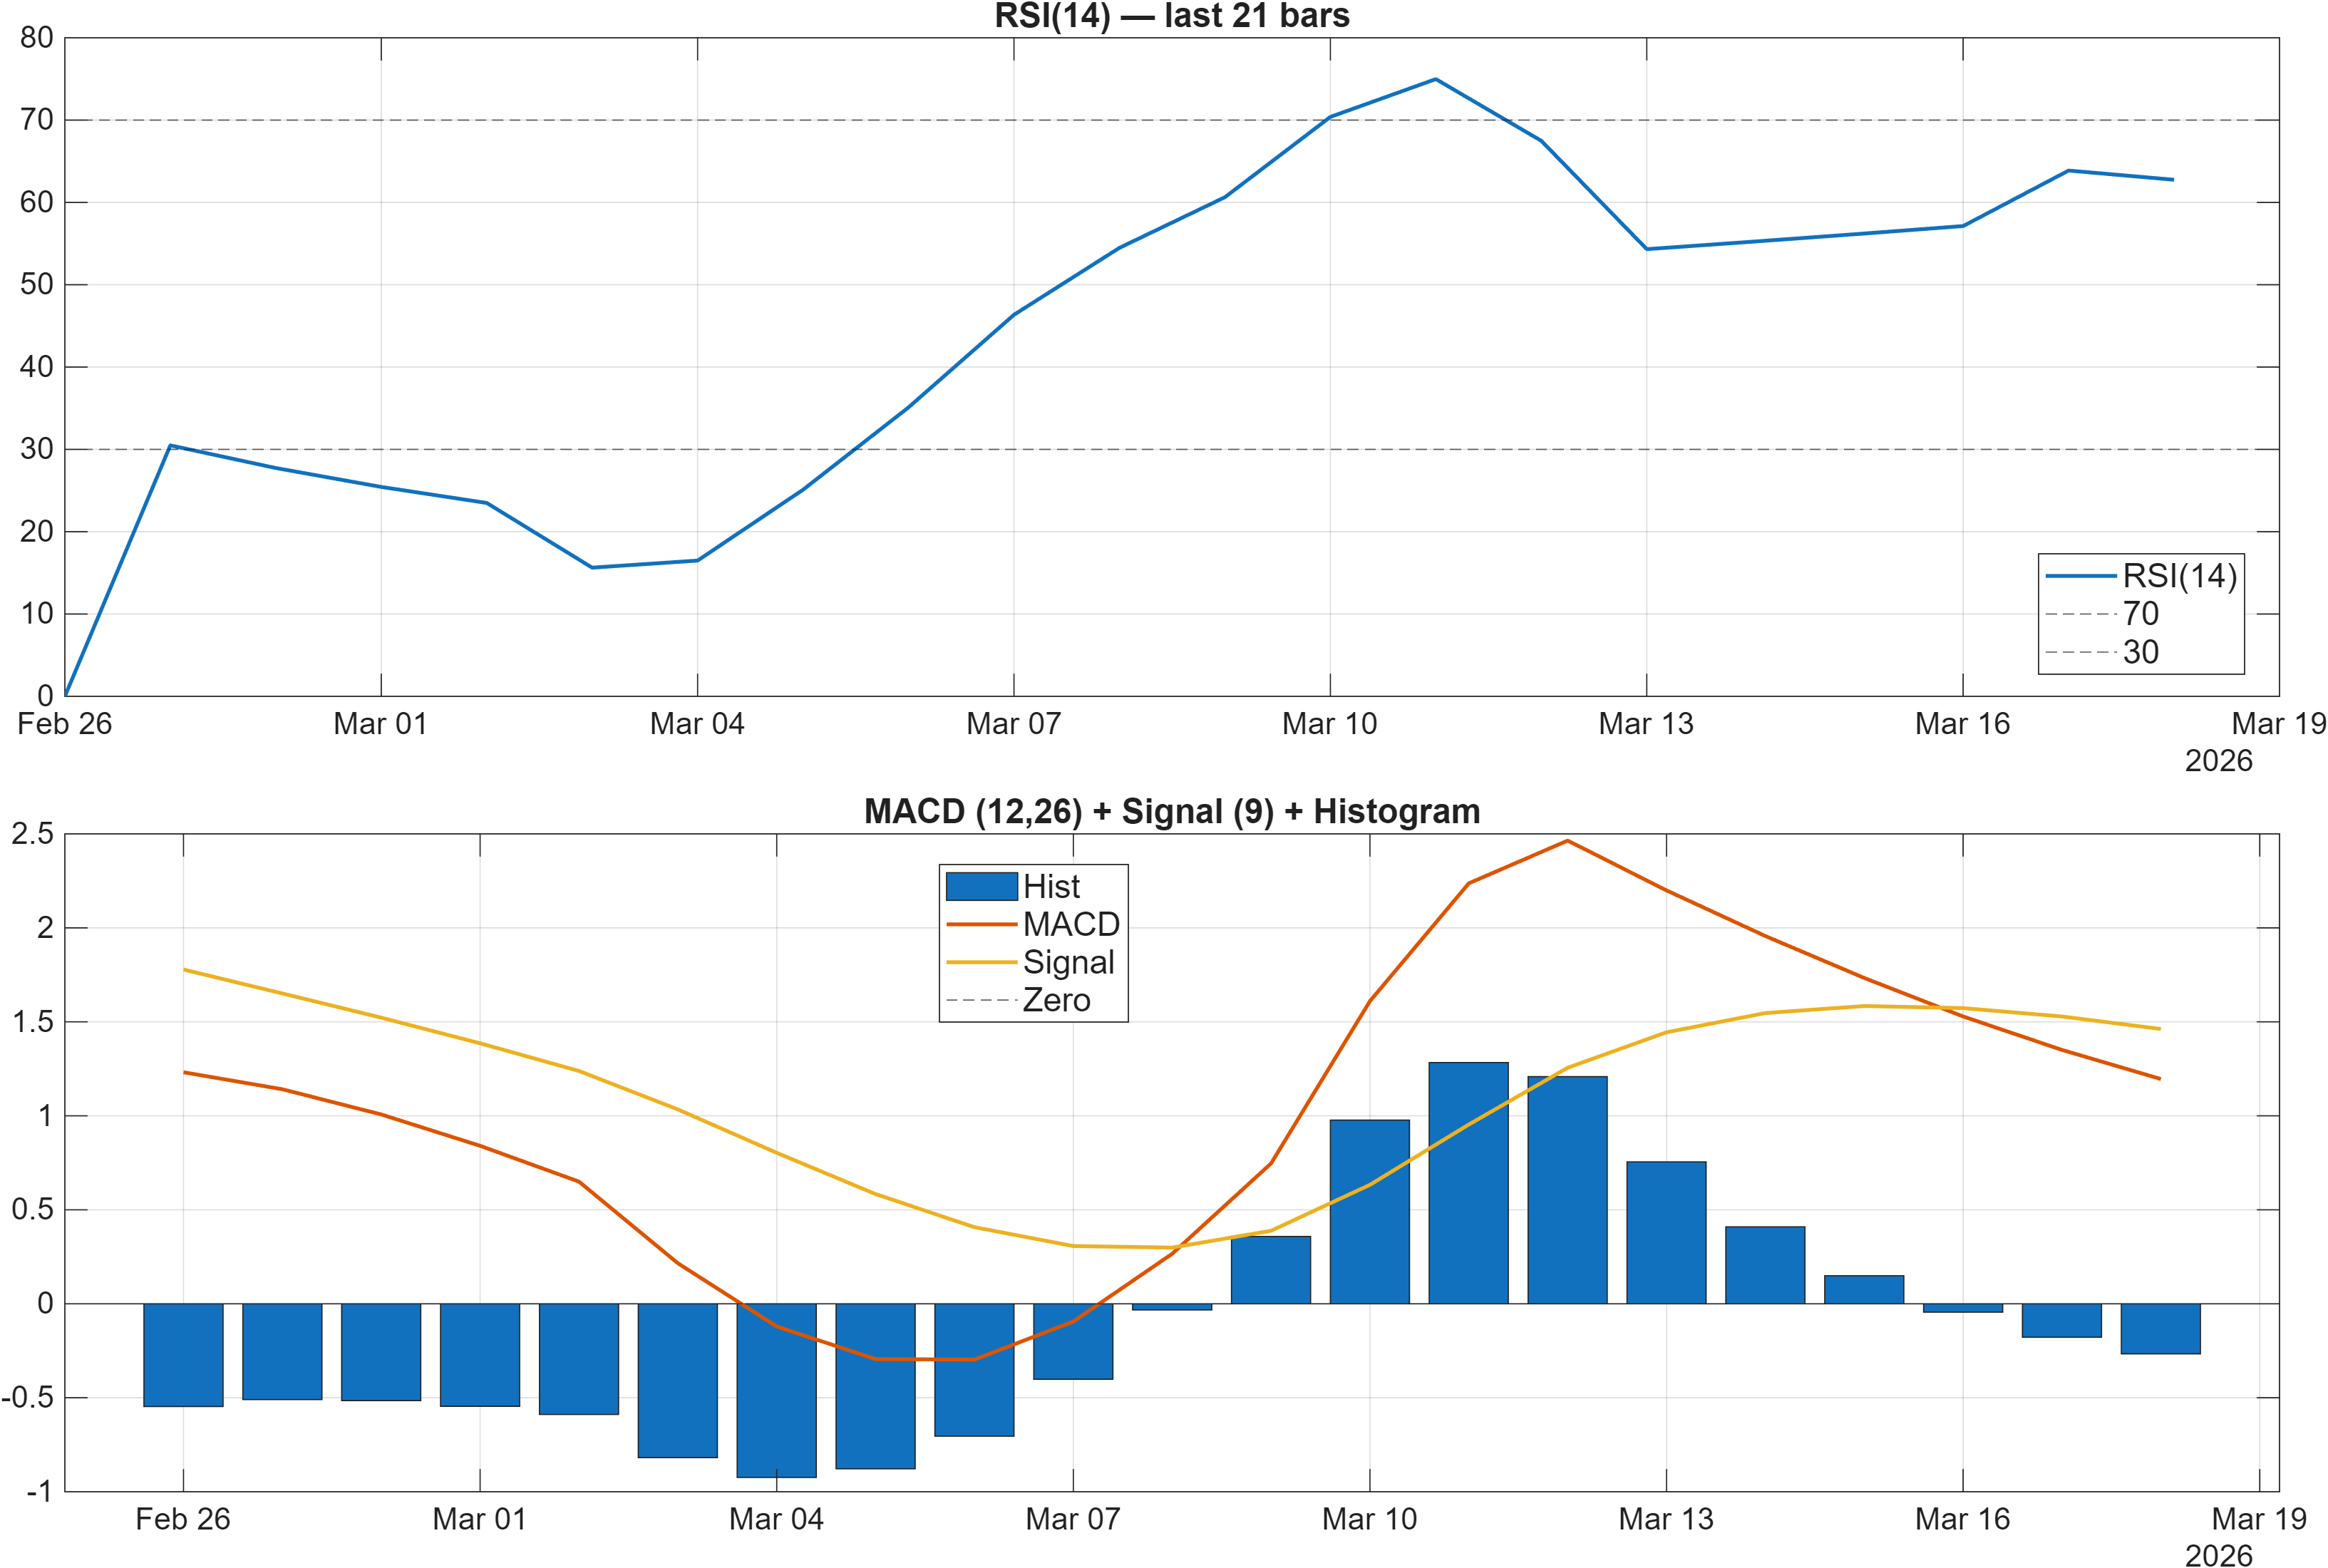
Momentum reads as constructive but not clean. The report flags RSI bias = Bullish, supported by RSI(14) at 62.75, a level typically associated with sustained upside pressure rather than mean-reversion weakness. At the same time, the MACD histogram is -0.2662, indicating that the more “trend-and-cycle” oriented momentum measure remains on the bearish side. This divergence is meaningful: RSI can stay elevated in an advancing tape, while MACD histogram negativity can signal decelerating upside impulse or lagging follow-through.
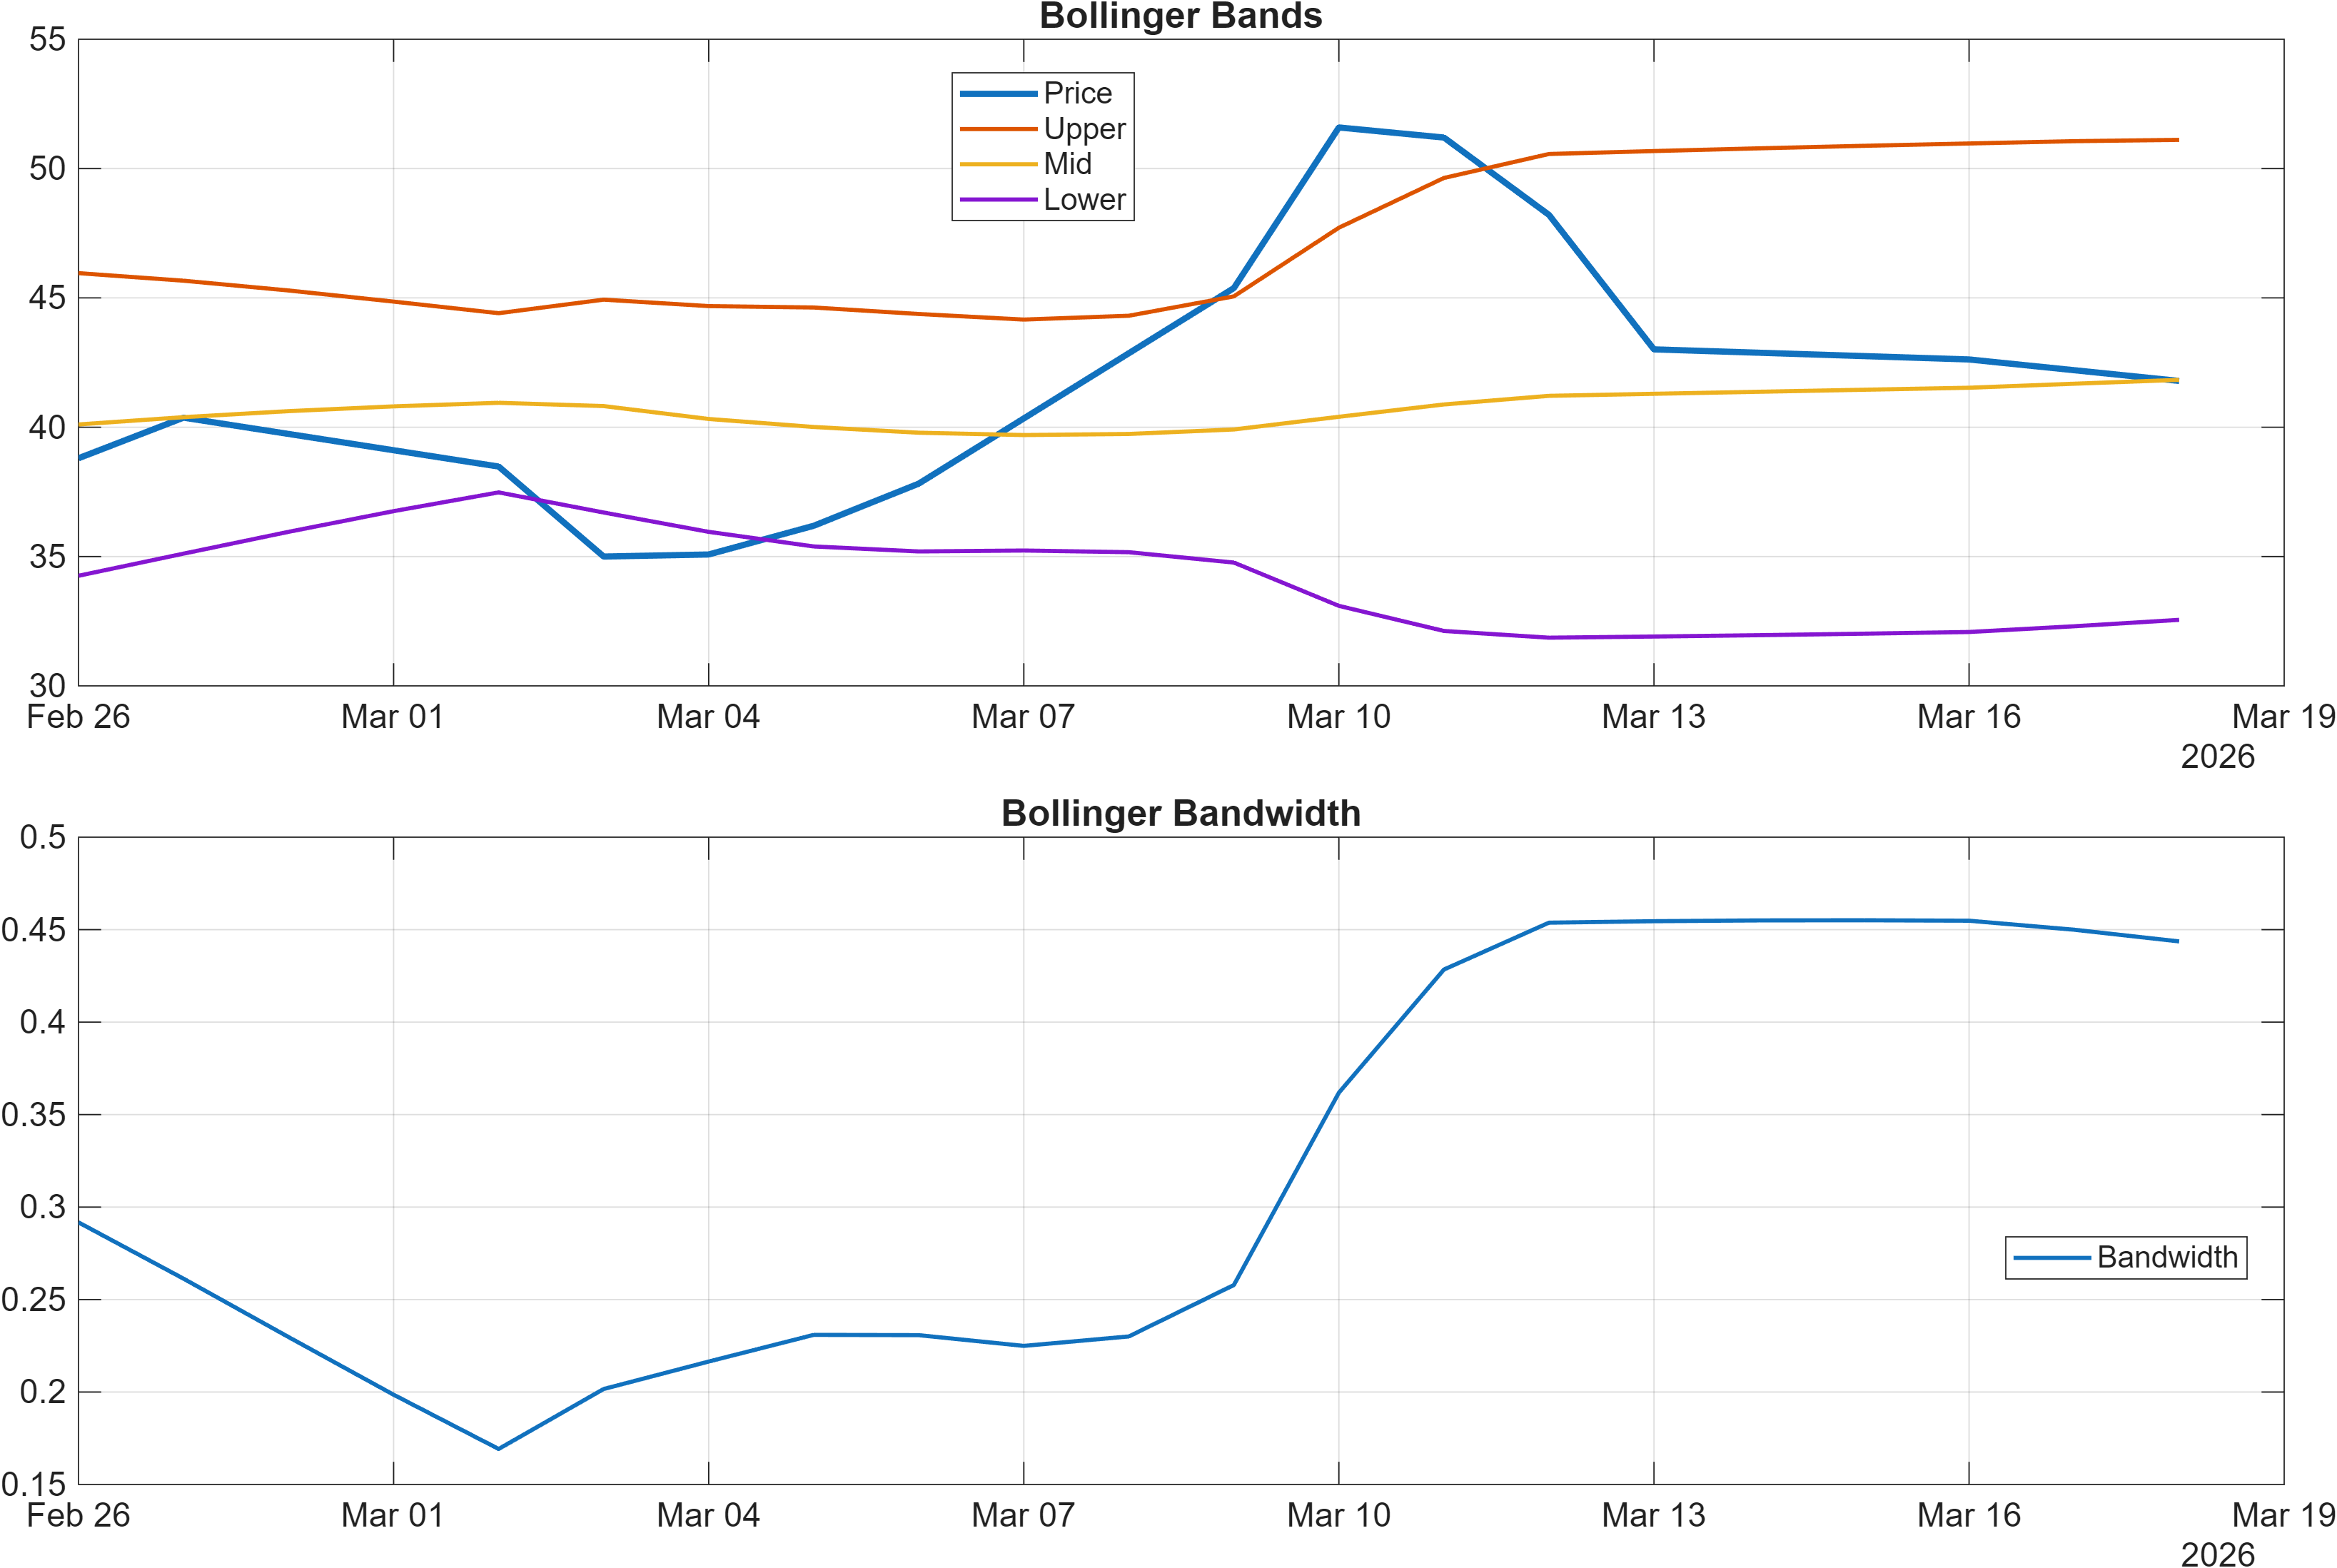
Volatility regime adds another layer. The Bollinger bandwidth at 0.4436 suggests volatility is present rather than tightly compressed. When bandwidth is not compressed, breakouts and breakdowns can be less linear, with wider intraday/weekly swings that challenge signal stability—especially when momentum indicators disagree. In that environment, momentum confirmation tends to be more reliable when it aligns with participation measures and level breaks (covered in Sections 4–5).
The key analytical point is signal dispersion: bullish RSI alongside bearish MACD histogram can precede either (a) a MACD catch-up if trend persists, or (b) a rollover if the market fails to maintain higher lows and momentum breadth deteriorates. Given the weak cross-sectional ranks (e.g., monthly #1141), the burden of proof leans toward waiting for confirmation rather than assuming the RSI read will dominate.
Interpretation: RSI bias = Bullish, MACD hist = -0.2662.
Interpretation: Bandwidth (volatility regime) latest = 0.4436.
4) Support / Resistance zones
Support ~ 30.7717 | Resistance ~ 45.6727
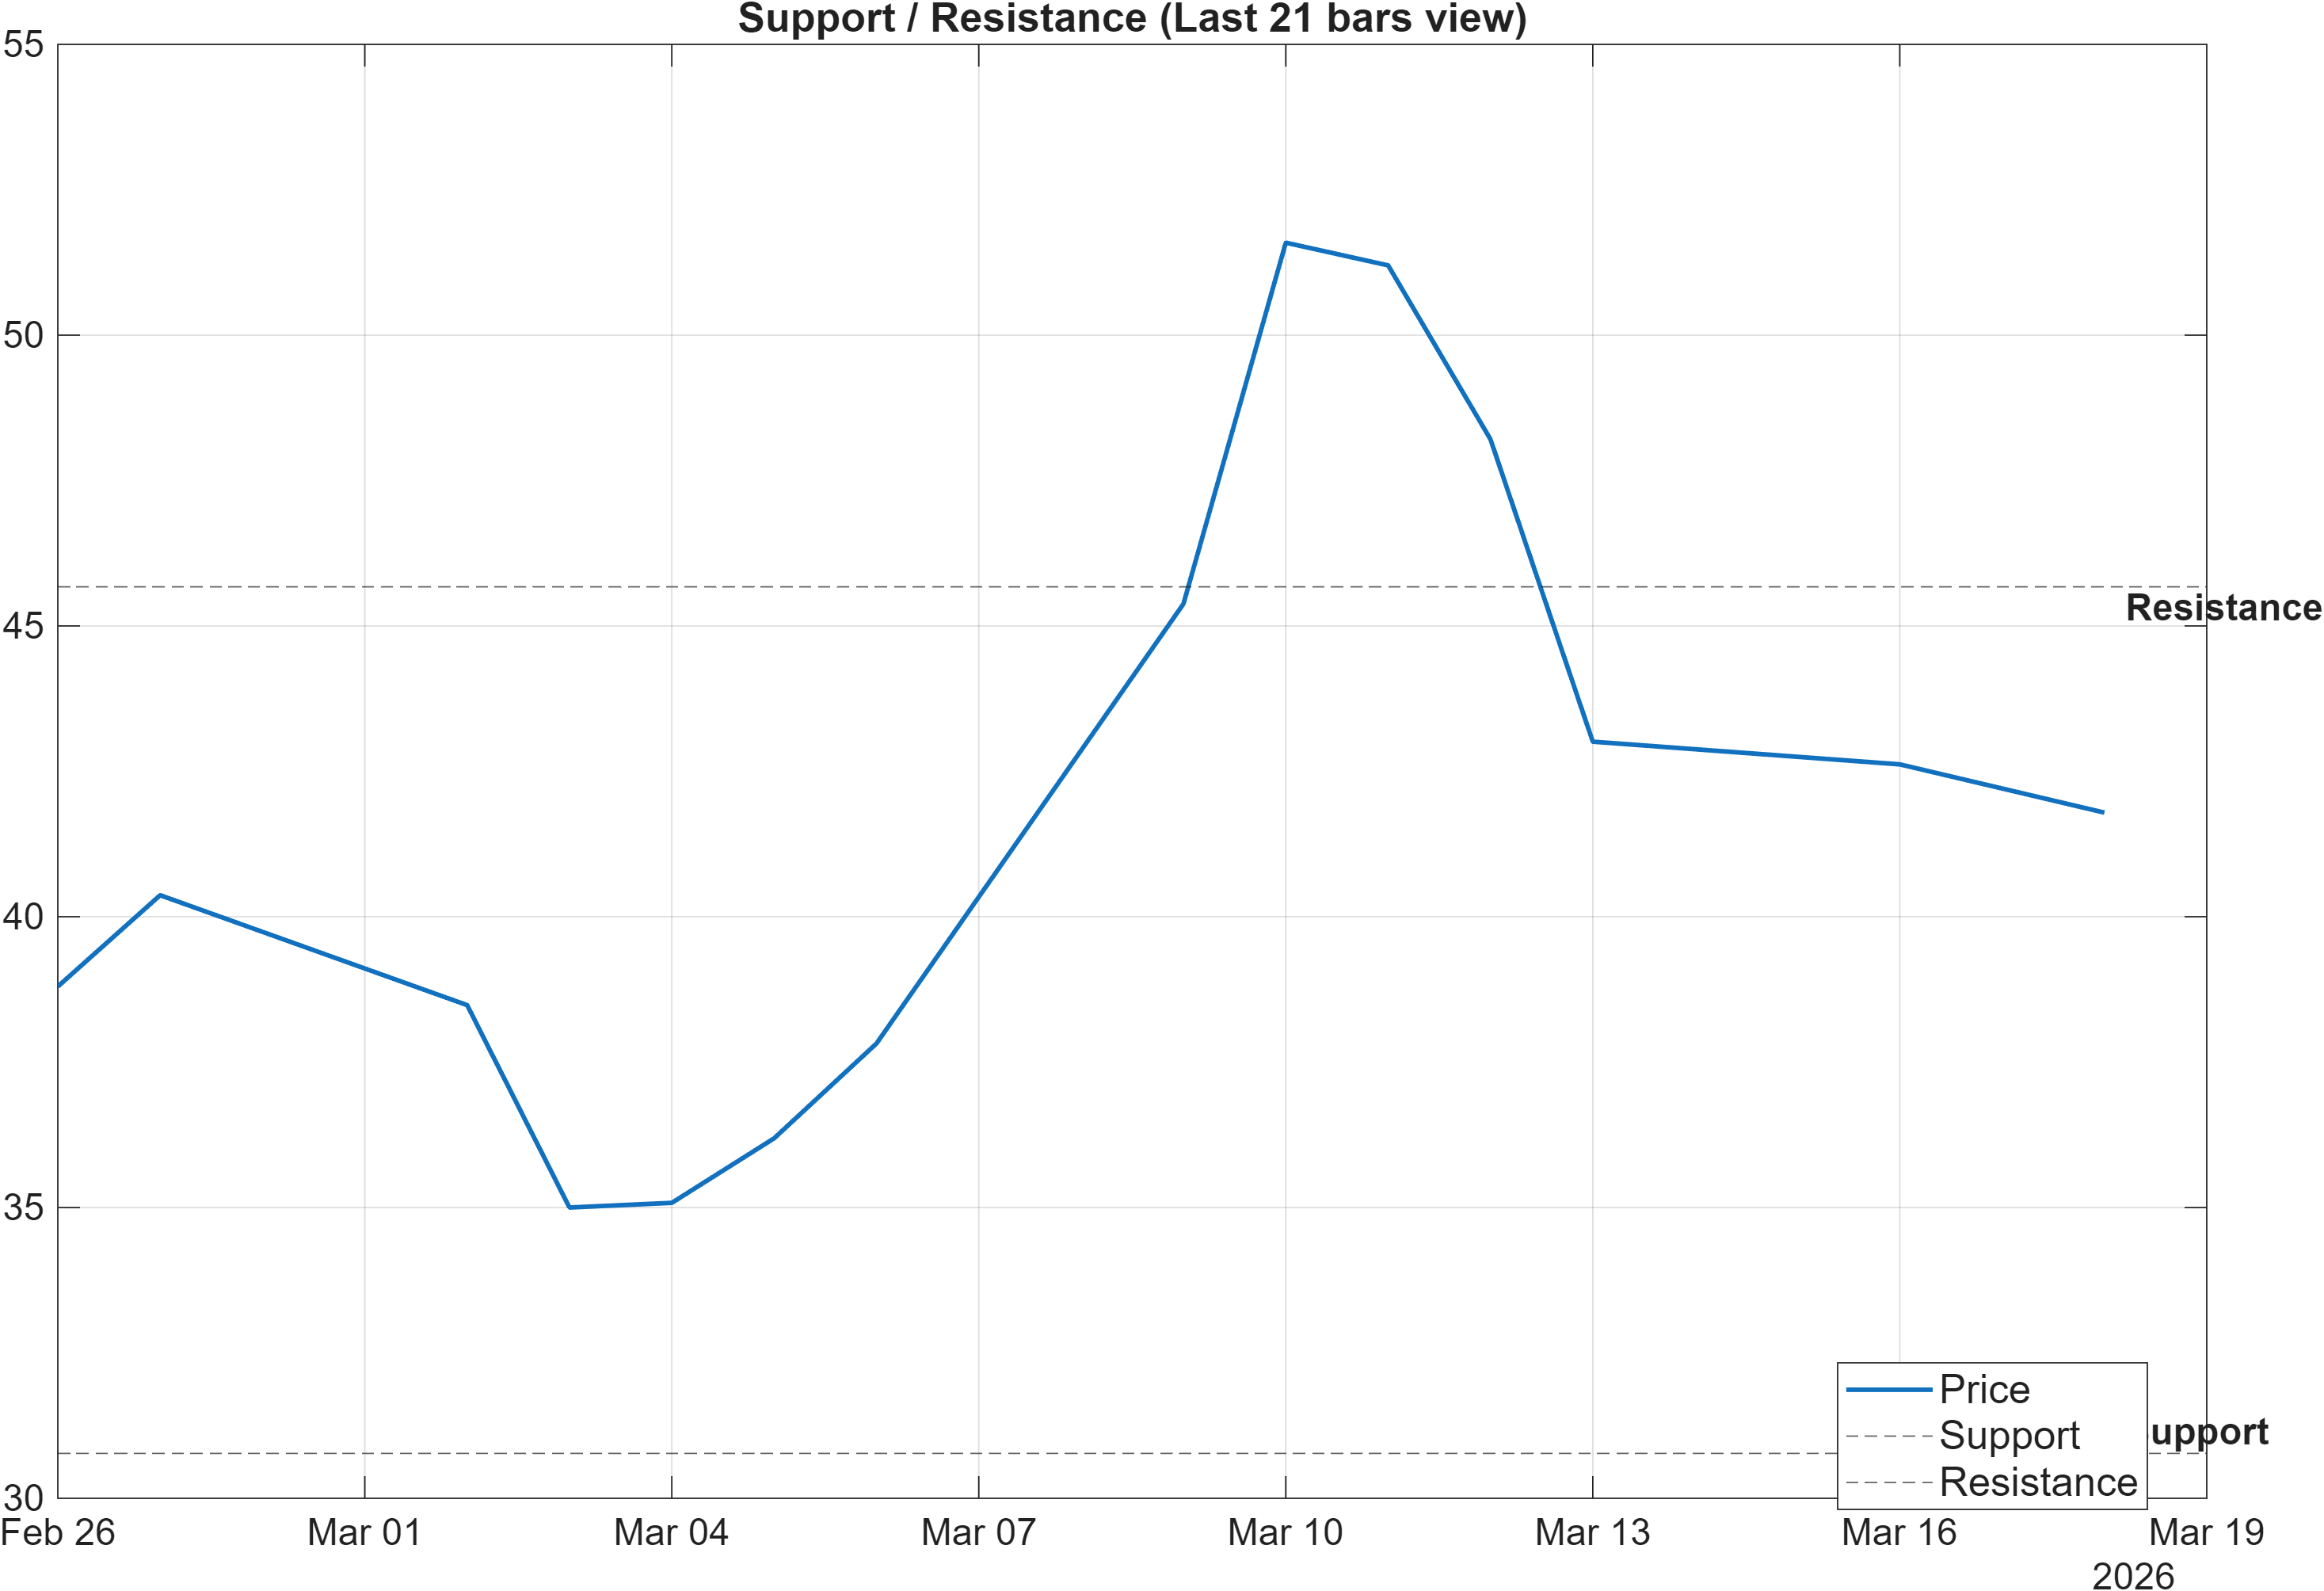
The level map frames the report’s highest-signal decision points. With support near 30.7717 and resistance near 45.6727, the price is effectively operating within a defined probabilistic corridor. This matters more when indicator confirmation is mixed (bullish RSI versus bearish MACD histogram), because levels provide an external constraint on interpretation: momentum can look constructive, but if price cannot resolve higher through resistance, the “trend” becomes susceptible to rotation and retracement.
The scenario guidance is explicitly conditional and fits the current regime: a break above resistance with volume supports continuation, while a close below support elevates deterioration risk. Notably, the participation and volume change signals elsewhere in the dashboard include a Vol ROC(20) of -27.66 (bearish), which raises the bar for treating upside breaks as durable unless the breakout is accompanied by observable participation improvement.
In a cross-sectional context where the instrument ranks poorly (for example, daily #1110), levels can also function as risk gates: the market can remain technically “neutral” in blended scoring, but still deliver unfavorable outcomes if it loses the key support zone. Conversely, reclaiming and holding above resistance can help resolve the present dispersion by forcing lagging indicators and ranks to reprice.
Scenario view: Break above resistance with volume → continuation. Close below support → signal deterioration risk.
5) Quant Technical Dashboard (18 Signals)
KGNAI AI Technical Analysis Score (Deep Reinforcement Learning): Rank #752 out of 1293 (Rank 1 represents the strongest technical positioning and a higher probability of favorable price behavior. As ranks increase toward the maximum, the probability of favorable outcomes weakens and bearish positioning becomes more dominant.) | Label: Neutral | Score: -0.163
18-Signal Technical Confluence Score: 0.000 (Neutral)
Overall Technical Score (18-signal confluence + DRL rank blend): -0.049 (Neutral)
Note: The blended score reflects signal strength weighted against broader AI technical ranking, which may temporarily diverge.
Blended technical score breakdown: -0.049 (Neutral | Bull 7 / Bear 7 / Neutral 4)
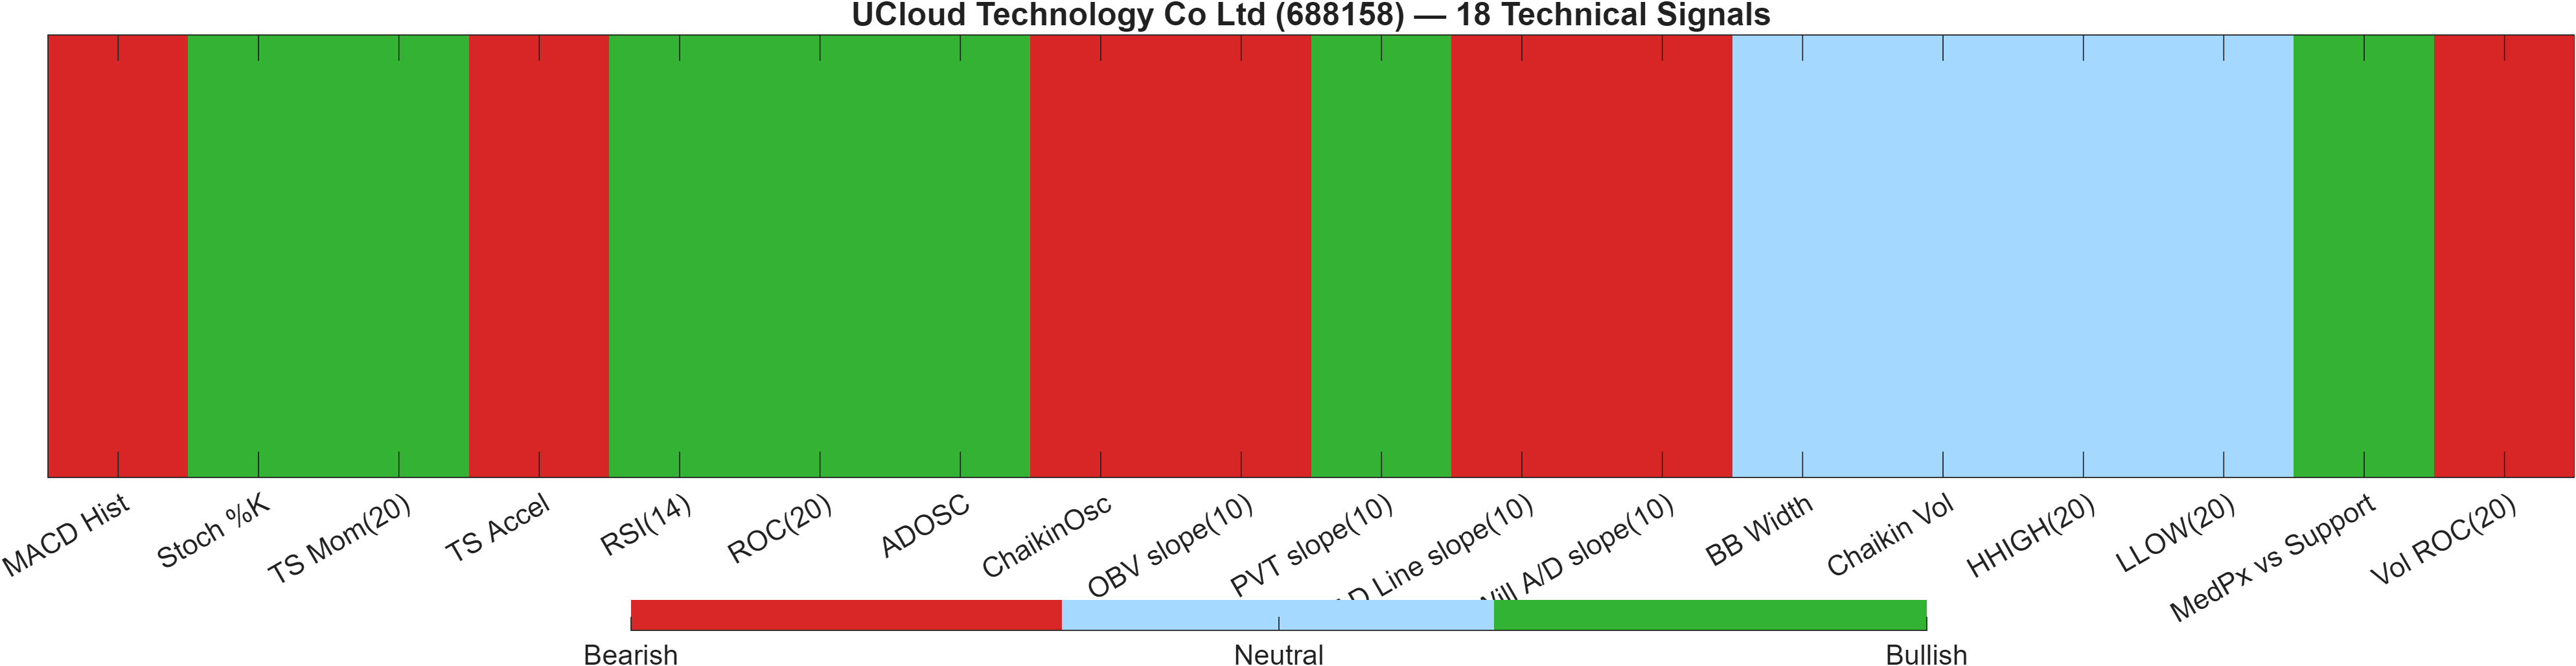
The quant dashboard characterizes 688158 as a neutral confluence setup with meaningful internal dispersion. The 18-signal confluence score is 0.000 (Neutral), and the overall blended technical score is -0.049 (Neutral). Under the hood, the distribution is perfectly balanced—Bull 7 / Bear 7 / Neutral 4—which is often the statistical signature of a market that is tradable but not “easy”: it can move, yet it lacks a dominant multi-factor consensus.
The Deep Reinforcement Learning technical rank provides a separate lens on robustness: DRL rank #752 out of 1293 with a score of -0.163 is labeled Neutral, suggesting the AI model does not see strong edge in either direction based on its learned mapping of technical states to outcomes. This becomes especially relevant given the weak broader ranks (e.g., monthly #1141): a neutral technical state can still coexist with unfavorable relative positioning across the universe.
Signal table (Bull/Bear/Neutral)
| Indicator | Value | Signal |
|---|---|---|
| MACD Hist | -0.2662 | Bearish |
| Stoch %K | 12.71 | Bullish |
| TS Mom(20) | 2.25 | Bullish |
| TS Accel | -3.04 | Bearish |
| RSI(14) | 62.75 | Bullish |
| ROC(20) | 3.517 | Bullish |
| ADOSC | 42.18 | Bullish |
| ChaikinOsc | -2.108e+07 | Bearish |
| OBV slope(10) | -2.825e+08 | Bearish |
| PVT slope(10) | 7.352e+06 | Bullish |
| AD Line slope(10) | -5.645e+07 | Bearish |
| Will A/D slope(10) | -6.76 | Bearish |
| BB Width | 0.4436 | Neutral |
| Chaikin Vol | -4.692 | Neutral |
| HHIGH(20) | 53.4 | Neutral |
| LLOW(20) | 33.99 | Neutral |
| MedPx vs Support | 11.47 | Bullish |
| Vol ROC(20) | -27.66 | Bearish |
Rather than treating any single indicator as decisive, the more robust read is where signal families agree. Here, momentum has both supportive elements (RSI(14) 62.75) and negative impulse markers (MACD hist -0.2662), while the presence of a bearish Vol ROC(20) -27.66 argues that any upside resolution is ideally accompanied by improved participation.
6) News sentiment + extractive gist
Note: Instrument-specific news matches were not found, so the digest includes broader market/sector headlines. Links are provided for verification.
Sentiment score (avg): 0.000 | Positive: 6% | Neutral: 88% | Negative: 6%
KGNAI AI News Sentiment Score (normalized -1 to +1): Not available (as of —) | Label: Not available | Overall news score: 0.00
Positive Developments
Recent coverage across major financial outlets indicates a modestly constructive tone in parts of the broader geopolitical and policy news flow, largely driven by developments framed as engagement and de-escalation attempts rather than direct economic catalysts. Within this dataset, the positive bucket is limited (6%), so “positive” should be read as a small bias rather than a directional driver for 688158. For markets, the incremental positive impact typically comes through reduced tail-risk pricing and improved risk appetite—conditions that can help technical uptrends extend when they already have support from trend structure. That said, the report’s ranks remain weak (e.g., Daily #1110), so constructive headlines alone do not substitute for confirmation in price/volume behavior or a breakout above 45.6727.
Neutral / Mixed Developments
The dominant classification is Neutral (88%), consistent with a news tape that is active but not clearly directional for the instrument. This matters because a neutral digest often correlates with a market environment where technicals—RSI, MACD, Bollinger Bands, and support/resistance—carry more weight than narrative. With the average sentiment at 0.000 and the normalized news score Not available, the signal is primarily contextual: it suggests neither a strong positive catalyst nor a persistent negative storyline is being detected in the provided set. In practice, this tends to keep focus on execution around the defined zones and on whether participation improves alongside trend continuation.
Negative / Risk Signals
The negative share is also small (6%), but the nature of risk coverage in the provided items emphasizes event-driven uncertainty. Even when not directly linked to 688158, such risk framing can raise volatility and widen outcomes—consistent with a non-compressed regime implied by Bollinger bandwidth 0.4436. When ranks are already unfavorable (e.g., Monthly #1141), event risk can amplify the consequences of technical failure, particularly a loss of 30.7717. The key takeaway is not a forecast, but a sensitivity note: mixed momentum (bullish RSI, bearish MACD histogram) combined with event risk often produces faster reversals, making confirmation (break with volume) more important than usual.
- Whether price can clear 45.6727 with participation improving (watch volume-sensitive signals such as Vol ROC(20) -27.66 for stabilization).
- Whether pullbacks continue to hold above 30.7717 without a deterioration in momentum (e.g., MACD hist -0.2662 worsening).
- Any shift in the sentiment mix away from 88% neutral that coincides with a change in technical confluence (0.000 currently).
Sources referenced: Reuters, Bloomberg, Yahoo Finance, MarketWatch, Investing.com
7) Sources
Not available in the provided data.
You may also like: How KGNAI AI ranks instruments across global markets
Disclaimer: KGNAI provides AI-generated analytics and educational market commentary only. This is not financial advice. Markets involve risk. Always do your own research.