
688700 (Kunshan Dongwei Technology Co Ltd) — Mixed Horizon Ranks with Bullish Technical Confluence (22-Mar-2026)
Kunshan Dongwei Technology Co Ltd (688700) presents a split profile across KGNAI horizons as of 22-Mar-2026. The daily rank (#1053/1293) sits in the weaker portion of the China universe, while the monthly rank (#15/1293) screens in the top tier—an internal tension that often appears when near-term positioning cools after a strong advance. The technical layer is more constructive: the 18-signal framework and DRL technical model both carry a Bullish orientation (overall technical score 0.668), consistent with price trading favorably versus key moving averages and positive momentum structures. Momentum is notably elevated (RSI(14) 74.19, MACD histogram 0.4112), while volatility context is measurable but not extreme (Bollinger bandwidth 0.5011). Tactically, the report’s decision zones frame risk: support ~39.1617 and resistance ~54.1300, with a neutral-leaning news backdrop (sentiment score avg 0.044; 88% neutral).
Key Takeaways
- Rank stance: Short-term Bearish (daily #1053/1293); Mid-term Bullish (monthly #15/1293); Long-term: Not available.
- Technical confluence: Overall technical score 0.668 Bullish; DRL technical rank #128/1293.
- Key levels: Support 39.1617 | Resistance 54.1300.
- News sentiment bias: Neutral (avg 0.044; 88% neutral; 0% negative).
- Confirmation / invalidation: Strength is better supported on a break above 54.1300 with volume; caution increases on a close below 39.1617.
What KGNAI Measures
KGNAI evaluates assets using large cross-sectional datasets built from millions of structured data points. Inputs incorporate fundamental metrics, technical structures, and systematically processed news sentiment. Statistical models, machine learning, and AI frameworks are used to assess relative positioning, signal alignment, and probabilistic behavior across broad universes.
How to Read This Report
- Ranks are comparative across the tracked universe, not absolute price targets.
- Confluence reflects alignment among independent signal groups.
- Support/resistance levels are probabilistic decision zones, not guarantees.
- Sentiment provides contextual bias within the broader analytical framework.
1) KGNAI AI Analysis
Region: CHINA
Total universe size: 1293 ranked instruments
- Daily rank: #1053 out of 1293 — Bearish
- Weekly rank: #654 out of 1293 — Neutral
- Monthly rank: #15 out of 1293 — Bullish
- 3-Monthly rank: Not available for this horizon — Not available
- 6-Monthly rank: Not available for this horizon — Not available
- Yearly rank: Not available for this horizon — Not available
Cross-horizon alignment: short-term pressure vs mid-term strength
The rank profile is best understood as a horizon divergence rather than a single-direction signal. The monthly rank (#15/1293) places 688700 in the top tier of the tracked China universe, suggesting strong mid-term relative behavior. In contrast, the daily rank (#1053/1293) is positioned in the weaker portion of the distribution, implying near-term conditions are less favorable on a relative basis.
This configuration often appears when a market transitions from impulse to digest: mid-term structure can remain intact while short-term positioning becomes more fragile. The weekly rank (#654/1293) in the middle of the distribution reinforces that the current state is not uniformly risk-on or risk-off across timeframes.
From a process perspective, KGNAI ranks are comparative and derived from multiple proprietary AI tests and statistical models. Here, the practical implication is that signal confidence should be conditioned on timeframe. A bullish monthly rank can coexist with short-term volatility or pullbacks, especially when momentum metrics (see Section 3) show elevated readings such as RSI(14) 74.19. Long-horizon ranks (3-monthly, 6-monthly, yearly) are Not available in the provided data, which limits conclusions about persistence beyond the current mid-term regime.
Overall, 688700’s AI rank set argues for a two-speed interpretation: near-term caution, mid-term constructive bias, and a need to use the major price decision zones (39.1617 / 54.1300) as the practical arbiter of whether mid-term strength is being preserved.
2) Price & trend overview
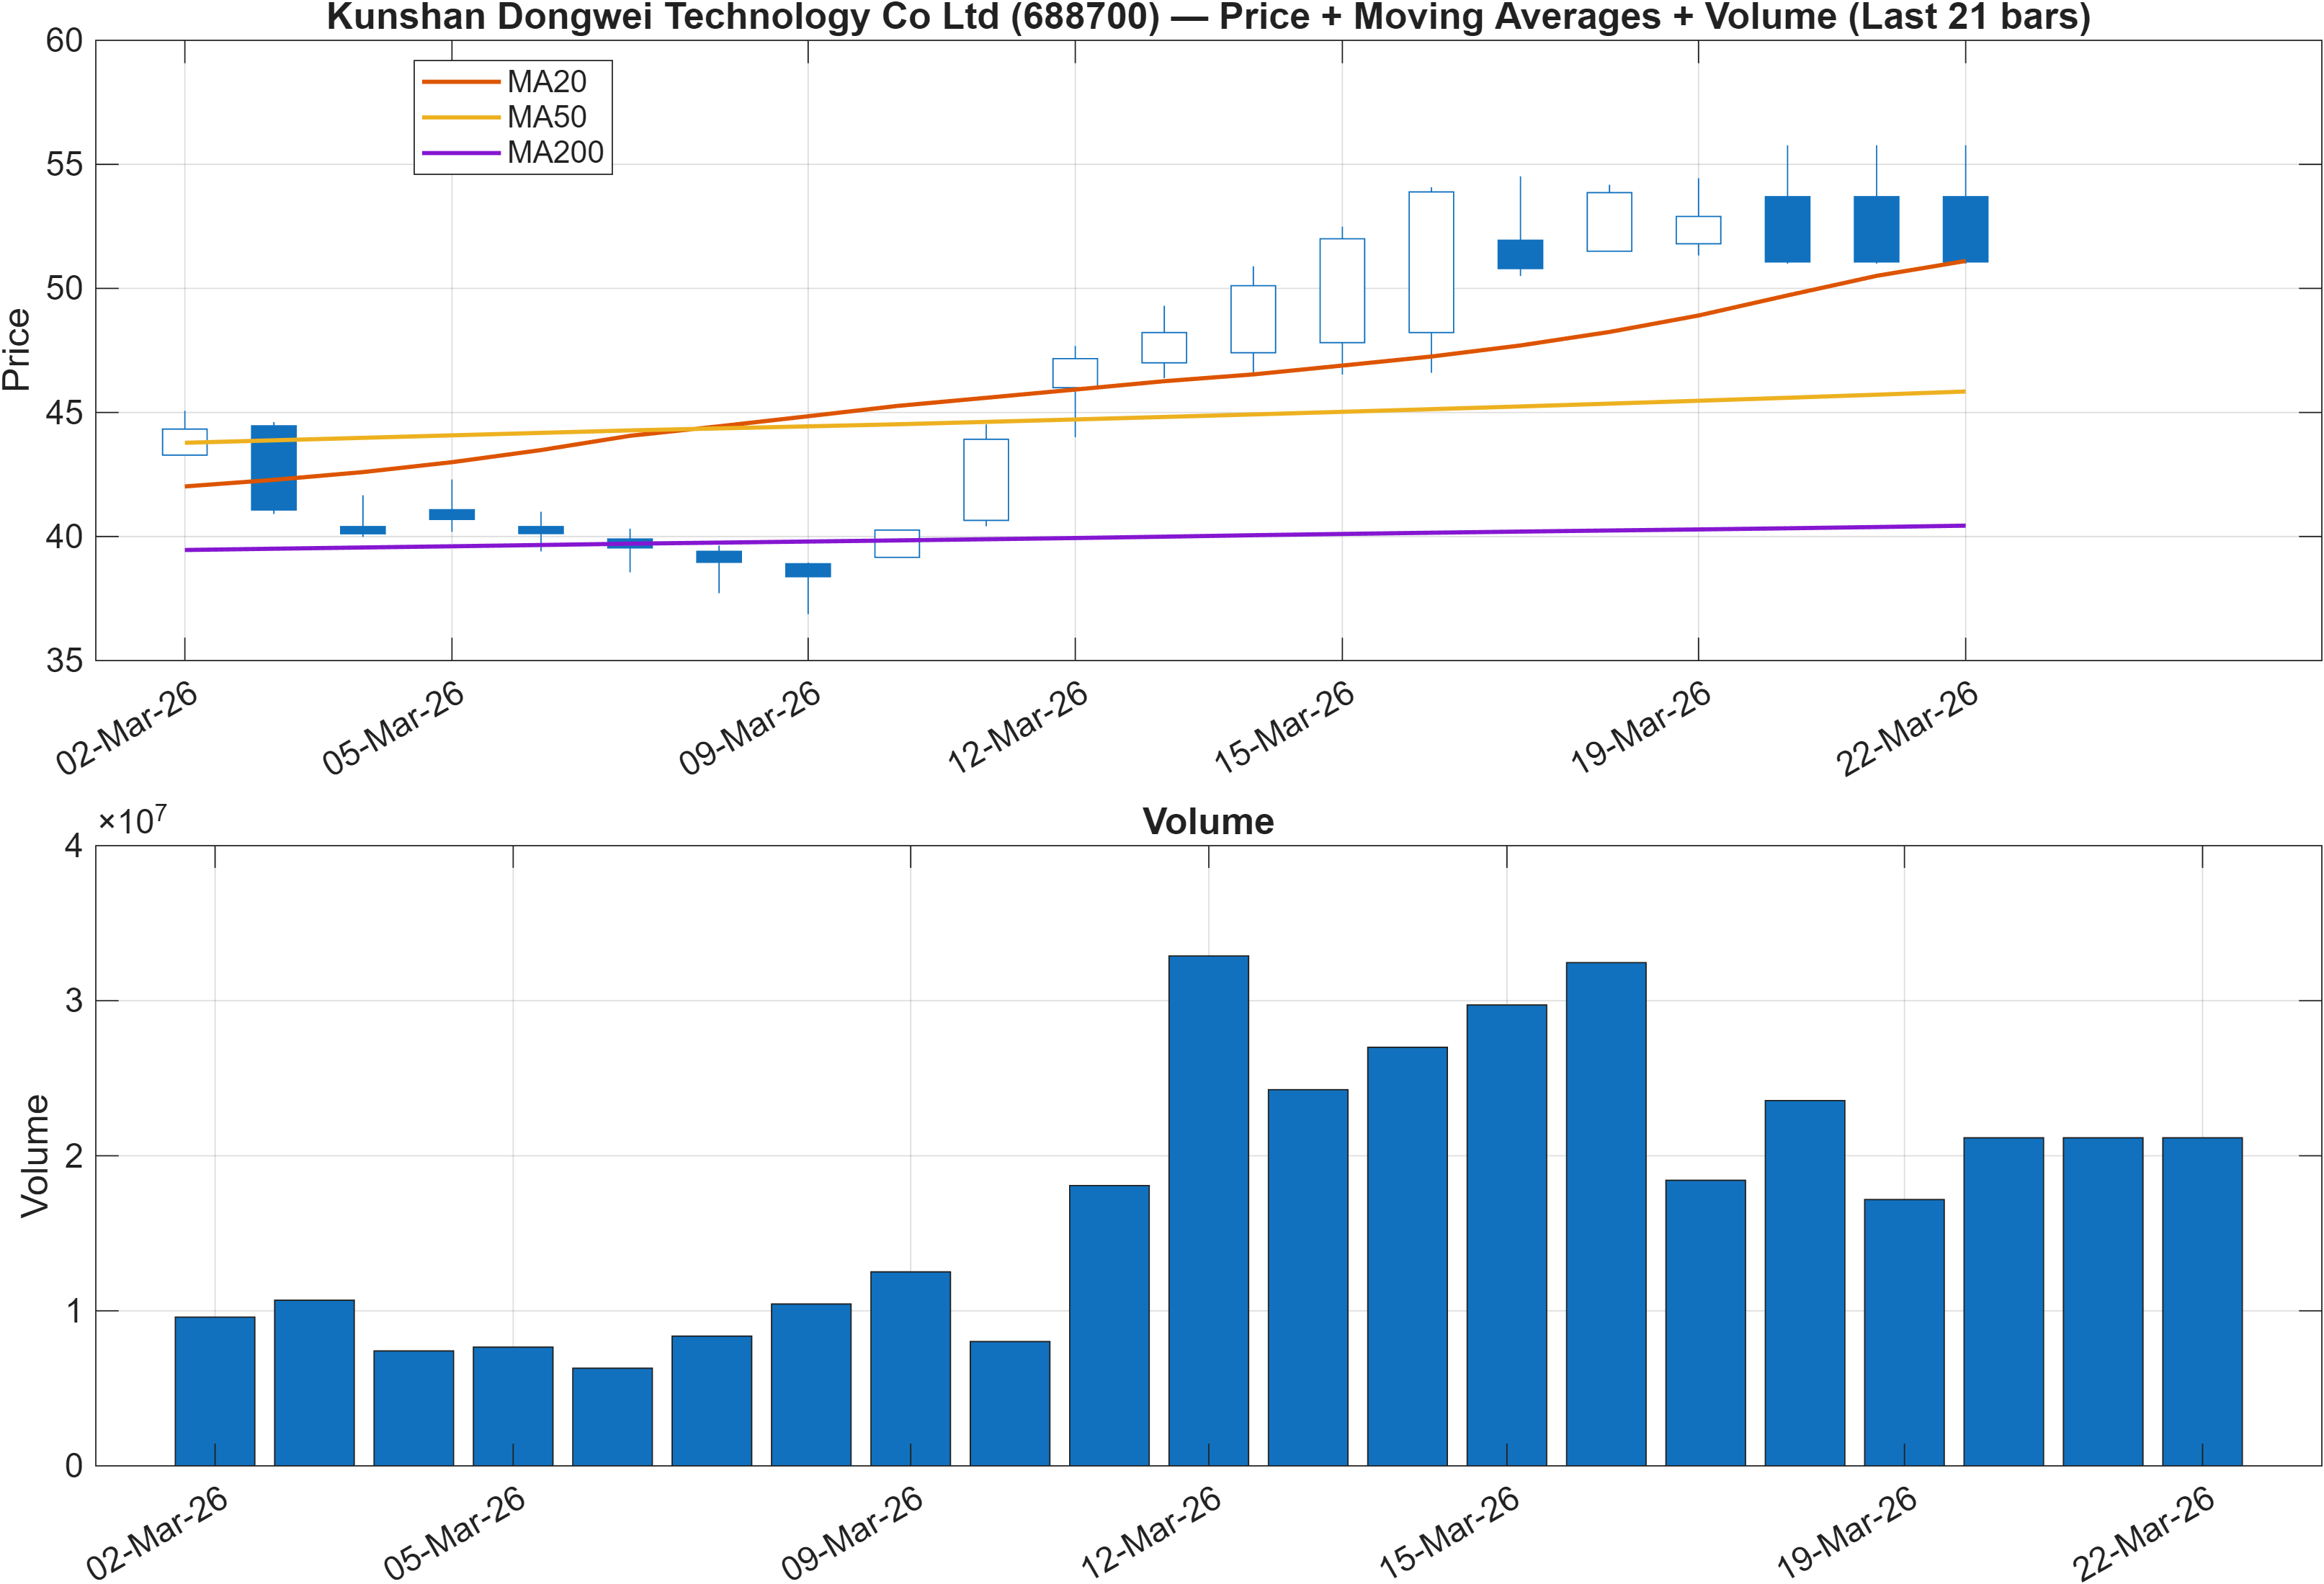
Interpretation: Close vs MA50 = Bullish, MA50 vs MA200 = Bullish.
Trend structure: constructive moving-average regime, but timing matters
The trend overlay is internally consistent: price relative to MA50 is Bullish, and the longer trend filter (MA50 vs MA200 Bullish) confirms a constructive regime. When both conditions align, the market is typically behaving in a way that favors trend-following logic rather than mean reversion—at least until momentum becomes overly extended.
Timing risk is the key nuance. The rank stack shows daily #1053 against a monthly #15, which can occur when price remains in an uptrend but the short-term path becomes choppier due to positioning, profit-taking, or volatility clustering. That tension is visible in the way the report frames tactical decision levels: support ~39.1617 and resistance ~54.1300. In a bullish moving-average regime, dips that hold above support tend to preserve trend optionality; a failure below support would be the cleaner evidence that trend strength is deteriorating rather than consolidating.
The technical dashboard later reinforces that the broader structure is not narrowly dependent on a single moving-average read. The blended technical score is 0.668 (Bullish), and the DRL technical model places the setup at #128/1293, which is consistent with a trend that remains relatively strong within the universe even if the short-term rank is weak.
Net: the trend regime is constructive, but the market’s “where” matters as much as the market’s “direction”. The next interaction with 54.1300 (break/hold/reject) and the ability to stay above 39.1617 are the most disciplined anchors for assessing whether this is consolidation within trend or a transition toward a weaker phase.
3) Momentum & volatility dashboard
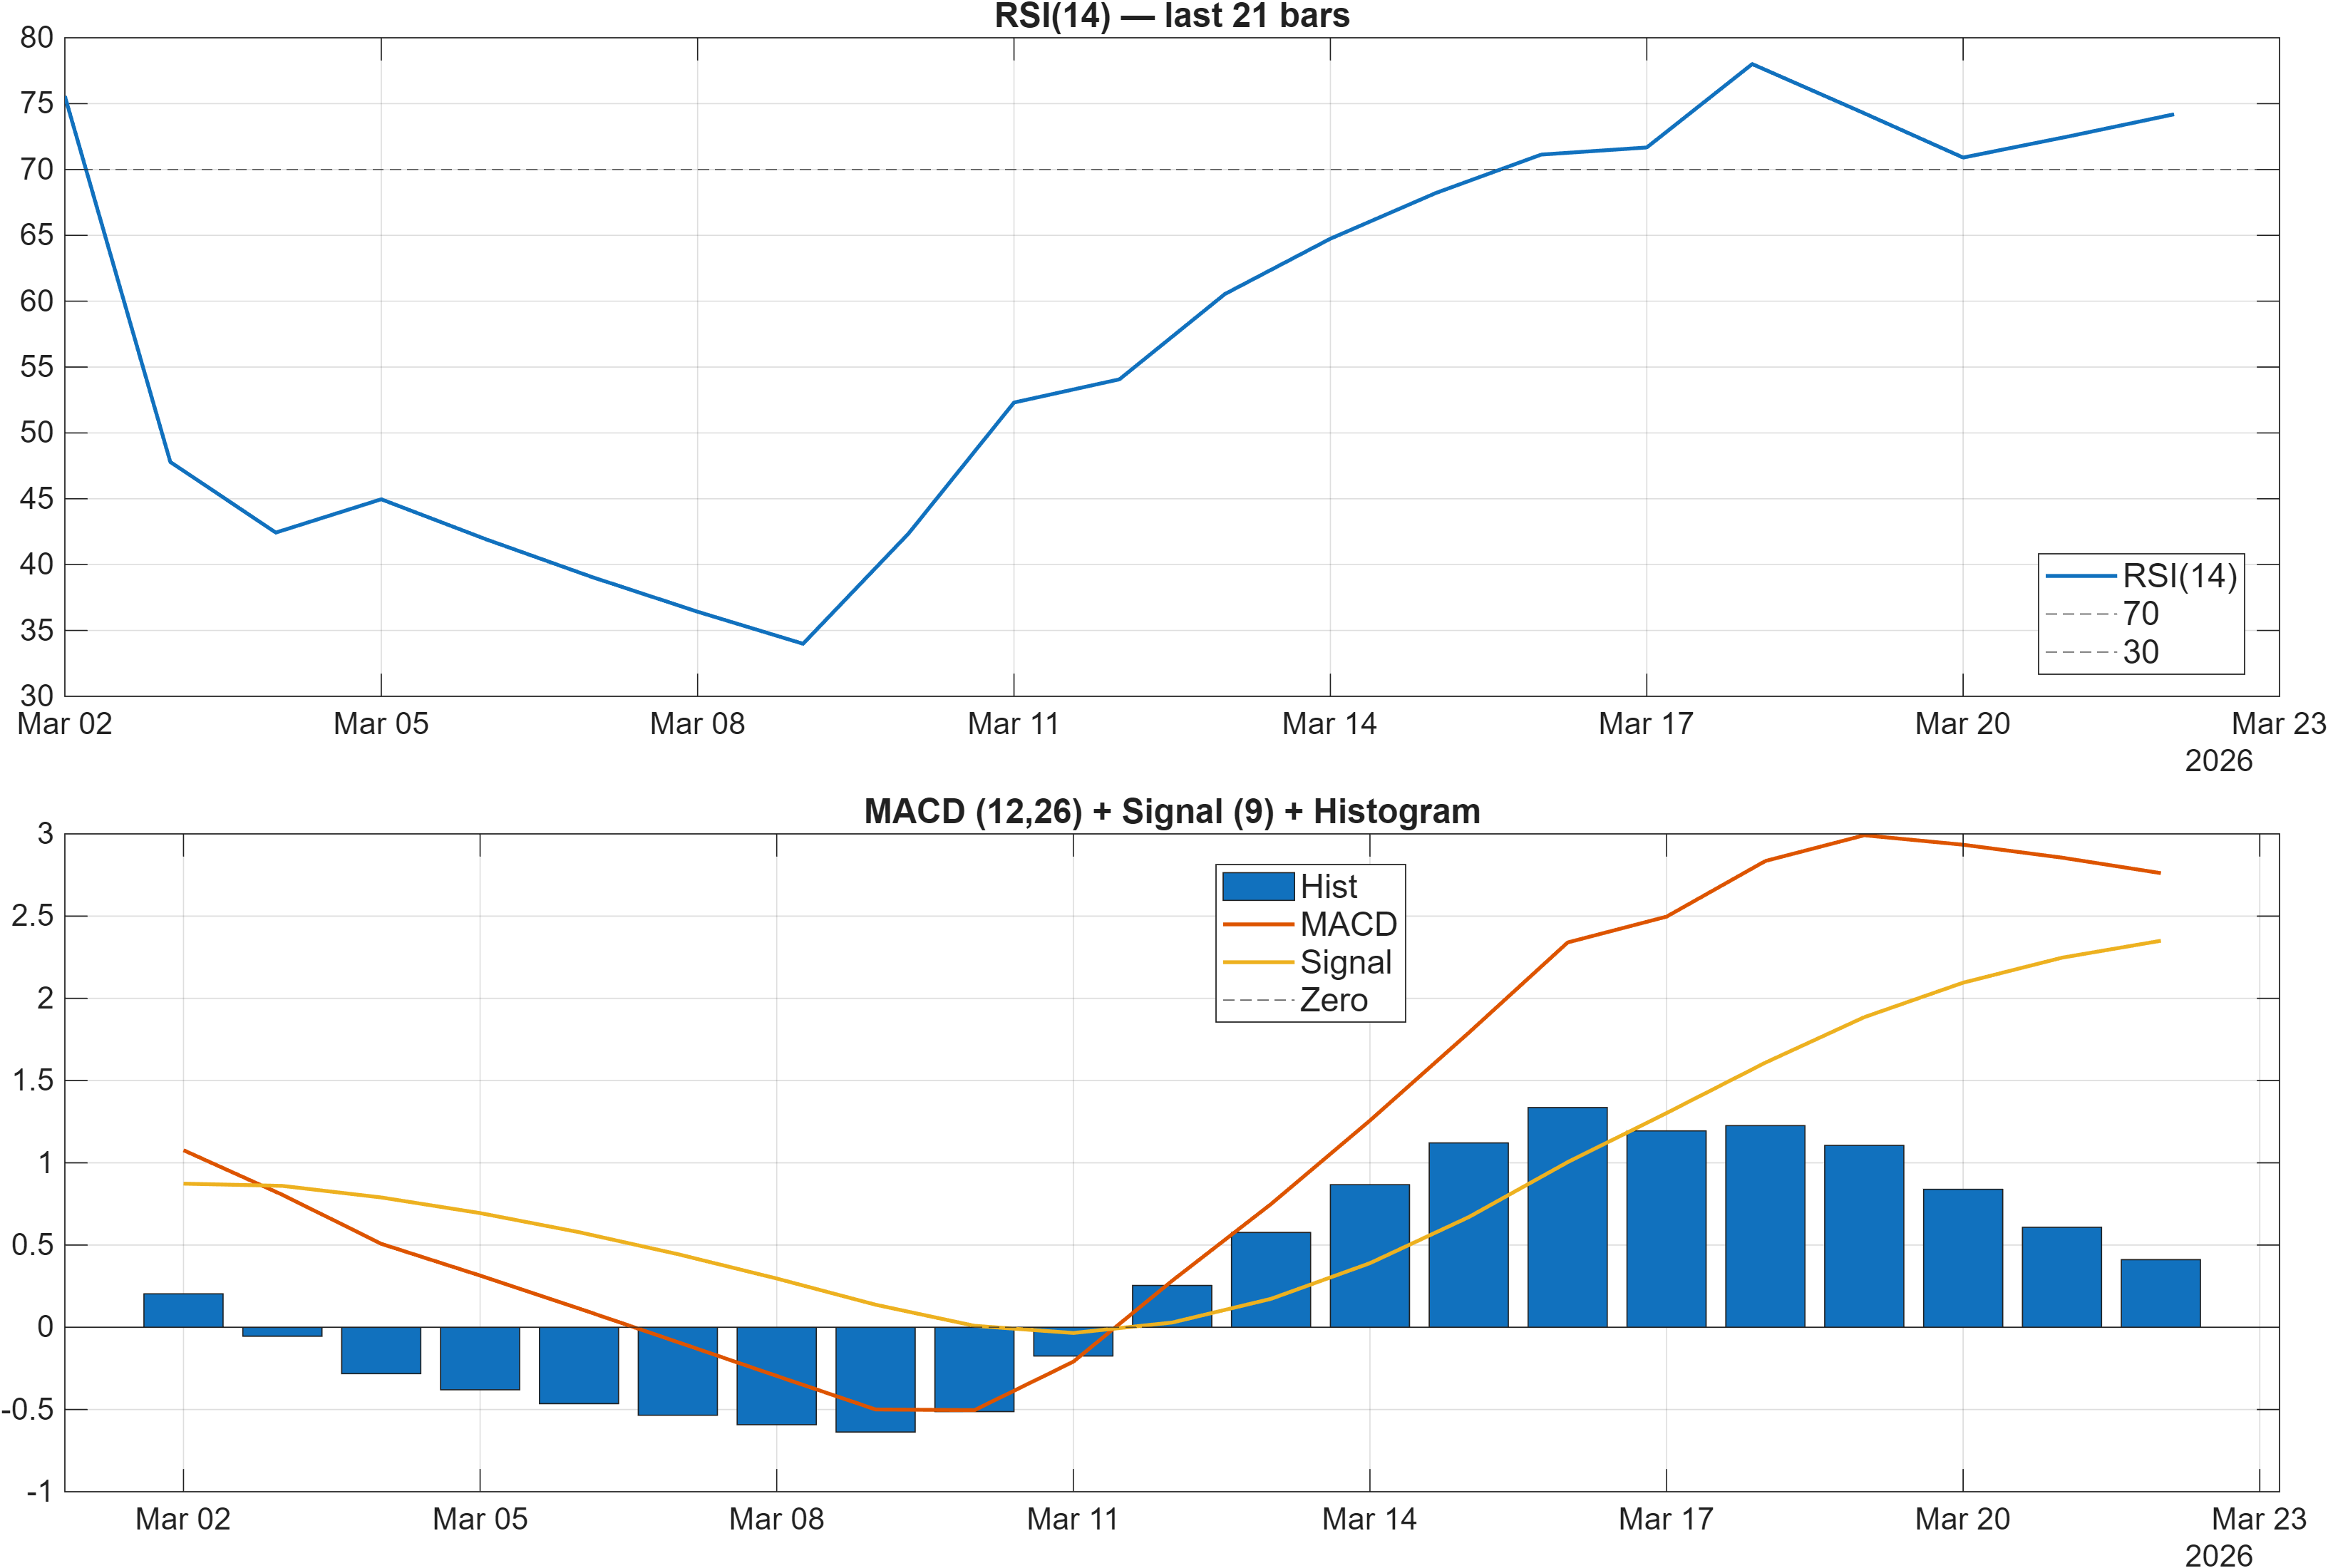
Interpretation: RSI bias = Bullish, MACD hist = 0.4112.
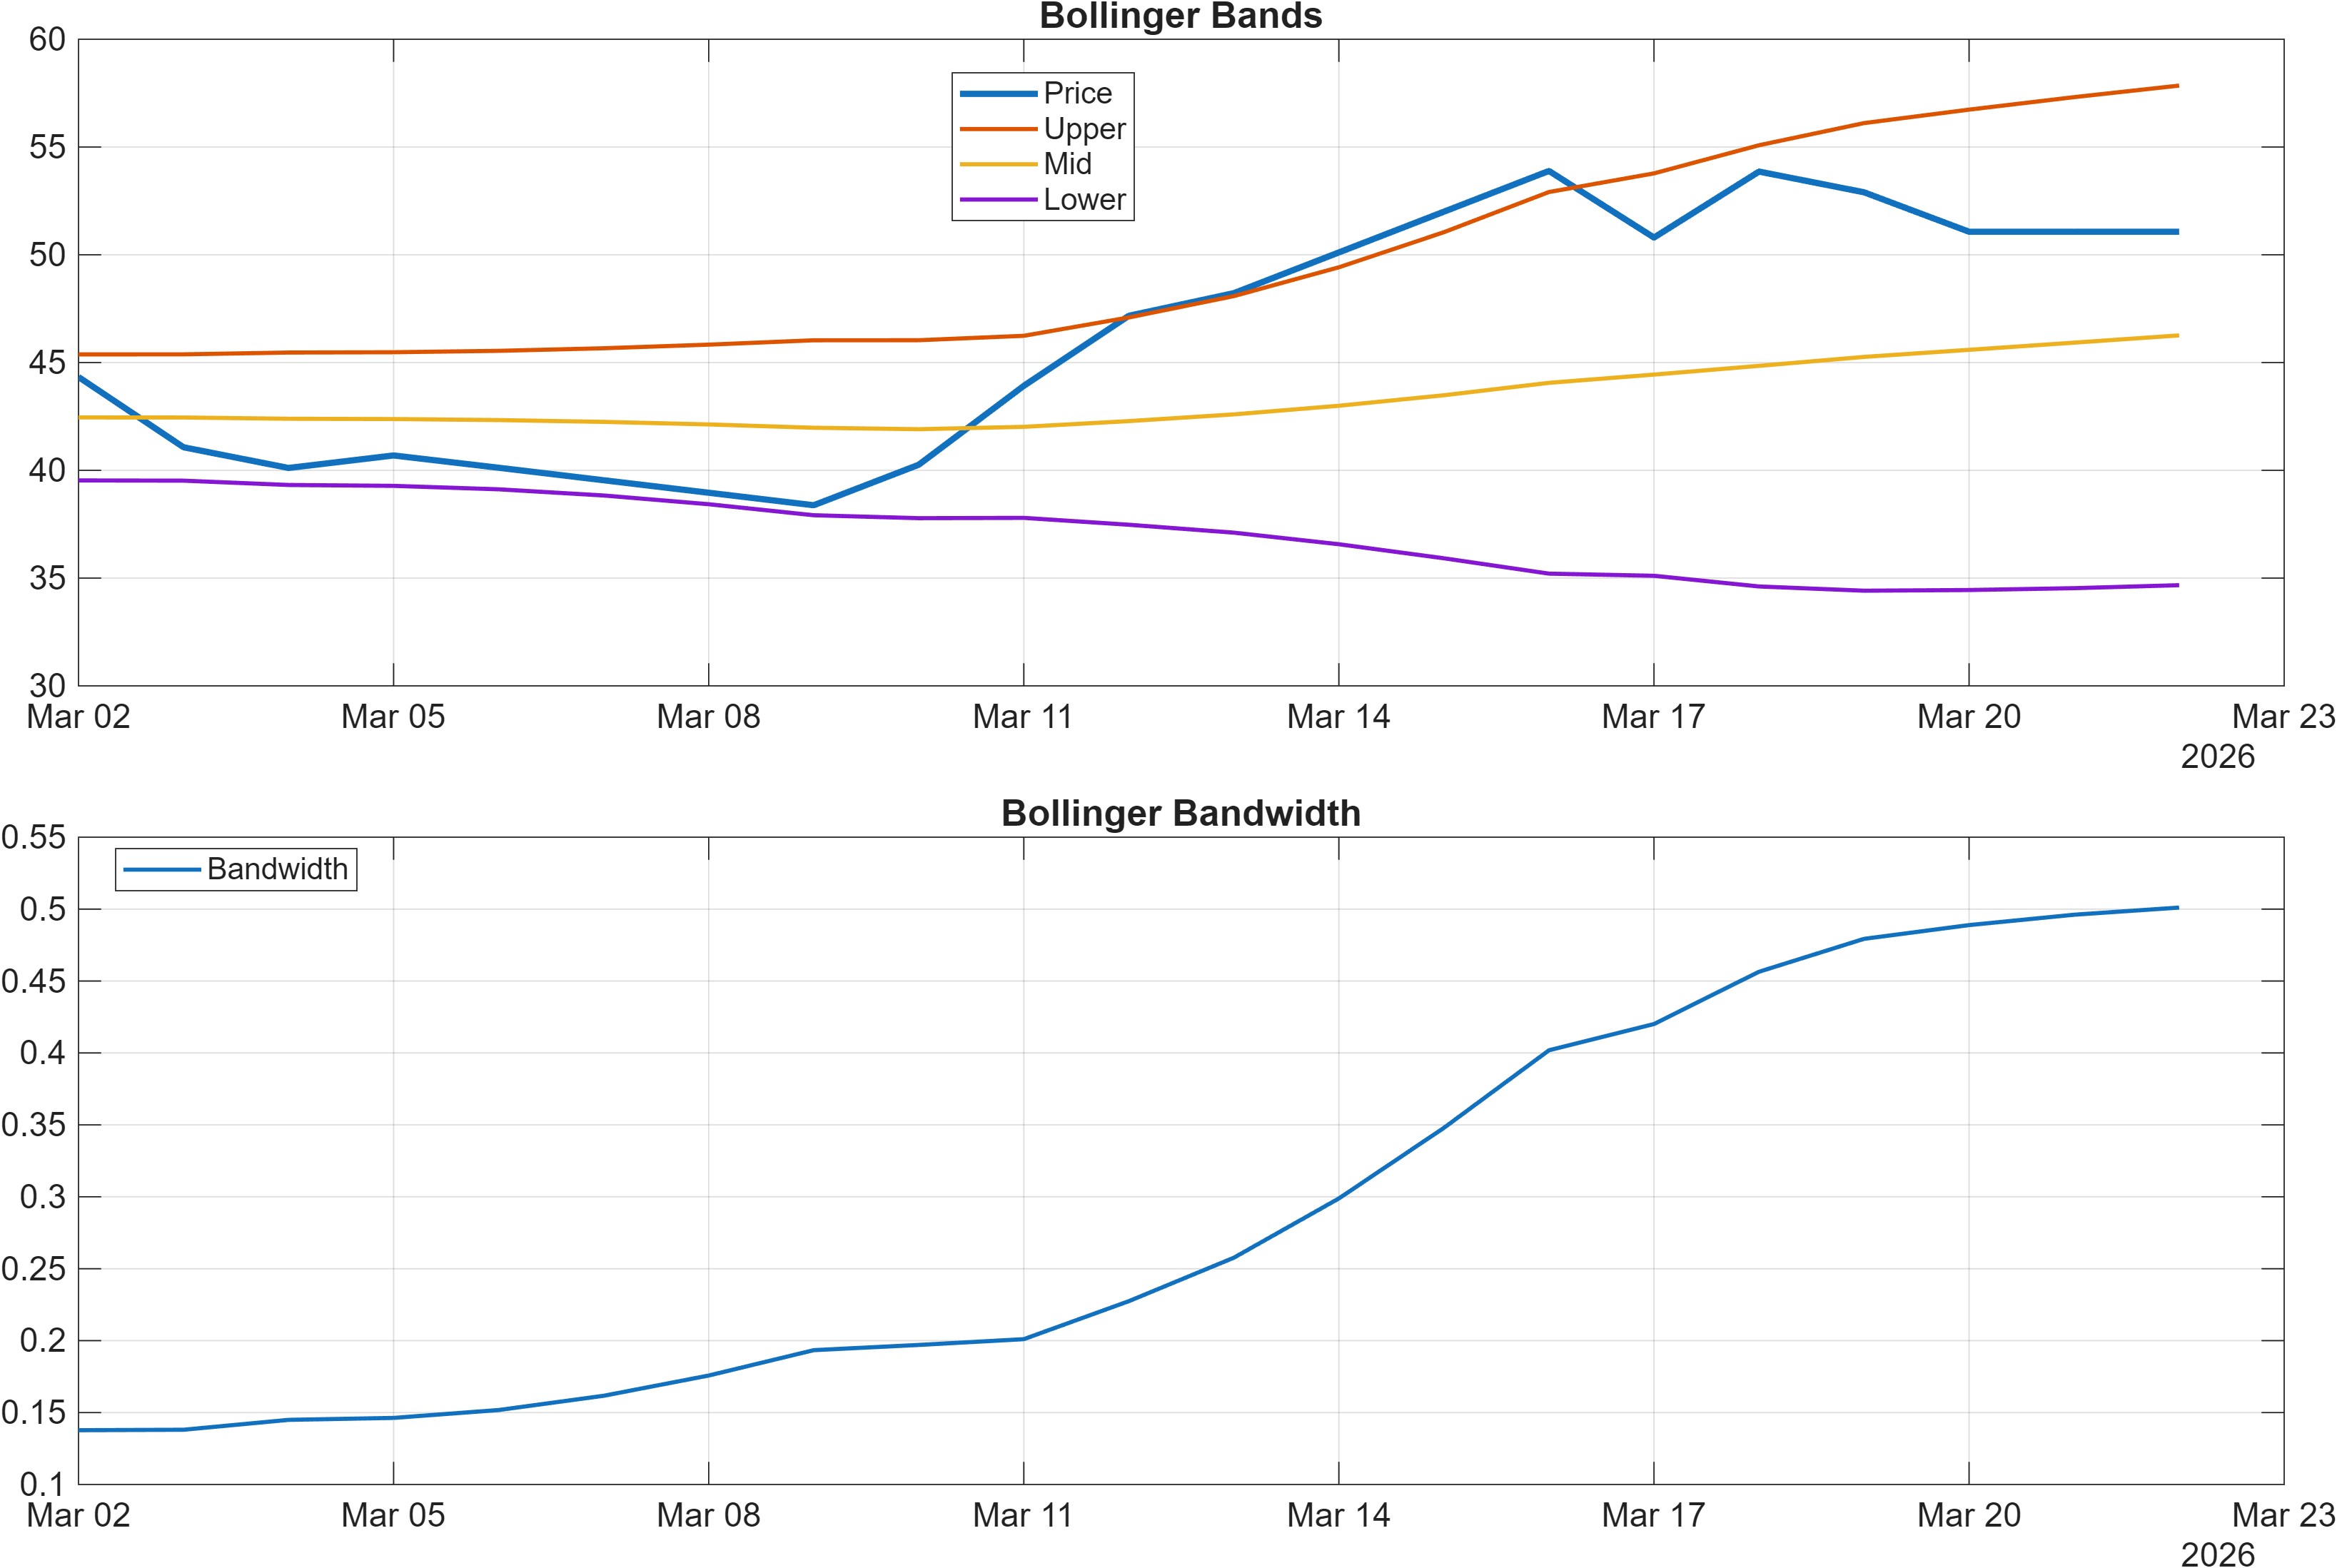
Interpretation: Bandwidth (volatility regime) latest = 0.5011.
Momentum strength vs overextension: bullish bias with asymmetric downside risk
Momentum indicators are tilted positive, but the risk is no longer symmetric. The dashboard flags RSI bias as Bullish with an elevated RSI(14) at 74.19, a level that often coincides with strong impulse phases but can also precede short-term mean-reversion episodes. The MACD histogram at 0.4112 remains positive, indicating upside momentum is still present rather than rolling decisively over.
Volatility context provides a second lens on whether momentum is expanding or compressing. The Bollinger bandwidth reading of 0.5011 suggests volatility is observable and not collapsed into a tight range. In practice, this matters because elevated momentum (high RSI) in a non-compressed bandwidth regime can translate into larger candles and faster swings—useful for trend continuation, but also increasing the penalty for poor entries when the daily rank is weak (#1053).
The 18-signal framework corroborates this “strong but stretched” interpretation without requiring a single-indicator narrative. Alongside the bullish MACD histogram, the signal table includes a neutral Stoch %K (49.95), which can be consistent with a market that has already advanced but is pausing rather than accelerating uniformly.
The cleanest analytical takeaway is that momentum remains constructive, but the elevated RSI makes short-term outcomes more dependent on whether price can hold structure around the major levels (39.1617 support; 54.1300 resistance). This dovetails with the rank divergence: mid-term strength can persist even when near-term moves become more two-sided.
4) Support / Resistance zones
Support ~ 39.1617 | Resistance ~ 54.1300
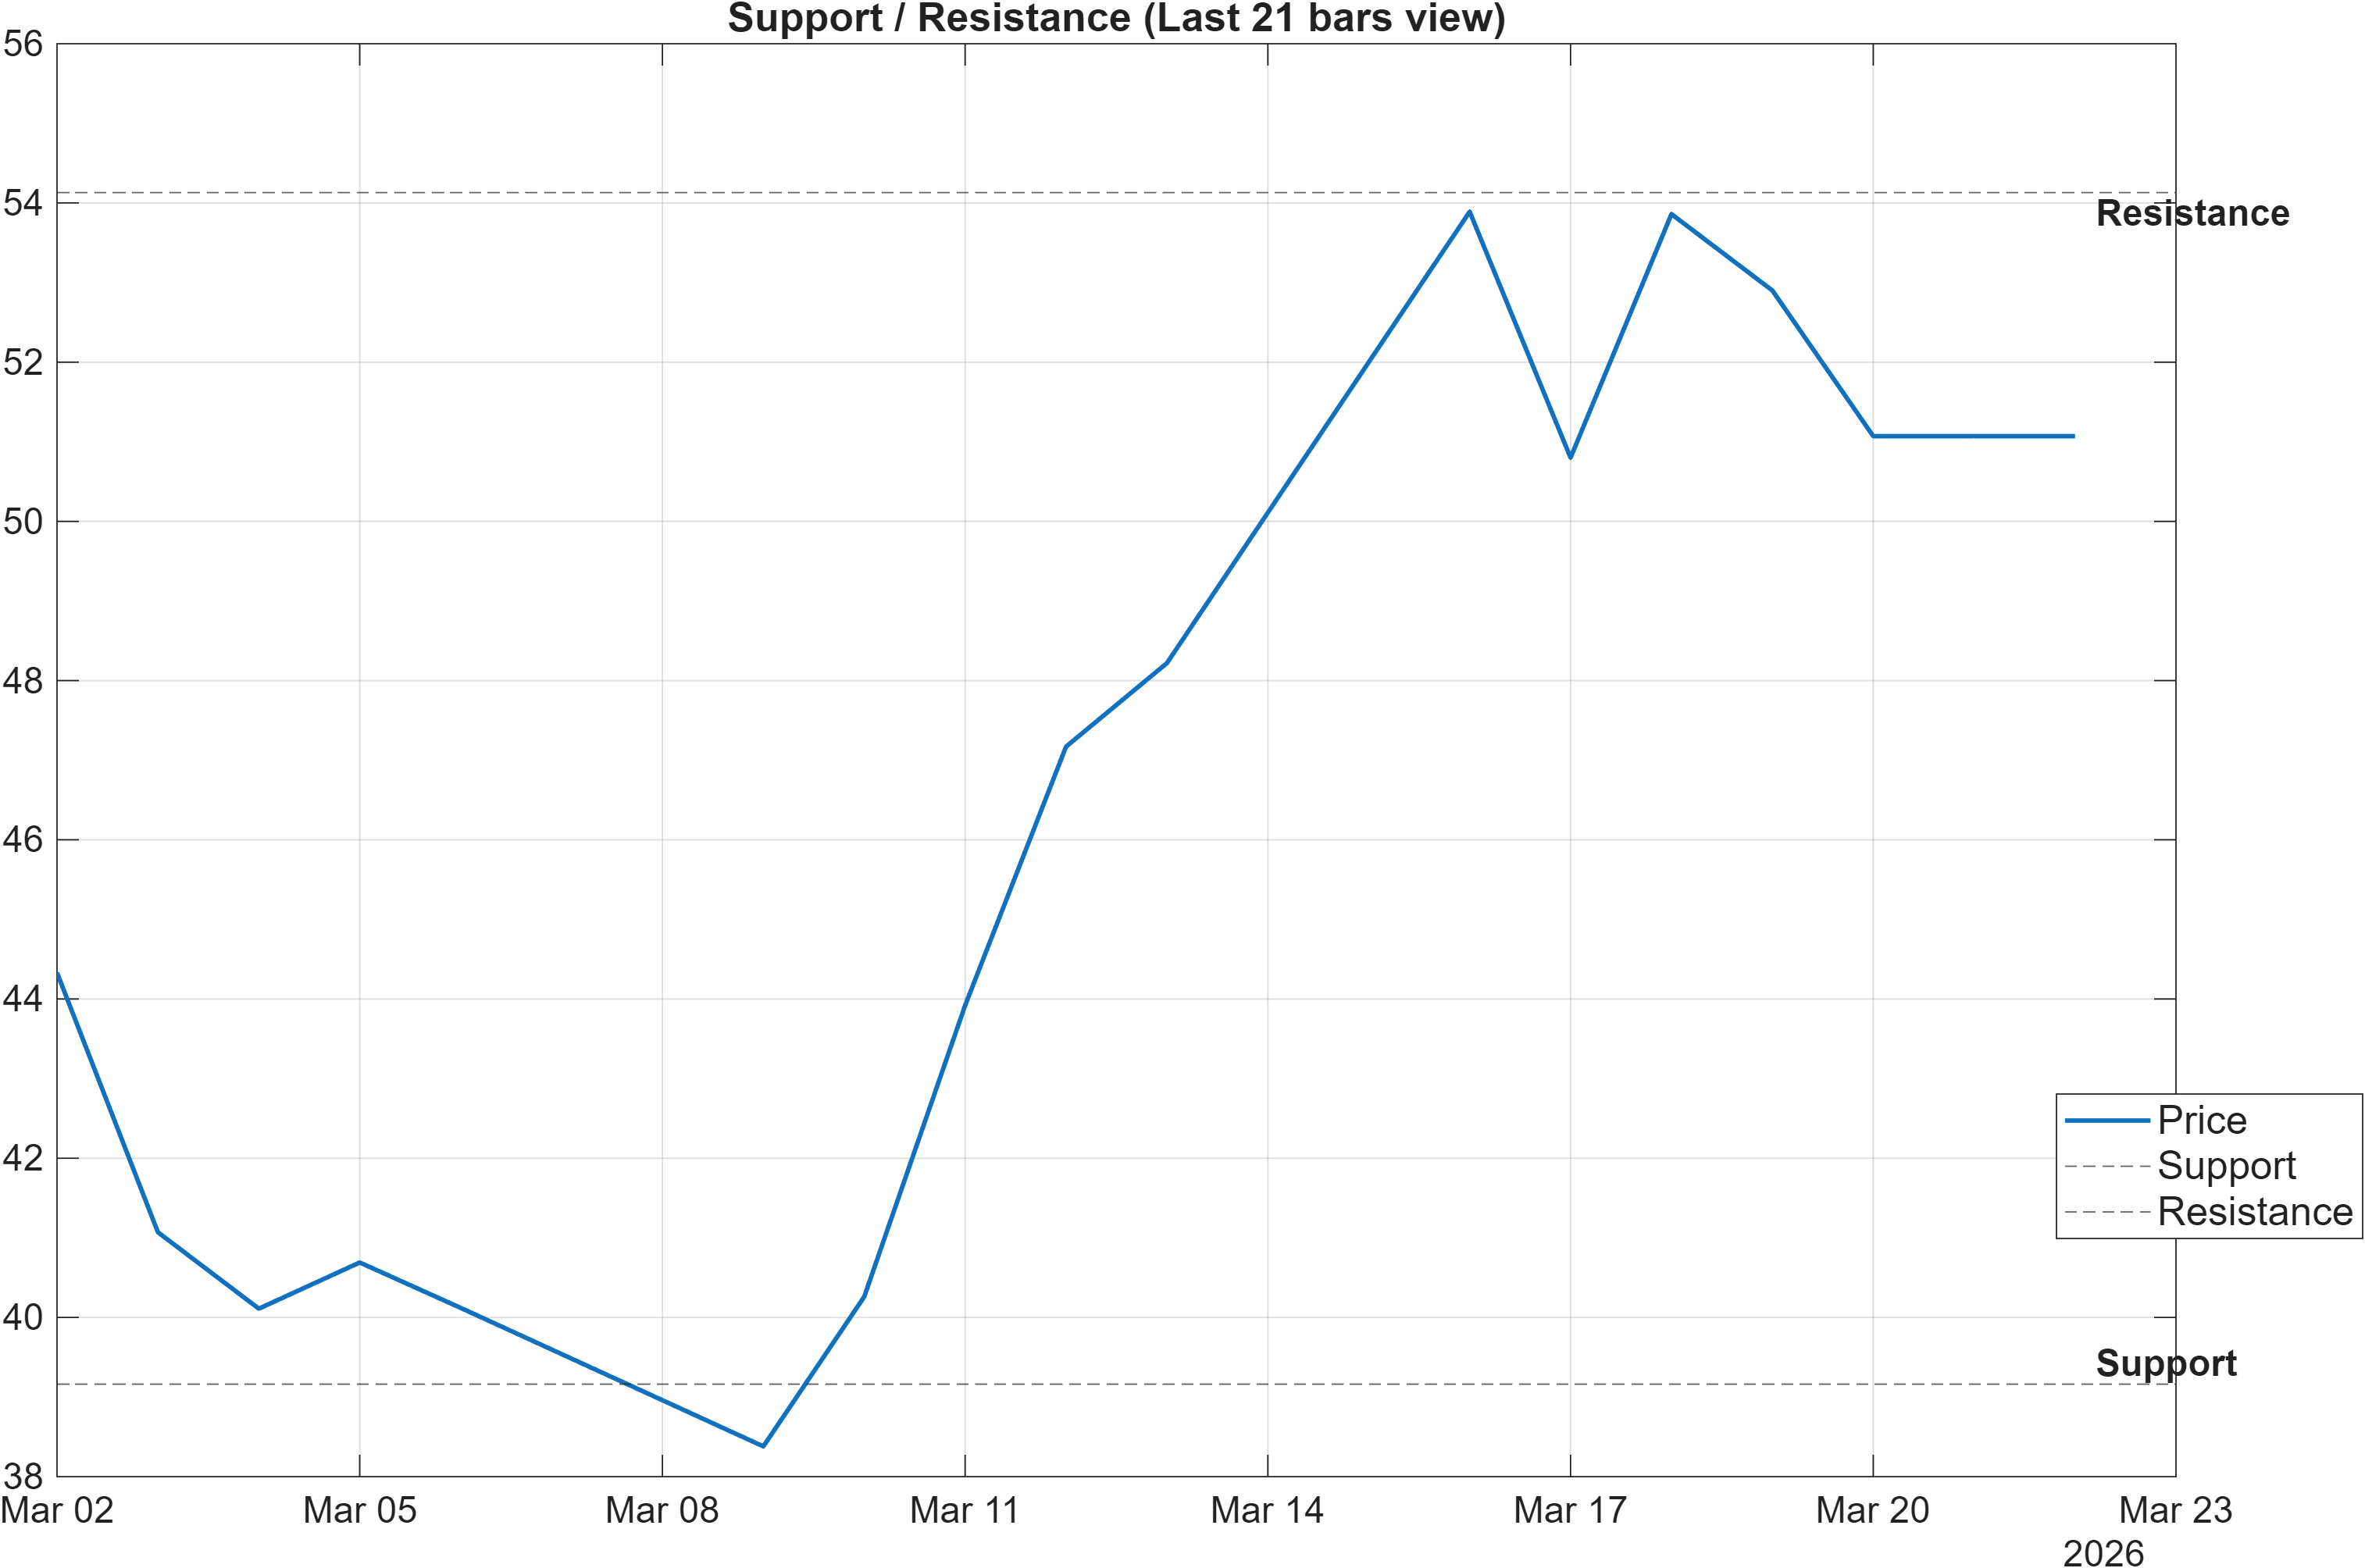
Scenario view: Break above resistance with volume → continuation. Close below support → signal deterioration risk.
Decision zones: separating continuation from deterioration
The support/resistance framework is the report’s most actionable structure because it converts multi-factor readings into observable price conditions. With support ~39.1617 and resistance ~54.1300, the market is effectively being evaluated on whether it can sustain the constructive technical regime (overall technical score 0.668) without breaking the structure that typically underpins it.
A bullish technical backdrop can fail if it cannot defend its primary demand zone. The explicit risk condition—a close below 39.1617—would not merely represent a routine pullback; it would also align with the weaker short-term comparative standing (daily rank #1053) and would increase the probability that the current divergence resolves in the bearish direction. Conversely, the continuation condition—a break above 54.1300 with volume—acts as confirmation that momentum (RSI(14) 74.19; MACD hist 0.4112) is being translated into net new price acceptance rather than fading.
These levels also help manage volatility interpretation. With Bollinger bandwidth at 0.5011, swings may be non-trivial; decision zones provide a disciplined way to interpret those swings as either noise within range or meaningful regime change. Importantly, nothing in the provided data specifies probability percentages for these zones, so the correct stance is to treat them as probabilistic, not deterministic.
In a mixed horizon setup, levels dominate narratives: holding above 39.1617 helps preserve the mid-term bullish characterization (monthly rank #15), while a clean acceptance above 54.1300 would reduce the conflict between bullish confluence and bearish short-term rank.
5) Quant Technical Dashboard (18 Signals)
KGNAI AI Technical Analysis Score (Deep Reinforcement Learning): Rank #128 out of 1293 (Rank 1 represents the strongest technical positioning and a higher probability of favorable price behavior. As ranks increase toward the maximum, the probability of favorable outcomes weakens and bearish positioning becomes more dominant.) | Label: Bullish | Score: 0.802
18-Signal Technical Confluence Score: 0.611 (Bullish)
Overall Technical Score (18-signal confluence + DRL rank blend): 0.668 (Bullish)
Note: The blended score reflects signal strength weighted against broader AI technical ranking, which may temporarily diverge.
Blended technical score breakdown: 0.668 (Bullish | Bull 13 / Bear 2 / Neutral 3)
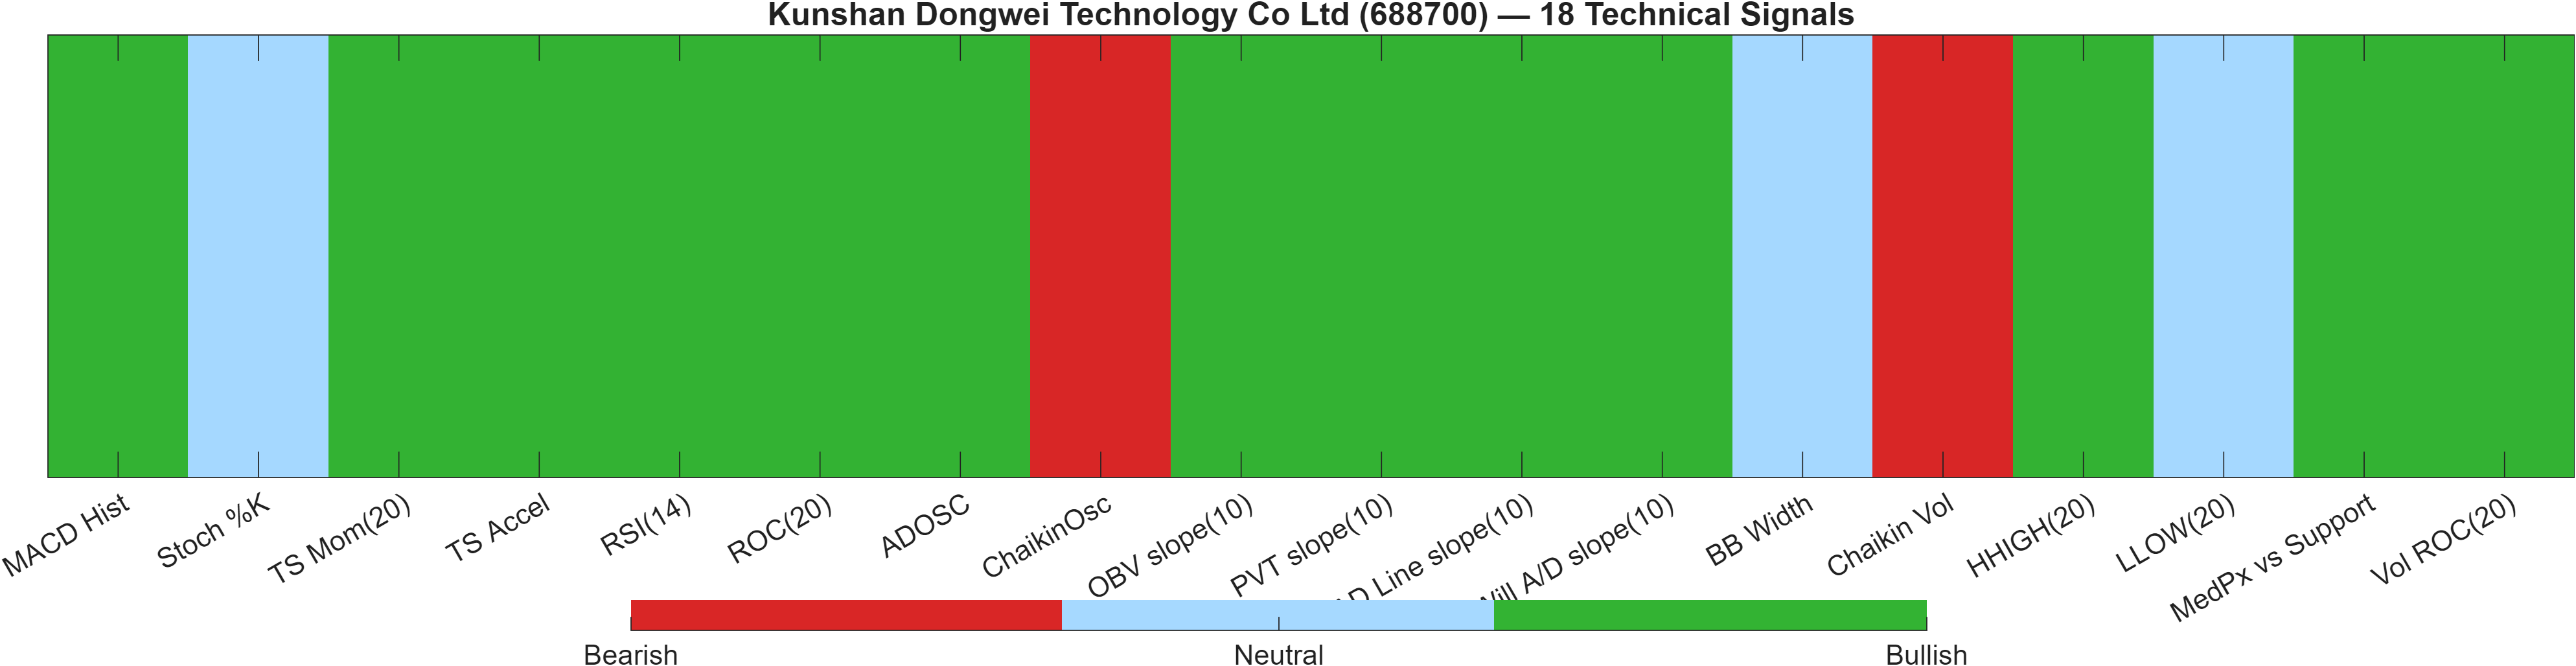
Confluence vs divergence: broad bullish breadth, limited but important counter-signals
The technical dashboard is notable for breadth. The confluence score is 0.611 (Bullish) and the blended overall technical score improves to 0.668 (Bullish), supported by a DRL technical rank of #128/1293 with score 0.802. The composition—Bull 13 / Bear 2 / Neutral 3—suggests the bullish characterization is not narrowly dependent on one indicator family.
Momentum and trend signals are a key contributor to this breadth. For example, the positive MACD histogram (0.4112) aligns with the report’s bullish RSI bias, while rate-of-change metrics such as ROC(20) 24.35 reinforce that the recent move has been meaningfully directional. At the same time, some oscillators are not reinforcing an immediate acceleration signal: Stoch %K at 49.95 (Neutral) is consistent with consolidation or a pause after a strong push.
The bearish signals are worth treating as friction rather than reversal calls. The table flags ChaikinOsc -1.772e+06 (Bearish) and Chaikin Vol 62.8 (Bearish), which together point to a less clean accumulation/volume-volatility profile than the bullish price structure might imply. This matters because it can increase the probability of sharp pullbacks even when the intermediate trend is still intact.
Signal table (Bull/Bear/Neutral)
| Indicator | Value | Signal |
|---|---|---|
| MACD Hist | 0.4112 | Bullish |
| Stoch %K | 49.95 | Neutral |
| TS Mom(20) | 10 | Bullish |
| TS Accel | 10.21 | Bullish |
| RSI(14) | 74.19 | Bullish |
| ROC(20) | 24.35 | Bullish |
| ADOSC | 22.43 | Bullish |
| ChaikinOsc | -1.772e+06 | Bearish |
| OBV slope(10) | 8.024e+07 | Bullish |
| PVT slope(10) | 3.224e+06 | Bullish |
| AD Line slope(10) | 2.028e+07 | Bullish |
| Will A/D slope(10) | 11.36 | Bullish |
| BB Width | 0.5011 | Neutral |
| Chaikin Vol | 62.8 | Bearish |
| HHIGH(20) | 55.77 | Bullish |
| LLOW(20) | 36.87 | Neutral |
| MedPx vs Support | 14.22 | Bullish |
| Vol ROC(20) | 98.09 | Bullish |
Interpretation: Indicator-level signals form the base confluence, which is then adjusted using a separate AI-driven technical ranking model. The final technical score summarizes this combined view.
6) News sentiment + extractive gist
Note: Instrument-specific news matches were not found, so the digest includes broader market/sector headlines. Links are provided for verification.
Sentiment score (avg): 0.044 | Positive: 12% | Neutral: 88% | Negative: 0%
KGNAI AI News Sentiment Score (normalized -1 to +1): Not available (as of —) | Label: Not available | Overall news score: 0.04
Positive Developments
Recent coverage across major financial outlets indicates a modestly constructive backdrop for regional activity and sector-adjacent narratives, albeit not directly tied to Kunshan Dongwei Technology Co Ltd. The tone skews toward stabilization themes—such as signs of renewed engagement in certain local markets—and discussion of adaptation within China’s industrial regions as legacy manufacturing ecosystems work through transition. Against a technical profile that remains broadly constructive (overall technical score 0.668), these narratives can act as a low-intensity tailwind by reducing uncertainty around activity conditions, even if they do not deliver company-specific catalysts. Importantly, the aggregate sentiment mix reinforces this: with 12% positive and 0% negative items in the sample, the news flow appears more supportive than disruptive. In a market already showing elevated momentum (RSI(14) 74.19), the role of “positive” news here is less about initiating a move and more about helping the market avoid abrupt confidence shocks.
Neutral / Mixed Developments
The dominant news classification is neutral (88%), consistent with the note that instrument-specific matches were not found and that the digest leans on broader market and macro/sector headlines. This matters for interpretation: a neutral-heavy stream typically functions as background context rather than a driver of short-term repricing. For 688700, that aligns with the mixed horizon ranks—daily #1053 vs monthly #15—where price behavior may be more influenced by positioning and technical levels (39.1617 / 54.1300) than by discrete news impulses. Also, the KGNAI AI News Sentiment Score is Not available in the provided data, so the most defensible stance is to treat the news layer as a contextual bias (overall news score 0.04) rather than as a quantified edge.
Negative / Risk Signals
Even with 0% negative items in the provided sentiment split, the underlying stories referenced in the digest include risk-oriented geopolitical and disruption themes. Such headlines can raise the market’s sensitivity to volatility and liquidity shifts, which is relevant given Bollinger bandwidth at 0.5011 and a short-term rank that already sits in the weaker portion of the universe (#1053/1293). In practice, the risk contribution here is less about fundamental impact on the issuer—since instrument-specific coverage was not identified—and more about regime risk: broader risk-off moments can cause technically strong charts to retrace faster than expected, particularly when momentum is elevated (RSI(14) 74.19). For disciplined monitoring, the most objective risk line remains price-based: deterioration becomes clearer on a close below 39.1617, while resilience is better supported if the market can absorb risk headlines without losing that level.
What to monitor next
- Whether price action reacts to broader risk headlines by testing (and holding) 39.1617.
- Any shift in the neutral-heavy sentiment mix (88%) toward higher dispersion (more positive or negative share).
- Confirmation of continuation conditions via acceptance above 54.1300 with volume.
Sources referenced: Reuters, Bloomberg, Yahoo Finance, MarketWatch, Investing.com
7) Sources
Not available in the provided data.
You may also like: How KGNAI AI ranks instruments across global markets
Disclaimer: KGNAI provides AI-generated analytics and educational market commentary only. This is not financial advice. Markets involve risk. Always do your own research.