
600795 (GD Power Development Co Ltd) — 29-May-2026 Technicals Tilt Bullish, Longer-Horizon Ranks Remain Neutral
GD Power Development Co Ltd (600795) is currently characterized by a short-horizon strength signal that is not yet fully echoed by mid-to-long horizon ranking behavior. Within KGNAI’s China universe (239 instruments), the daily and weekly ranks sit in the upper tier (#40 and #13), while monthly and longer windows remain closer to the middle of the distribution (#118 monthly; #76 to #95 across 3–6 months; #86 yearly). Technically, the moving-average structure is constructive (close vs MA50 bullish; MA50 vs MA200 bullish), and the blended technical read remains Bullish (overall technical score 0.558; DRL technical rank #21). However, momentum and volatility are not displaying an aggressive breakout profile: RSI bias is Neutral, the MACD histogram is positive but small (0.0020), and Bollinger bandwidth is contained (0.0510). With support near 4.7208 and resistance near 5.0800, the current setup is best framed as a consolidation with selective bullish bias, where confirmation depends on price acceptance beyond key levels.
- Rank stance: Short-term Bullish (daily #40, weekly #13) | Mid-term Neutral (monthly #118; 3–6M #76–#95) | Long-term Neutral (yearly #86)
- Technical confluence: Bullish (18-signal score 0.444; blended overall 0.558; DRL rank #21)
- Key levels: Support ~ 4.7208 | Resistance ~ 5.0800
- News sentiment bias: Neutral (avg 0.013; 94% Neutral; 0% Negative)
- Confirmation / invalidation: Sustained trade above 5.0800 with volume aligns with continuation; a close below 4.7208 increases deterioration risk.
What KGNAI Measures
KGNAI evaluates assets using large cross-sectional datasets built from millions of structured data points. Inputs incorporate fundamental metrics, technical structures, and systematically processed news sentiment. Statistical models, machine learning, and AI frameworks are used to assess relative positioning, signal alignment, and probabilistic behavior across broad universes.
How to Read This Report
- Ranks are comparative across the tracked universe, not absolute price targets.
- Confluence reflects alignment among independent signal groups.
- Support/resistance levels are probabilistic decision zones, not guarantees.
- Sentiment provides contextual bias within the broader analytical framework.
1) KGNAI AI Analysis
Region: CHINA
Total universe size: 239 ranked instruments
- Daily rank: #40 out of 239 — Bullish
- Weekly rank: #13 out of 239 — Bullish
- Monthly rank: #118 out of 239 — Neutral
- 3-Monthly rank: #76 out of 239 — Neutral
- 6-Monthly rank: #95 out of 239 — Neutral
- Yearly rank: #86 out of 239 — Neutral
The rank curve across horizons is the core feature: short-term positioning is materially stronger than the medium and long windows. A weekly rank of #13 places 600795 in the upper portion of the tracked set, consistent with the current Bullish short-term label. By contrast, the monthly rank at #118 sits near the middle of the universe, indicating that the recent improvement has not yet translated into sustained cross-sectional strength.
The transition from daily #40 to 3–6 month ranks of #76 and #95 reads as a “front-end bid” rather than a fully established regime change. In practical market-structure terms, that often corresponds to flows improving (or selling pressure easing) without a broad re-rating across longer lookbacks. The yearly rank #86 reinforces the view that longer-horizon dominance is not yet present.
Framed as a probability statement rather than a forecast: the rank stack suggests asymmetry is currently concentrated in the near term, while the baseline for longer horizons remains neutral. This configuration tends to be most sensitive to confirmation from price structure (trend acceptance) and participation (volume/accumulation signals), which are treated in the technical sections below.
2) Price & trend overview
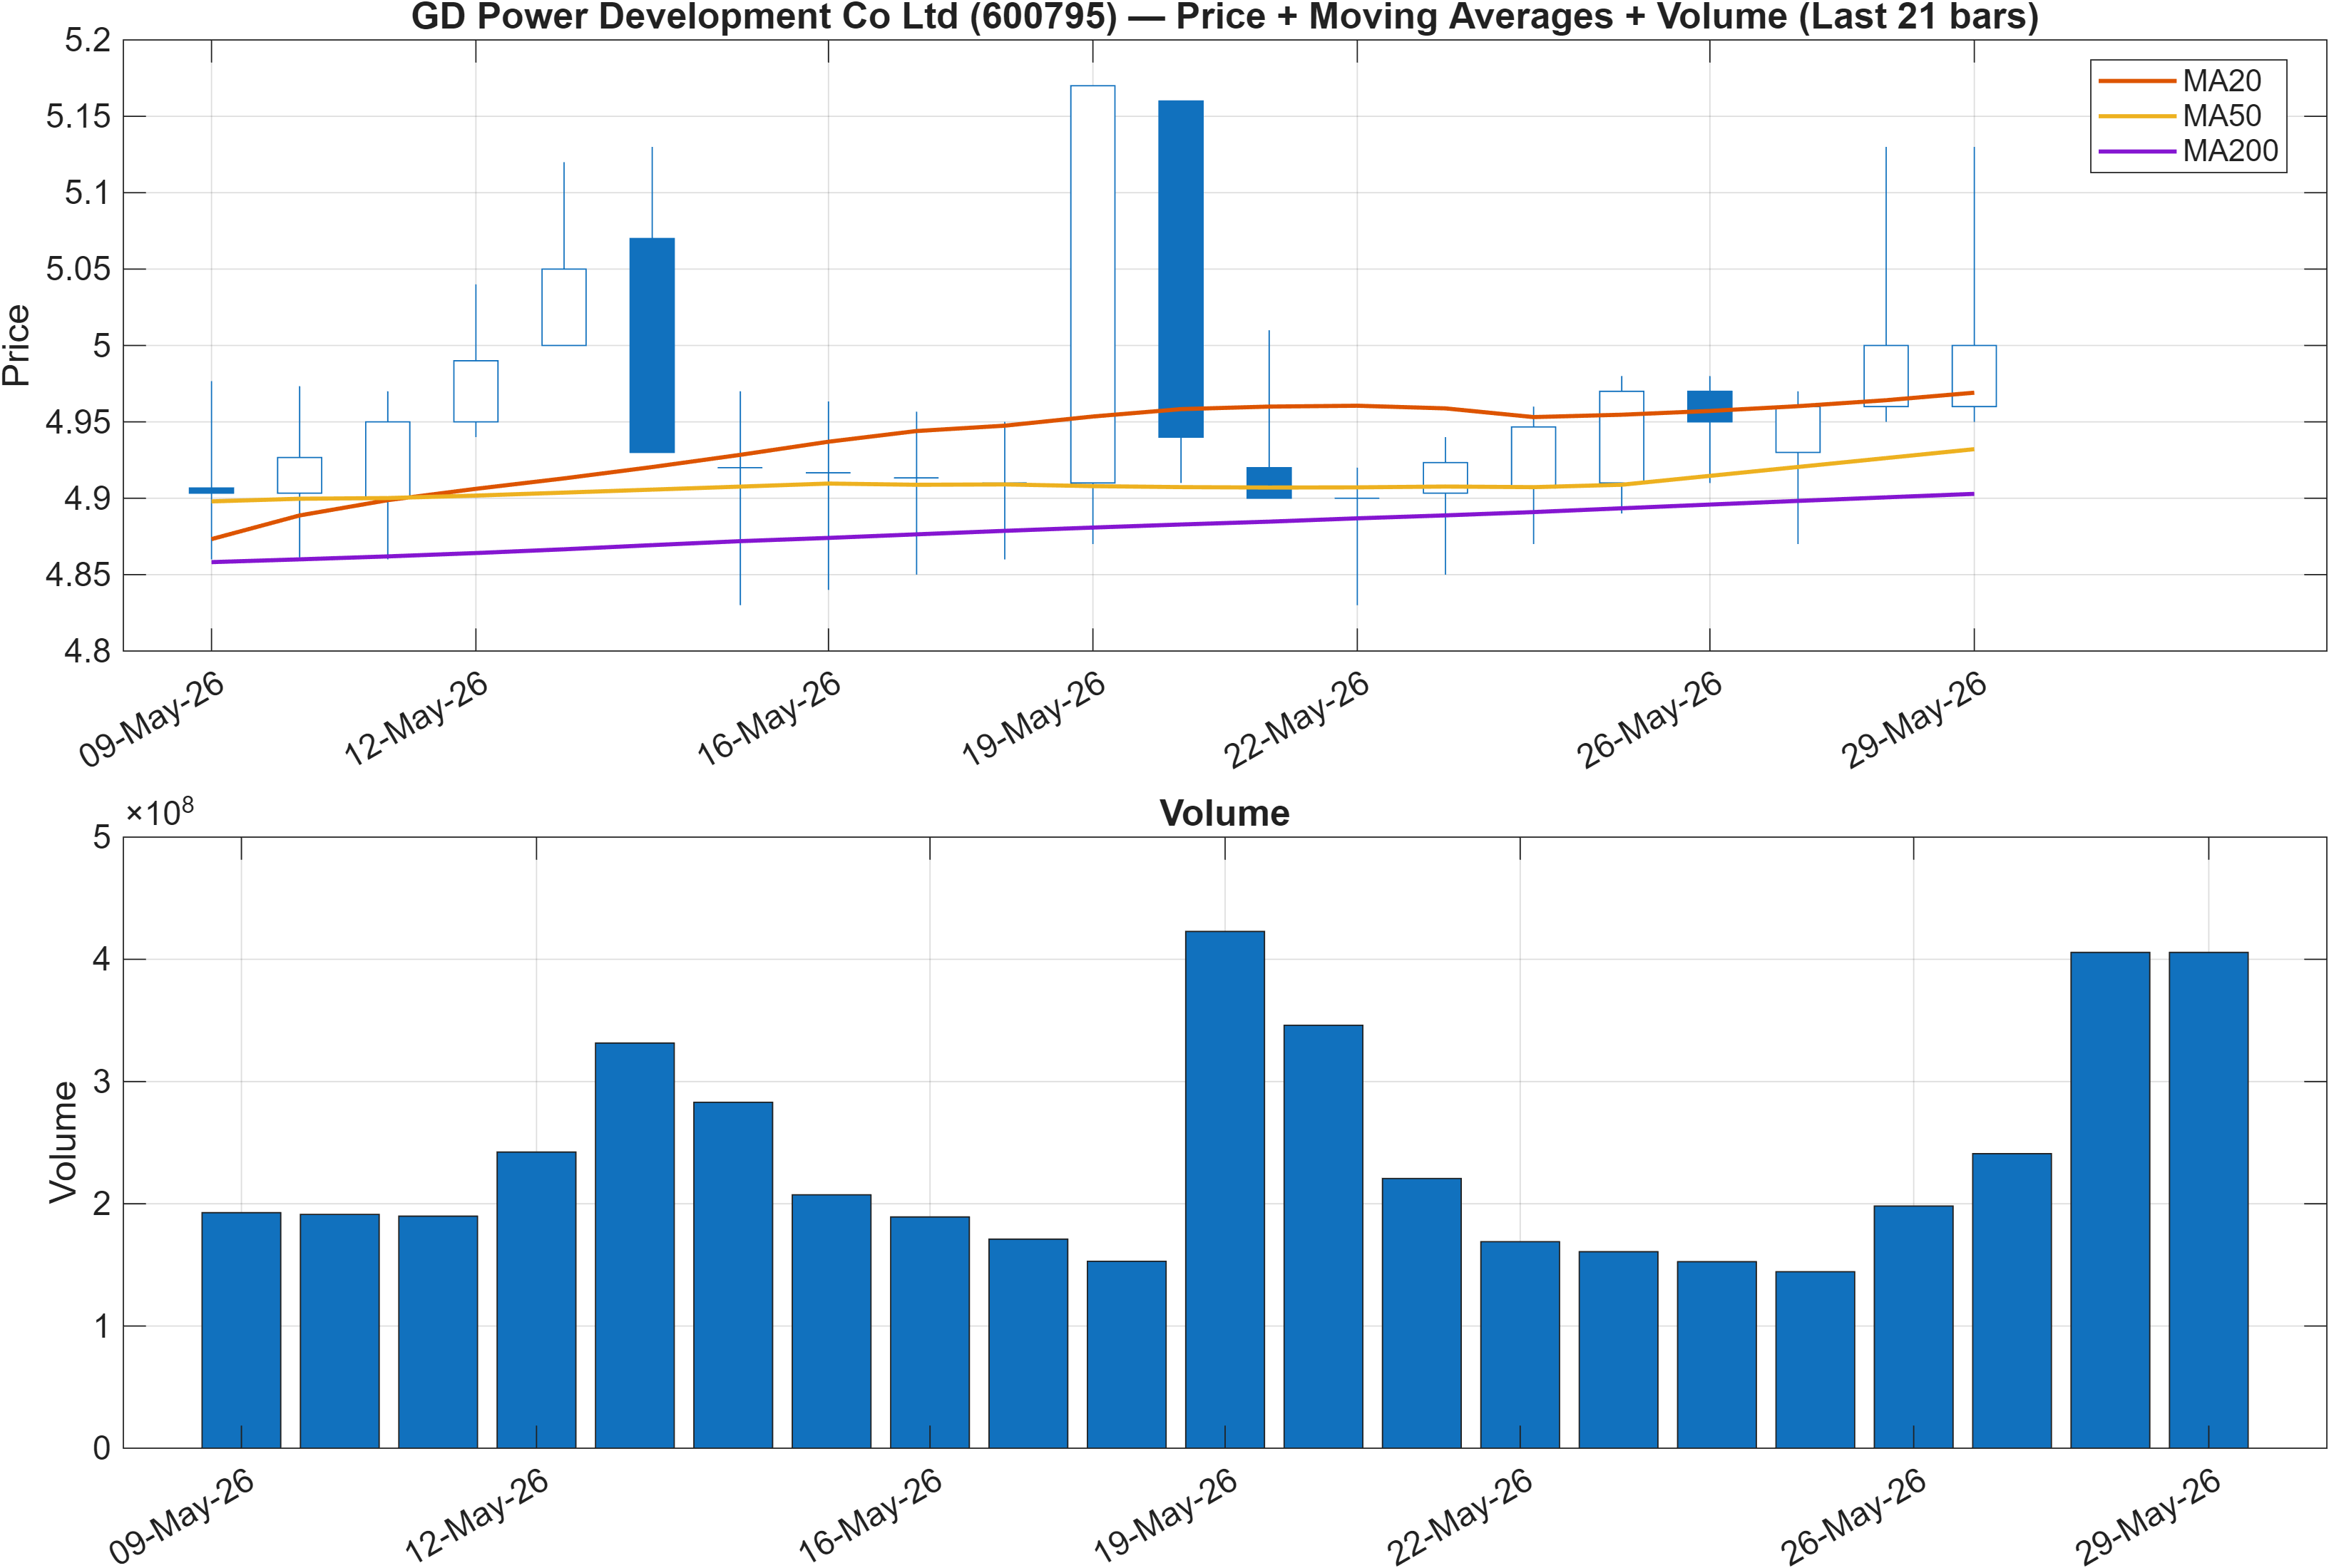
Trend structure is currently defined by a constructive moving-average configuration: close vs MA50 = Bullish and MA50 vs MA200 = Bullish. That combination typically signals that the market has maintained upward bias across both intermediate and longer filters, even when shorter-term consolidation develops. Importantly, this does not guarantee trend persistence; it does, however, shift the burden of proof toward sellers when price remains above the faster trend proxy.
The more nuanced question is whether the present state is a continuation pattern or a pause that precedes mean reversion. The rank stack from Section 1 provides context: with weekly strength (rank #13) coexisting alongside a neutral monthly rank (#118), price can be trending while cross-sectional persistence remains unconfirmed. This is often where the market “tests” commitment—buyers can maintain structure, but follow-through becomes sensitive to incremental demand rather than broad risk-on conditions.
From a regime lens, the chart should be read as trend-positive but not trend-complete. With resistance later identified at 5.0800, the moving-average alignment is most informative if price can accept above that level rather than repeatedly rejecting it. Conversely, trend quality would be challenged if price action migrates toward the 4.7208 support region—especially if that occurs alongside deterioration in momentum/participation measures discussed next.
Interpretation (given): Close vs MA50 = Bullish, MA50 vs MA200 = Bullish.
3) Momentum & volatility dashboard
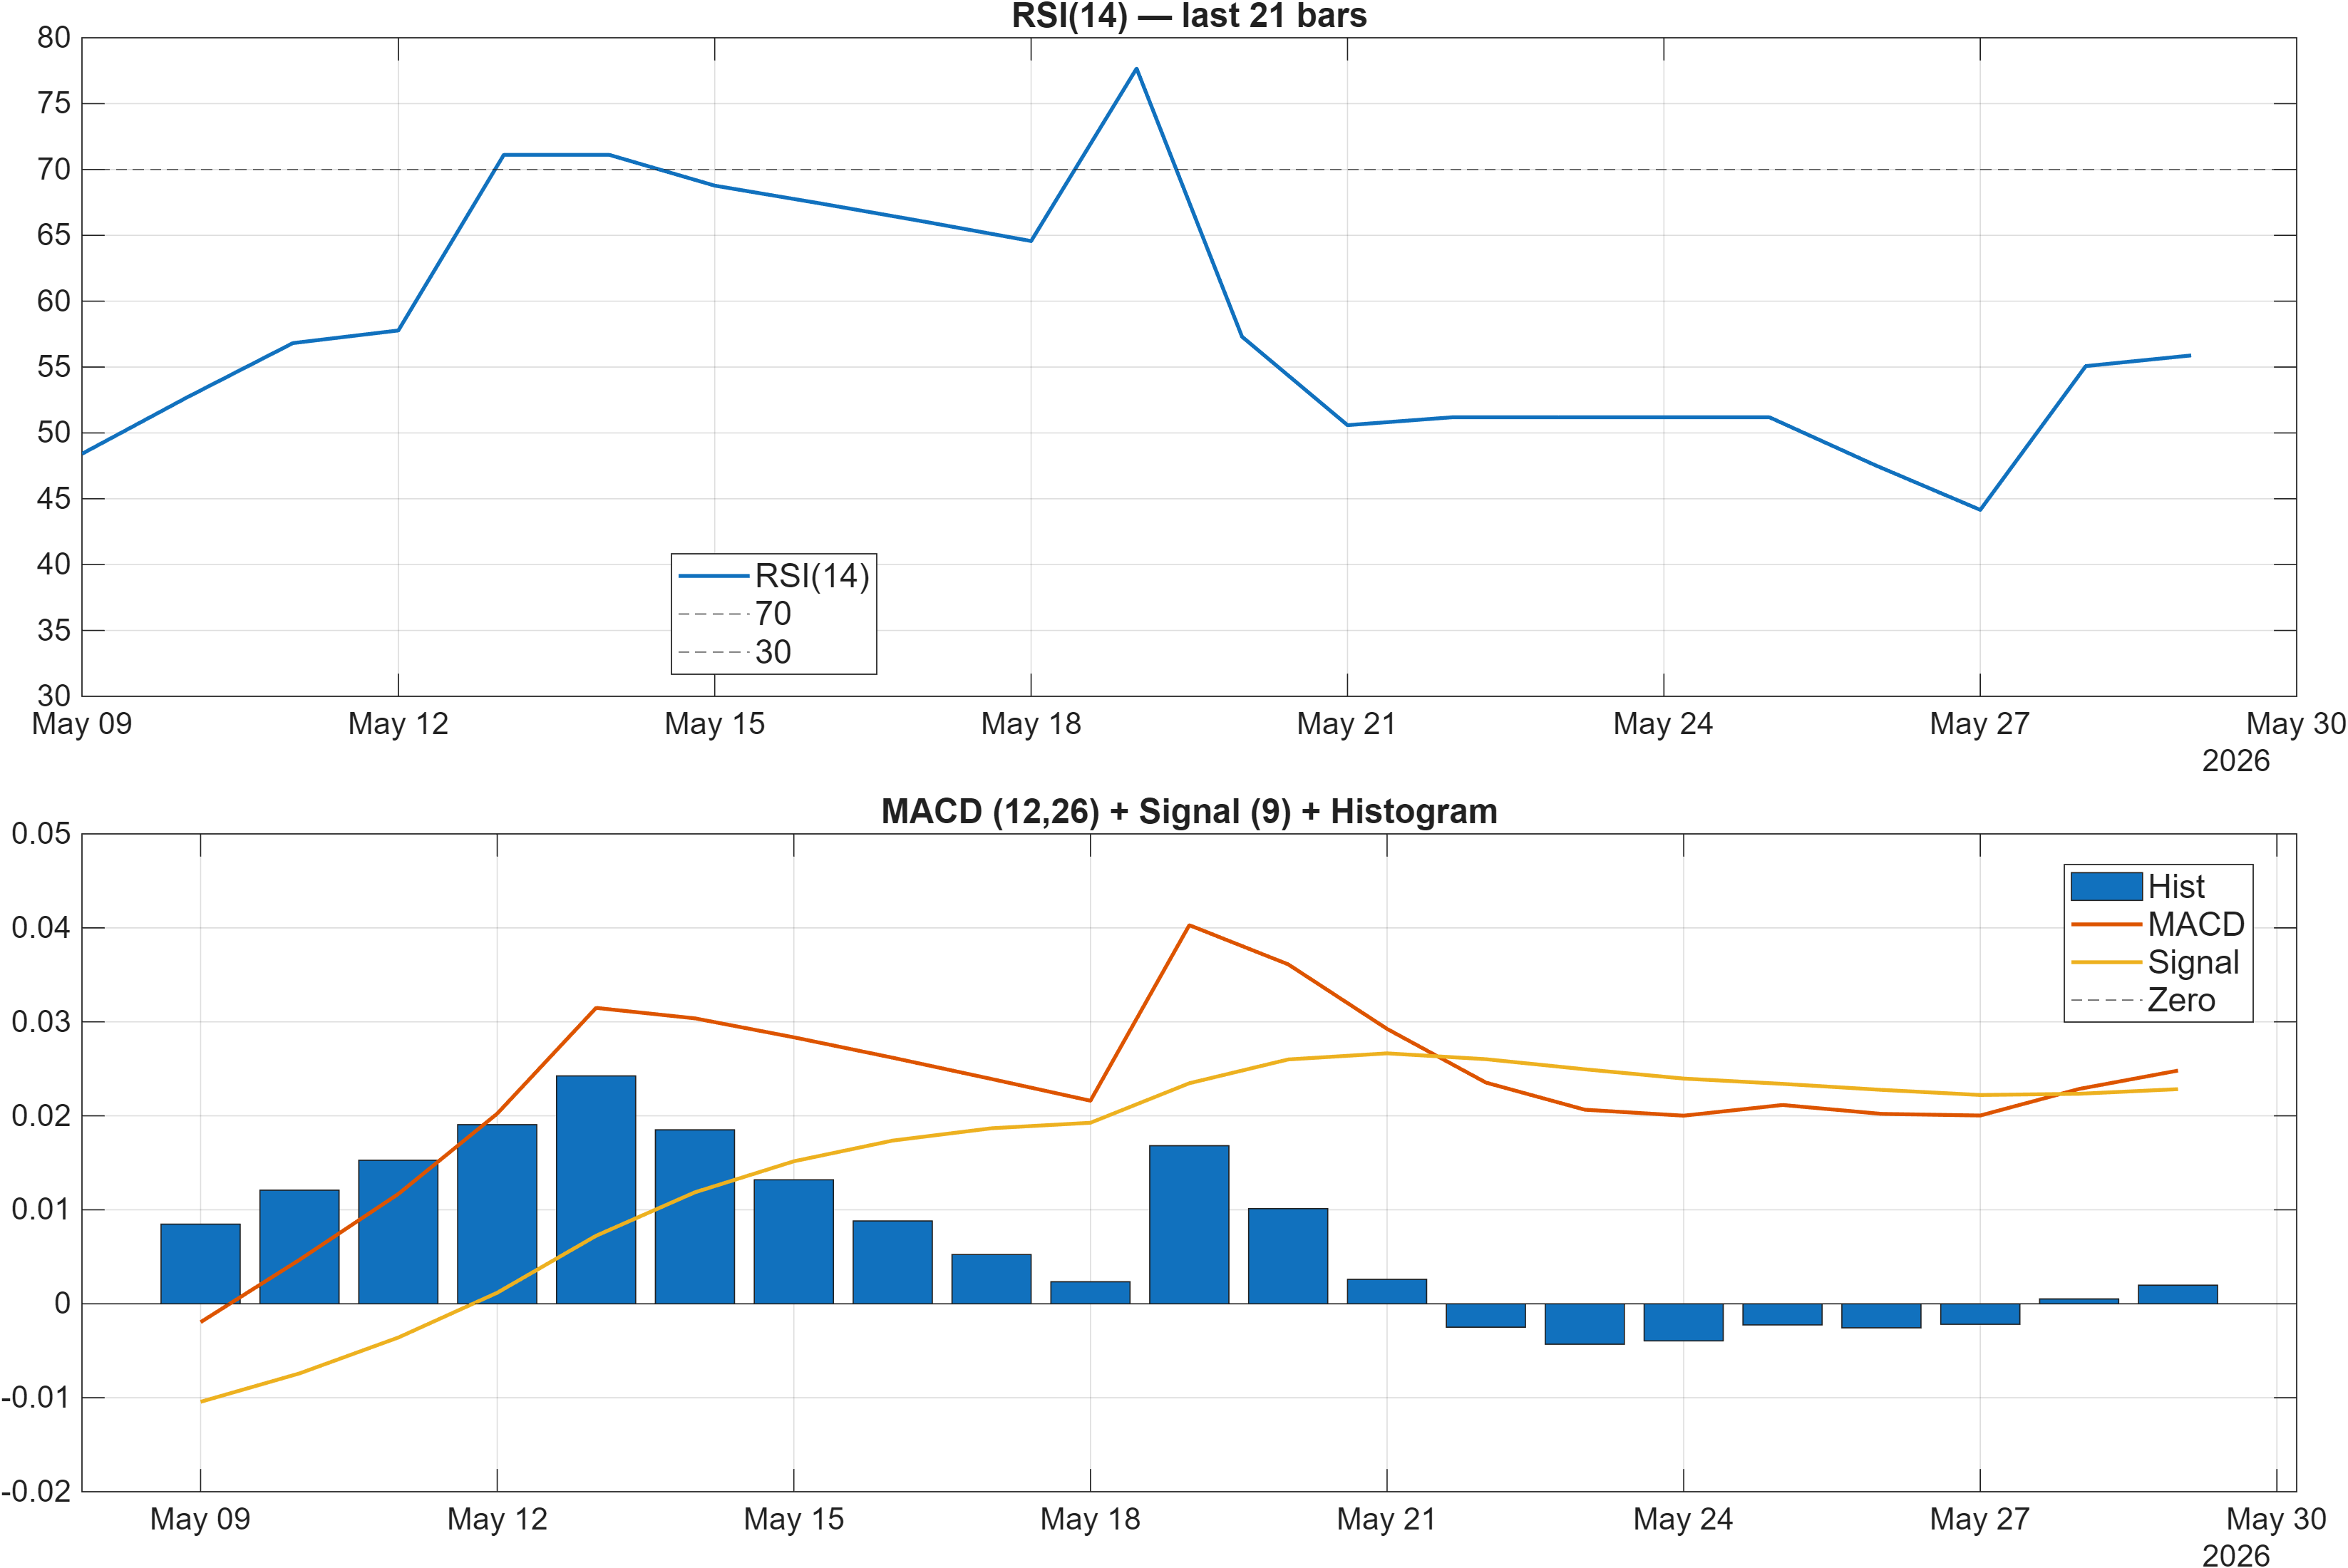
Momentum conditions are supportive but not emphatic. The MACD histogram at 0.0020 is positive, which is directionally consistent with the Bullish moving-average read, yet the magnitude remains small—often a hallmark of signal compression rather than expansion. In that state, incremental price advances can occur, but the setup is more vulnerable to whipsaw if participation does not broaden.
RSI framing is similarly balanced: the dashboard calls RSI bias = Neutral, while the 18-signal table later lists RSI(14) at 55.88 as Bullish. Together, that suggests RSI is not in an overbought condition and remains consistent with a mild positive drift, but it is not yet delivering the kind of strong momentum confirmation typically seen in trending breakouts.
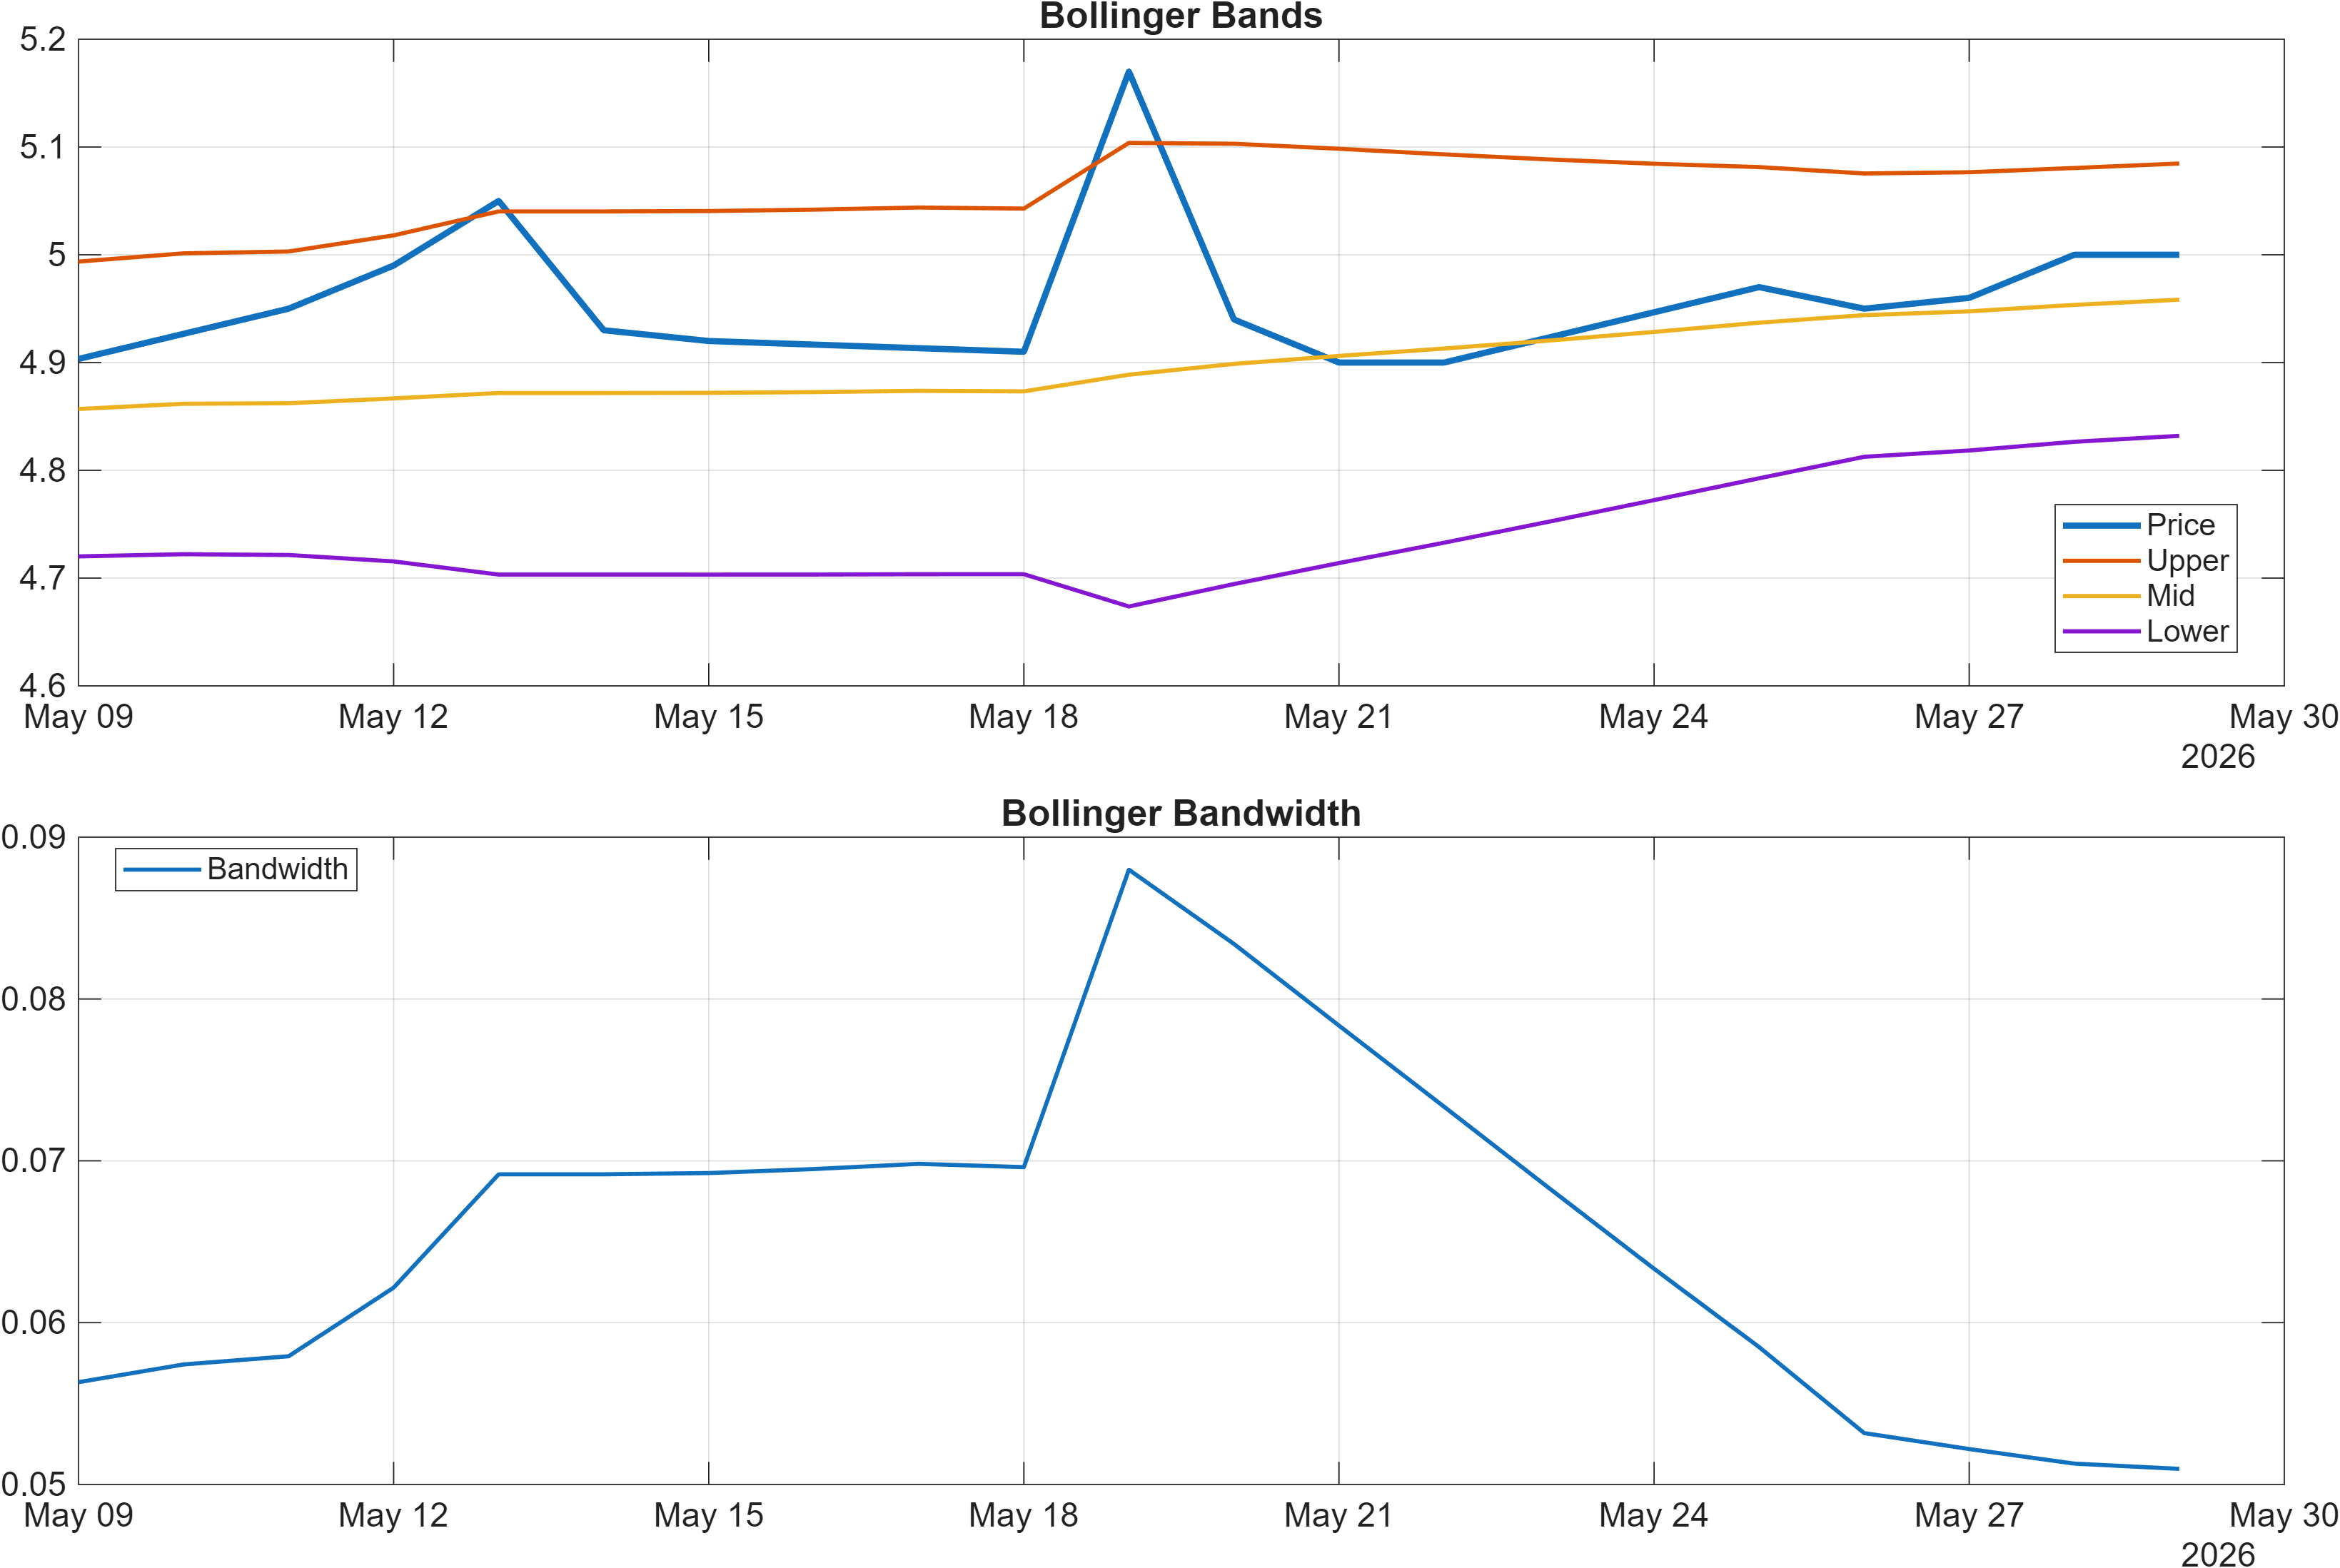
Volatility remains contained: Bollinger bandwidth latest = 0.0510 (BB Width in the signal table aligns at 0.05097, Neutral). A tight band regime frequently precedes a directional move, but direction is not implied by compression alone. For 600795, the constructive trend filters (MA alignment) and positive MACD histogram argue that any volatility expansion would be most consistent with upside continuation, yet the neutral RSI framing cautions that confirmation should be sought via level breaks rather than indicator inference.
Interpretation (given): RSI bias = Neutral, MACD hist = 0.0020. Bandwidth (volatility regime) latest = 0.0510.
4) Support / Resistance zones
Support ~ 4.7208 | Resistance ~ 5.0800
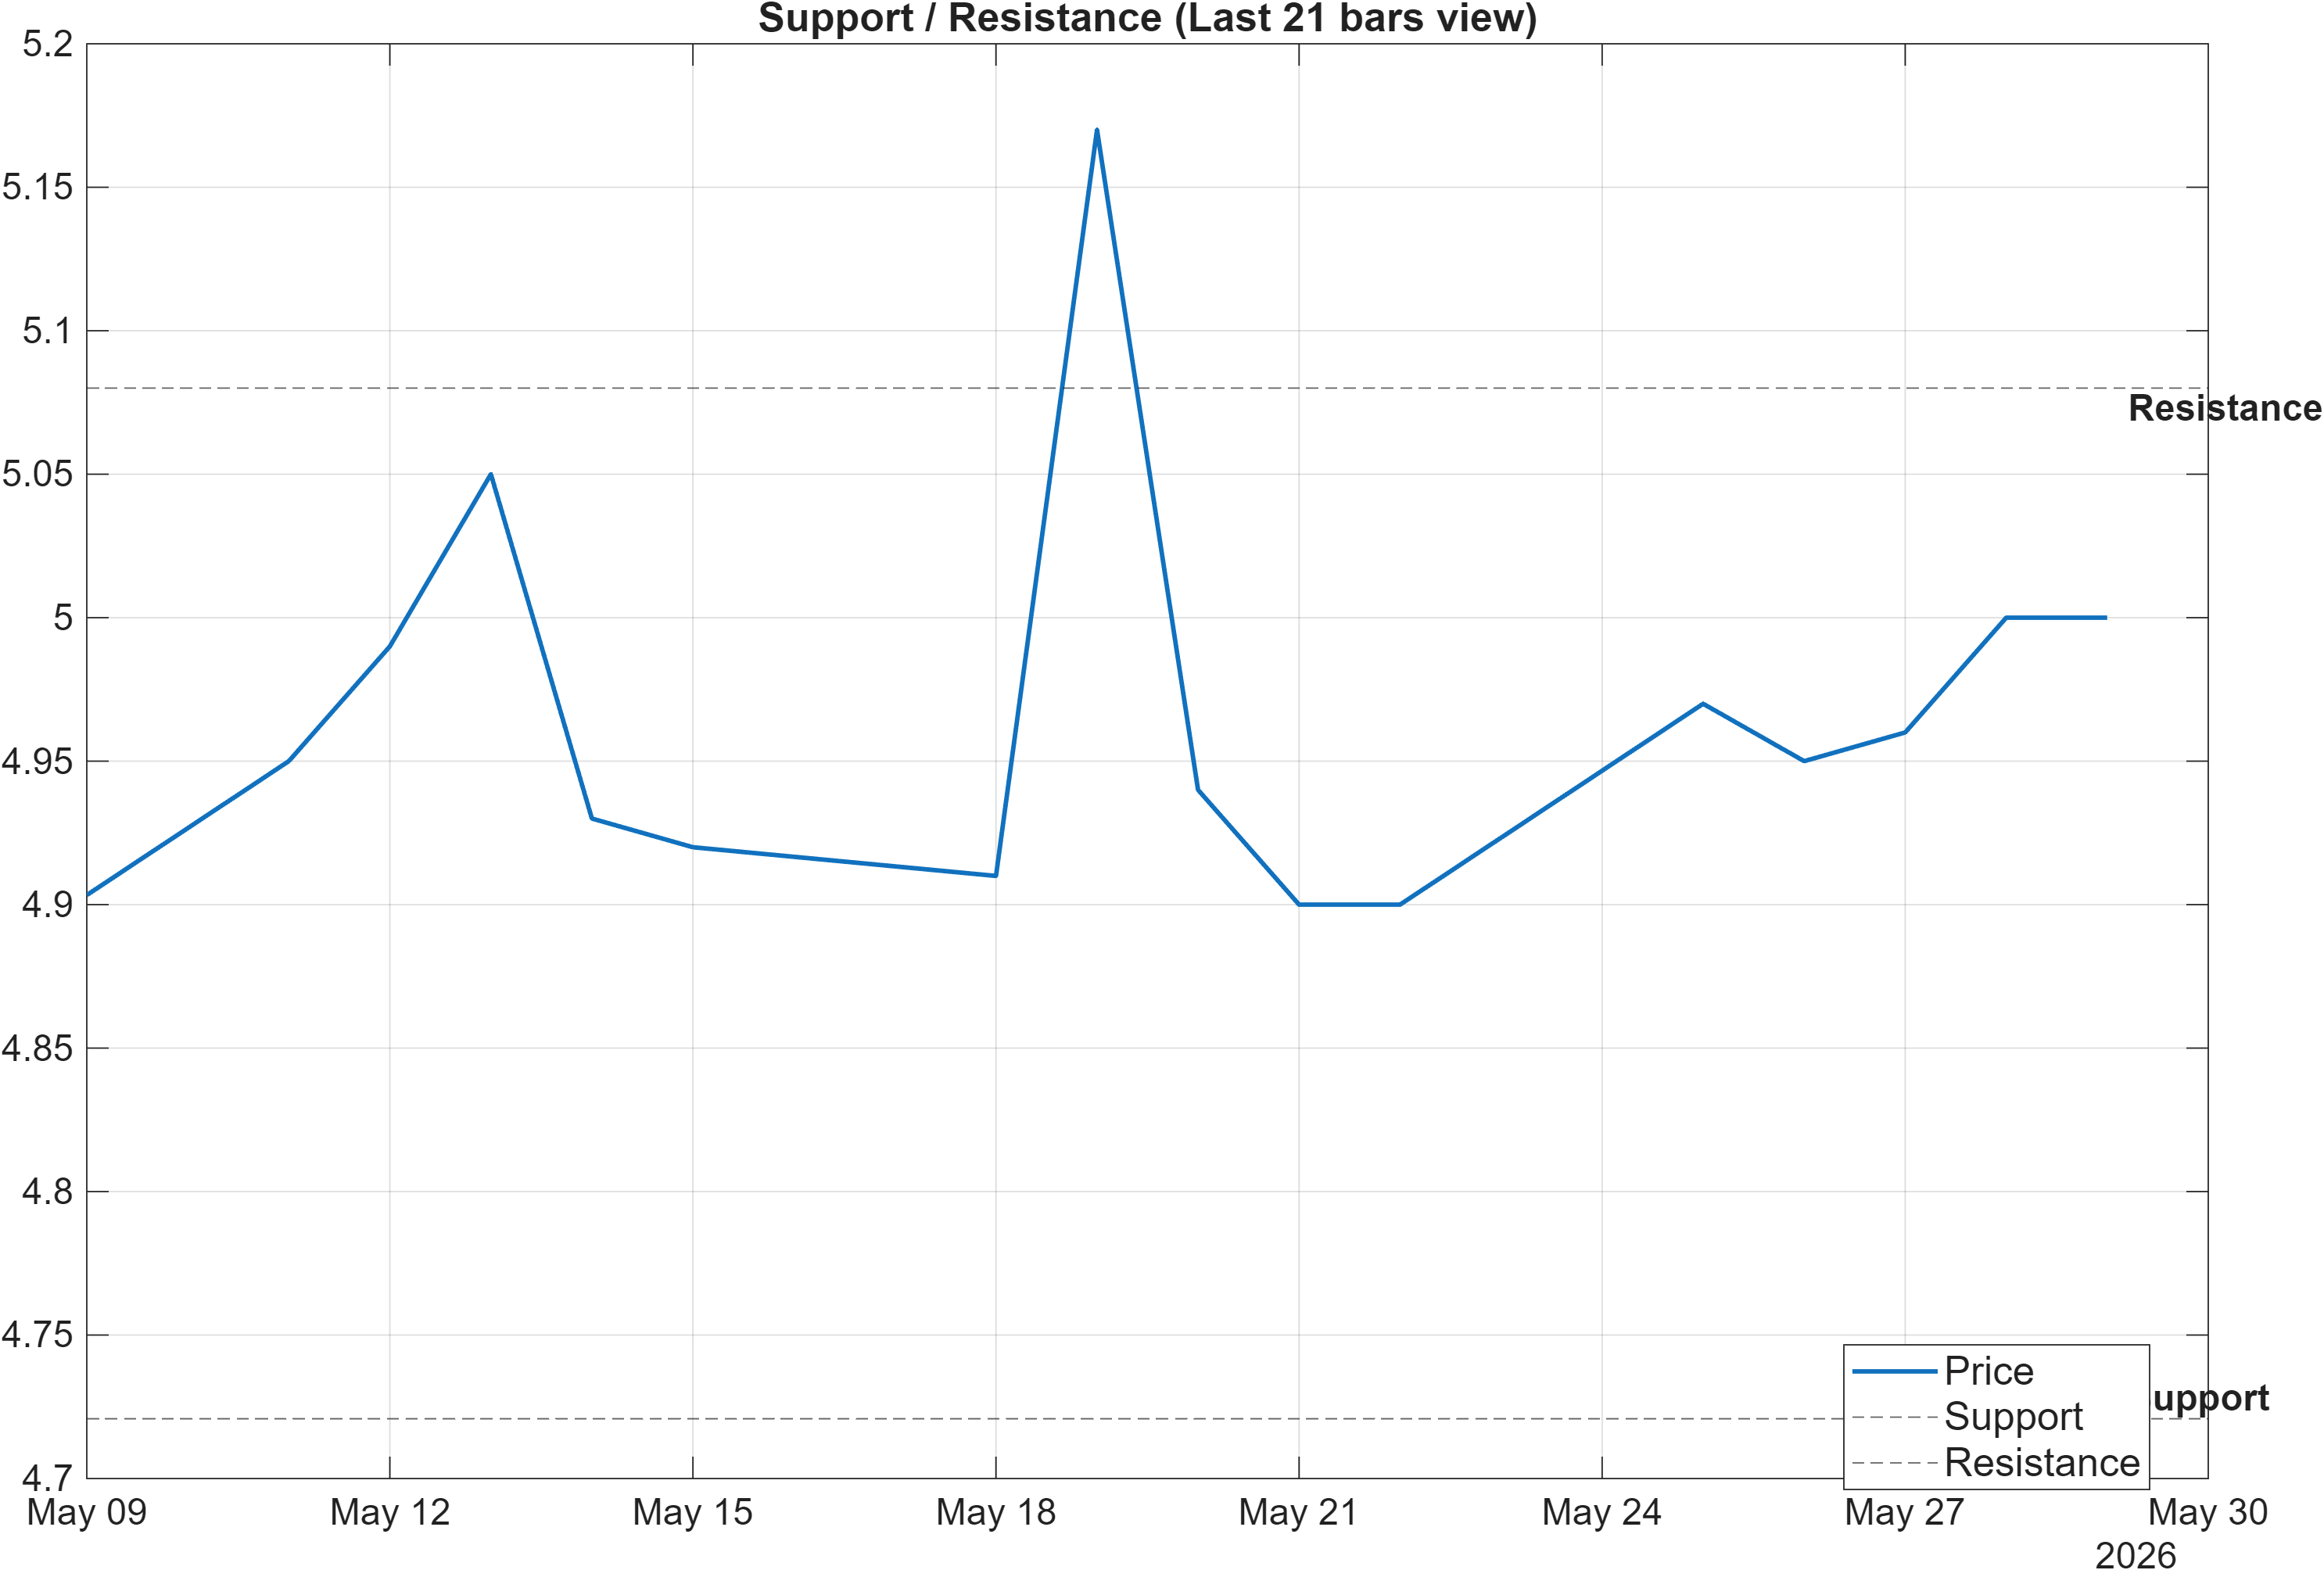
The current map is clean and tradable: 4.7208 defines the near-term support zone, while 5.0800 is the primary resistance reference. Given the compressed volatility profile (bandwidth 0.0510), these levels are likely to act as decision points where the next regime—continuation versus retracement—becomes observable.
Resistance at 5.0800 has added relevance because the broader technical stack is already constructive (moving-average alignment Bullish; overall technical score 0.558 Bullish). In such cases, the most informative outcome is not a momentary spike above resistance but sustained acceptance—particularly if it coincides with stronger participation signals (the 18-signal dashboard includes a Bullish Vol ROC(20) of 112.1, which can support follow-through when price engages resistance).
On the downside, 4.7208 is best treated as the level where neutral longer-horizon ranks can “reassert” if breached. With the monthly rank at #118 still neutral, a close below support would be consistent with the report’s stated deterioration risk scenario rather than a surprise anomaly. In that case, attention typically shifts from trend continuation to whether downside moves are orderly (mean reversion) or accompanied by worsening accumulation/participation measures (distribution).
Scenario view (given): Break above resistance with volume → continuation. Close below support → signal deterioration risk.
5) Quant Technical Dashboard (18 Signals)
KGNAI AI Technical Analysis Score (Deep Reinforcement Learning): Rank #21 out of 239 (Rank 1 represents the strongest technical positioning and a higher probability of favorable price behavior. As ranks increase toward the maximum, the probability of favorable outcomes weakens and bearish positioning becomes more dominant.) | Label: Bullish | Score: 0.824
18-Signal Technical Confluence Score: 0.444 (Bullish)
Overall Technical Score (18-signal confluence + DRL rank blend): 0.558 (Bullish)
Note: The blended score reflects signal strength weighted against broader AI technical ranking, which may temporarily diverge.
Blended technical score breakdown: 0.558 (Bullish | Bull 10 / Bear 2 / Neutral 6)
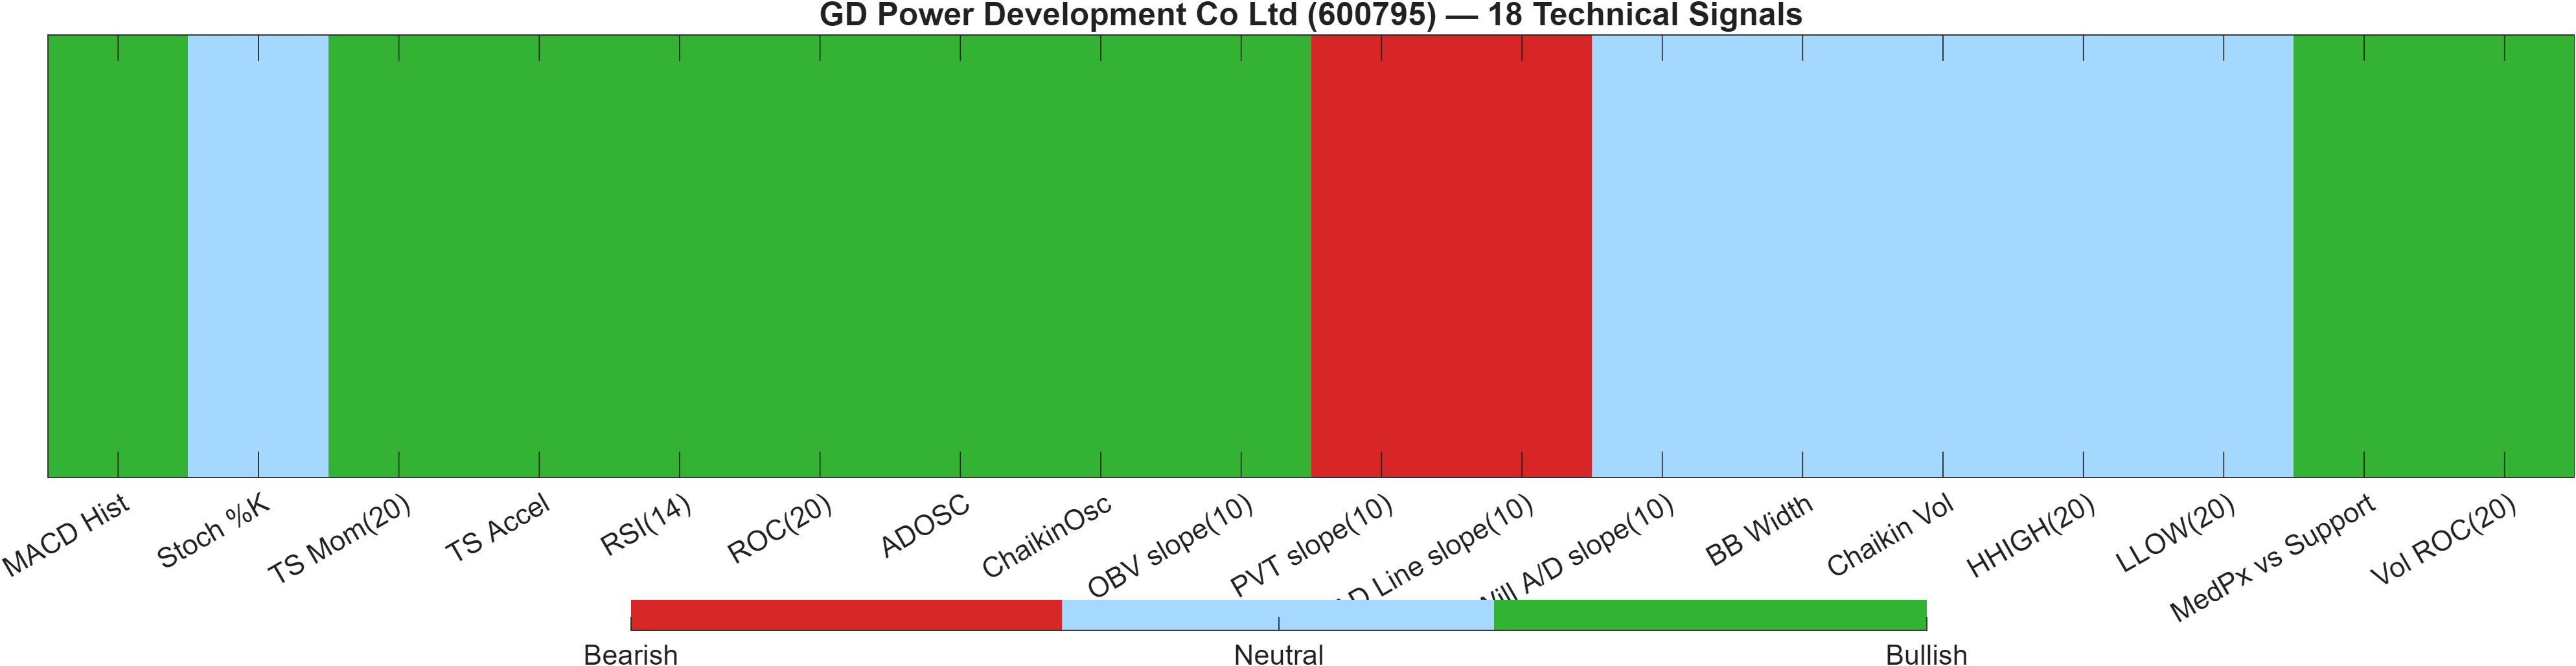
The technical dashboard shows a Bullish aggregate, but the composition matters. The DRL rank #21 (score 0.824) places 600795 in a strong technical tier relative to the 239-instrument universe, while the 18-signal confluence score is more moderate at 0.444. The blended score of 0.558 (Bullish) indicates that model-based ranking is providing additional support beyond the raw indicator mix.
Internally, the “Bull 10 / Bear 2 / Neutral 6” split implies breadth skewed positive, yet not unanimous. The two explicit bearish elements—PVT slope(10) -1.205e+07 and AD Line slope(10) -2.084e+08—are notable because they sit in the participation/accumulation family. That creates a measured divergence: price/momentum signals are generally constructive (e.g., MACD Hist 0.001975; TS Mom(20) 0.07333; RSI(14) 55.88 marked Bullish), while some flow-sensitive measures remain less cooperative.
Volatility-related indicators are mostly neutral (BB Width 0.05097; Chaikin Vol -21.44), consistent with the earlier bandwidth observation (0.0510). That combination typically elevates the importance of the level framework: if price clears 5.0800, the positive momentum/trend mix may pull the remaining neutral/bearish components into alignment; if price loses 4.7208, the participation divergence becomes more consequential.
Signal table (Bull/Bear/Neutral)
| Indicator | Value | Signal |
|---|---|---|
| MACD Hist | 0.001975 | Bullish |
| Stoch %K | 51.52 | Neutral |
| TS Mom(20) | 0.07333 | Bullish |
| TS Accel | 0.08667 | Bullish |
| RSI(14) | 55.88 | Bullish |
| ROC(20) | 1.488 | Bullish |
| ADOSC | 61.11 | Bullish |
| ChaikinOsc | 4.515e+07 | Bullish |
| OBV slope(10) | 3.395e+08 | Bullish |
| PVT slope(10) | -1.205e+07 | Bearish |
| AD Line slope(10) | -2.084e+08 | Bearish |
| Will A/D slope(10) | 0 | Neutral |
| BB Width | 0.05097 | Neutral |
| Chaikin Vol | -21.44 | Neutral |
| HHIGH(20) | 5.17 | Neutral |
| LLOW(20) | 4.83 | Neutral |
| MedPx vs Support | 0.3192 | Bullish |
| Vol ROC(20) | 112.1 | Bullish |
Interpretation (given): Indicator-level signals form the base confluence, which is then adjusted using a separate AI-driven technical ranking model. The final technical score summarizes this combined view.
6) News sentiment + extractive gist
Note: Instrument-specific news matches were not found, so the digest includes broader market/sector headlines. Links are provided for verification.
Sentiment score (avg): 0.013 | Positive: 6% | Neutral: 94% | Negative: 0%
KGNAI AI News Sentiment Score (normalized -1 to +1): Not available (as of —) | Label: Not available | Overall news score: 0.01
Positive Developments
Recent coverage across major financial outlets indicates a broadly constructive, low-friction sentiment environment rather than a catalyst-driven tape. The distribution is dominated by neutrality (94%), while the average sentiment score remains slightly positive at 0.013. In that context, “positive developments” are best interpreted as the absence of adverse narrative pressure rather than a wave of instrument-specific optimism—especially since instrument-level matches were not found in the provided data. For a technically constructive setup (overall technical score 0.558; DRL rank #21), a neutral-to-slightly-positive backdrop can be supportive by reducing headline-driven volatility, allowing price to engage resistance near 5.0800 on technical merit. The small positive skew also aligns with compressed volatility (bandwidth 0.0510), where marginal improvements in risk appetite can matter more than large discrete news events.
Neutral / Mixed Developments
The more defining characteristic is information noise rather than targeted fundamental updates. With the KGNAI AI News Sentiment Score marked as Not available and the digest built from broader market/sector items, the news layer should be treated as a context filter rather than a primary driver. A 6% positive share against 94% neutral suggests limited narrative momentum—consistent with the price/indicator picture where MACD histogram is positive but small (0.0020) and RSI bias is Neutral. This mix tends to reward process: watching whether the market confirms the bullish moving-average structure via level acceptance, rather than attempting to infer direction from generalized headlines.
Negative / Risk Signals
Risk signals in the sentiment panel are primarily about potential fragility from non-specific news rather than explicit negative instrument headlines. The negative share is 0%, which reduces the probability of abrupt headline shocks in the dataset; however, the lack of instrument-specific matches itself is a limitation. When a name is technically constructive yet the longer-horizon ranks remain neutral (monthly #118; yearly #86), the primary risk is that an exogenous macro or sector headline can become the trigger that forces price back toward support (4.7208) before the trend matures. In practice, the most actionable “risk” is monitoring whether participation divergences (e.g., bearish PVT slope and AD Line slope in the technical table) worsen if price fails to sustain above resistance.
- Whether news remains predominantly neutral while price tests 5.0800, or whether sentiment shifts coincide with a volatility expansion from bandwidth 0.0510.
- Any change in the positive/neutral split from 6% / 94% that overlaps with deteriorating price behavior near 4.7208.
- Whether generalized sector or macro headlines align with improving participation signals rather than conflicting with them.
Sources referenced: Reuters, Bloomberg, Yahoo Finance, MarketWatch, Investing.com
Snapshot: AI Rank (Short–Mid–Long): Mixed (Bullish–Neutral–Neutral) · Technical Confluence: Bullish · Key Levels: Support ~4.72 | Resistance ~5.08 · News Sentiment: Neutral
7) Sources
- Milan restores 19th century bull mosaic’s testicles to former glory — https://www.scmp.com/news/world/europe/article/3355226/milan-restores-19th-century-bull-mosaics-testicles-former-glory?utm_source=rss_feed
- Strikes kill family of 6 after Israel declares south Lebanon ‘combat zone’ — https://www.scmp.com/news/world/middle-east/article/3355225/strikes-kill-family-6-after-israel-declares-south-lebanon-combat-zone?utm_source=rss_feed
- Bruce Springsteen calls out Trump, announces Maryland protest festival — https://www.scmp.com/news/world/united-states-canada/article/3355223/bruce-springsteen-calls-out-trump-announces-maryland-protest-festival?utm_source=rss_feed
- US farmers seek firmer soybean guarantees despite Xi-Trump agriculture pledge — https://www.scmp.com/news/us/article/3355222/us-farmers-seek-firmer-soybean-guarantees-despite-xi-trump-agriculture-pledge?utm_source=rss_feed
- Tentative agreement reached in Iran negotiations pending Trump’s approval: US officials — https://www.scmp.com/news/us/article/3355221/tentative-agreement-reached-iran-negotiations-pending-trumps-approval-us-officials?utm_source=rss_feed
- China’s BYD aims for zero accidents with ‘God’s Eye’, vows crash cost coverage — https://www.scmp.com/business/china-evs/article/3355217/chinas-byd-aims-zero-accidents-gods-eye-vows-crash-cost-coverage?utm_source=rss_feed
- For a yuan in deeper markets, Fed ex-president cites dollar playbook amid risks, criticism — https://www.scmp.com/economy/global-economy/article/3355195/yuan-deeper-markets-ex-feds-evans-cites-dollar-playbook-amid-risks-criticism?utm_source=rss_feed
- America at 250: how Trump’s foreign policy is redefining the US story — https://www.scmp.com/news/china/diplomacy/article/3355142/america-250-how-trumps-foreign-policy-redefining-us-story?utm_source=rss_feed
You may also like: How KGNAI AI ranks instruments across global markets
Disclaimer: KGNAI provides AI-generated analytics and educational market commentary only. This is not financial advice. Markets involve risk. Always do your own research.