
688090 — Guangzhou Risong Intelligent Technology Holding Co Ltd (27-May-2026) | Sideways Structure with Mixed Rank Pressure
Guangzhou Risong Intelligent Technology Holding Co Ltd (688090) is currently characterized by a sideways-to-range structure where short-horizon KGNAI ranks remain weak while the technical layer reads as broadly neutral. As of 27-May-2026, the security sits in the lower decile on Daily and Weekly ranks (bearish positioning), yet the Monthly rank is comparatively strong, creating a clear timeframe divergence rather than a single-direction trend message. On-chart trend context shows a constructive moving-average relationship (Close vs MA50 bullish; MA50 vs MA200 bullish), but momentum and confirmation signals are less aligned: RSI(14) is neutral at 47.91 and MACD histogram is negative at -0.3953. Volatility is not elevated, with Bollinger Bandwidth at 0.1115, suggesting a regime where levels and confirmation conditions matter more than chasing moves. Key risk/reward zones remain defined by support near 57.6112 and resistance near 93.0717, while the news digest is neutral due to limited instrument-specific matches in the provided data.
- Rank stance (Short / Mid / Long): Short-term Bearish; mid-term Neutral; long-term Neutral (Monthly rank remains comparatively constructive versus Daily/Weekly weakness).
- Technical confluence: Neutral (18-signal confluence 0.278; overall technical score 0.266).
- Key levels: Support ~ 57.6112 | Resistance ~ 93.0717.
- News sentiment bias: Neutral (avg sentiment 0.063; 25% positive / 75% neutral / 0% negative; normalized score Not available in the provided data).
- Confirmation / invalidation: A break above 93.0717 with volume improves continuation odds; a close below 57.6112 increases deterioration risk.
KGNAI evaluates assets using large cross-sectional datasets built from millions of structured data points. Inputs incorporate fundamental metrics, technical structures, and systematically processed news sentiment. Statistical models, machine learning, and AI frameworks are used to assess relative positioning, signal alignment, and probabilistic behavior across broad universes.
- Ranks are comparative across the tracked universe, not absolute price targets.
- Confluence reflects alignment among independent signal groups.
- Support/resistance levels are probabilistic decision zones, not guarantees.
- Sentiment provides contextual bias within the broader analytical framework.
1) KGNAI AI Analysis
Region: CHINA
Total universe size: 1292 ranked instruments
- Daily rank: #1198 out of 1292 — Bearish
- Weekly rank: #1134 out of 1292 — Bearish
- Monthly rank: #121 out of 1292 — Bullish
- 3-Monthly rank: #1028 out of 1292 — Neutral
- 6-Monthly rank: #1016 out of 1292 — Neutral
- Yearly rank: Not available for this horizon — Not available
The rank stack is not uniformly directional; it is a timeframe divergence. Daily (#1198) and Weekly (#1134) sit near the bottom of the universe, consistent with weak short-horizon behavior probability versus peers. In contrast, the Monthly rank (#121) is in the upper quartile, indicating that longer swing behavior has recently been more resilient than the near-term tape implies.
This configuration often appears when price is consolidating while market participants disagree on the next leg: short-term signals can remain risk-off (flows fade rallies or liquidity thins), while the broader structure has not fully broken down. The 3-Monthly (#1028) and 6-Monthly (#1016) readings being labeled neutral—despite relatively high rank numbers—reinforce that the model is not assigning strong persistence to either direction at those horizons.
The stated term view (Short-term: Bearish; Mid-term: Neutral; Long-term: Neutral) is best read as a positioning map rather than a forecast. A practical implication is that upside attempts may require stronger confirmation (volume/level breaks) to overcome weak short-term rank pressure, while downside risk is better evaluated through key levels (Section 4) and whether technical confluence remains neutral (Section 5).
KGNAI ranks each instrument across large universes using multiple proprietary AI tests and statistical models (millions of data points). Lower ranks generally indicate stronger probability of favorable performance behavior, while higher ranks indicate weaker probability and more bearish positioning.
Term view: Short-term: Bearish. Mid-term: Neutral. Long-term: Neutral.
Want the full universe and complete rank tables? Unlock full access on KGNAI: https://www.kgnai.com/pricing
2) Price & trend overview
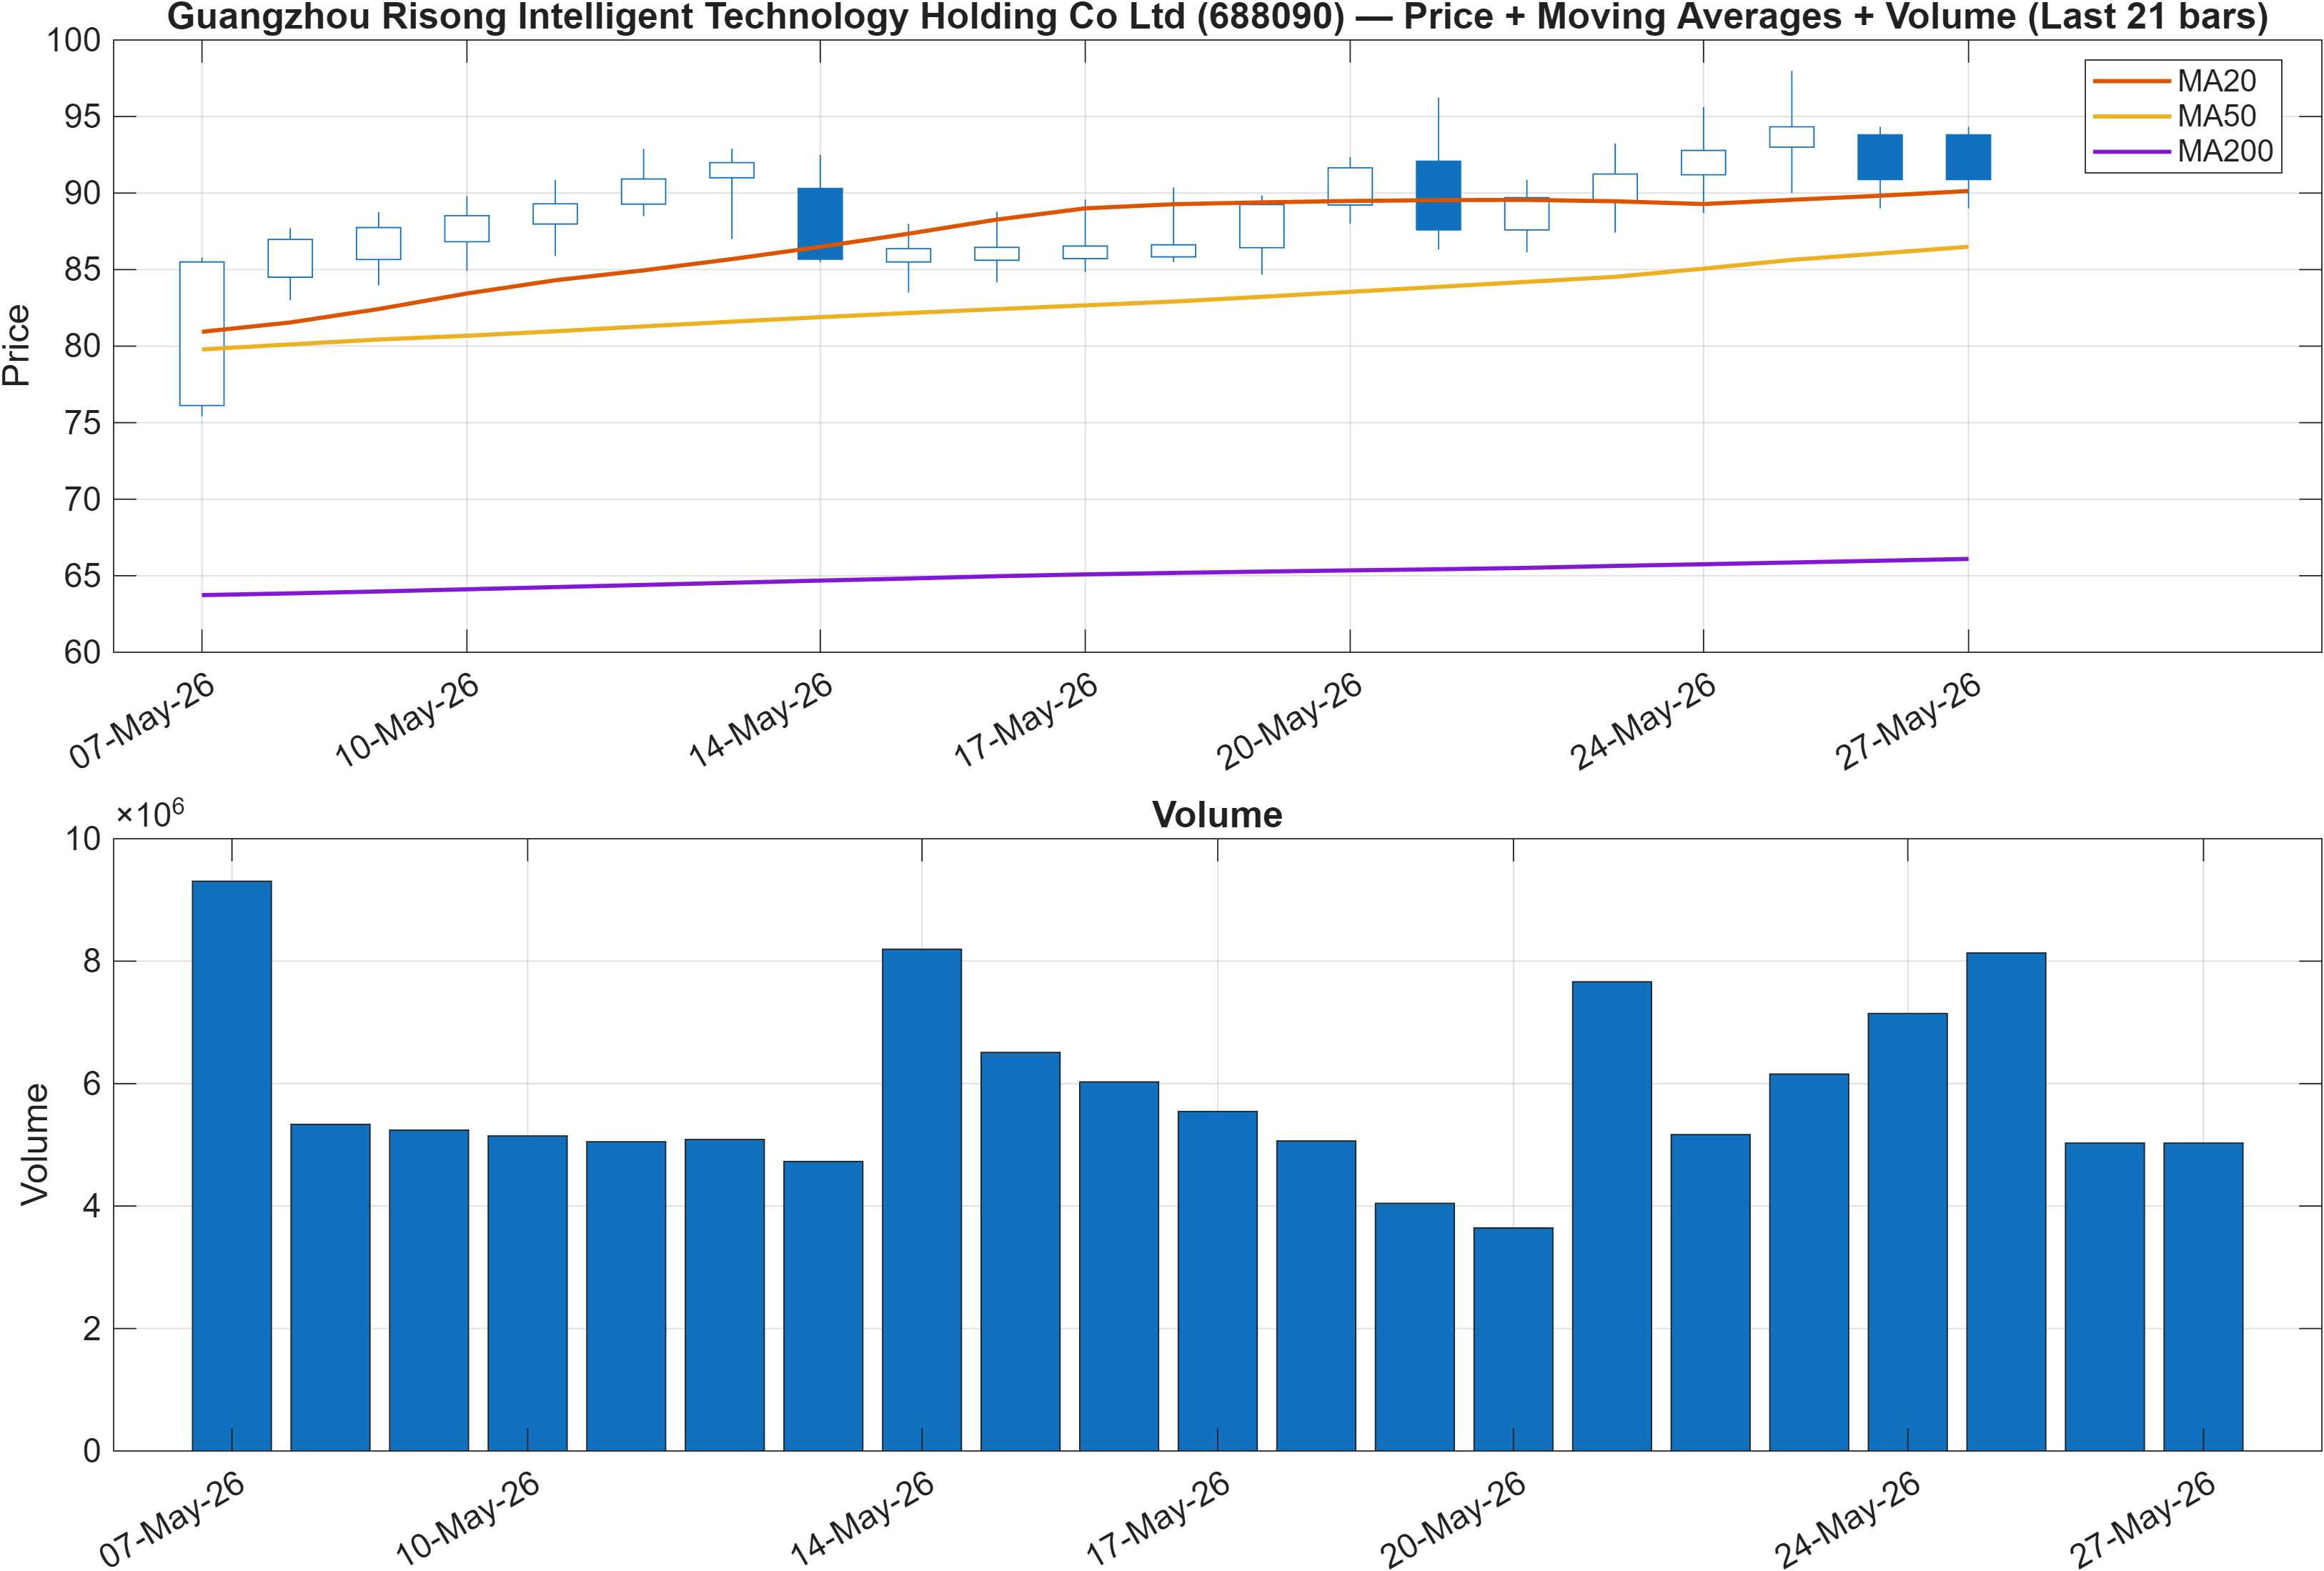
The moving-average structure is constructive on its face: Close vs MA50 is Bullish and MA50 vs MA200 is Bullish. That combination typically aligns with an uptrend framework (or a recovered trend) rather than a deep bearish regime. However, the article title’s “sideways structure” is consistent with a market that is trend-aligned but not trend-accelerating.
The key analytical tension is therefore trend structure vs short-horizon rank pressure. With Daily and Weekly ranks sitting deep in the universe’s weaker tail, the model is effectively cautioning that the near-term behavior is not matching a clean bullish continuation profile, even if the MA stack looks supportive. This often shows up when price oscillates around the MA50, producing frequent mean-reversion while preserving the longer trend relationship.
In this setting, the most informative confirmation tends to be level-based rather than narrative-based: the market needs evidence that it can transition from range behavior into directional continuation. The resistance zone highlighted later at 93.0717 becomes the practical “trend resumption” checkpoint, while the support at 57.6112 is the structural floor that would challenge the sideways thesis if lost on a closing basis.
The volume context in Figure 1 should be read as a validation tool: when trend structure is bullish but ranks are bearish, sustained participation on upswings (rather than sporadic spikes) is typically the differentiator between a durable advance and a continuation failure.
3) Momentum & volatility dashboard
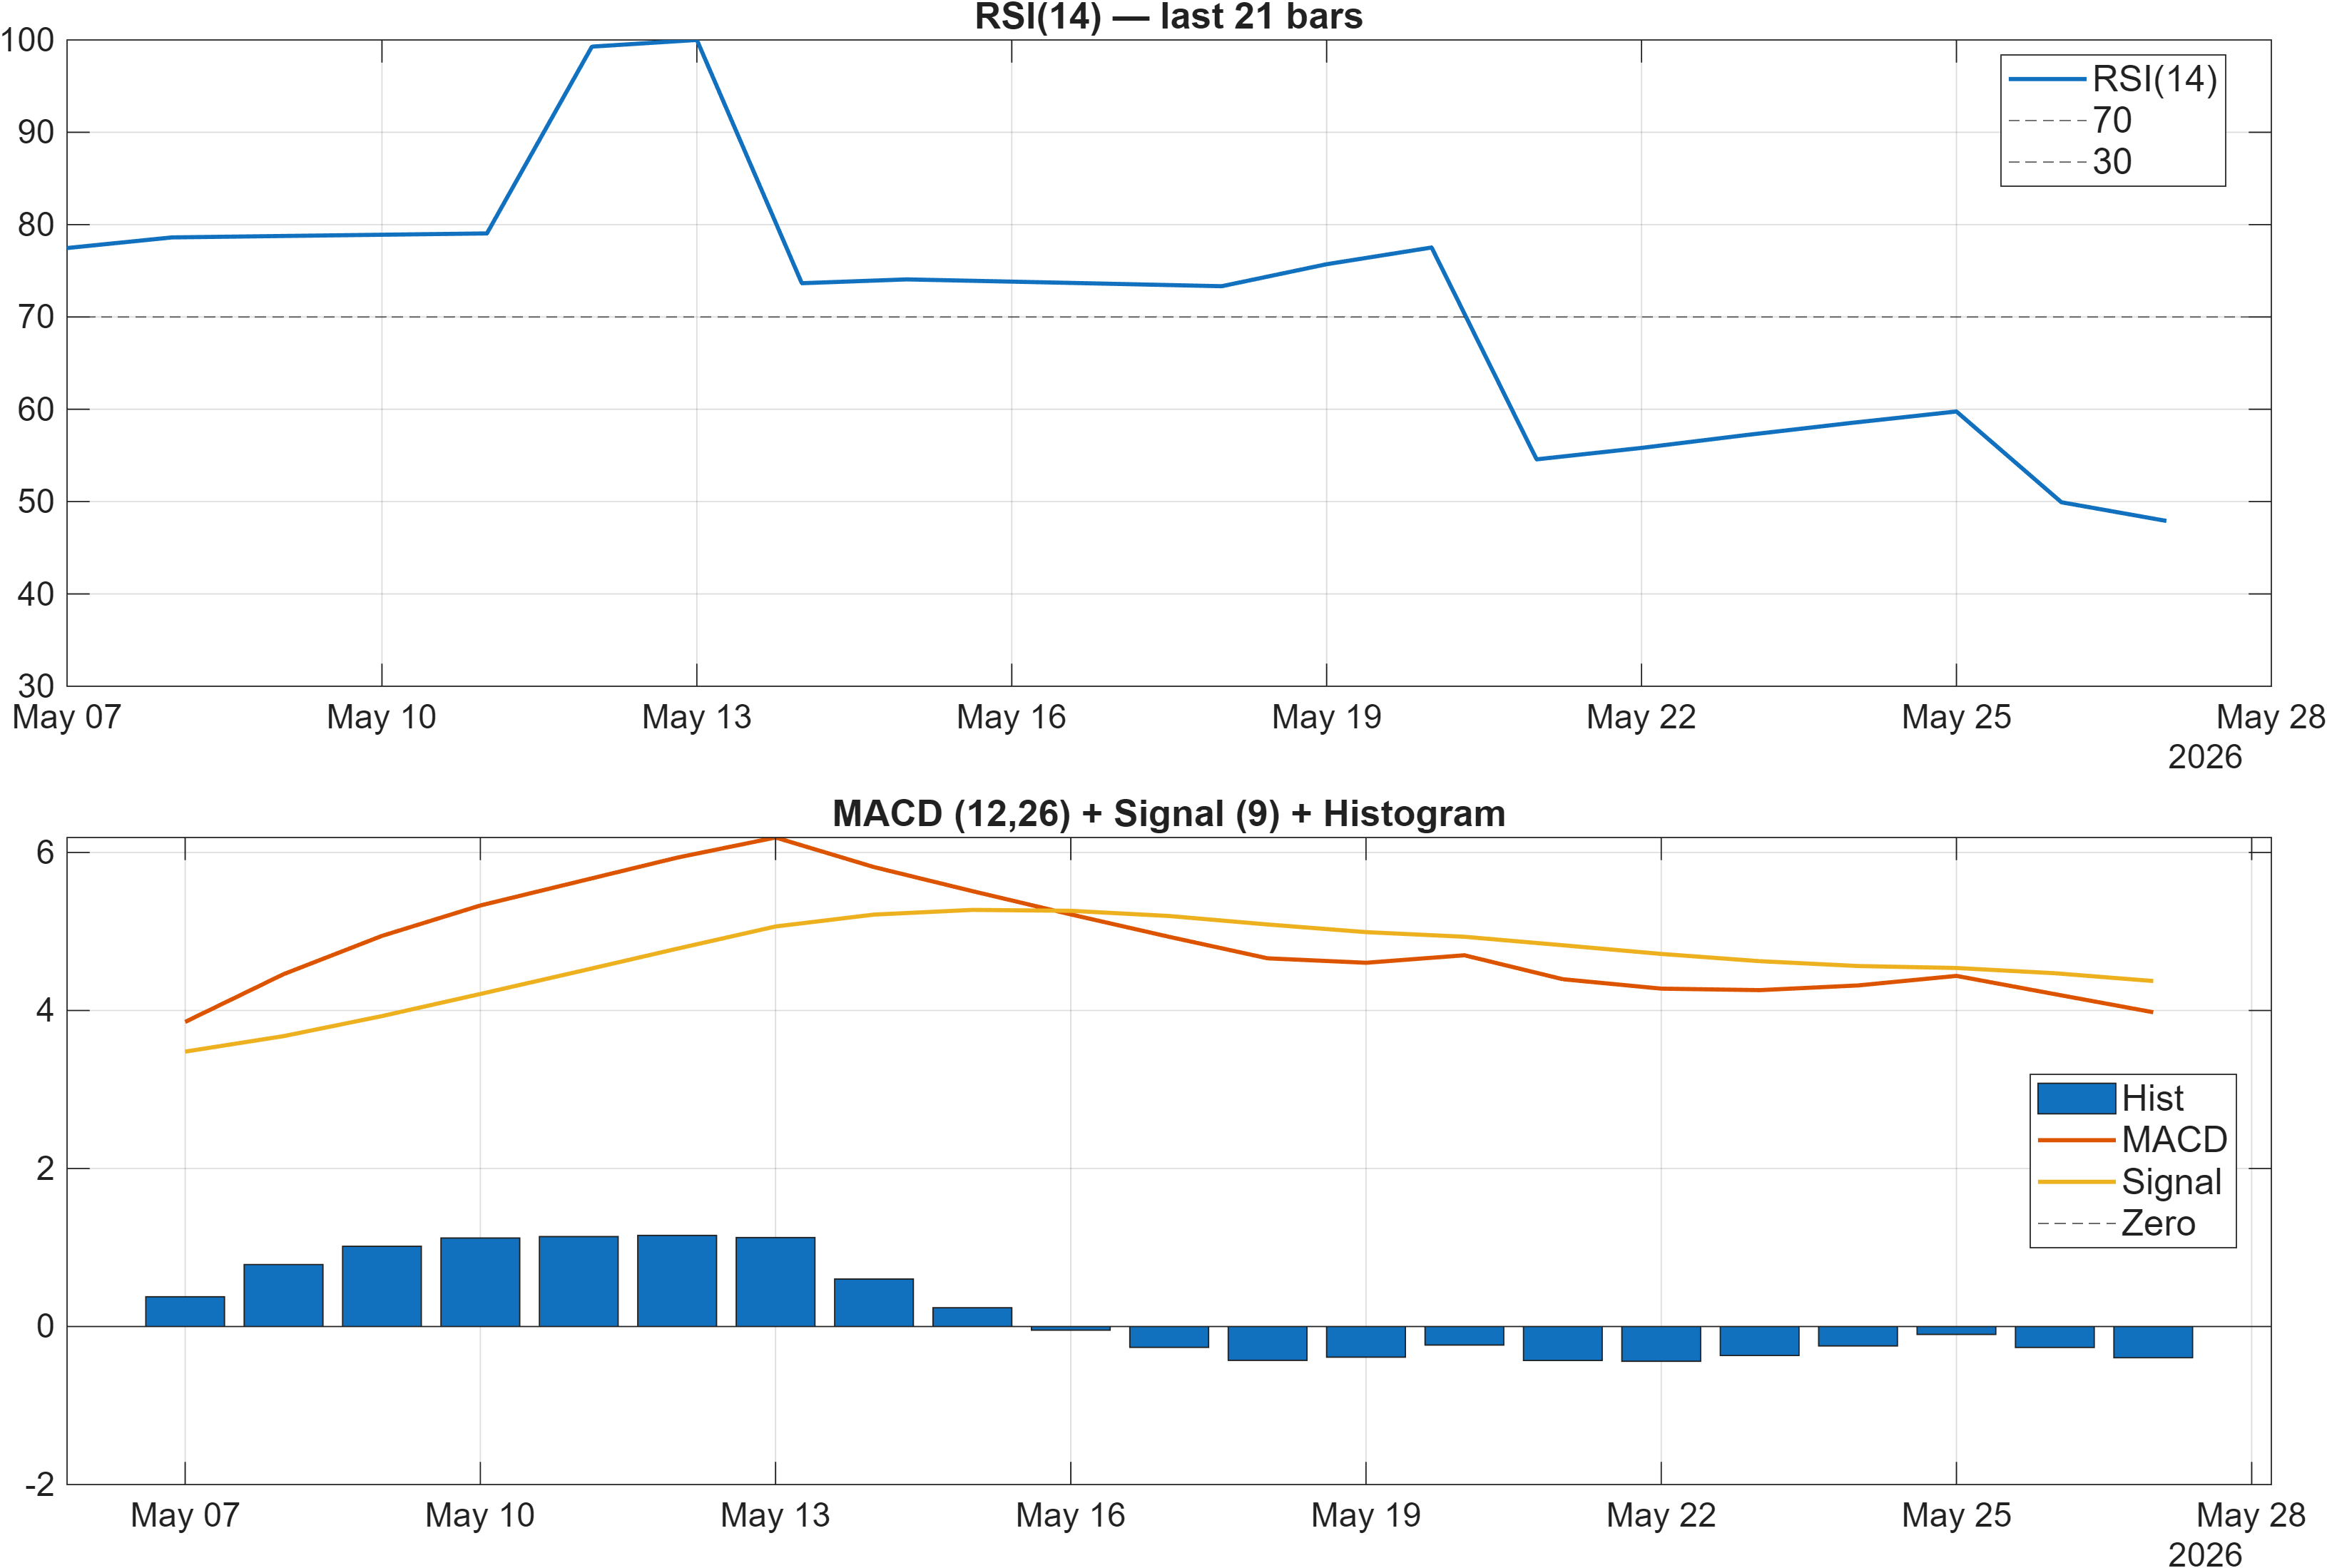
Momentum reads as non-committal rather than strongly trending. The RSI bias is Neutral, with RSI(14) at 47.91—a mid-range level that commonly coincides with range trade and frequent swings between minor overbought/oversold conditions. At the same time, the MACD histogram is negative at -0.3953, which introduces a mild bearish tilt to momentum despite the moving-average structure in Section 2.
This is a classic structure–momentum divergence: trend scaffolding can remain constructive while shorter-cycle momentum fails to confirm. When MACD histogram is below zero, rallies tend to face quicker supply unless a reversal in histogram confirms improving impulse. In practical monitoring terms, the question is less about the exact MACD value and more about whether it can turn persistently higher while price approaches the key resistance band.
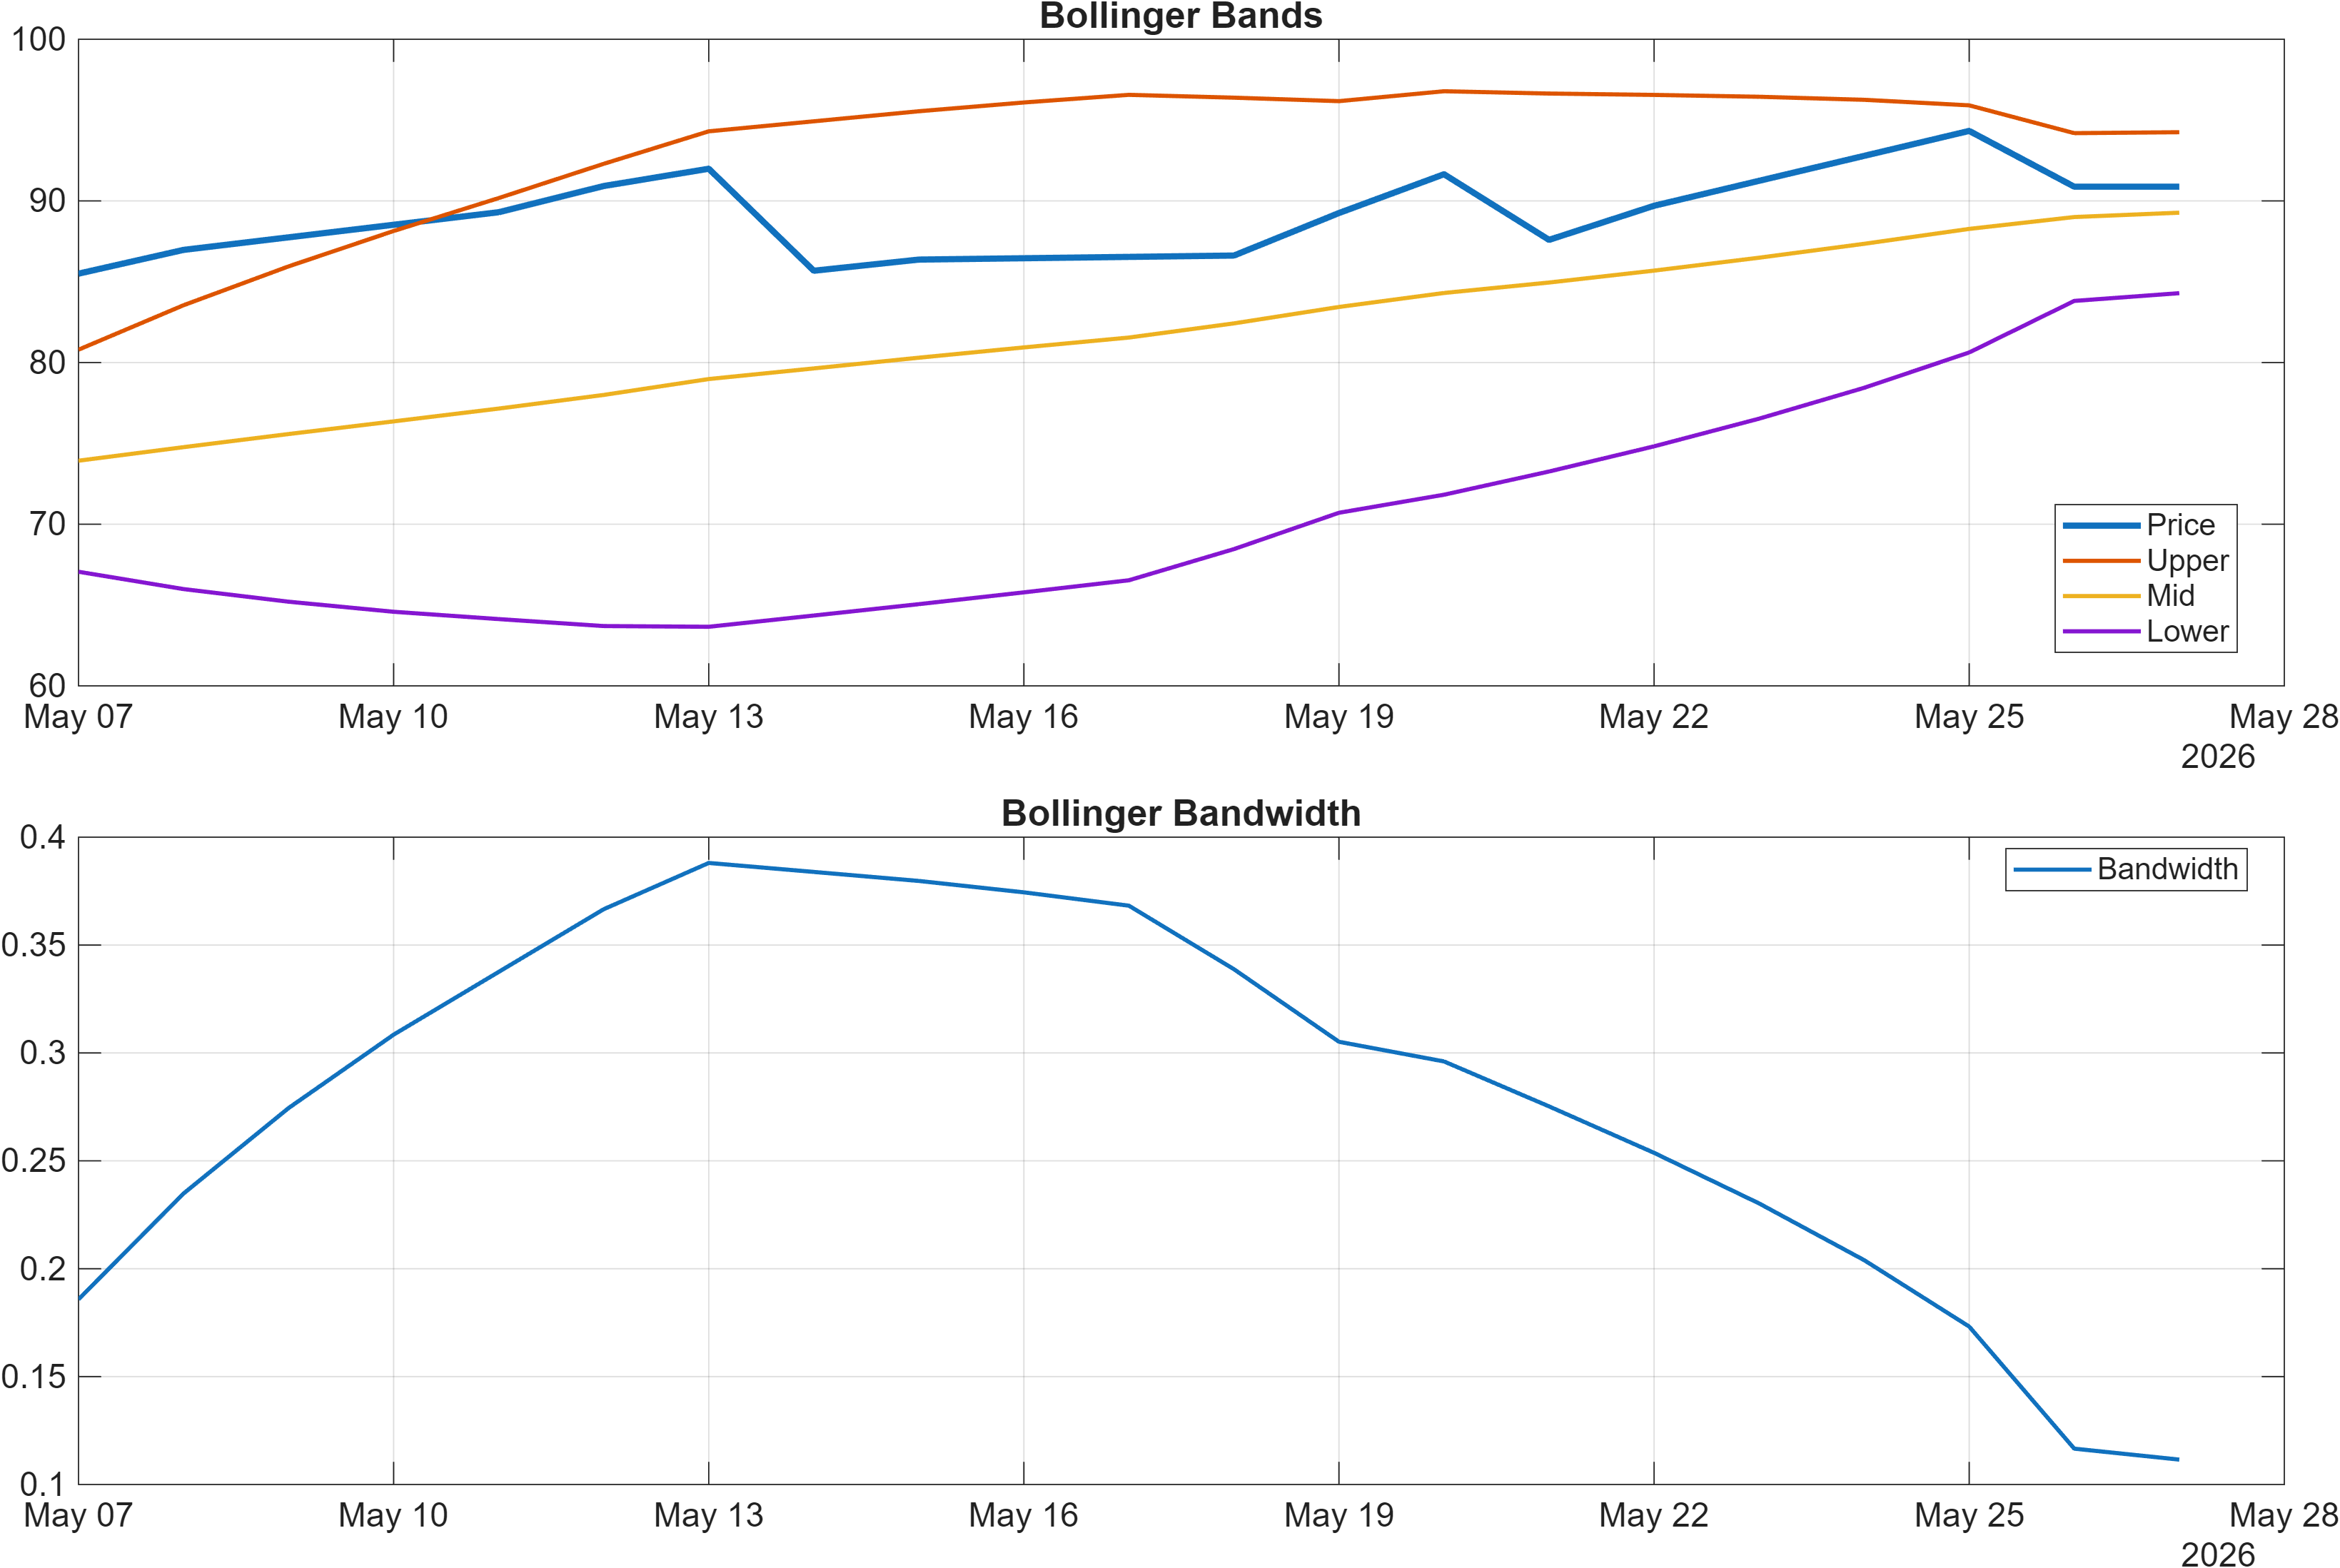
Volatility is contained: Bollinger Bandwidth is 0.1115. Lower bandwidth regimes frequently correspond to compression, where price can drift within a range and then react sharply once a catalyst or positioning shift arrives. That compression lens fits the broader “sideways” characterization and increases the value of confirmation signals—particularly whether any breakout attempt holds rather than mean-reverts.
With RSI neutral, MACD histogram negative, and bandwidth moderate-to-low, the dashboard suggests a market that may be waiting for a catalyst, while still requiring evidence that any directional move is supported by impulse rather than transient noise.
4) Support / Resistance zones
Support ~ 57.6112 | Resistance ~ 93.0717
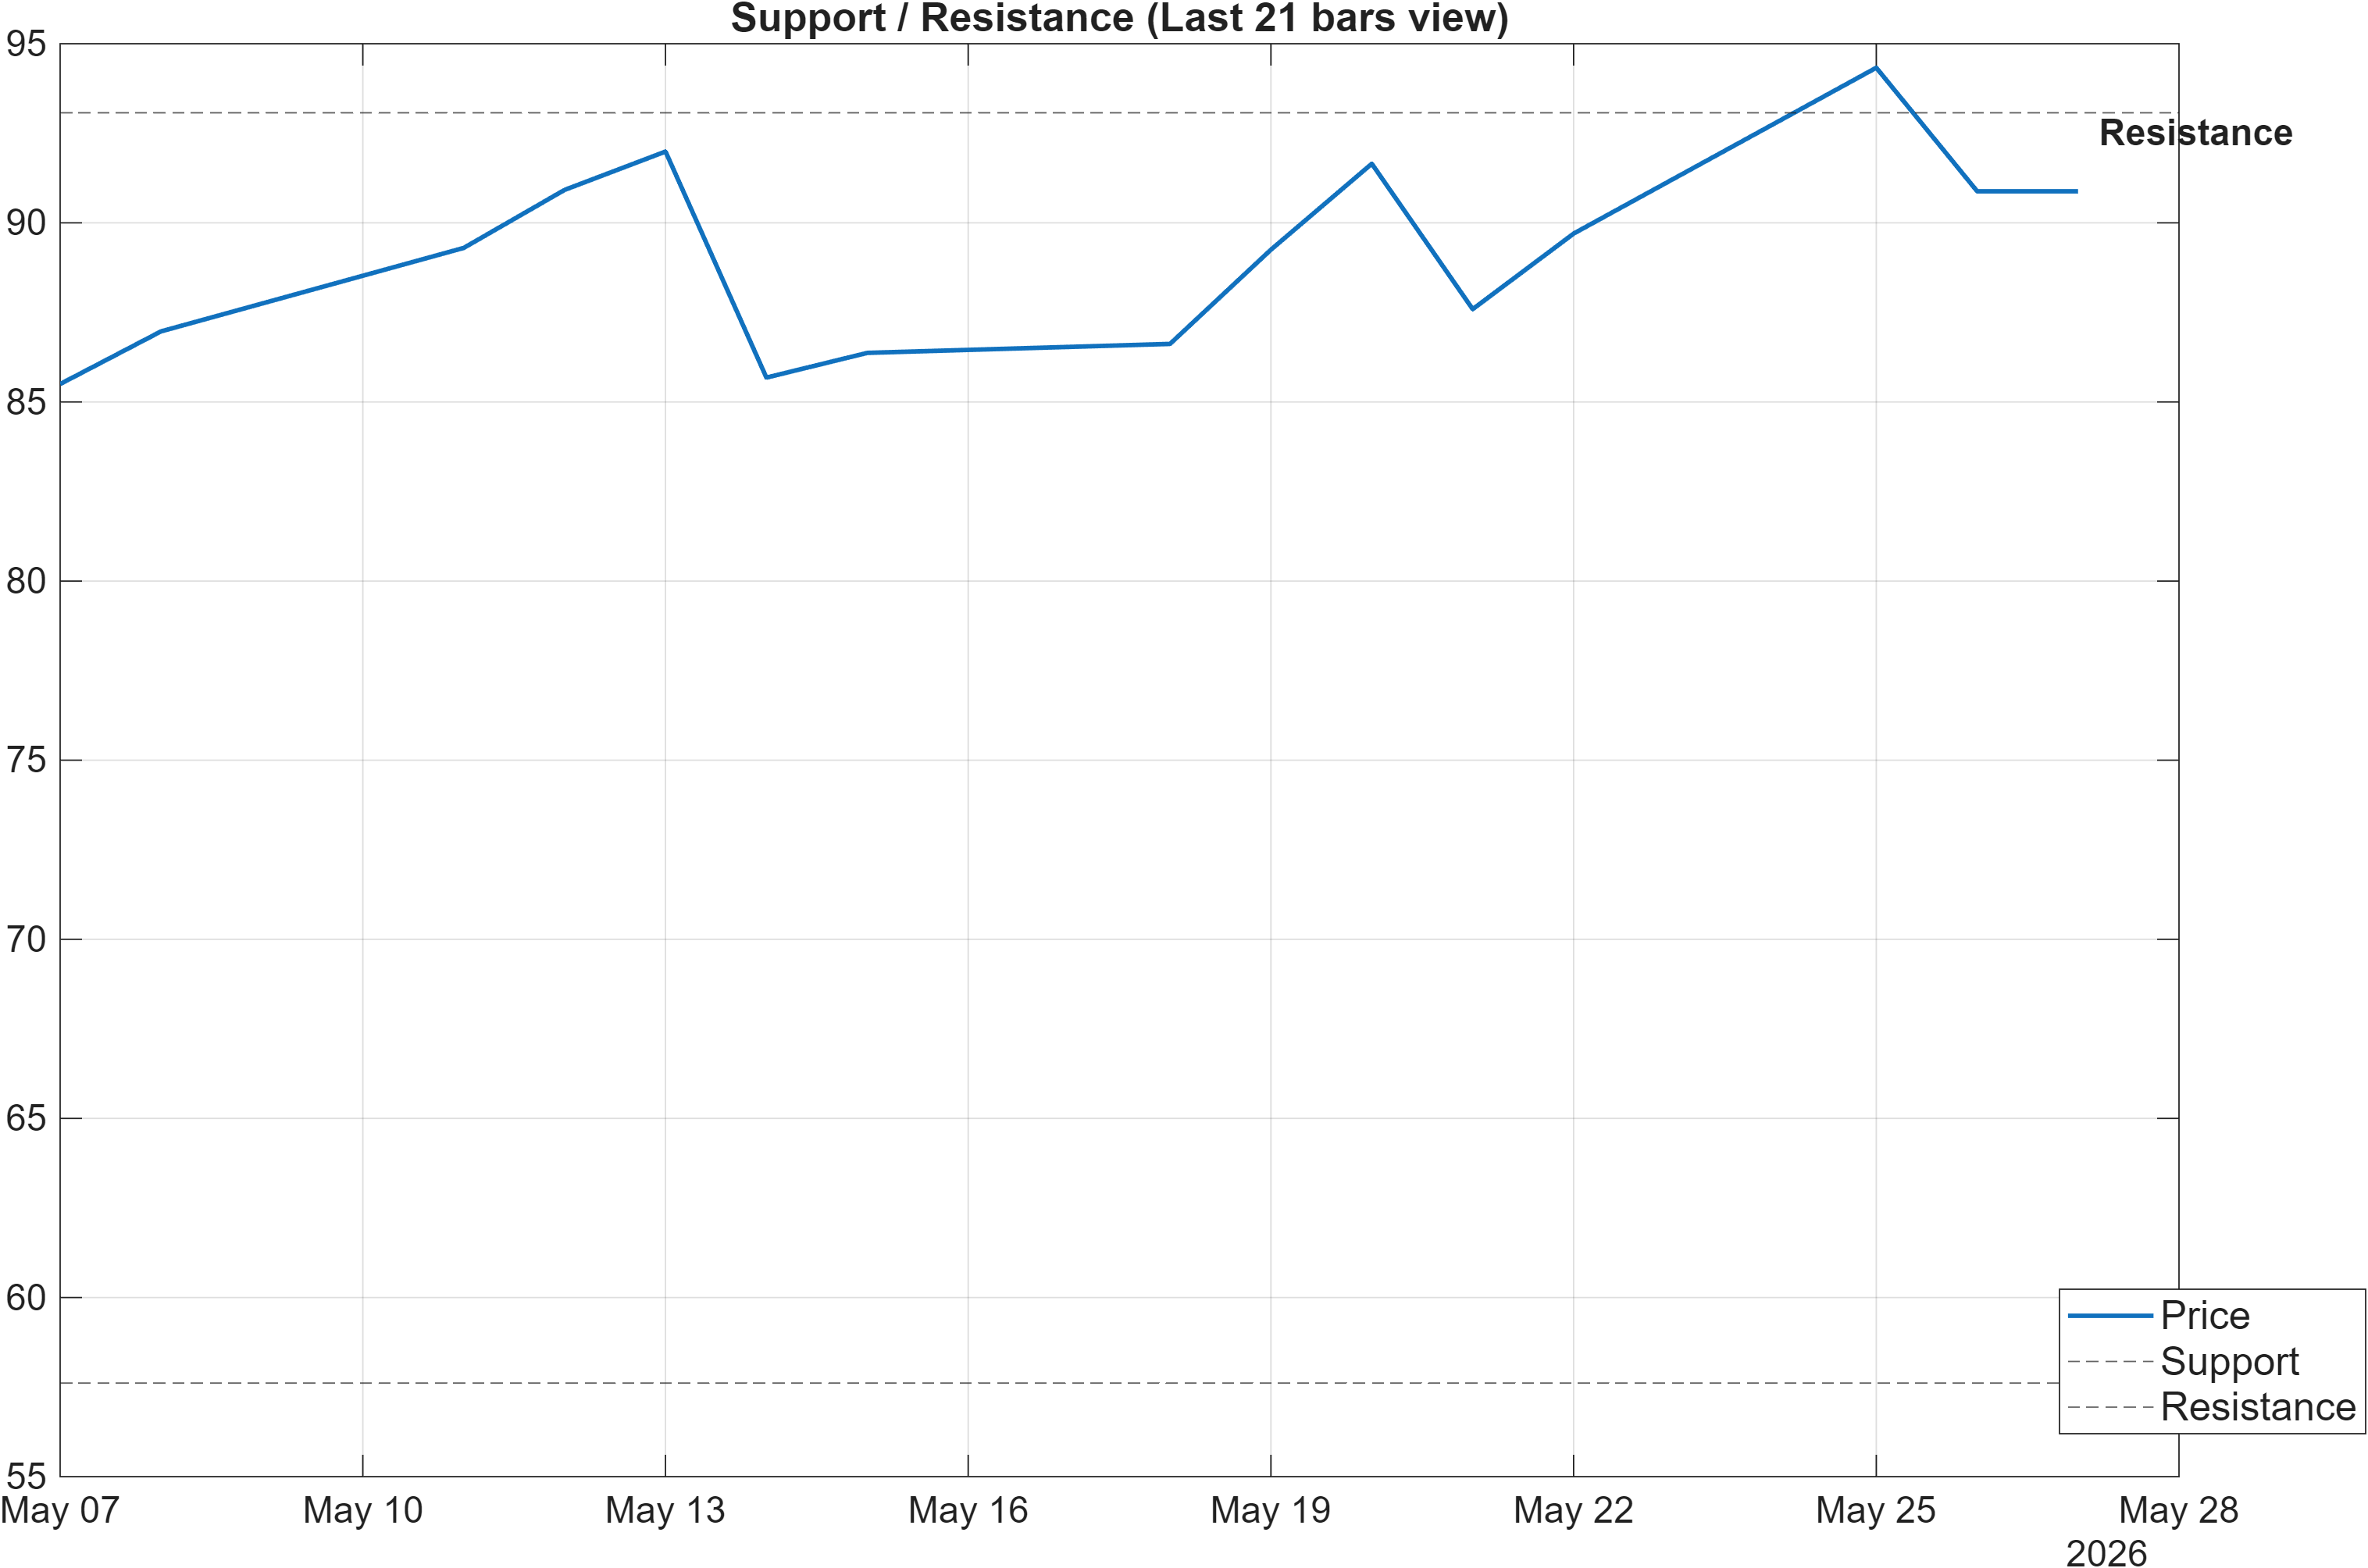
The level map is wide, which is consistent with a market that can accommodate both range continuation and regime transition scenarios. The stated framework is explicit: a break above resistance with volume supports continuation, while a close below support signals deterioration risk. In a compressed-volatility context (Bandwidth 0.1115), these level events often carry more information than incremental indicator wiggles.
The resistance at 93.0717 should be treated as the primary checkpoint for validating whether the bullish moving-average structure (Close > MA50; MA50 > MA200) can translate into a renewed trend phase. If price reaches that zone while momentum remains mixed (MACD histogram still negative at -0.3953, RSI still around the midline), the probability of rejection/rotation back into the range typically rises relative to a scenario where impulse indicators improve into the test.
Conversely, the support at 57.6112 anchors the downside. Given that Daily and Weekly ranks are already bearish (deep in the universe at #1198 and #1134), a close below support would align ranks and price behavior in the same direction—shifting the setup from “sideways with mixed signals” toward “bearish continuation risk.” The large gap between support and resistance also reinforces why position sizing and confirmation discipline matter more than precision entry narratives in this regime.
Scenario view: Break above resistance with volume → continuation. Close below support → signal deterioration risk.
5) Quant Technical Dashboard (18 Signals)
KGNAI AI Technical Analysis Score (Deep Reinforcement Learning): Rank #491 out of 1292 (Rank 1 represents the strongest technical positioning and a higher probability of favorable price behavior. As ranks increase toward the maximum, the probability of favorable outcomes weakens and bearish positioning becomes more dominant.) | Label: Neutral | Score: 0.240
18-Signal Technical Confluence Score: 0.278 (Neutral)
Overall Technical Score (18-signal confluence + DRL rank blend): 0.266 (Neutral)
Note: The blended score reflects signal strength weighted against broader AI technical ranking, which may temporarily diverge.
Blended technical score breakdown: 0.266 (Neutral | Bull 9 / Bear 4 / Neutral 5)
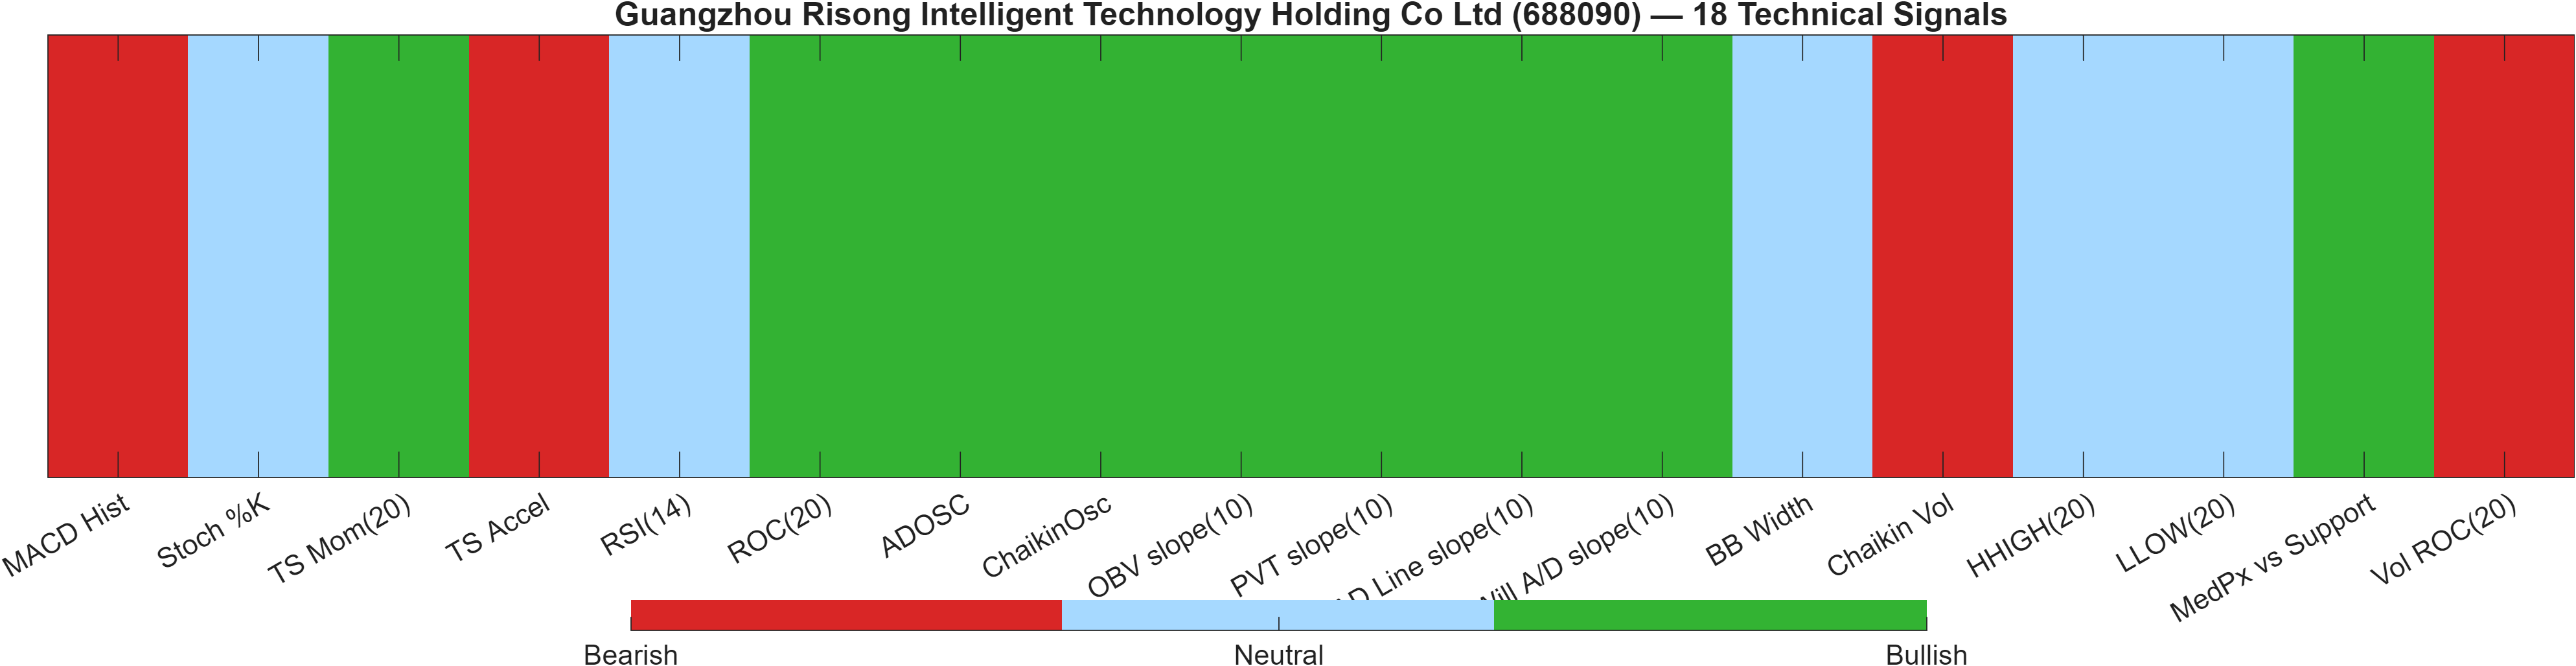
Signal clustering: breadth is positive, but momentum is not fully confirming
The dashboard’s headline is neutral confluence—the 18-signal score is 0.278 and the overall blended technical score is 0.266. That neutrality is not “absence of information”; it reflects a market where bullish and bearish evidence coexists. The internal composition (Bull 9 / Bear 4 / Neutral 5) indicates a constructive breadth bias, but not enough to overcome the bearish elements that typically matter most during turning points.
A notable positive is that several participation/accumulation-style measures are bullish (e.g., ADOSC at 22.51 and OBV slope(10) at 2.666e+07), which can support the MA-up structure even when price is range-bound. At the same time, the momentum engine is mixed: MACD histogram -0.3953 is bearish and TS Accel -11.53 is bearish, arguing that impulse is not yet aligned with the constructive breadth.
Volatility and range framing also matter here. BB Width 0.1115 is neutral and consistent with a non-expansive regime, so even a bullish breadth stack may express as gradual grind rather than breakout acceleration unless bandwidth expands alongside a resistance break at 93.0717. Conversely, if volume-related signals stay mixed (e.g., Vol ROC(20) at -5.728 bearish) while price weakens toward 57.6112, the neutral composite can deteriorate quickly without needing dramatic single-indicator moves.
Signal table (Bull/Bear/Neutral)
| Indicator | Value | Signal |
|---|---|---|
| MACD Hist | -0.3953 | Bearish |
| Stoch %K | 46.58 | Neutral |
| TS Mom(20) | 3.91 | Bullish |
| TS Accel | -11.53 | Bearish |
| RSI(14) | 47.91 | Neutral |
| ROC(20) | 4.496 | Bullish |
| ADOSC | 22.51 | Bullish |
| ChaikinOsc | 4.514e+05 | Bullish |
| OBV slope(10) | 2.666e+07 | Bullish |
| PVT slope(10) | 1.888e+05 | Bullish |
| AD Line slope(10) | 7.273e+05 | Bullish |
| Will A/D slope(10) | 13.07 | Bullish |
| BB Width | 0.1115 | Neutral |
| Chaikin Vol | 17.57 | Bearish |
| HHIGH(20) | 97.99 | Neutral |
| LLOW(20) | 83 | Neutral |
| MedPx vs Support | 34.05 | Bullish |
| Vol ROC(20) | -5.728 | Bearish |
Interpretation: Indicator-level signals form the base confluence, which is then adjusted using a separate AI-driven technical ranking model. The final technical score summarizes this combined view.
6) News sentiment + extractive gist
Note: Instrument-specific news matches were not found, so the digest includes broader market/sector headlines. Links are provided for verification.
Sentiment score (avg): 0.063 | Positive: 25% | Neutral: 75% | Negative: 0%
KGNAI AI News Sentiment Score (normalized -1 to +1): Not available (as of —) | Label: Not available | Overall news score: 0.06
Positive Developments
Recent coverage across major financial outlets indicates a generally constructive tone in the aggregated feed, consistent with the measured 25% positive and 75% neutral split and 0% negative in the provided sample. The positive tilt appears driven less by company-specific catalysts (not available in the provided data) and more by broader “risk normalization” narratives—items that suggest easing disruptions, partial restorations, or policy/administrative progress in the wider environment. In sentiment terms, this type of positivity tends to be contextual rather than directly price-moving for a single instrument; it can still matter by reducing perceived tail-risk and supporting steadier positioning when the chart is compressed. Given 688090’s neutral technical composite (overall technical score 0.266) and low-to-moderate volatility backdrop (BB Width 0.1115), a mildly constructive news tone can help maintain range support as long as price respects the defined technical floor at 57.6112.
Neutral / Mixed Developments
The dominant feature of the digest is informational neutrality rather than directional conviction, which matches the average sentiment score of 0.063. Several items in the feed are event-driven and geopolitical/cultural in nature, and their market impact typically depends on second-order interpretation rather than immediate financial transmission to a specific China-listed industrial technology name. For analysis purposes, this kind of neutral flow tends to reinforce a “wait for confirmation” posture: price action and technical levels carry more weight than headlines. With short-horizon ranks deeply bearish (Daily #1198, Weekly #1134) while the Monthly rank remains bullish (#121), neutral news flow is unlikely to resolve the timeframe divergence by itself.
Negative / Risk Signals
The risk content in the provided digest is best interpreted as macro uncertainty background rather than direct issuer risk (instrument-specific matches were not found). Coverage that reflects geopolitical friction, leadership-health uncertainty, or elevated policy noise can increase short-term volatility even when the direct linkage is weak—often through risk appetite and liquidity channels. In a setup where MACD histogram is bearish at -0.3953 and the short-term KGNAI ranks remain in the weakest tail of the universe, the market can become more sensitive to “risk-off” impulses. The practical implication is that downside monitoring should remain anchored to the 57.6112 support level; a close below that zone would align negative rank pressure with price deterioration. Conversely, a stable tape in the face of risk headlines would be consistent with the chart’s sideways profile and neutral confluence.
- Whether sentiment composition remains skewed neutral (currently 75%) while price approaches 93.0717.
- Any shift from “broader market/sector” items toward instrument-specific coverage (currently not found in the provided data).
- Whether risk-driven stories coincide with a technical break below 57.6112 or a volatility expansion beyond 0.1115 bandwidth.
Sources referenced: Reuters, Bloomberg, Yahoo Finance, MarketWatch, Investing.com
Snapshot: AI Rank (Short–Mid–Long): Mixed (Bearish–Neutral–Neutral) · Technical Confluence: Neutral · Key Levels: Support ~57.61 | Resistance ~93.07 · News Sentiment: Neutral
7) Sources
Not available in the provided data.
You may also like: How KGNAI AI ranks instruments across global markets
Disclaimer: KGNAI provides AI-generated analytics and educational market commentary only. This is not financial advice. Markets involve risk. Always do your own research.