
600845 (Shanghai Baosight Software Co Ltd A) — AI Rank & Technical Confluence Update (01-Mar-2026): Bullish bias with short-term neutrality
Shanghai Baosight Software Co Ltd A (600845) currently presents a constructive technical backdrop while near-term ranking signals remain neutral versus a much stronger mid-to-long horizon posture. Across a 1,293-instrument China universe, the daily and weekly ranks sit in the middle of the distribution, while the monthly (#107), 3-monthly (#53), and 6-monthly (#22) positioning shift into the upper tier. Technically, KGNAI’s blended framework flags a Bullish regime with an overall technical score of 0.704 and a strong breadth profile (14 bullish signals). Momentum indicators are mostly supportive, though the MACD histogram (-0.0067) introduces a mild divergence to monitor. Volatility remains relatively contained with Bollinger bandwidth at 0.0468, keeping the focus on whether price can confirm strength through the 24.70 resistance zone while holding 20.72 as the key downside reference. News sentiment reads broadly neutral.
- Rank stance: Short-term Neutral | Mid-term Bullish | Long-term Bullish
- Technical confluence: Bullish (Overall Technical Score 0.704; 18-signal confluence 0.667)
- Key levels: Support ~ 20.7200 | Resistance ~ 24.7000
- News sentiment bias: Neutral (avg 0.013; Positive 12% / Neutral 81% / Negative 6%)
- Confirmation / invalidation: Confirmation strengthens on a sustained move above 24.70 with volume; deterioration risk increases on a close below 20.72.
KGNAI evaluates assets using large cross-sectional datasets built from millions of structured data points. Inputs incorporate fundamental metrics, technical structures, and systematically processed news sentiment. Statistical models, machine learning, and AI frameworks are used to assess relative positioning, signal alignment, and probabilistic behavior across broad universes.
- Ranks are comparative across the tracked universe, not absolute price targets.
- Confluence reflects alignment among independent signal groups.
- Support/resistance levels are probabilistic decision zones, not guarantees.
- Sentiment provides contextual bias within the broader analytical framework.
1) KGNAI AI Analysis
Within the CHINA region universe of 1,293 ranked instruments, 600845’s cross-horizon profile is best characterized as a regime transition from neutral to bullish as the timeframe expands. The daily (#512) and weekly (#489) placements sit near the middle of the distribution, implying the short-term edge is not dominant and may be more sensitive to local noise. In contrast, the monthly rank (#107) improves into the upper tier, and the signal strengthens further across the 3-monthly (#53) and 6-monthly (#22) horizons—consistent with a more durable accumulation or trend structure rather than a one-off tactical move.
This dispersion matters: when short-term ranks lag while medium-to-long ranks lead, the setup often reflects constructive positioning with incomplete near-term confirmation. In practical terms, the long-horizon strength can remain intact even if price consolidates or mean-reverts, but the short-term neutrality tends to raise the importance of clearly defined levels and momentum confirmation. The yearly rank (#95) supports the view that the broader structure remains favorable relative to peers, even as the front end is less decisive.
- Daily rank: #512 out of 1293 — Neutral
- Weekly rank: #489 out of 1293 — Neutral
- Monthly rank: #107 out of 1293 — Bullish
- 3-Monthly rank: #53 out of 1293 — Bullish
- 6-Monthly rank: #22 out of 1293 — Bullish
- Yearly rank: #95 out of 1293 — Bullish
The term view summary—Short-term: Neutral; Mid-term: Bullish; Long-term: Bullish—should be read as a relative-probability statement across the tracked universe. For risk control, it implies short-horizon trades typically require more explicit confirmation, while portfolio-level positioning tends to lean more on the stronger multi-month ranks.
2) Price & trend overview
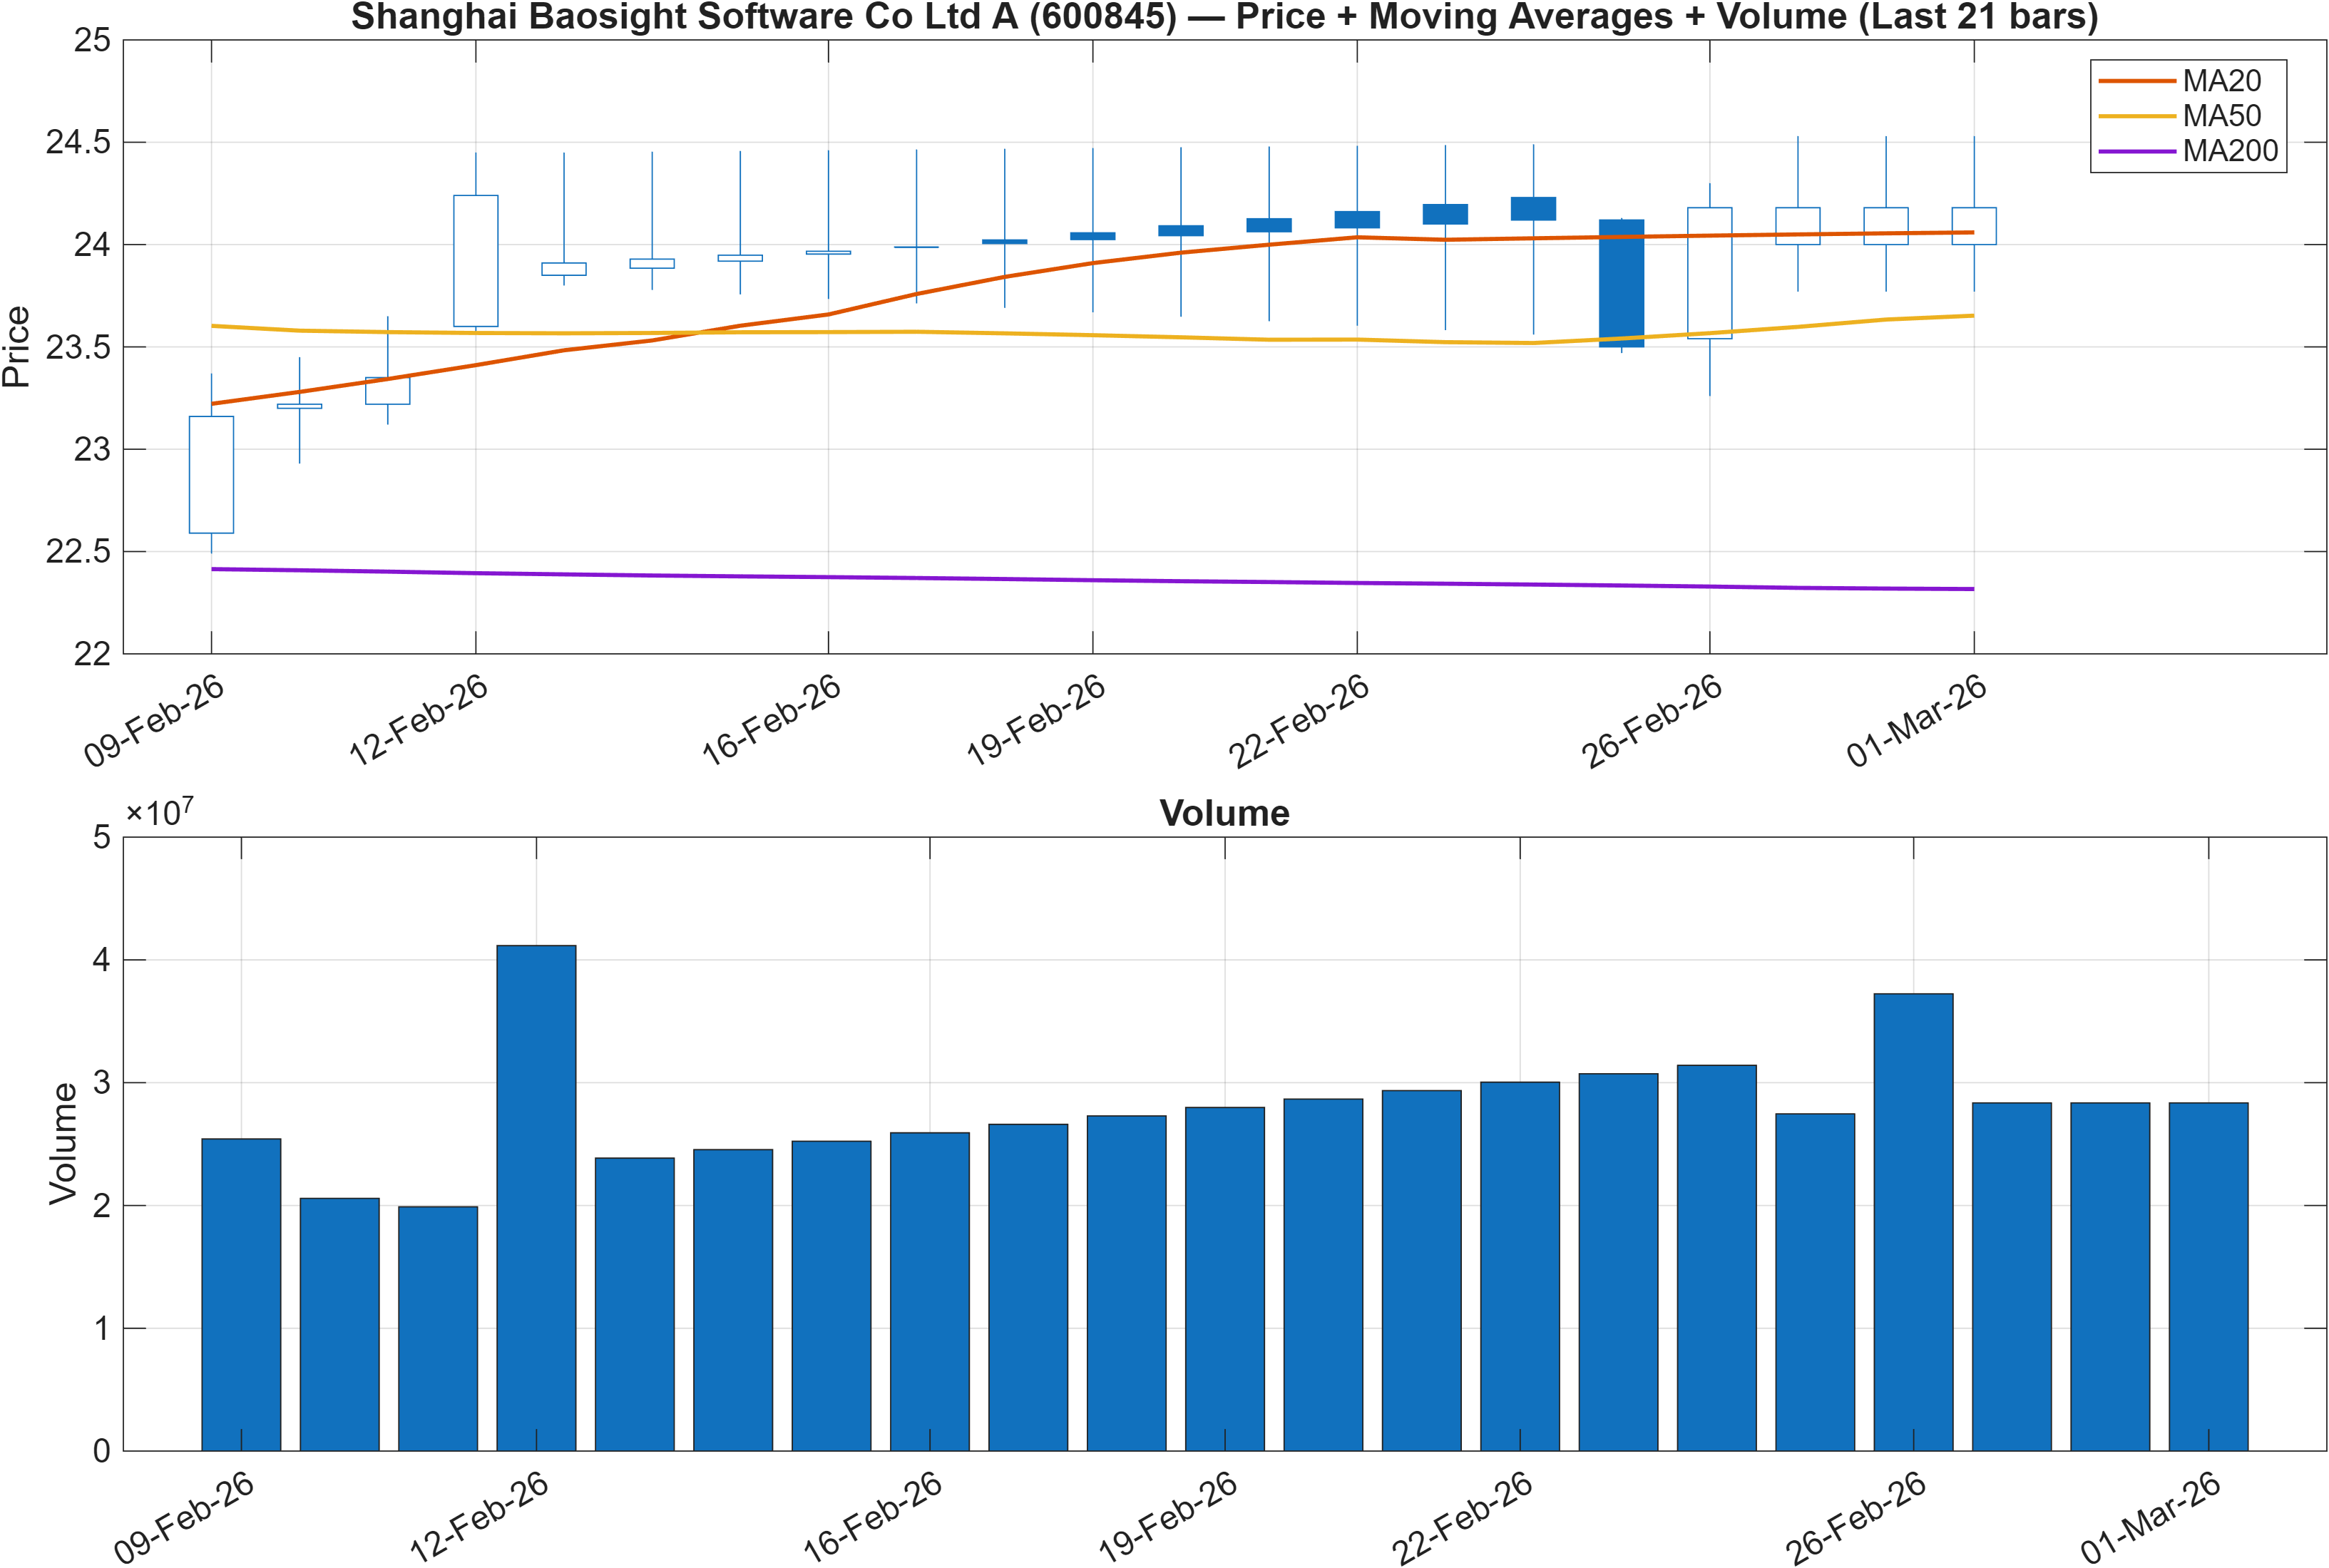
Trend structure is currently supported by a two-layer moving average confirmation: close vs MA50 = Bullish and MA50 vs MA200 = Bullish. This combination tends to be associated with a positive trend regime where pullbacks often function as tests of demand rather than immediate reversal signals—provided key downside levels remain intact.
The main analytical question is less about whether the market is “in trend” and more about trend persistence versus exhaustion. The short-term neutrality seen in the daily/weekly ranks (#512 and #489) suggests that while the intermediate trend is constructive, the market may be in a phase of digestion rather than acceleration. That interpretation aligns with subsequent sections showing volatility that is not elevated (bandwidth 0.0468) and a momentum picture that is supportive but not uniformly expanding (MACD histogram slightly negative at -0.0067).
In this context, moving averages act as regime filters rather than timing tools. If price remains consistent with the MA stack, the burden of proof shifts to sellers to break structure. Conversely, if price begins to lose its relationship to the MA50 while momentum continues to soften, the signal quality implied by the 6-monthly rank (#22) can remain favorable, but the near-term path may become more range-bound and level-dependent.
3) Momentum & volatility dashboard
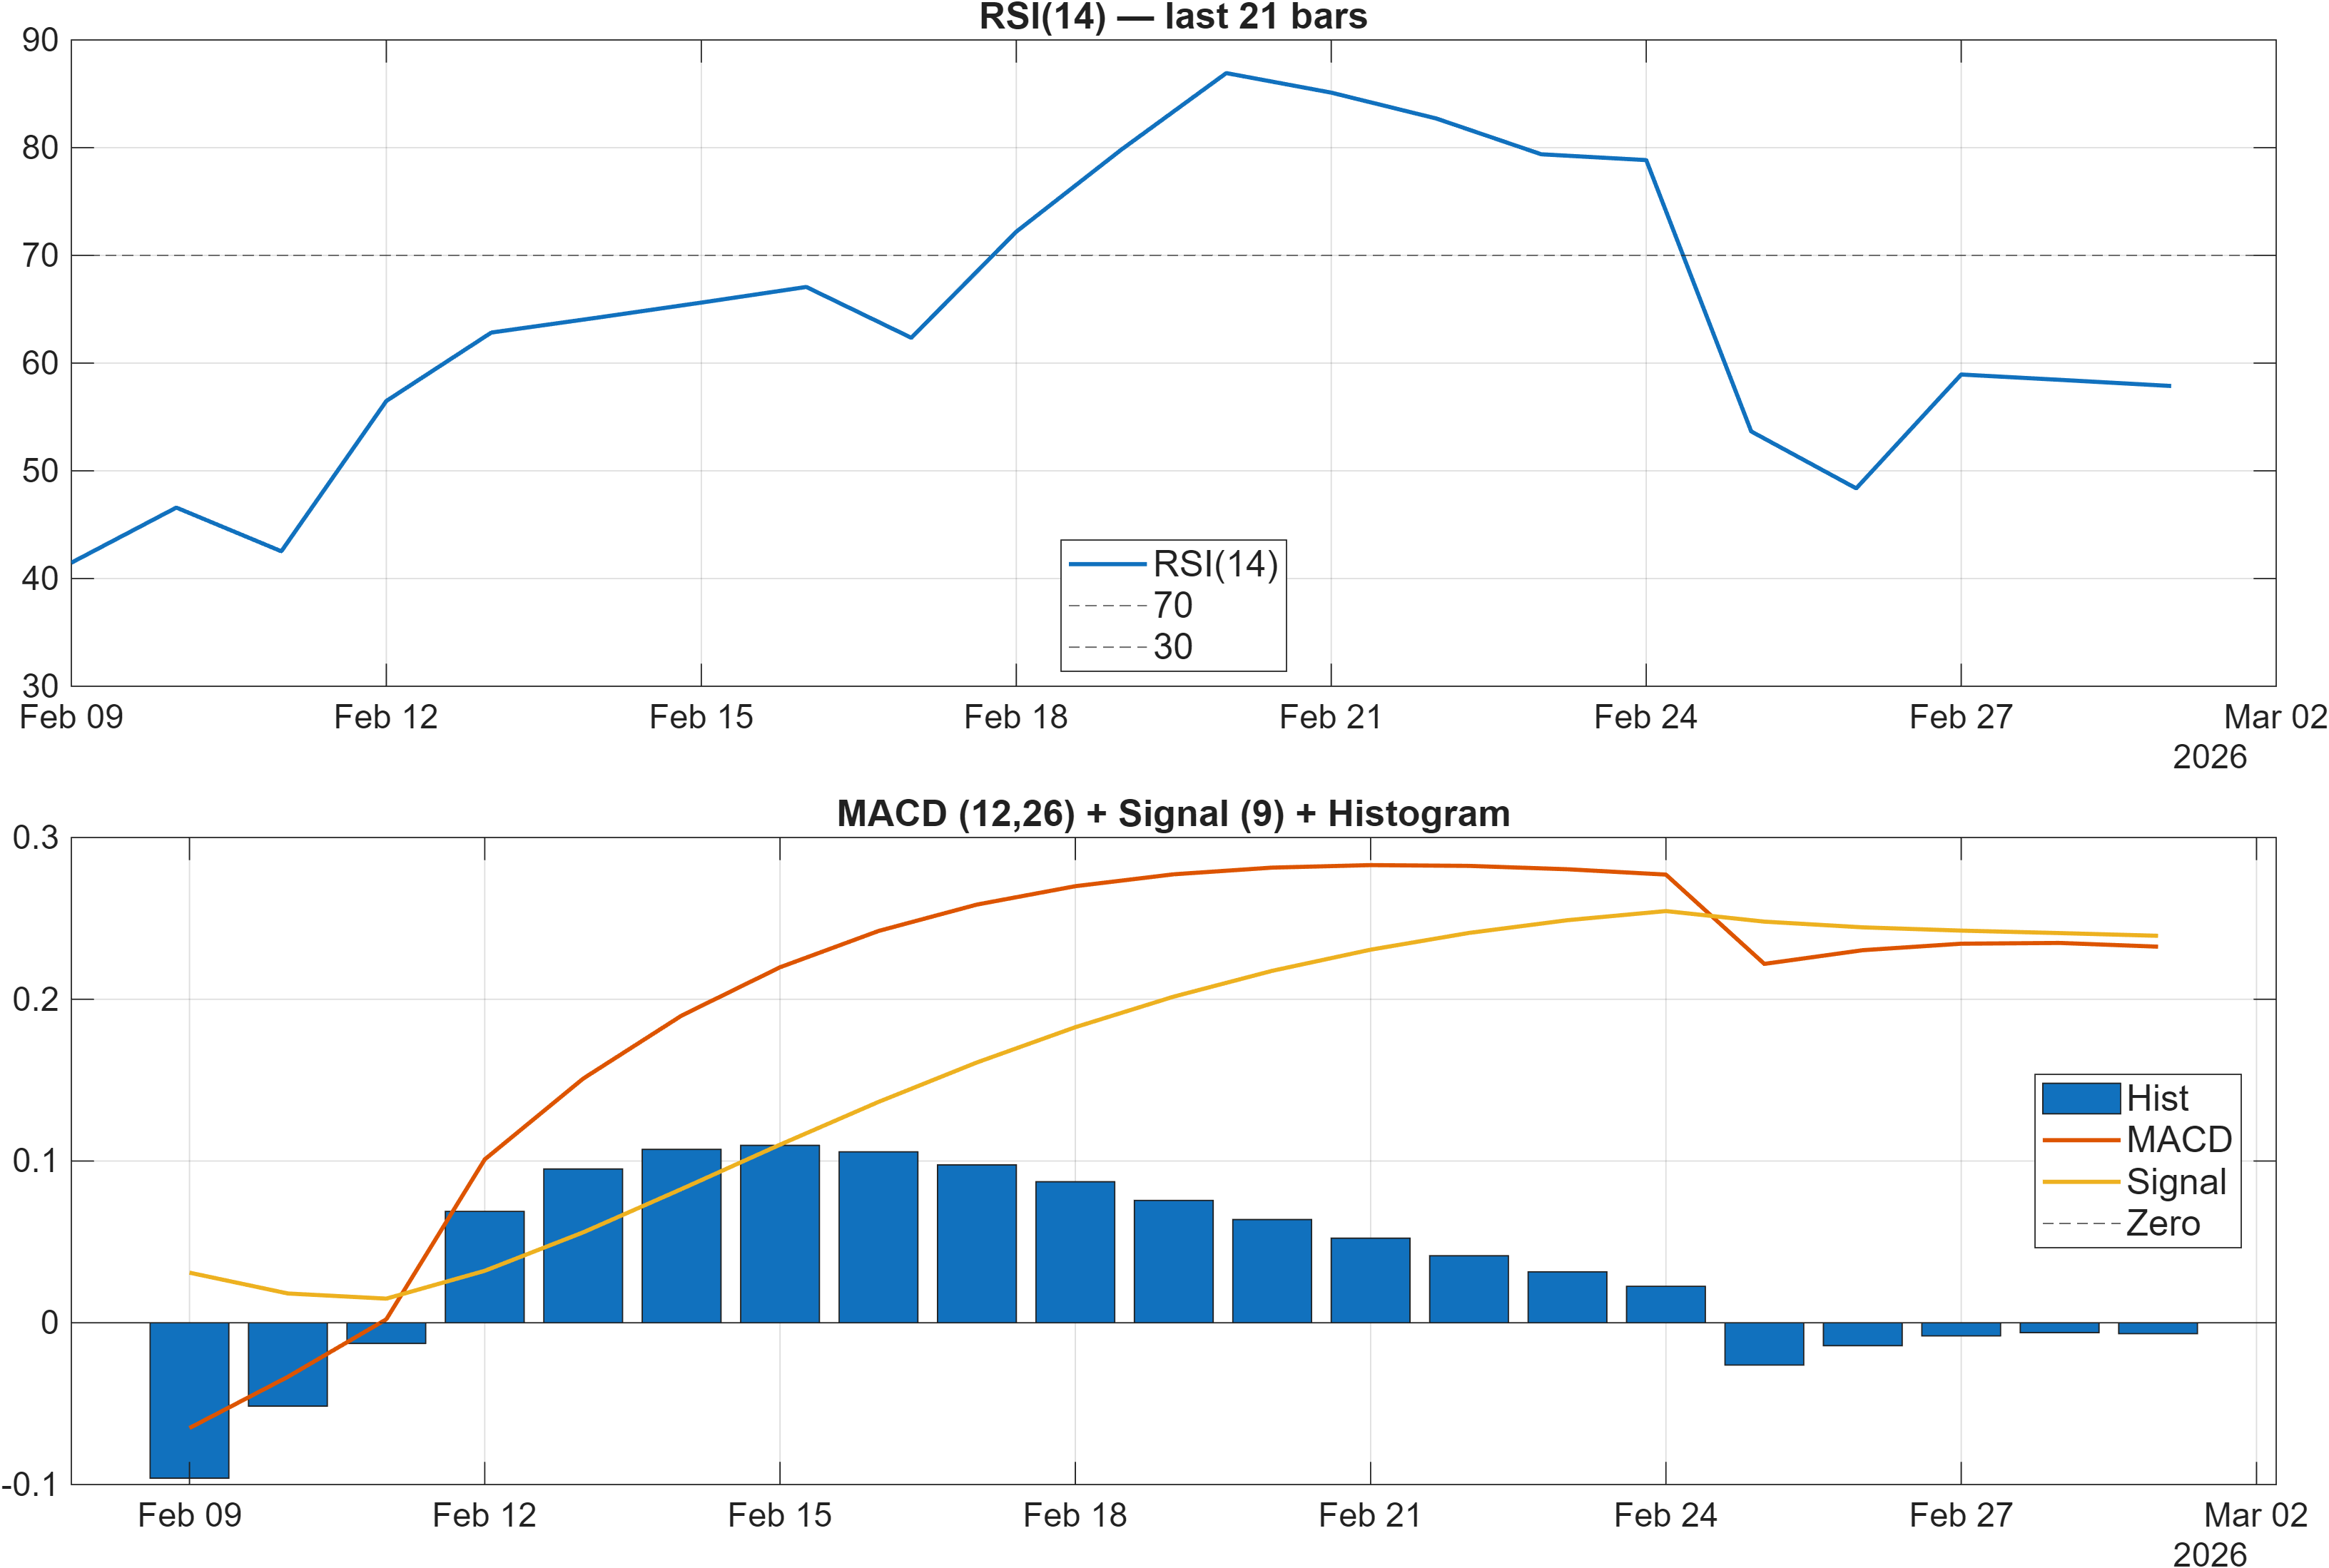
Momentum is best read as supportive but not fully synchronized. The dashboard flags RSI bias = Neutral, yet the signal table records RSI(14) = 57.88 with a bullish classification—consistent with an RSI level that is constructive but not stretched. This nuance matters: RSI in the upper-50s often supports trend continuation, but it rarely provides the “impulse” signature seen when RSI drives toward overbought while price breaks key resistance.
The primary divergence sits in MACD: the MACD histogram is -0.0067 (also listed as -0.006724 in the signal table) and classified bearish. In a bullish moving-average regime, a slightly negative histogram frequently indicates momentum cooling rather than a confirmed trend break—especially when other momentum and rate-of-change measures remain constructive (e.g., ROC(20) = 4.134 and TS Mom(20) = 0.96 are bullish). The analytical focus becomes whether MACD begins to re-expand positively as price challenges resistance, or whether the negative reading persists while price stalls.
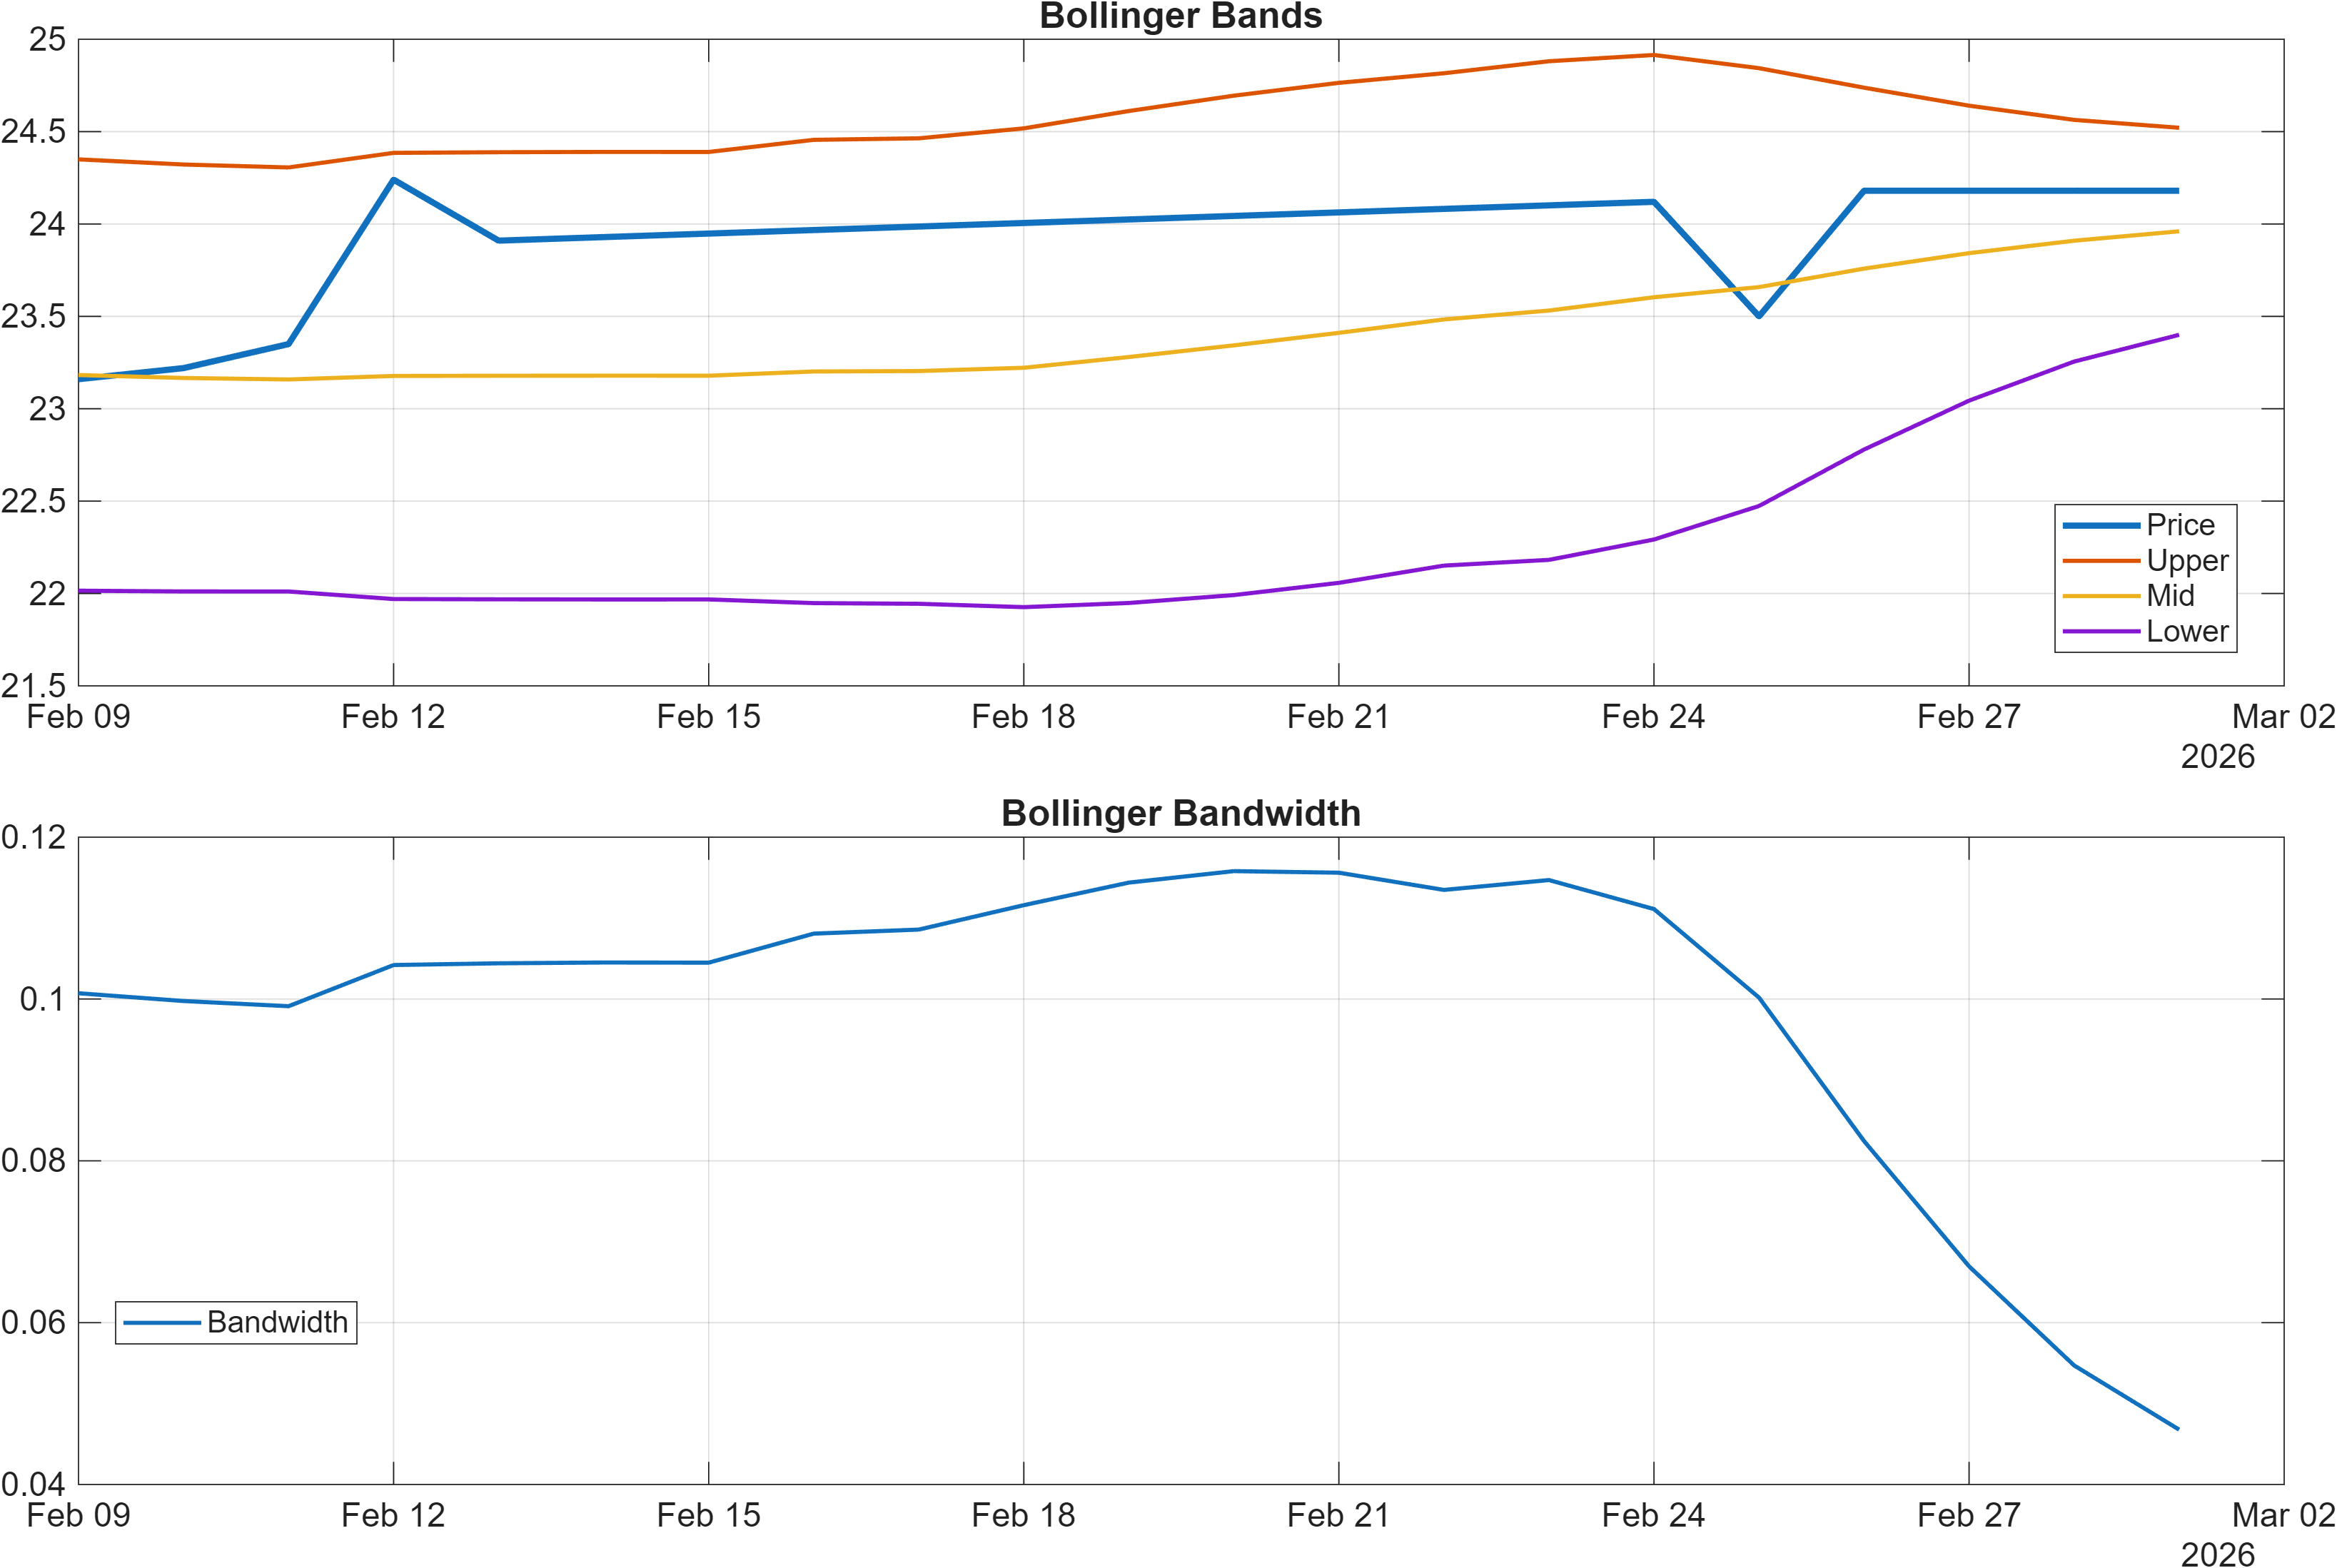
Volatility remains contained: Bollinger bandwidth latest = 0.0468 (table value 0.04678). A relatively tight bandwidth can precede expansion, but direction tends to be resolved by level breaks and momentum confirmation. With rank strength concentrated in the multi-month horizon (#53 at 3-months and #22 at 6-months), volatility compression paired with a resistance test can become the “decision point” for continuation versus consolidation.
4) Support / Resistance zones
The current map is clearly defined: Support ~ 20.7200 and Resistance ~ 24.7000. With short-term ranks neutral and technical confluence bullish, these levels function as probabilistic boundaries separating continuation from deterioration rather than simple “buy/sell lines.”
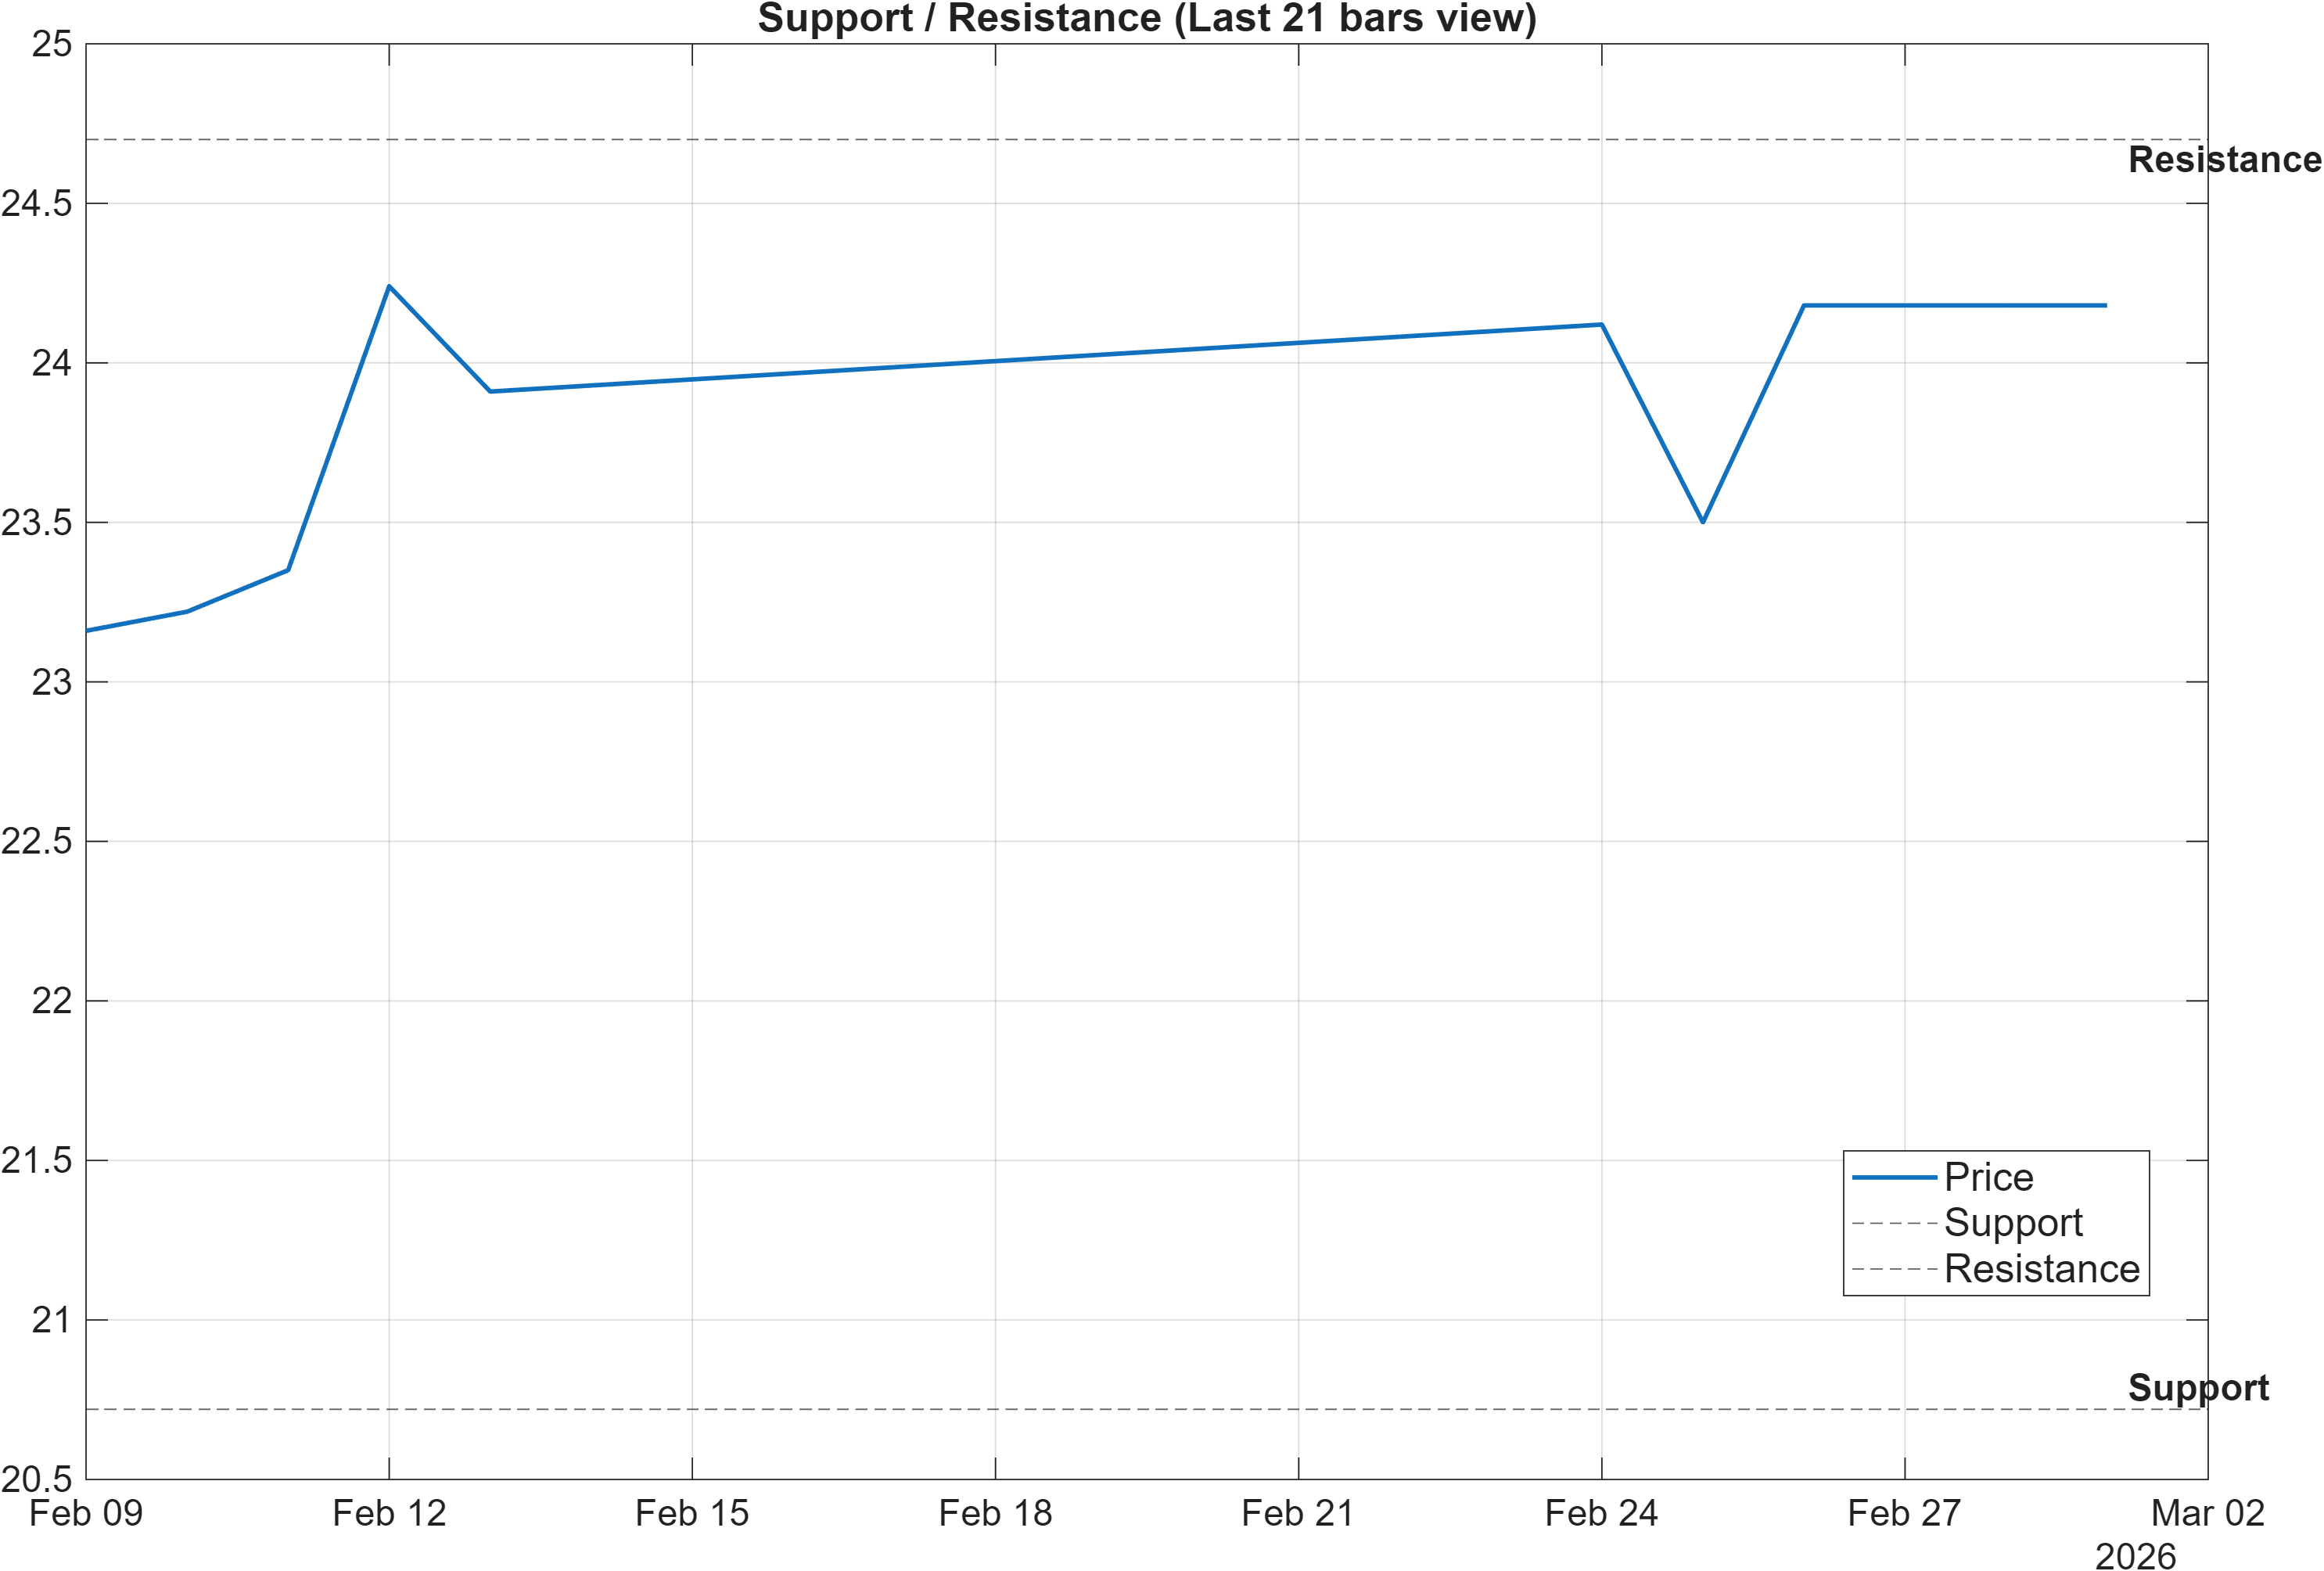
A key analytical lens here is continuation versus transition. The provided scenario framing is explicit: a break above resistance with volume favors continuation, while a close below support increases signal deterioration risk. This aligns with the broader signal stack: the multi-horizon ranks (monthly #107, 3-monthly #53, 6-monthly #22) suggest the path of least resistance remains constructive, but the negative MACD histogram (-0.0067) keeps the market sensitive to failed breakouts.
Another useful cross-check comes from the 20-day extremes in the signal table: HHIGH(20) = 24.53 sits close to the 24.70 resistance reference, implying price is operating near an area where recent highs cluster. In such conditions, clean continuation typically requires either expanding momentum (MACD improvement) or expanding participation (volume confirmation), whereas rejection often results in a return toward support zones. Volatility being relatively low (bandwidth 0.0468) raises the importance of watching for a volatility pickup on any level break.
5) Quant Technical Dashboard (18 Signals)
KGNAI AI Technical Analysis Score (Deep Reinforcement Learning): Rank #134 out of 1293 (Rank 1 represents the strongest technical positioning and a higher probability of favorable price behavior. As ranks increase toward the maximum, the probability of favorable outcomes weakens and bearish positioning becomes more dominant.) | Label: Bullish | Score: 0.793
18-Signal Technical Confluence Score: 0.667 (Bullish)
Overall Technical Score (18-signal confluence + DRL rank blend): 0.704 (Bullish)
Note: The blended score reflects signal strength weighted against broader AI technical ranking, which may temporarily diverge.
Blended technical score breakdown: 0.704 (Bullish | Bull 14 / Bear 2 / Neutral 2)
The technical dashboard shows broad signal alignment, with the blended framework landing Bullish across multiple layers. The Deep Reinforcement Learning technical rank is #134 out of 1293 with a 0.793 score, which places the setup in a relatively favorable cohort even if not at the extreme top of the distribution. Separately, the 18-signal confluence score (0.667) confirms that the majority of independent indicators are pointing in the same direction, and the final blended output—overall technical score 0.704—keeps the label Bullish.
A useful angle is breadth versus exception risk. Breadth is strong (Bull 14), with constructive readings across rate-of-change and participation measures such as ROC(20) = 4.134 and Vol ROC(20) = 37.79. Several accumulation-oriented slopes are also bullish (e.g., OBV slope(10) and AD Line slope(10)), supporting the idea that the bullish label is not driven by a single indicator family.
The exceptions are concentrated rather than widespread: MACD Hist is bearish at -0.006724, and Chaikin Vol is bearish at 8.219. With volatility compression also present (BB Width 0.04678 bullish), the key watch is whether the bearish momentum/volatility pockets remain contained while price approaches the 24.7000 resistance zone. If those bearish readings broaden while price fails to clear resistance, the high breadth score can shift from “aligned trend” to “late-cycle consolidation.”
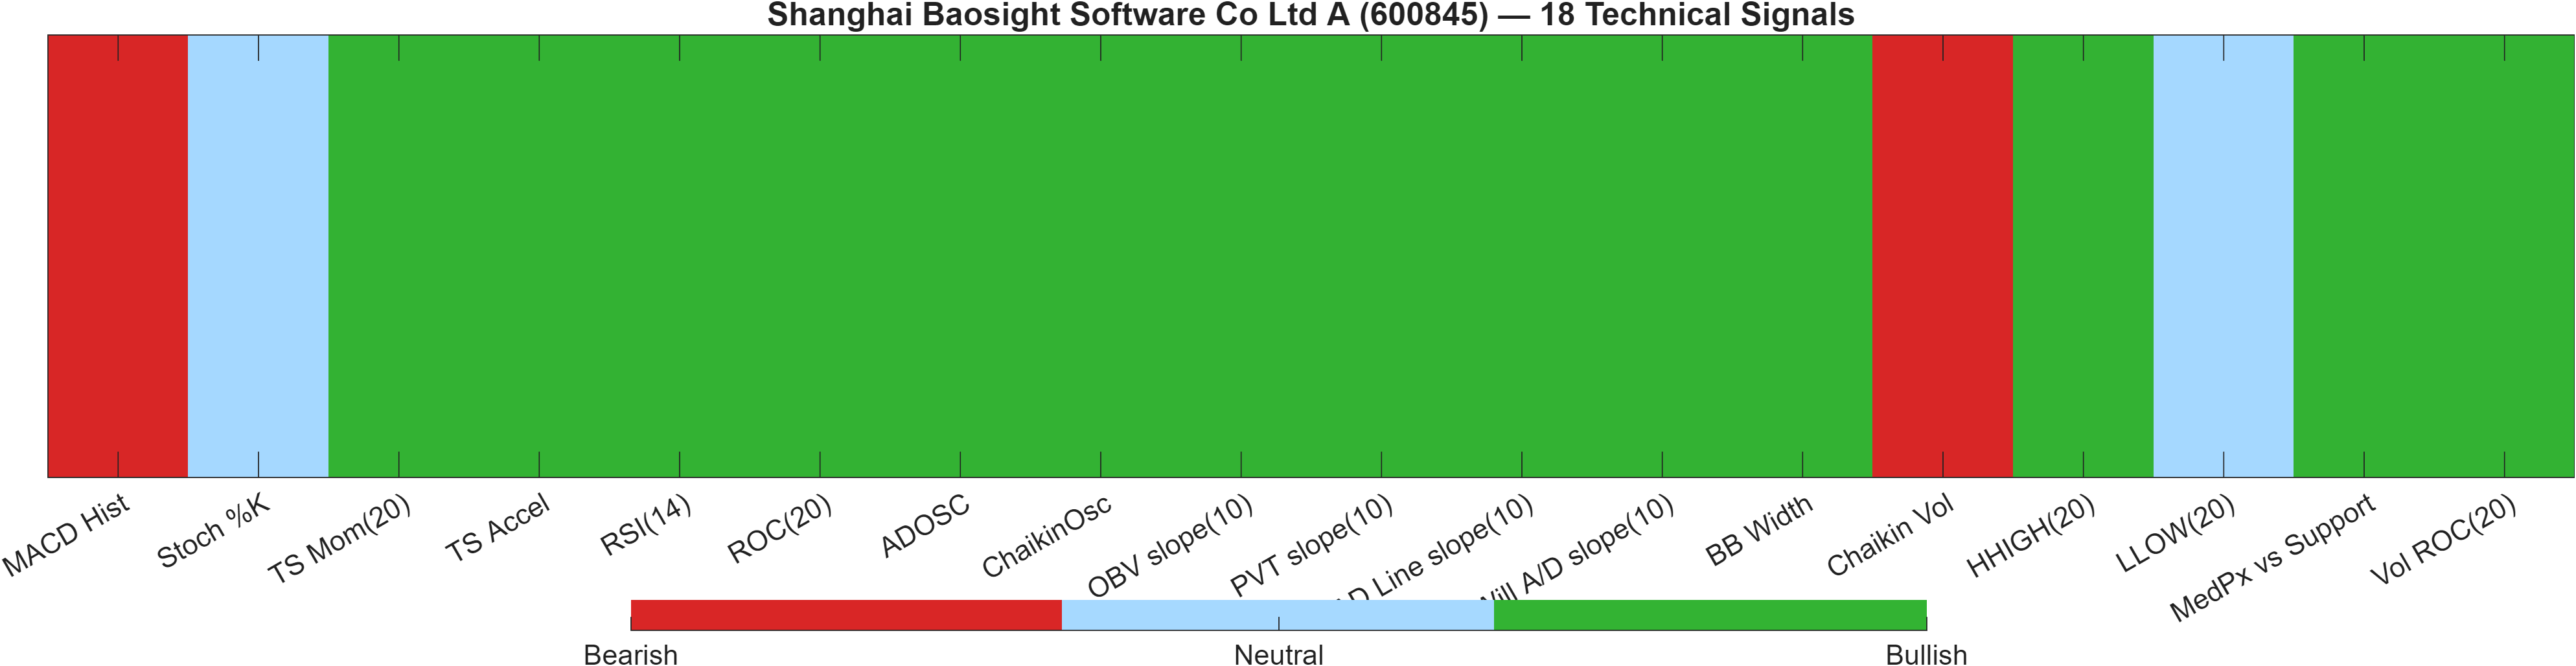
Signal table (Bull/Bear/Neutral)
| Indicator | Value | Signal |
|---|---|---|
| MACD Hist | -0.006724 | Bearish |
| Stoch %K | 72.44 | Neutral |
| TS Mom(20) | 0.96 | Bullish |
| TS Accel | 1.25 | Bullish |
| RSI(14) | 57.88 | Bullish |
| ROC(20) | 4.134 | Bullish |
| ADOSC | 61.84 | Bullish |
| ChaikinOsc | 5.633e+06 | Bullish |
| OBV slope(10) | 1.6e+08 | Bullish |
| PVT slope(10) | 4.908e+05 | Bullish |
| AD Line slope(10) | 2.349e+07 | Bullish |
| Will A/D slope(10) | 2.681 | Bullish |
| BB Width | 0.04678 | Bullish |
| Chaikin Vol | 8.219 | Bearish |
| HHIGH(20) | 24.53 | Bullish |
| LLOW(20) | 22.93 | Neutral |
| MedPx vs Support | 3.43 | Bullish |
| Vol ROC(20) | 37.79 | Bullish |
Interpretation: Indicator-level signals form the base confluence, which is then adjusted using a separate AI-driven technical ranking model. The final technical score summarizes this combined view.
6) News sentiment + extractive gist
Recent coverage across major financial outlets indicates a low-intensity, largely neutral information flow around the broader market/sector backdrop rather than instrument-specific catalysts. This is consistent with the note that instrument-specific news matches were not found, so the digest reflects wider themes. Quantitatively, the distribution is dominated by neutrality: Neutral 81% with Positive 12% and Negative 6%, and an average sentiment score of 0.013. The result is a context where price/technical structure is likely to remain the primary driver, while macro or sector narratives can still act as intermittent volatility triggers.
Positive Developments
The constructive layer in the news mix is characterized by technology- and industry-competitiveness narratives and improved risk appetite toward select regional markets. In sentiment terms, this aligns with the 12% positive share and the small positive average score (0.013) rather than an outright bullish news regime. For 600845, this matters mainly through second-order effects: improved sector tone can make it easier for technically bullish structures—such as the current overall technical score of 0.704—to attract incremental participation. With volatility still relatively contained (bandwidth 0.0468), constructive macro/sector framing can help convert consolidation into continuation if price approaches the 24.70 resistance with improving momentum confirmation.
Neutral / Mixed Developments
The neutral bulk (81%) suggests that much of the information set is descriptive rather than directional, increasing the likelihood that traders prioritize levels, momentum, and volume over narrative interpretation. This fits a market state where signals are strong on medium horizons (e.g., 3-monthly #53, 6-monthly #22) but less decisive day-to-day (daily #512, weekly #489). Mixed coverage can also coincide with range behavior: technical strength persists, yet short-term follow-through becomes more dependent on confirmation—especially with MACD histogram still slightly negative at -0.0067.
Negative / Risk Signals
The negative slice is limited (6%), but it clusters around geopolitical and competitive-risk themes that can reprice risk quickly even when day-to-day sentiment is quiet. In a compressed volatility regime (bandwidth 0.0468), sudden risk headlines can translate into outsized single-session moves, which is why the 20.7200 support line remains a critical reference for signal integrity. From a technical standpoint, the presence of bearish sub-signals—MACD histogram -0.006724 and Chaikin Vol 8.219—does not negate the bullish composite, but it does highlight where fragility could show first if risk-off pressure rises.
- What to monitor next: Any volatility expansion alongside a test of 24.70.
- What to monitor next: Whether MACD histogram (-0.0067) turns up as RSI holds near constructive territory (RSI(14) 57.88).
- What to monitor next: Downside behavior around 20.72 if broader risk sentiment deteriorates.
Sources referenced: Reuters, Bloomberg, Yahoo Finance, MarketWatch, Investing.com
7) Sources
Not available in the provided data.
You may also like: How KGNAI AI ranks instruments across global markets
Disclaimer: KGNAI provides AI-generated analytics and educational market commentary only. This is not financial advice. Markets involve risk. Always do your own research.