
603993 — China Molybdenum Co Ltd Class A (27-Feb-2026) | Neutral trend bias with bullish technical confluence
China Molybdenum Co Ltd Class A (603993) is currently characterized by a neutral cross-horizon KGNAI rank posture while short-cycle technical diagnostics lean constructive. The rank distribution shows mixed relative positioning across horizons—most notably a stronger monthly standing (#103 of 1293) contrasted with weaker short-term placement (daily #912 of 1293). In price structure, the moving-average configuration is described as bullish (Close vs MA50 bullish; MA50 vs MA200 bullish), but the broader state remains sensitive to confirmation through participation and level behavior. Momentum reads firm with an elevated RSI bias (RSI(14) 77.78) and a positive MACD histogram (0.0864), while volatility remains contained with Bollinger bandwidth at 0.0728—conditions that can support trend continuation but also increase the importance of reactions around defined decision zones. Key risk control levels remain support ~19.8210 and resistance ~25.0150.
- Rank stance (Short / Mid / Long): Neutral / Neutral / Neutral (daily #912; weekly #517; yearly #869 within a 1293-instrument universe)
- Technical confluence label: Bullish (18-signal confluence 0.556; blended technical score 0.365)
- Key levels: Support ~ 19.8210 | Resistance ~ 25.0150
- News sentiment bias: Slightly constructive by model normalization (1.00 label Bullish), while distribution is mostly neutral (75% neutral; sentiment avg 0.000)
- Confirmation / invalidation: Continuation risk-control hinges on behavior around 25.0150 (break/hold with volume) versus deterioration risk on a close below 19.8210
What KGNAI Measures
KGNAI evaluates assets using large cross-sectional datasets built from millions of structured data points. Inputs incorporate fundamental metrics, technical structures, and systematically processed news sentiment. Statistical models, machine learning, and AI frameworks are used to assess relative positioning, signal alignment, and probabilistic behavior across broad universes.
How to Read This Report
- Ranks are comparative across the tracked universe, not absolute price targets.
- Confluence reflects alignment among independent signal groups.
- Support/resistance levels are probabilistic decision zones, not guarantees.
- Sentiment provides contextual bias within the broader analytical framework.
1) KGNAI AI Analysis
Region: CHINA
Total universe size: 1293 ranked instruments
- Daily rank: #912 out of 1293 — Neutral
- Weekly rank: #517 out of 1293 — Neutral
- Monthly rank: #103 out of 1293 — Bullish
- 3-Monthly rank: #986 out of 1293 — Neutral
- 6-Monthly rank: #952 out of 1293 — Neutral
- Yearly rank: #869 out of 1293 — Neutral
The rank profile for 603993 is best read as time-horizon dispersion rather than a single-direction verdict. The standout is the monthly rank (#103), positioning the name in the stronger end of the universe (upper decile behavior). In contrast, the daily rank (#912) is in the weaker portion (lower third), implying that near-term behavior may be more vulnerable to noise, mean reversion, or liquidity-driven swings even if the intermediate tape is improving.
The weekly placement (#517) sits closer to the middle, consistent with a market state where medium-term confirmation is incomplete. The longer horizons are also neutral—3-month #986, 6-month #952, and yearly #869—which argues against treating the strong monthly reading as a fully embedded regime shift. Instead, the data points to a possible rotation window: short-cycle ranks lag while one intermediate horizon improves.
The stated term view remains Neutral across short, mid, and long horizons, which is coherent with this mixed structure. In practical portfolio terms, this is a setup where confirmation should be sought in price/volume follow-through and in whether technical strength persists long enough to pull the lagging horizons upward, rather than fading quickly back into the longer neutral baseline.
2) Price & trend overview
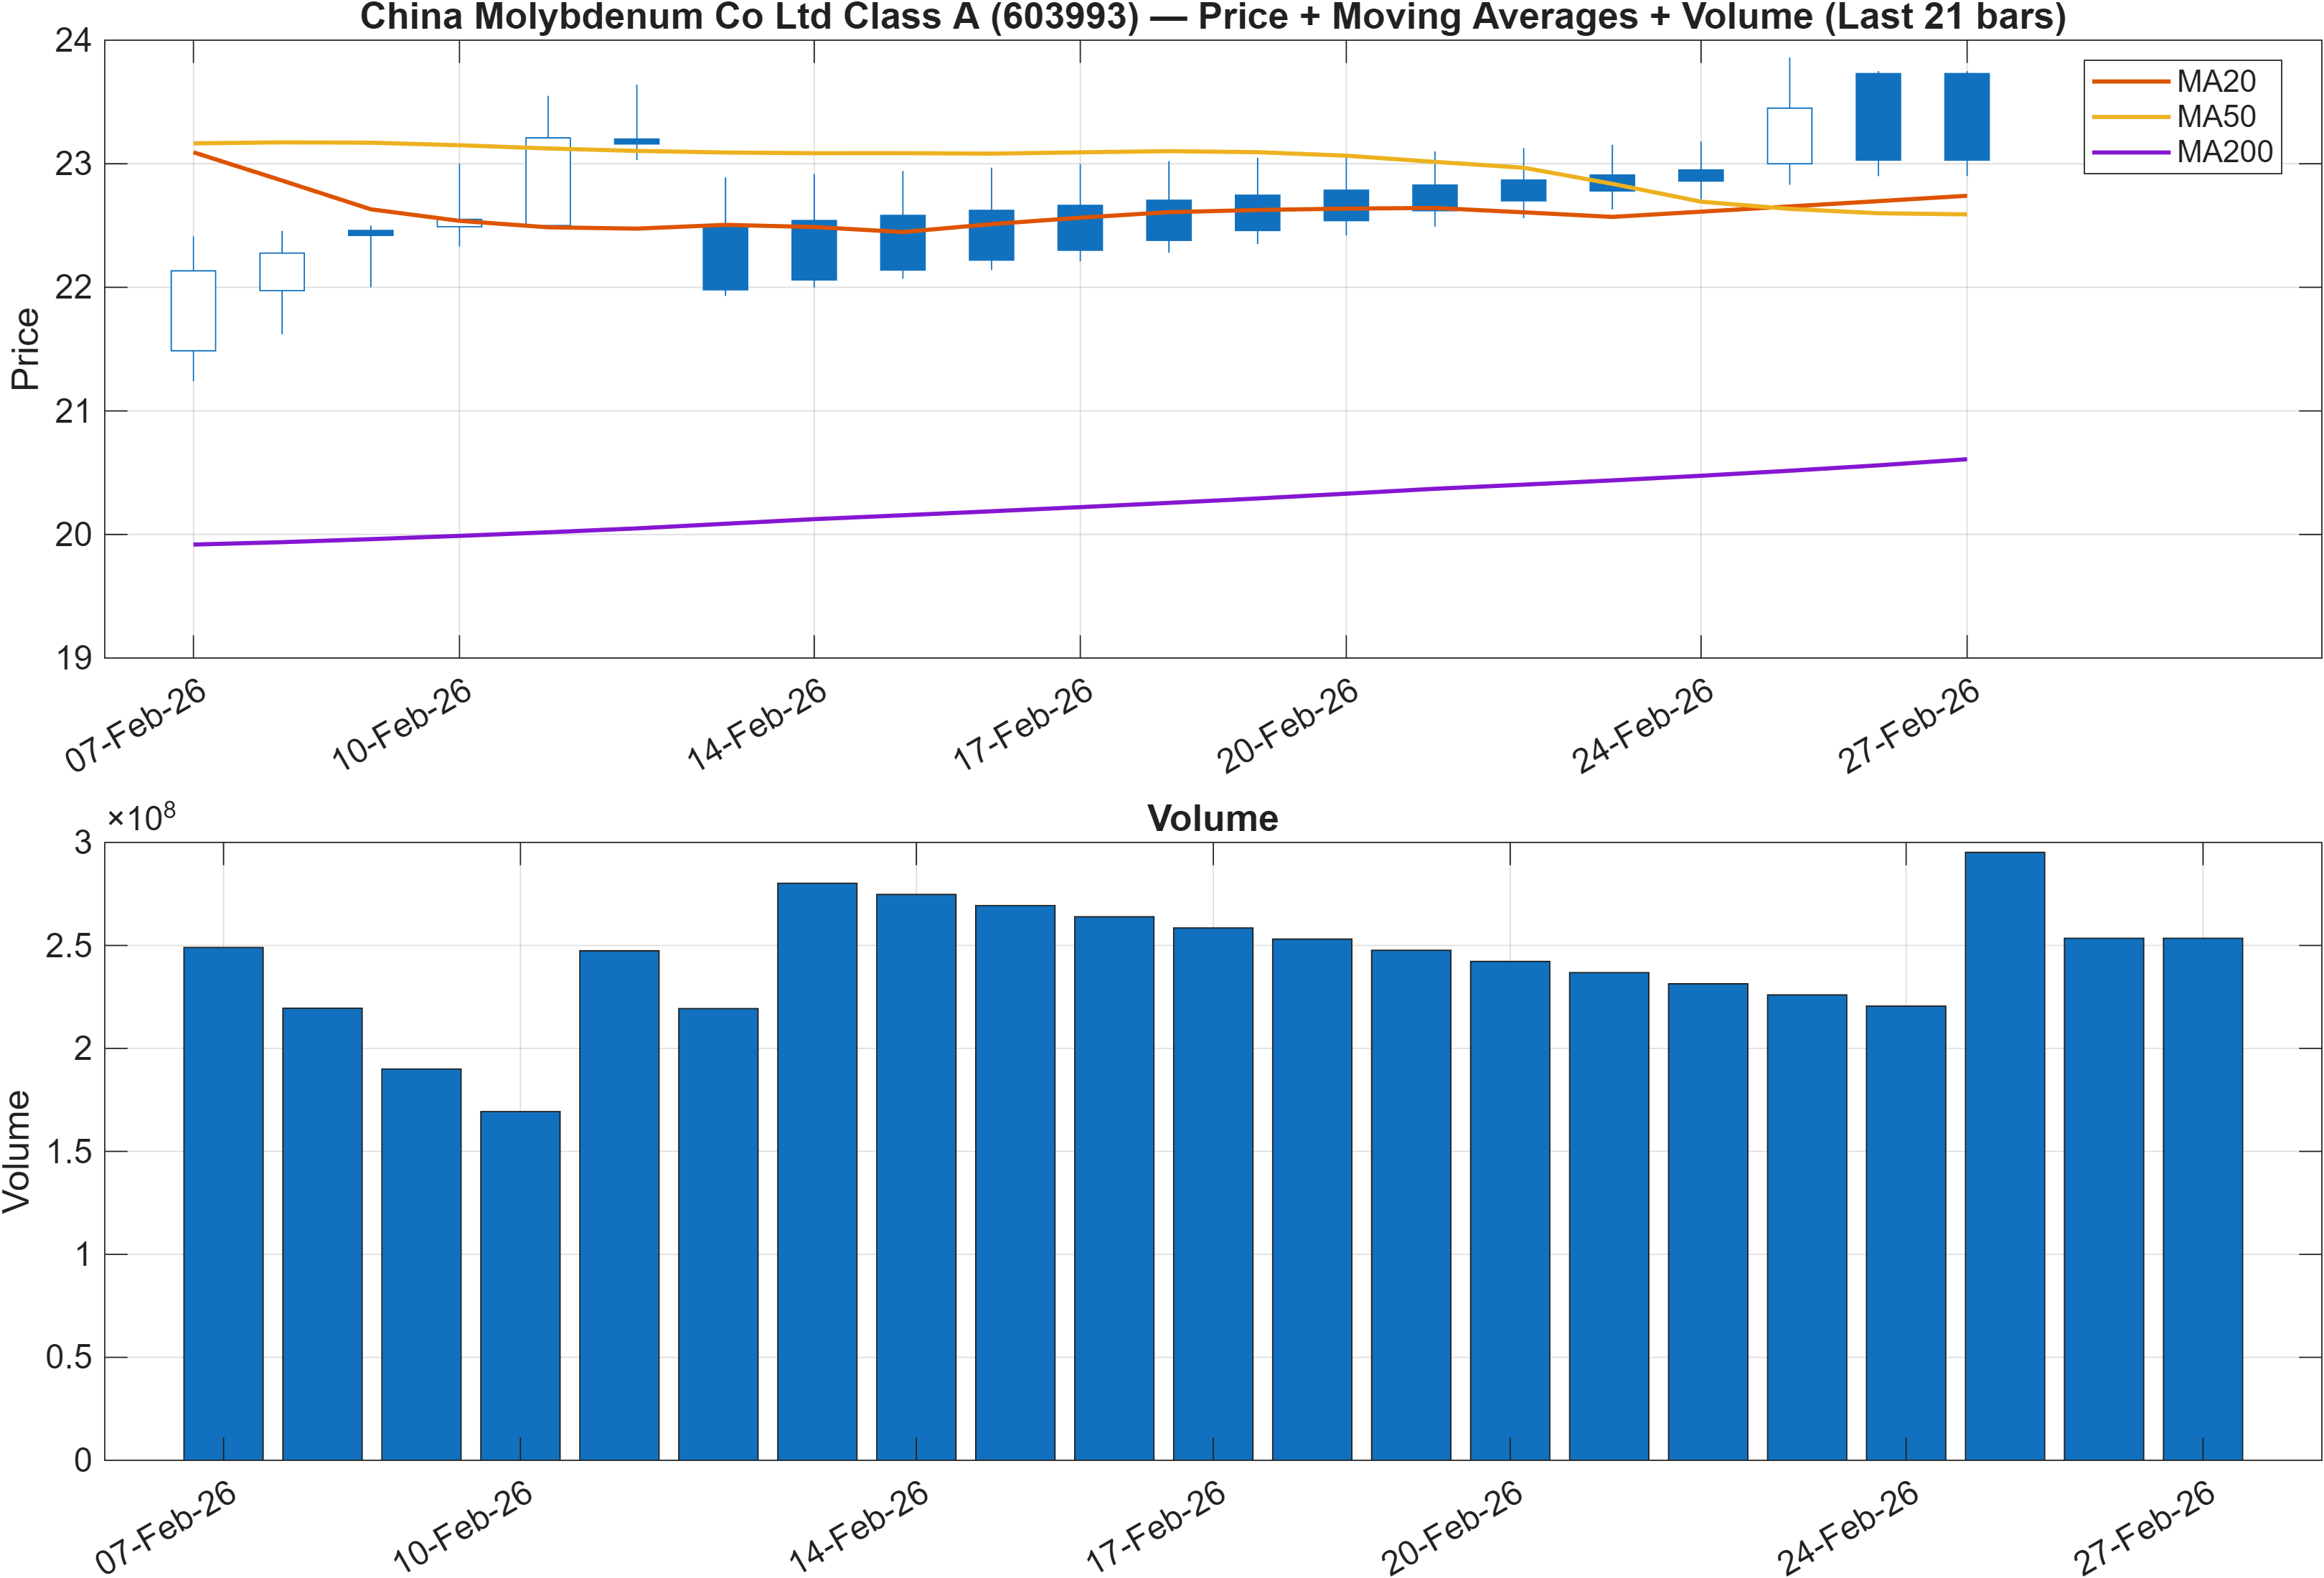
The moving-average read is constructive: Close vs MA50 is Bullish and MA50 vs MA200 is Bullish. That combination typically aligns with an advancing structure where pullbacks are more likely to be tested as trend maintenance rather than immediate reversals. However, the broader KGNAI rank posture remains neutral across most horizons, so this should be treated as trend evidence that still needs durability.
A useful way to reconcile the bullish MA configuration with the neutral rank stack is to frame it as a trend attempting to persist while cross-sectional strength is not yet dominant. In that context, participation matters: the report’s broader methodology emphasizes volume-backed moves, and the later signal set includes volume and accumulation indicators that can confirm whether advances are being supported by sustained demand.
The nearby technical decision framework is also defined by the explicit levels in the report: support ~19.8210 and resistance ~25.0150. With the MA structure bullish, a common failure mode is not “trend breaks instantly,” but rather that price fails to resolve above resistance and begins compressing back toward support as momentum fades. Conversely, sustained trade behavior that holds above intermediate averages and progressively pressures the 25.0150 area would be more consistent with the bullish intermediate rank signal (monthly #103) becoming more broadly reflected across shorter horizons.
3) Momentum & volatility dashboard
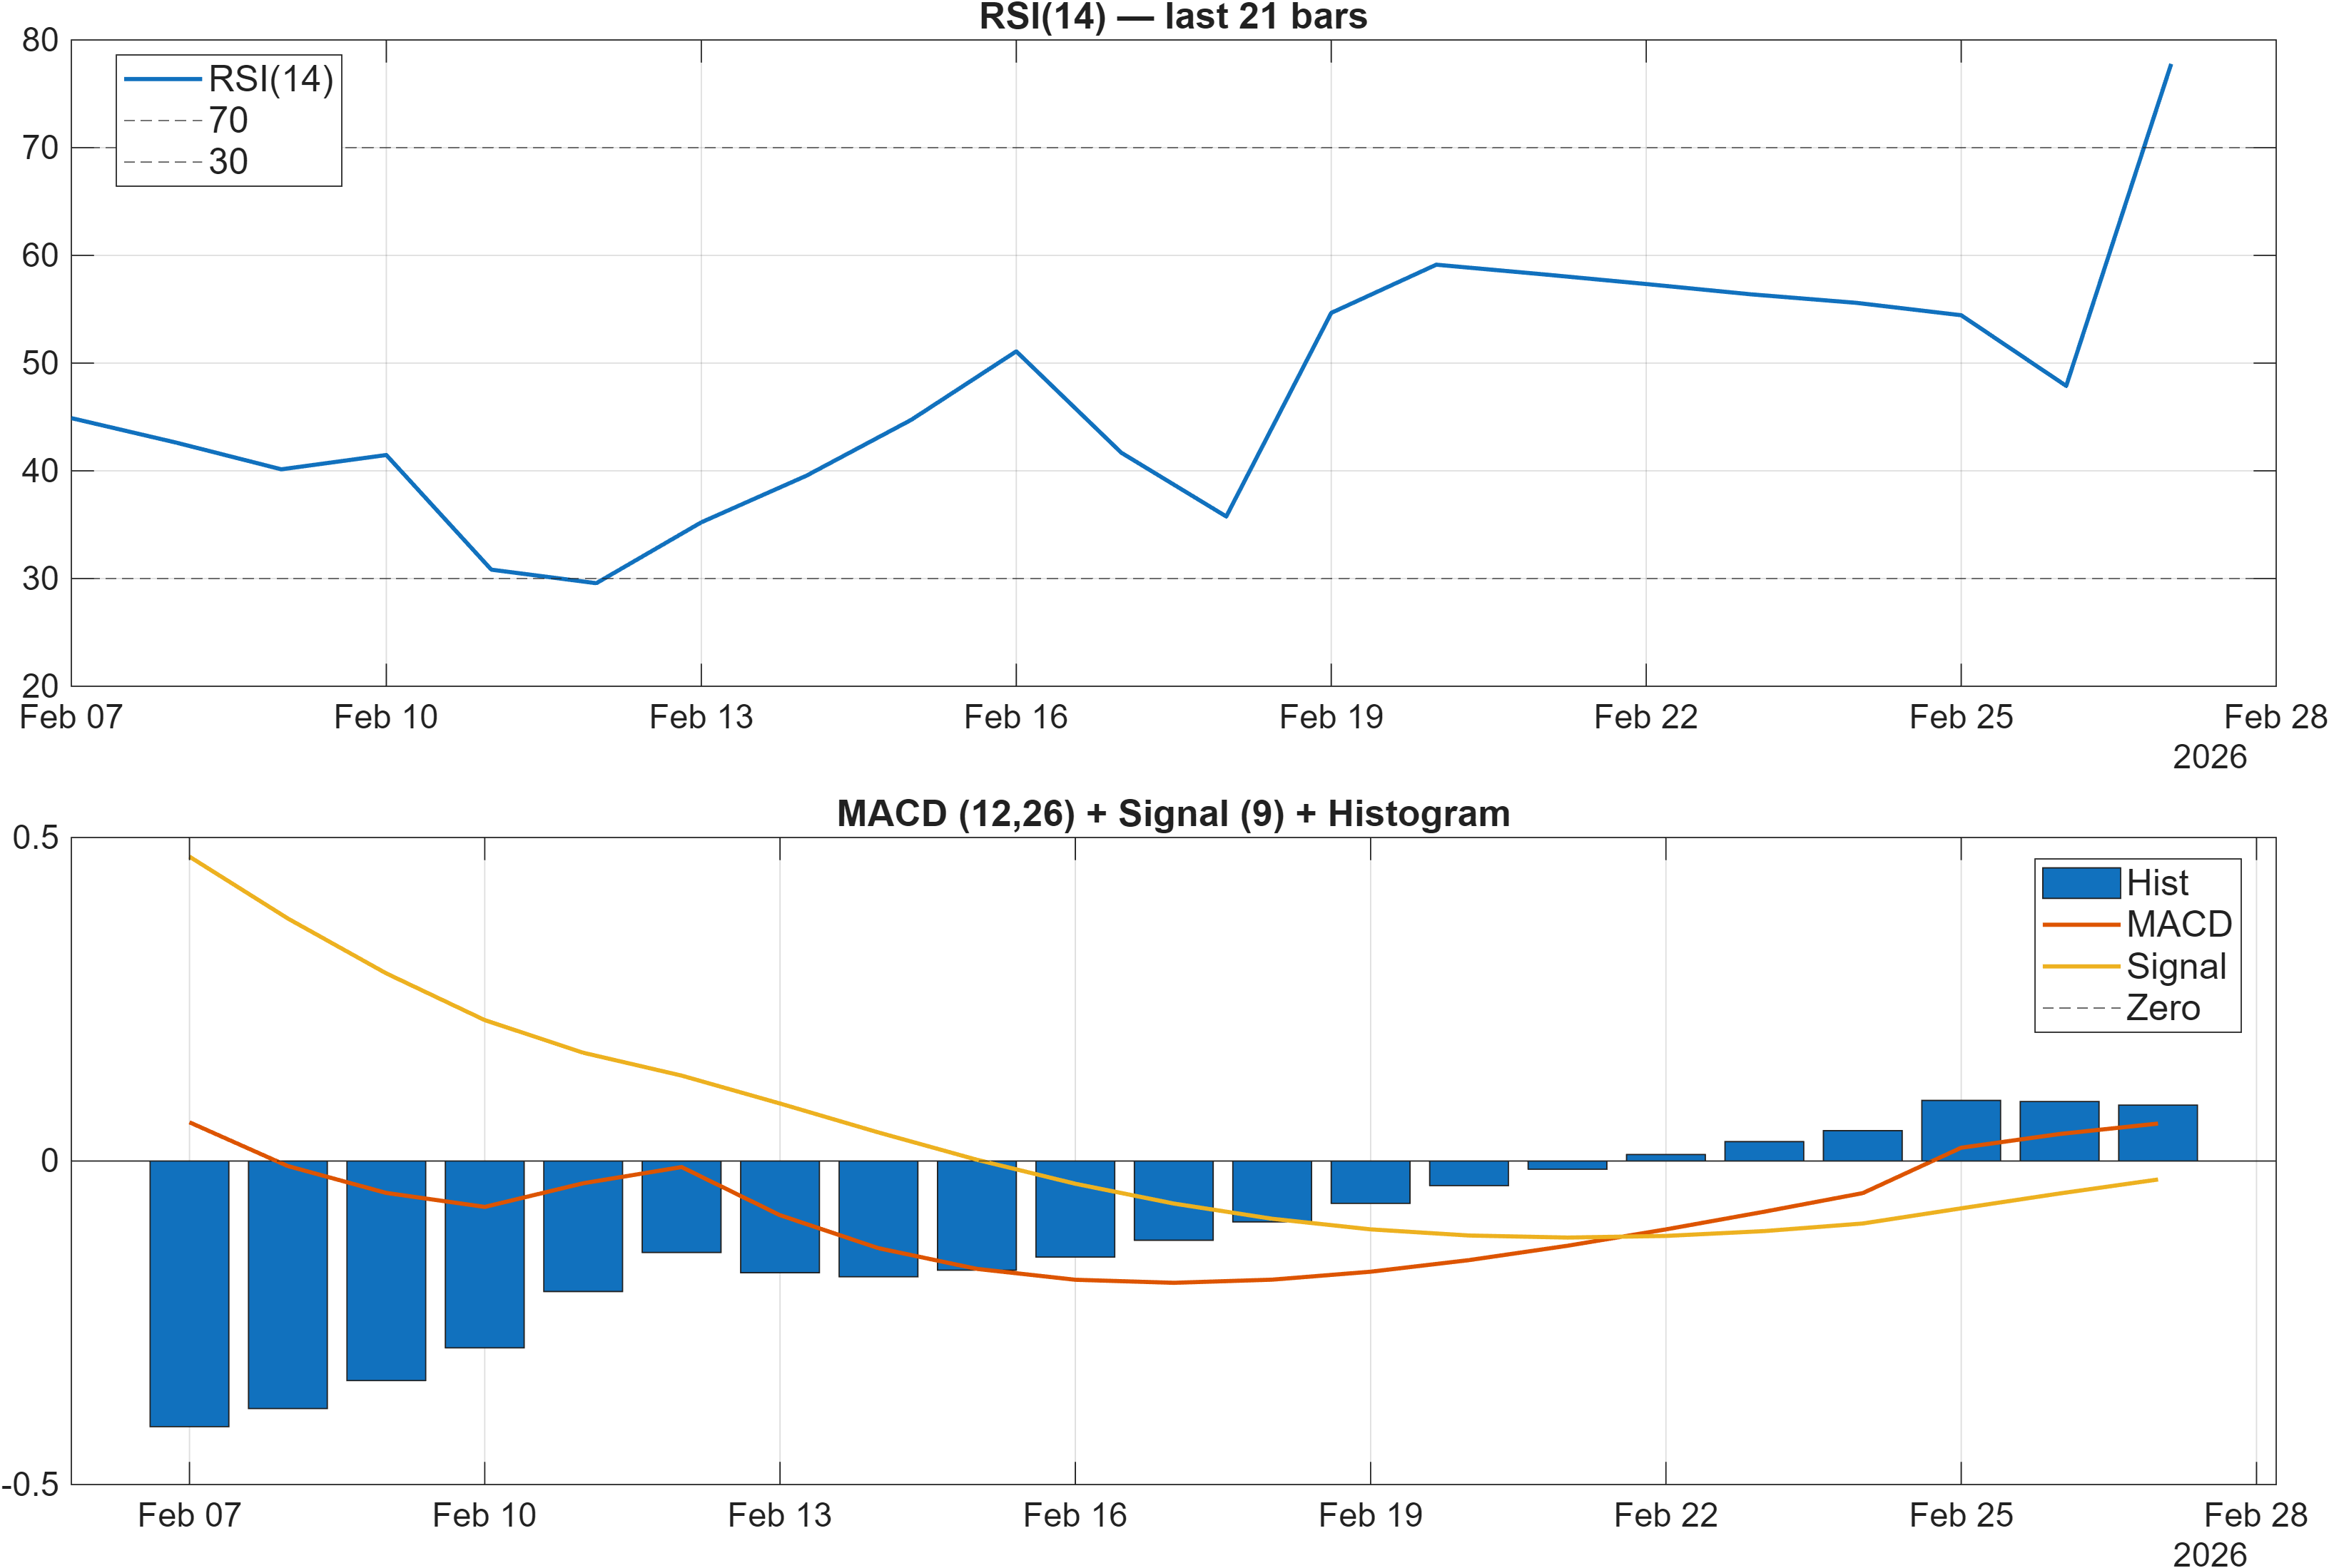
Momentum is presently skewed to the upside. The dashboard flags RSI bias = Bullish and the indicator table shows RSI(14) at 77.78, a level often associated with strong upside pressure but also with a greater chance of short-cycle cooling if incremental buying weakens. The MACD histogram at 0.0864 remains positive, consistent with trend-following support rather than a confirmed rollover.
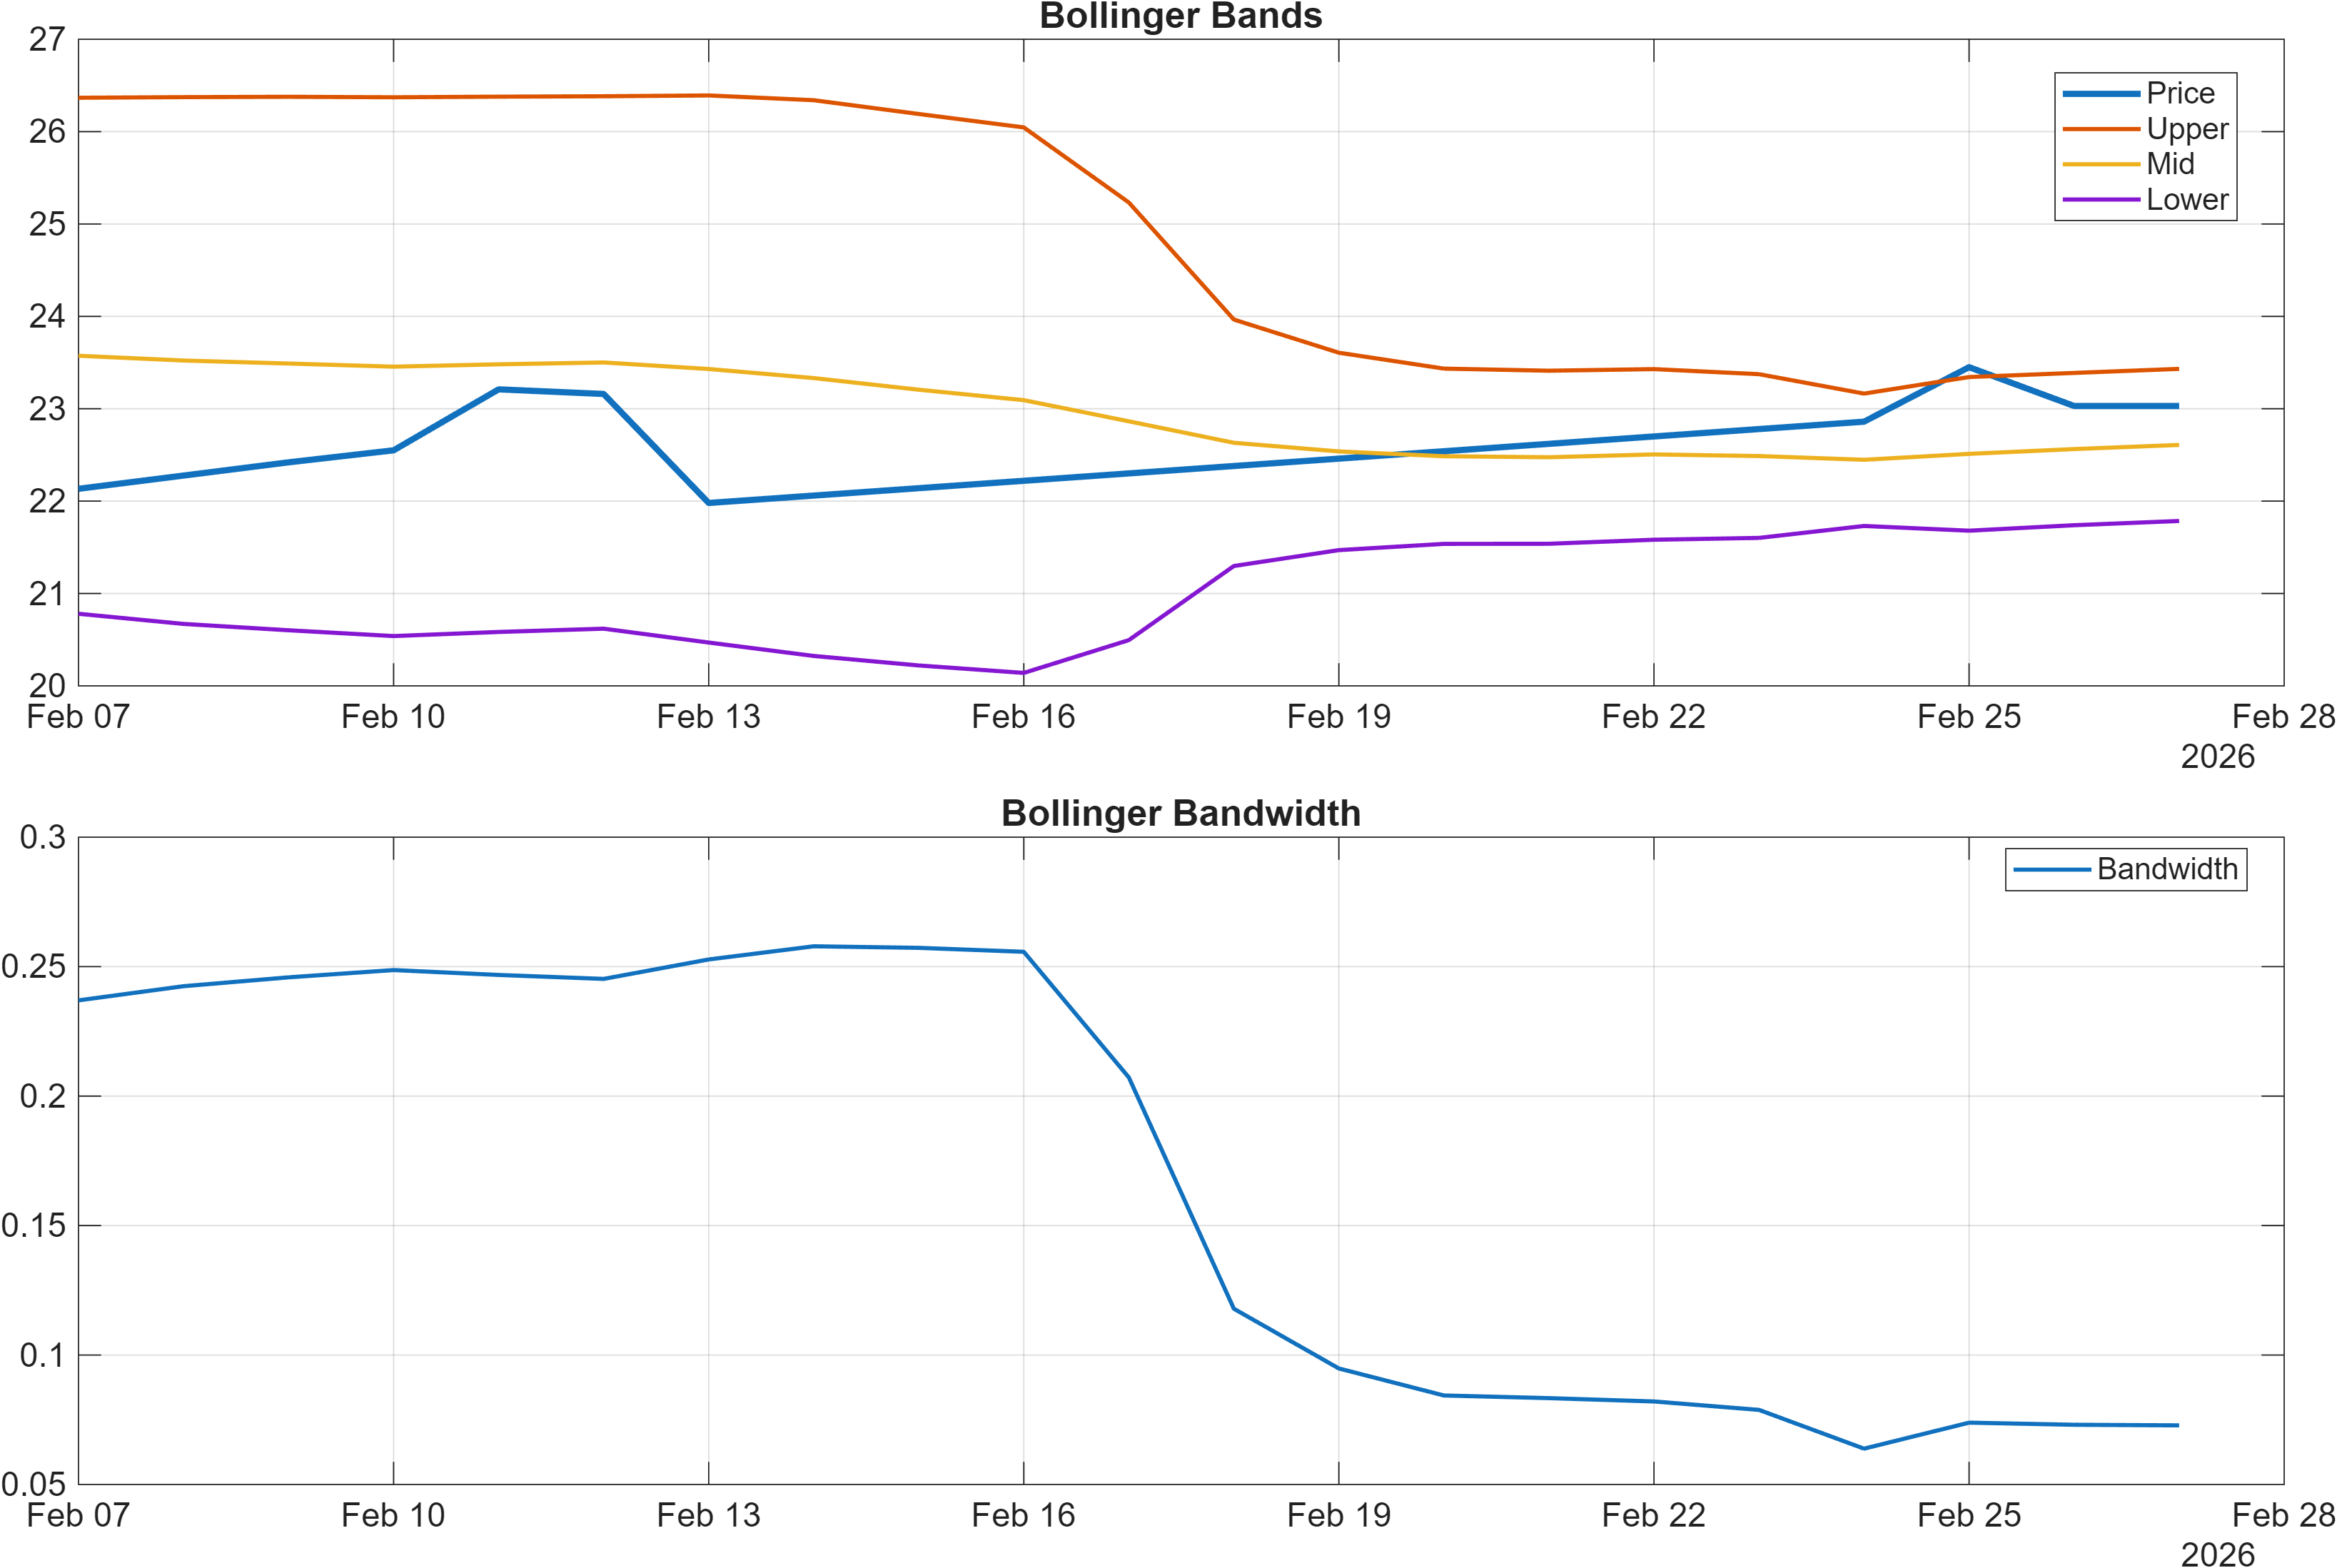
Volatility conditions remain comparatively contained: the latest Bollinger bandwidth is 0.0728. Low-to-moderate bandwidth alongside elevated RSI can produce two different outcomes: (1) controlled continuation where price grinds higher without broadening volatility, or (2) momentum saturation where price stops advancing but volatility still remains tight, creating a sideways digestion phase.
Cross-checking with other momentum reads in the signal set helps contextualize the RSI: TS Mom(20) is Bullish (0.7533) and ROC(20) is Bullish (3.382), which argues that the elevated RSI is not an isolated spike. The key analytical tension is therefore not “momentum vs no momentum,” but persistence vs exhaustion: whether bullish momentum can continue to express without triggering volatility expansion that frequently accompanies late-stage runs.
4) Support / Resistance zones
Support ~ 19.8210 | Resistance ~ 25.0150
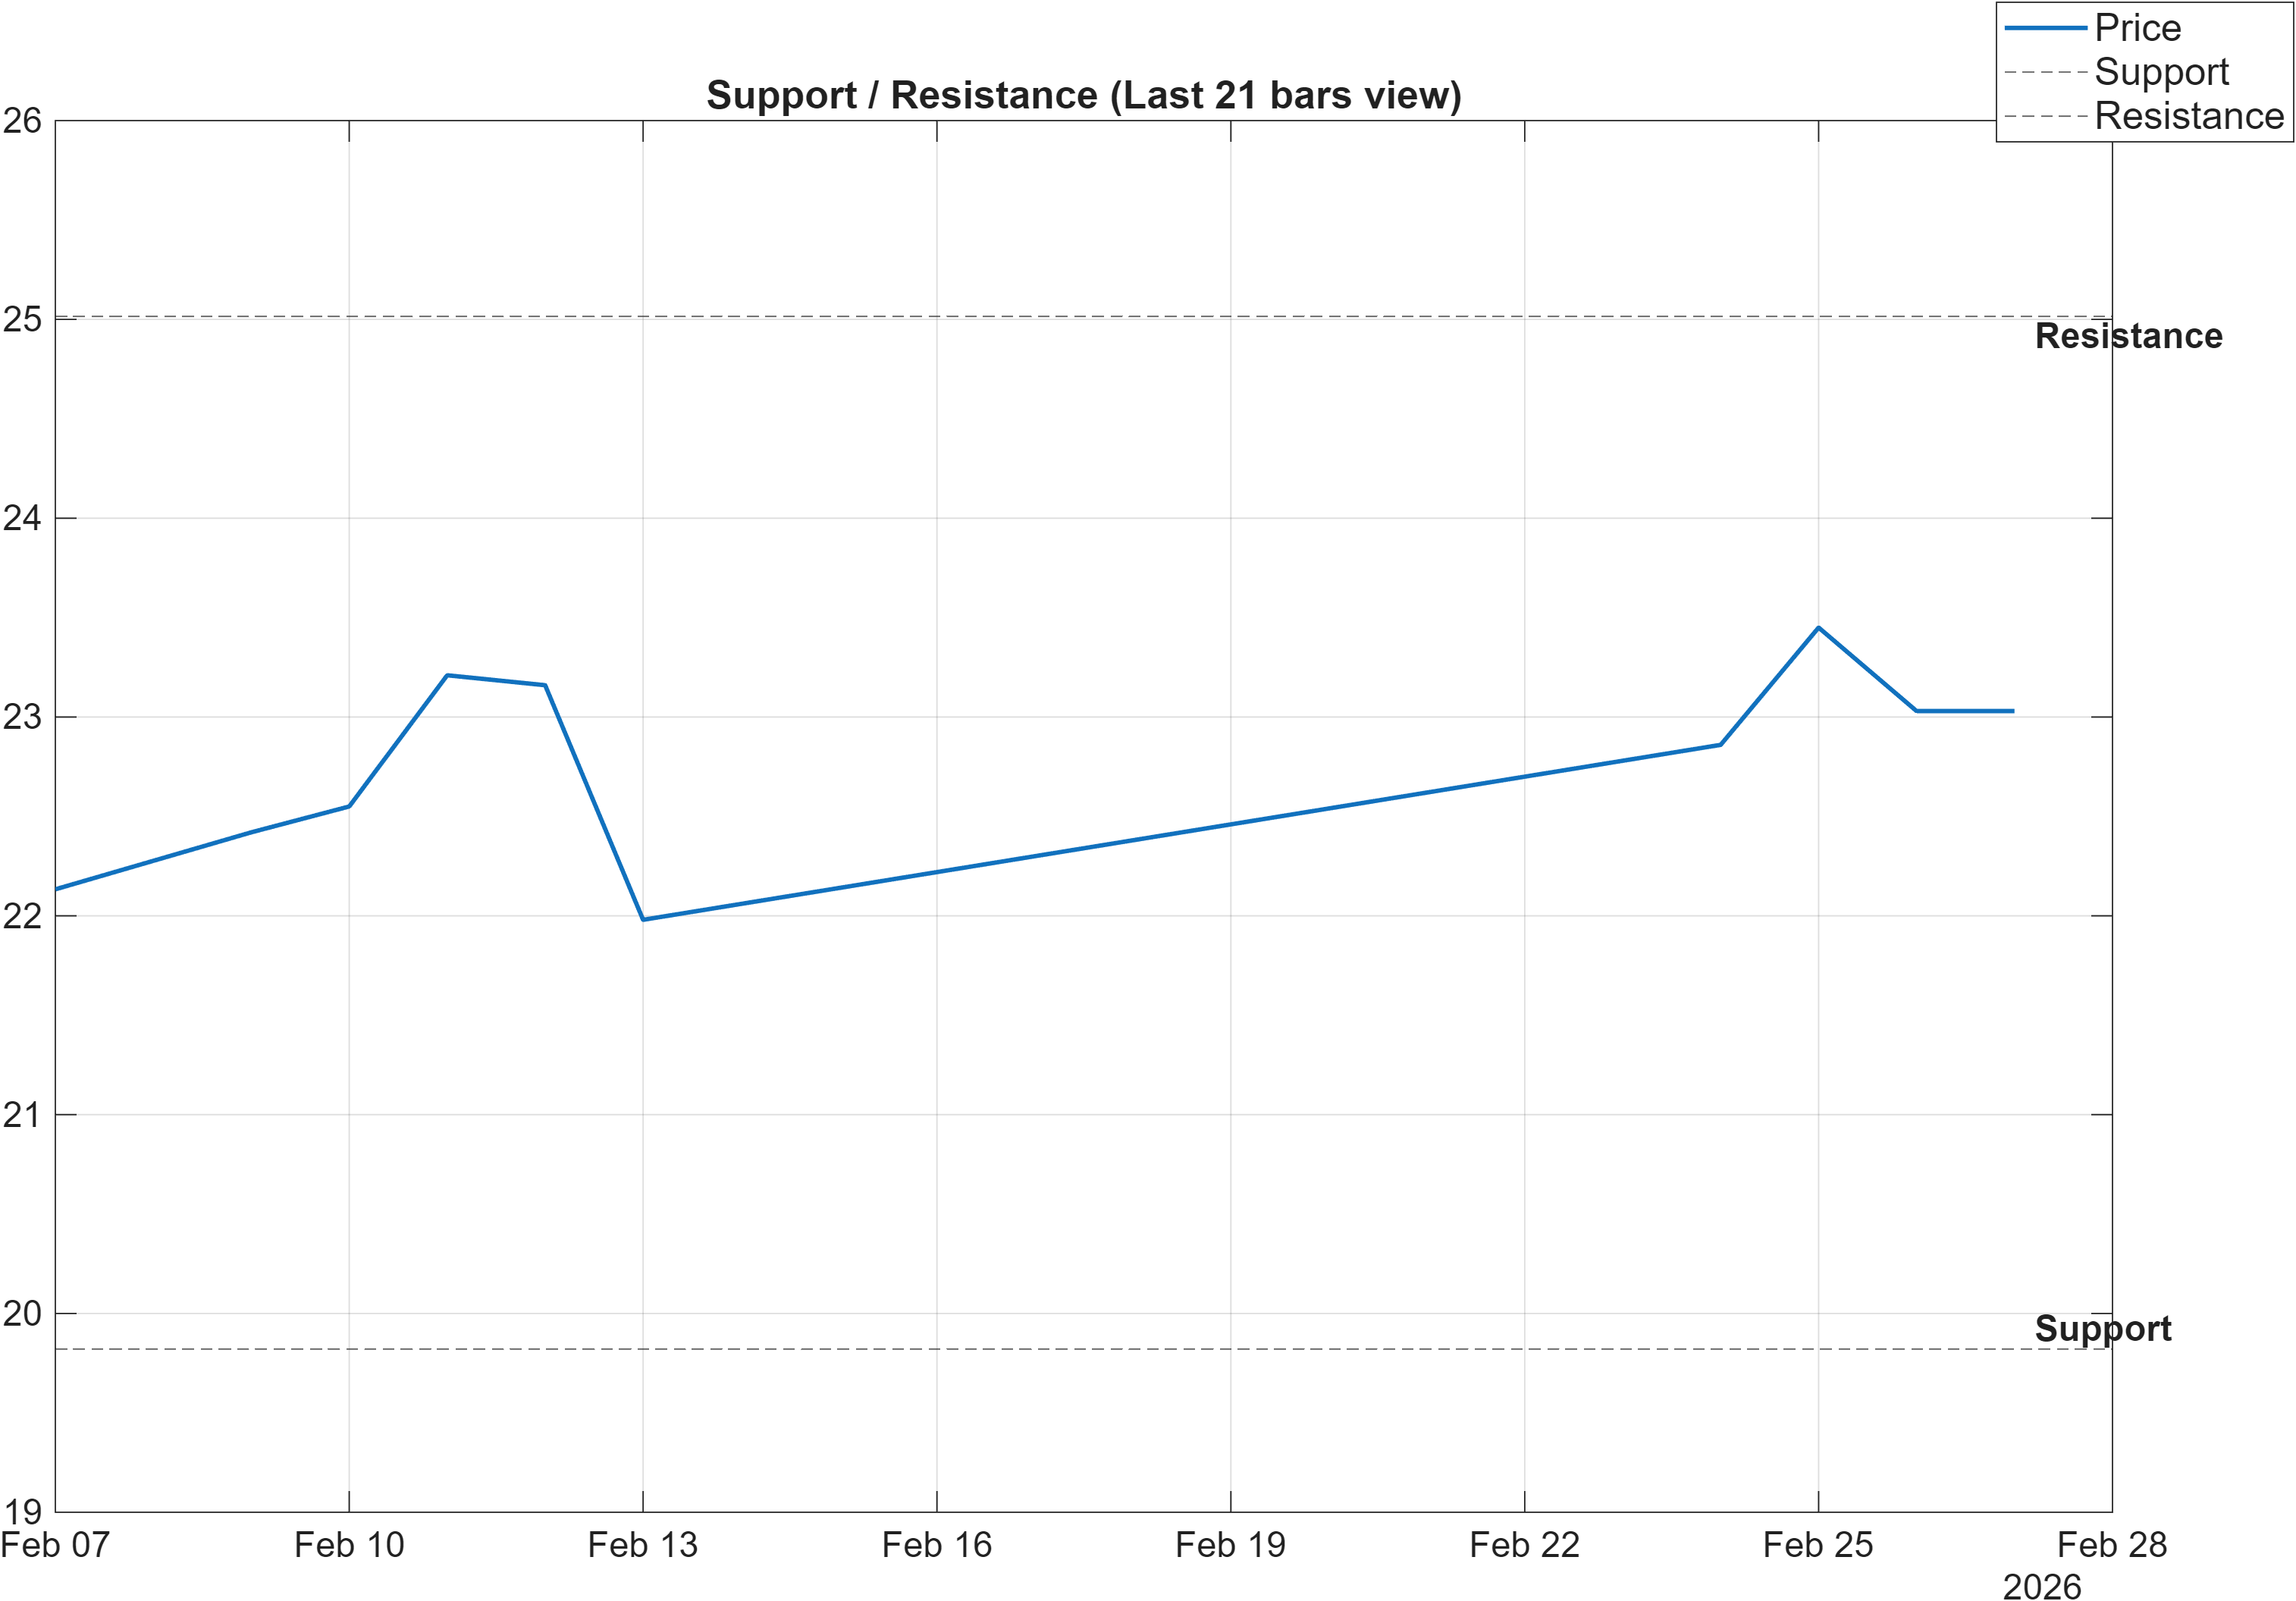
The level map is clean and should be treated as a probabilistic decision framework rather than a precise turning-point script. The stated scenario logic is straightforward: a break above resistance with volume would support continuation, while a close below support raises deterioration risk. In a market state where the moving-average structure is bullish but most ranks remain neutral, these zones become especially important because they anchor whether the current upswing is transitioning into a more durable regime.
From a structure standpoint, resistance at 25.0150 is the nearest area where trend strength must demonstrate durability. Momentum readings (RSI(14) 77.78; MACD hist 0.0864) can help reach such zones, but they do not ensure acceptance above them. Confirmation is more credible when it is paired with participation metrics: in the signal table, Vol ROC(20) is Bullish (15.48) and OBV slope(10) is Bullish (1.699e+09), both of which are consistent with improving activity.
Support at 19.8210 serves as the primary invalidation reference in this report. A deterioration event would be more concerning if it coincides with weakening accumulation measures—particularly because the signal set contains a notable internal conflict (e.g., a bearish AD Line slope(10) at -1.223e+09 alongside several bullish volume/flow measures). That divergence elevates the value of level discipline: price holding above support while testing resistance would favor the bullish confluence; losing support would amplify the significance of the bearish breadth/flow components.
5) Quant Technical Dashboard (18 Signals)
KGNAI AI Technical Analysis Score (Deep Reinforcement Learning): Rank #698 out of 1293 (Rank 1 represents the strongest technical positioning and a higher probability of favorable price behavior. As ranks increase toward the maximum, the probability of favorable outcomes weakens and bearish positioning becomes more dominant.) | Label: Neutral | Score: -0.080
18-Signal Technical Confluence Score: 0.556 (Bullish)
Overall Technical Score (18-signal confluence + DRL rank blend): 0.365 (Bullish)
Note: The blended score reflects signal strength weighted against broader AI technical ranking, which may temporarily diverge.
Blended technical score breakdown: 0.365 (Bullish | Bull 12 / Bear 2 / Neutral 4)
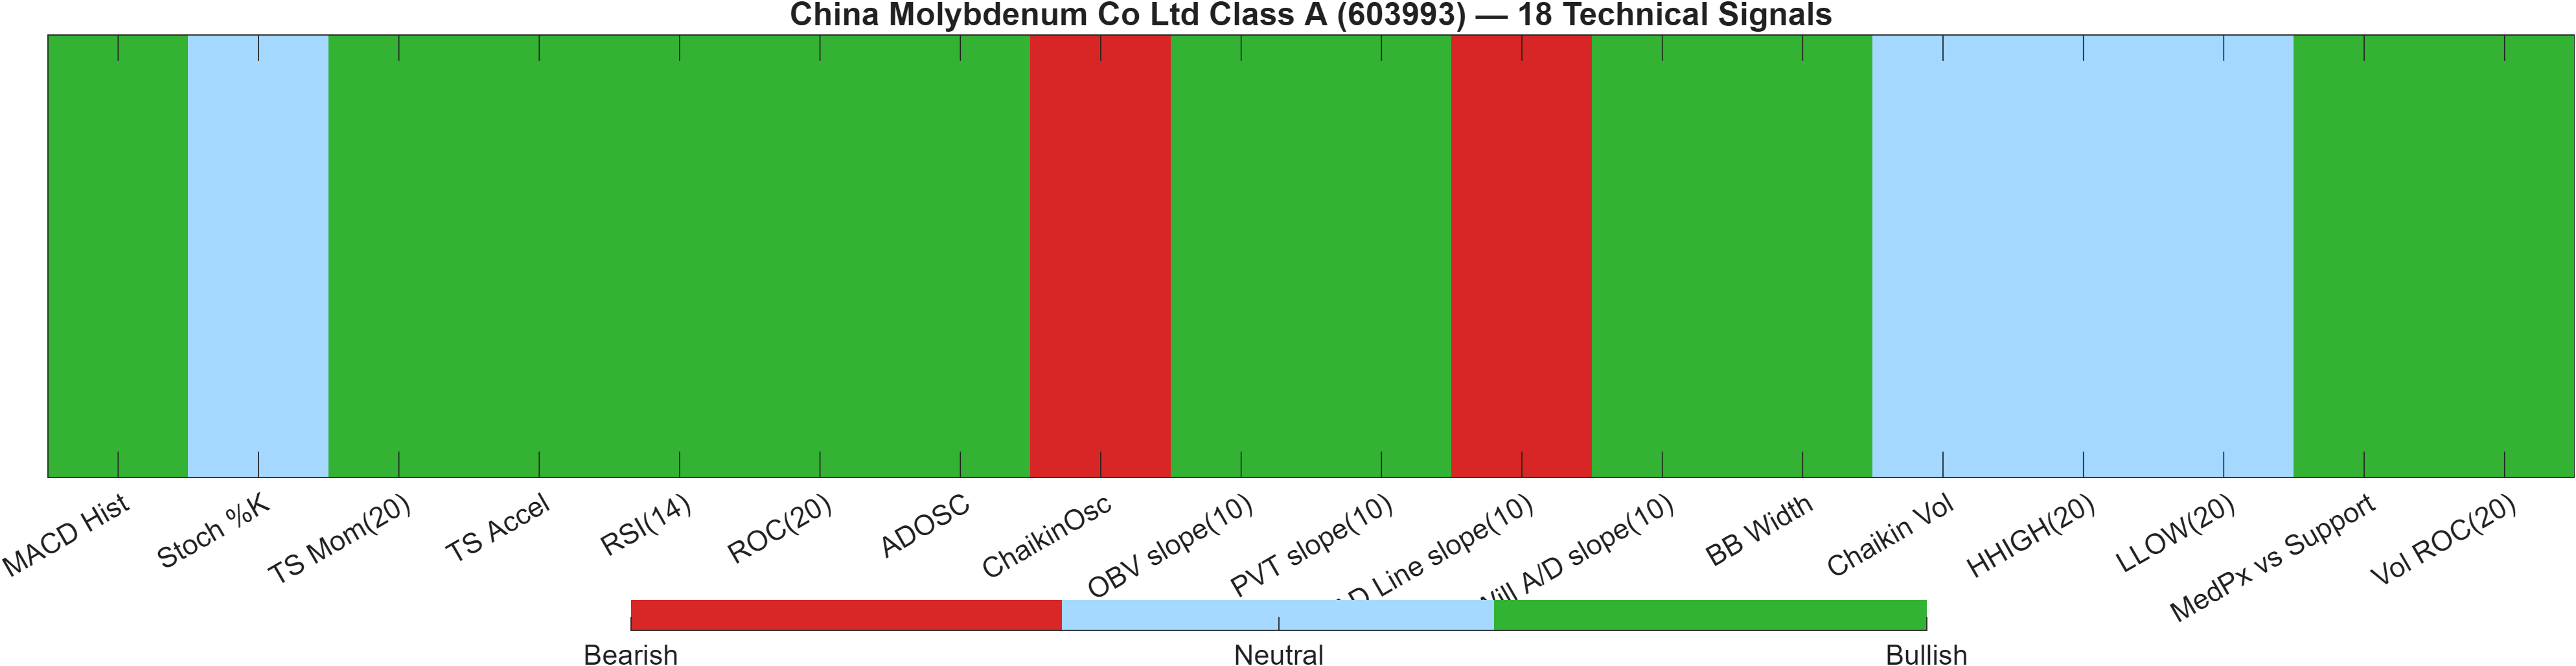
The technical layer shows alignment with a caveat. The 18-signal confluence is 0.556 (Bullish) and the blended overall technical score is 0.365 (Bullish), supported by a distribution of Bull 12 / Bear 2 / Neutral 4. At the same time, the Deep Reinforcement Learning technical rank is #698 with a Neutral label and a score of -0.080. That divergence is important: it suggests the indicator stack is currently favorable, but the broader learned technical context is less convinced—often a sign that the market is improving but not yet robust across conditions.
Signal table (Bull/Bear/Neutral)
| Indicator | Value | Signal |
|---|---|---|
| MACD Hist | 0.08644 | Bullish |
| Stoch %K | 47.47 | Neutral |
| TS Mom(20) | 0.7533 | Bullish |
| TS Accel | 1.547 | Bullish |
| RSI(14) | 77.78 | Bullish |
| ROC(20) | 3.382 | Bullish |
| ADOSC | 8.824 | Bullish |
| ChaikinOsc | -3.979e+08 | Bearish |
| OBV slope(10) | 1.699e+09 | Bullish |
| PVT slope(10) | 8.964e+06 | Bullish |
| AD Line slope(10) | -1.223e+09 | Bearish |
| Will A/D slope(10) | 0.81 | Bullish |
| BB Width | 0.07284 | Bullish |
| Chaikin Vol | -12.92 | Neutral |
| HHIGH(20) | 23.86 | Neutral |
| LLOW(20) | 21.62 | Neutral |
| MedPx vs Support | 3.504 | Bullish |
| Vol ROC(20) | 15.48 | Bullish |
Two features stand out. First, momentum and trend components are broadly supportive (e.g., MACD Hist bullish, TS Accel bullish, RSI(14) 77.78 bullish), consistent with a tape that is still pushing. Second, there is a flow/breadth disagreement: ChaikinOsc is Bearish (-3.979e+08) and AD Line slope(10) is Bearish (-1.223e+09) despite bullish OBV and PVT slopes. When those families diverge, follow-through above the resistance zone and stability of volatility (BB Width 0.07284 bullish) tend to carry more evidentiary weight than any single oscillator print.
Interpretation: Indicator-level signals form the base confluence, which is then adjusted using a separate AI-driven technical ranking model. The final technical score summarizes this combined view.
6) News sentiment + extractive gist
Note: Instrument-specific news matches were not found, so the digest reflects broader market/sector coverage. In the provided data, the sentiment distribution is predominantly neutral (75% neutral; 12% positive; 12% negative) with an average sentiment score of 0.000. Separately, the model-normalized sentiment score is 1.00 with an overall news score of 0.94 (as of 2025-11-04), which can be read as a constructive bias overlay rather than a security-specific catalyst assessment.
Positive Developments
Recent coverage across major financial outlets indicates a constructive tone around broader market activity and selected regional financial indicators, with attention on areas associated with improving transaction volumes and market access. In this dataset, that context aligns with a model-normalized sentiment label of Bullish despite the mostly neutral distribution, suggesting the sentiment engine is detecting favorable phrasing or macro framing even when headline direction is not consistently positive. For 603993, the key analytical value of this backdrop is not a direct fundamental inference (not available instrument-specifically here), but a potential tailwind for risk appetite that can help technically constructive setups persist. When paired with the report’s bullish technical confluence (0.556) and positive momentum reads (e.g., MACD hist 0.0864), the news layer marginally tilts the context toward continuation—while still requiring price confirmation at the defined resistance zone.
Neutral / Mixed Developments
The neutral share of coverage (75%) dominates the distribution, consistent with an information flow that is heavy on event updates and policy or geopolitics-related monitoring rather than asset-specific drivers. That matters because, in neutral news regimes, price often becomes more responsive to technical structures and liquidity conditions than to discrete narrative shocks. With volatility contained (bandwidth 0.0728), the tape can remain orderly even as mixed macro headlines circulate. For positioning, the most relevant implication is that the market may treat level interactions—support ~19.8210 and resistance ~25.0150—as the primary decision points while news remains background noise. In other words, neutral news flow reduces the probability that narrative alone resolves the setup.
Negative / Risk Signals
Risk coverage across major outlets continues to emphasize policy uncertainty and geopolitical tension, which can intermittently raise correlation and produce abrupt risk-off impulses—even when a single instrument’s technicals look constructive. In this dataset, the negative share is modest (12%), but it is sufficient to keep the distribution from confirming the model’s bullish normalization without reservation. For 603993, the technical dashboard itself also embeds a cautionary nuance: bearish readings in flow/breadth proxies (e.g., AD Line slope(10) and ChaikinOsc) can become more relevant if external headlines trigger rapid de-risking. Under those conditions, a break of 19.8210 would be more analytically meaningful than oscillator noise, because it would align price action with the weaker components in the signal mix.
- Whether price acceptance improves around 25.0150 alongside supportive participation (e.g., volume/OBV behavior).
- Whether momentum cools without breaking structure (RSI(14) 77.78 easing while support holds).
- Whether volatility expands from bandwidth 0.0728 during attempts to clear resistance (healthy trend expansion vs late-stage instability).
Snapshot: AI Rank (Short–Mid–Long): Neutral (Neutral–Neutral–Neutral) · Technical Confluence: Bullish · Key Levels: Support ~19.82 | Resistance ~25.02 · News Sentiment: Neutral
Sources referenced: Reuters, Bloomberg, Yahoo Finance, MarketWatch, Investing.com
7) Sources
Not available in the provided data.
You may also like: How KGNAI AI ranks instruments across global markets
Disclaimer: KGNAI provides AI-generated analytics and educational market commentary only. This is not financial advice. Markets involve risk. Always do your own research.