
688208 (Autel Intelligent Technology Corp Ltd) — 04-Mar-2026 Technicals Lean Bearish as Ranks Stay Mixed
Autel Intelligent Technology Corp Ltd (688208) enters 04-Mar-2026 with a mixed rank profile but bearish technical alignment across several independent signal groups. In KGNAI’s China universe of 1293 instruments, the daily rank (#1016) and weekly rank (#1155) sit in the weaker portion of the distribution, while the monthly rank (#819) is less negative—suggesting near-term fragility without a clear longer-horizon reversal signal. Trend structure remains pressured with a bearish close vs MA50 and bearish MA50 vs MA200. Momentum is not oversold by RSI framing, yet the MACD histogram (-0.0923) and the overall blended technical score (-0.453, Bearish) indicate downside bias persists unless price reclaims key levels. Volatility is present but not extreme, with Bollinger bandwidth at 0.0903, leaving room for directional follow-through if catalysts arrive. News sentiment is broadly neutral with a slight positive tilt (avg 0.013), but the digest is sector/macro-oriented rather than instrument-specific.
- Rank stance: Short-term Bearish | Mid-term Neutral | Long-term Neutral
- Technical confluence: Bearish (18-signal confluence -0.333; blended overall -0.453)
- Key levels: Support ~ 34.1667 | Resistance ~ 39.9633
- News sentiment bias: Neutral (avg 0.013; Positive 19% / Neutral 69% / Negative 12%)
- Confirmation / invalidation: A break above 39.9633 with volume supports continuation framing; a close below 34.1667 increases deterioration risk.
KGNAI evaluates assets using large cross-sectional datasets built from millions of structured data points. Inputs incorporate fundamental metrics, technical structures, and systematically processed news sentiment. Statistical models, machine learning, and AI frameworks are used to assess relative positioning, signal alignment, and probabilistic behavior across broad universes.
- Ranks are comparative across the tracked universe, not absolute price targets.
- Confluence reflects alignment among independent signal groups.
- Support/resistance levels are probabilistic decision zones, not guarantees.
- Sentiment provides contextual bias within the broader analytical framework.
1) KGNAI AI Analysis
Region: CHINA
Total universe size: 1293 ranked instruments
- Daily rank: #1016 out of 1293 — Neutral
- Weekly rank: #1155 out of 1293 — Bearish
- Monthly rank: #819 out of 1293 — Neutral
- 3-Monthly rank: #1010 out of 1293 — Neutral
- 6-Monthly rank: #1012 out of 1293 — Neutral
- Yearly rank: Not available for this horizon — Not available
Cross-horizon positioning: short-term weakness, mid/long neutrality
Across the 1293-instrument universe, 688208’s weekly rank (#1155) places it in the weaker cohort, consistent with a short-horizon risk-off setup. The daily rank (#1016) is also elevated, reinforcing that near-term behavior has not improved enough to shift the instrument into a stronger relative bracket. By contrast, the monthly rank (#819) is less adverse, which can occur when recent drawdowns stabilize but do not yet reverse into a constructive trend regime.
This creates a useful tension for interpretation: the rank system is signaling that timing risk is concentrated in the short term, while longer horizons remain Neutral rather than outright bearish. When that pattern appears alongside bearish technical confluence (Section 5), it often reflects distribution-like behavior—price holding up enough to avoid deeper regime reclassification, while momentum and participation measures lean negative.
The term summary provided—Short-term: Bearish; Mid-term: Neutral; Long-term: Neutral—is consistent with the rank mix from daily through 6-month horizons (#1010 and #1012 remain elevated). The yearly horizon is Not available in the provided data. For portfolio construction, this profile generally argues for tighter confirmation requirements before treating rebounds as durable, because relative strength is not yet evident at the faster recalculation windows.
Want the full universe and complete rank tables? Unlock full access on KGNAI: https://www.kgnai.com/pricing
2) Price & trend overview
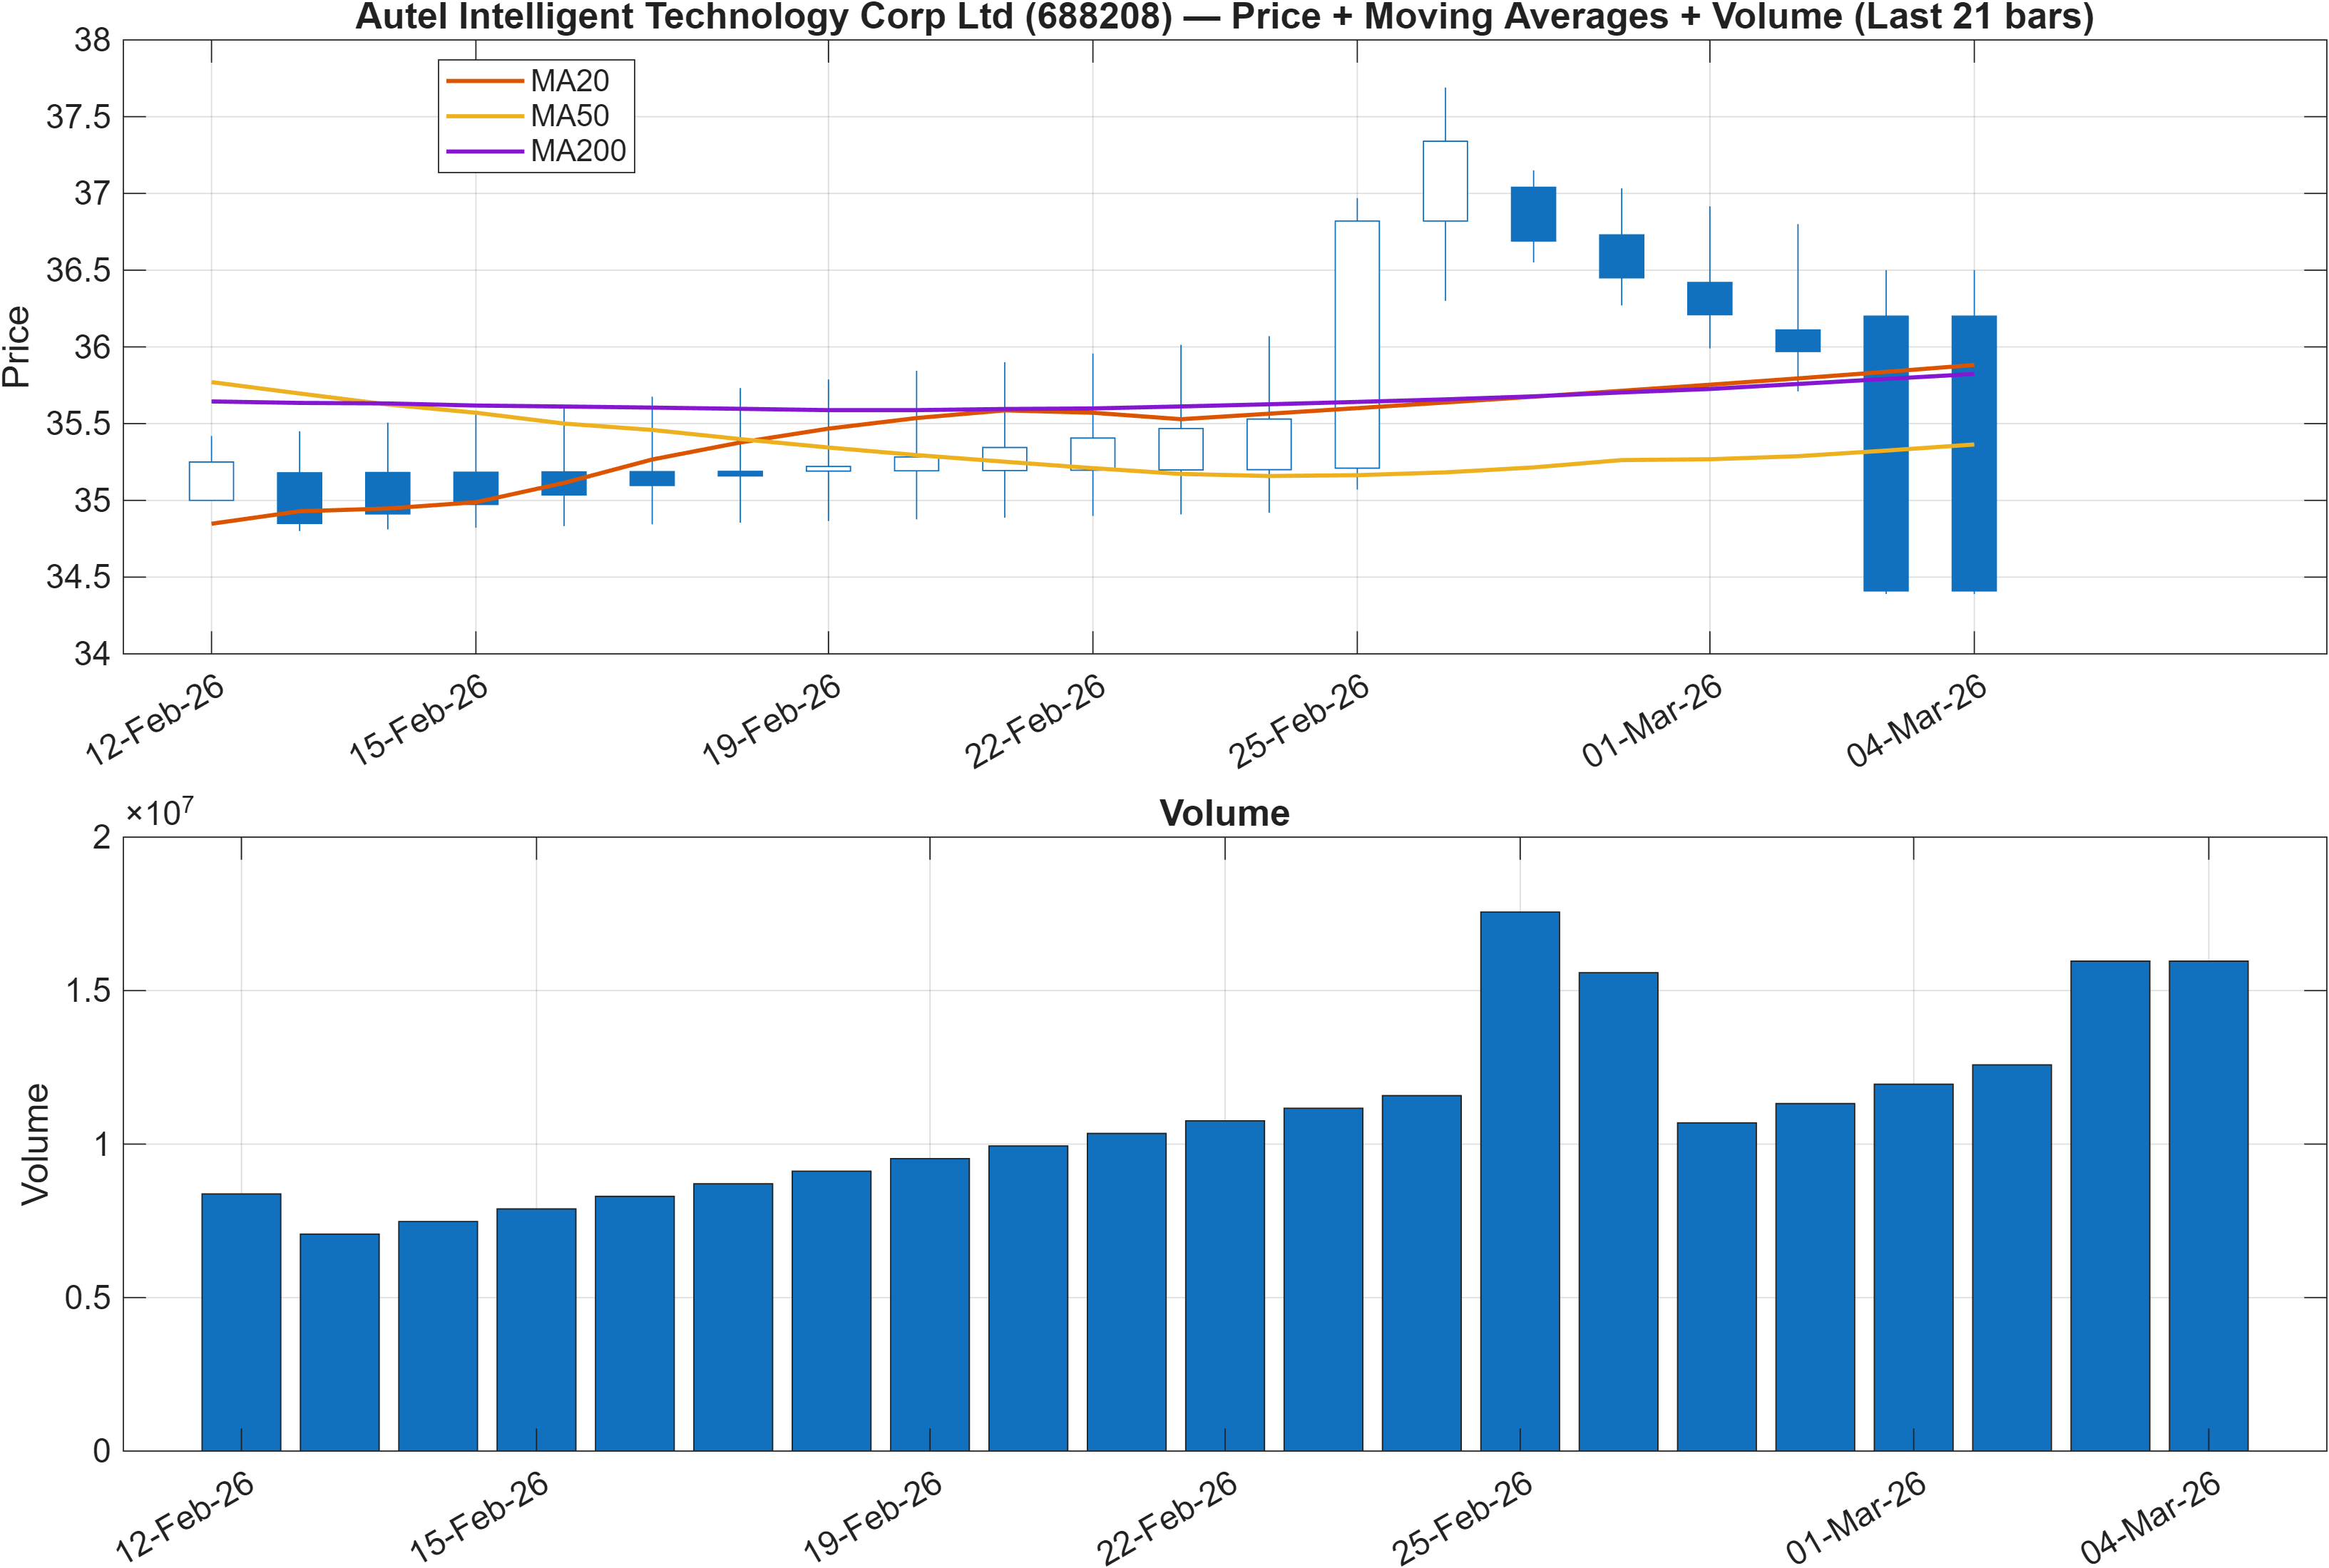
Interpretation: Close vs MA50 = Bearish, MA50 vs MA200 = Bearish.
Trend regime: downside tilt reinforced by moving-average stack
The moving-average configuration is uniformly negative: price vs MA50 is bearish, and the MA50 vs MA200 relationship is bearish. This combination typically signals that both short-to-intermediate trend and intermediate-to-long trend are aligned to the downside, making counter-trend rallies more dependent on abrupt participation shifts rather than organic trend support.
This trend framing matters when paired with the rank profile in Section 1. A weak weekly rank (#1155) alongside a bearish moving-average stack implies that relative weakness is not merely an intraday artifact; it is occurring within a broader downtrend architecture. Meanwhile, the less negative monthly rank (#819) suggests the market may be transitioning from “active trend deterioration” into “stabilization under trend pressure,” where the path improves only after price behavior begins to reclaim trend reference points.
In practice, the trend stack reduces the informational value of isolated momentum upticks: a single improvement in oscillator readings can occur without altering regime. For this reason, confirmations tend to be more credible when they occur near well-defined decision zones (see Section 4: 34.1667 support and 39.9633 resistance), and when they coincide with multi-signal improvement (Section 5 shows 11 bearish signals vs 5 bullish). Until the close/MA50 relationship changes, the setup remains consistent with a market that is demanding higher proof of trend repair.
3) Momentum & volatility dashboard
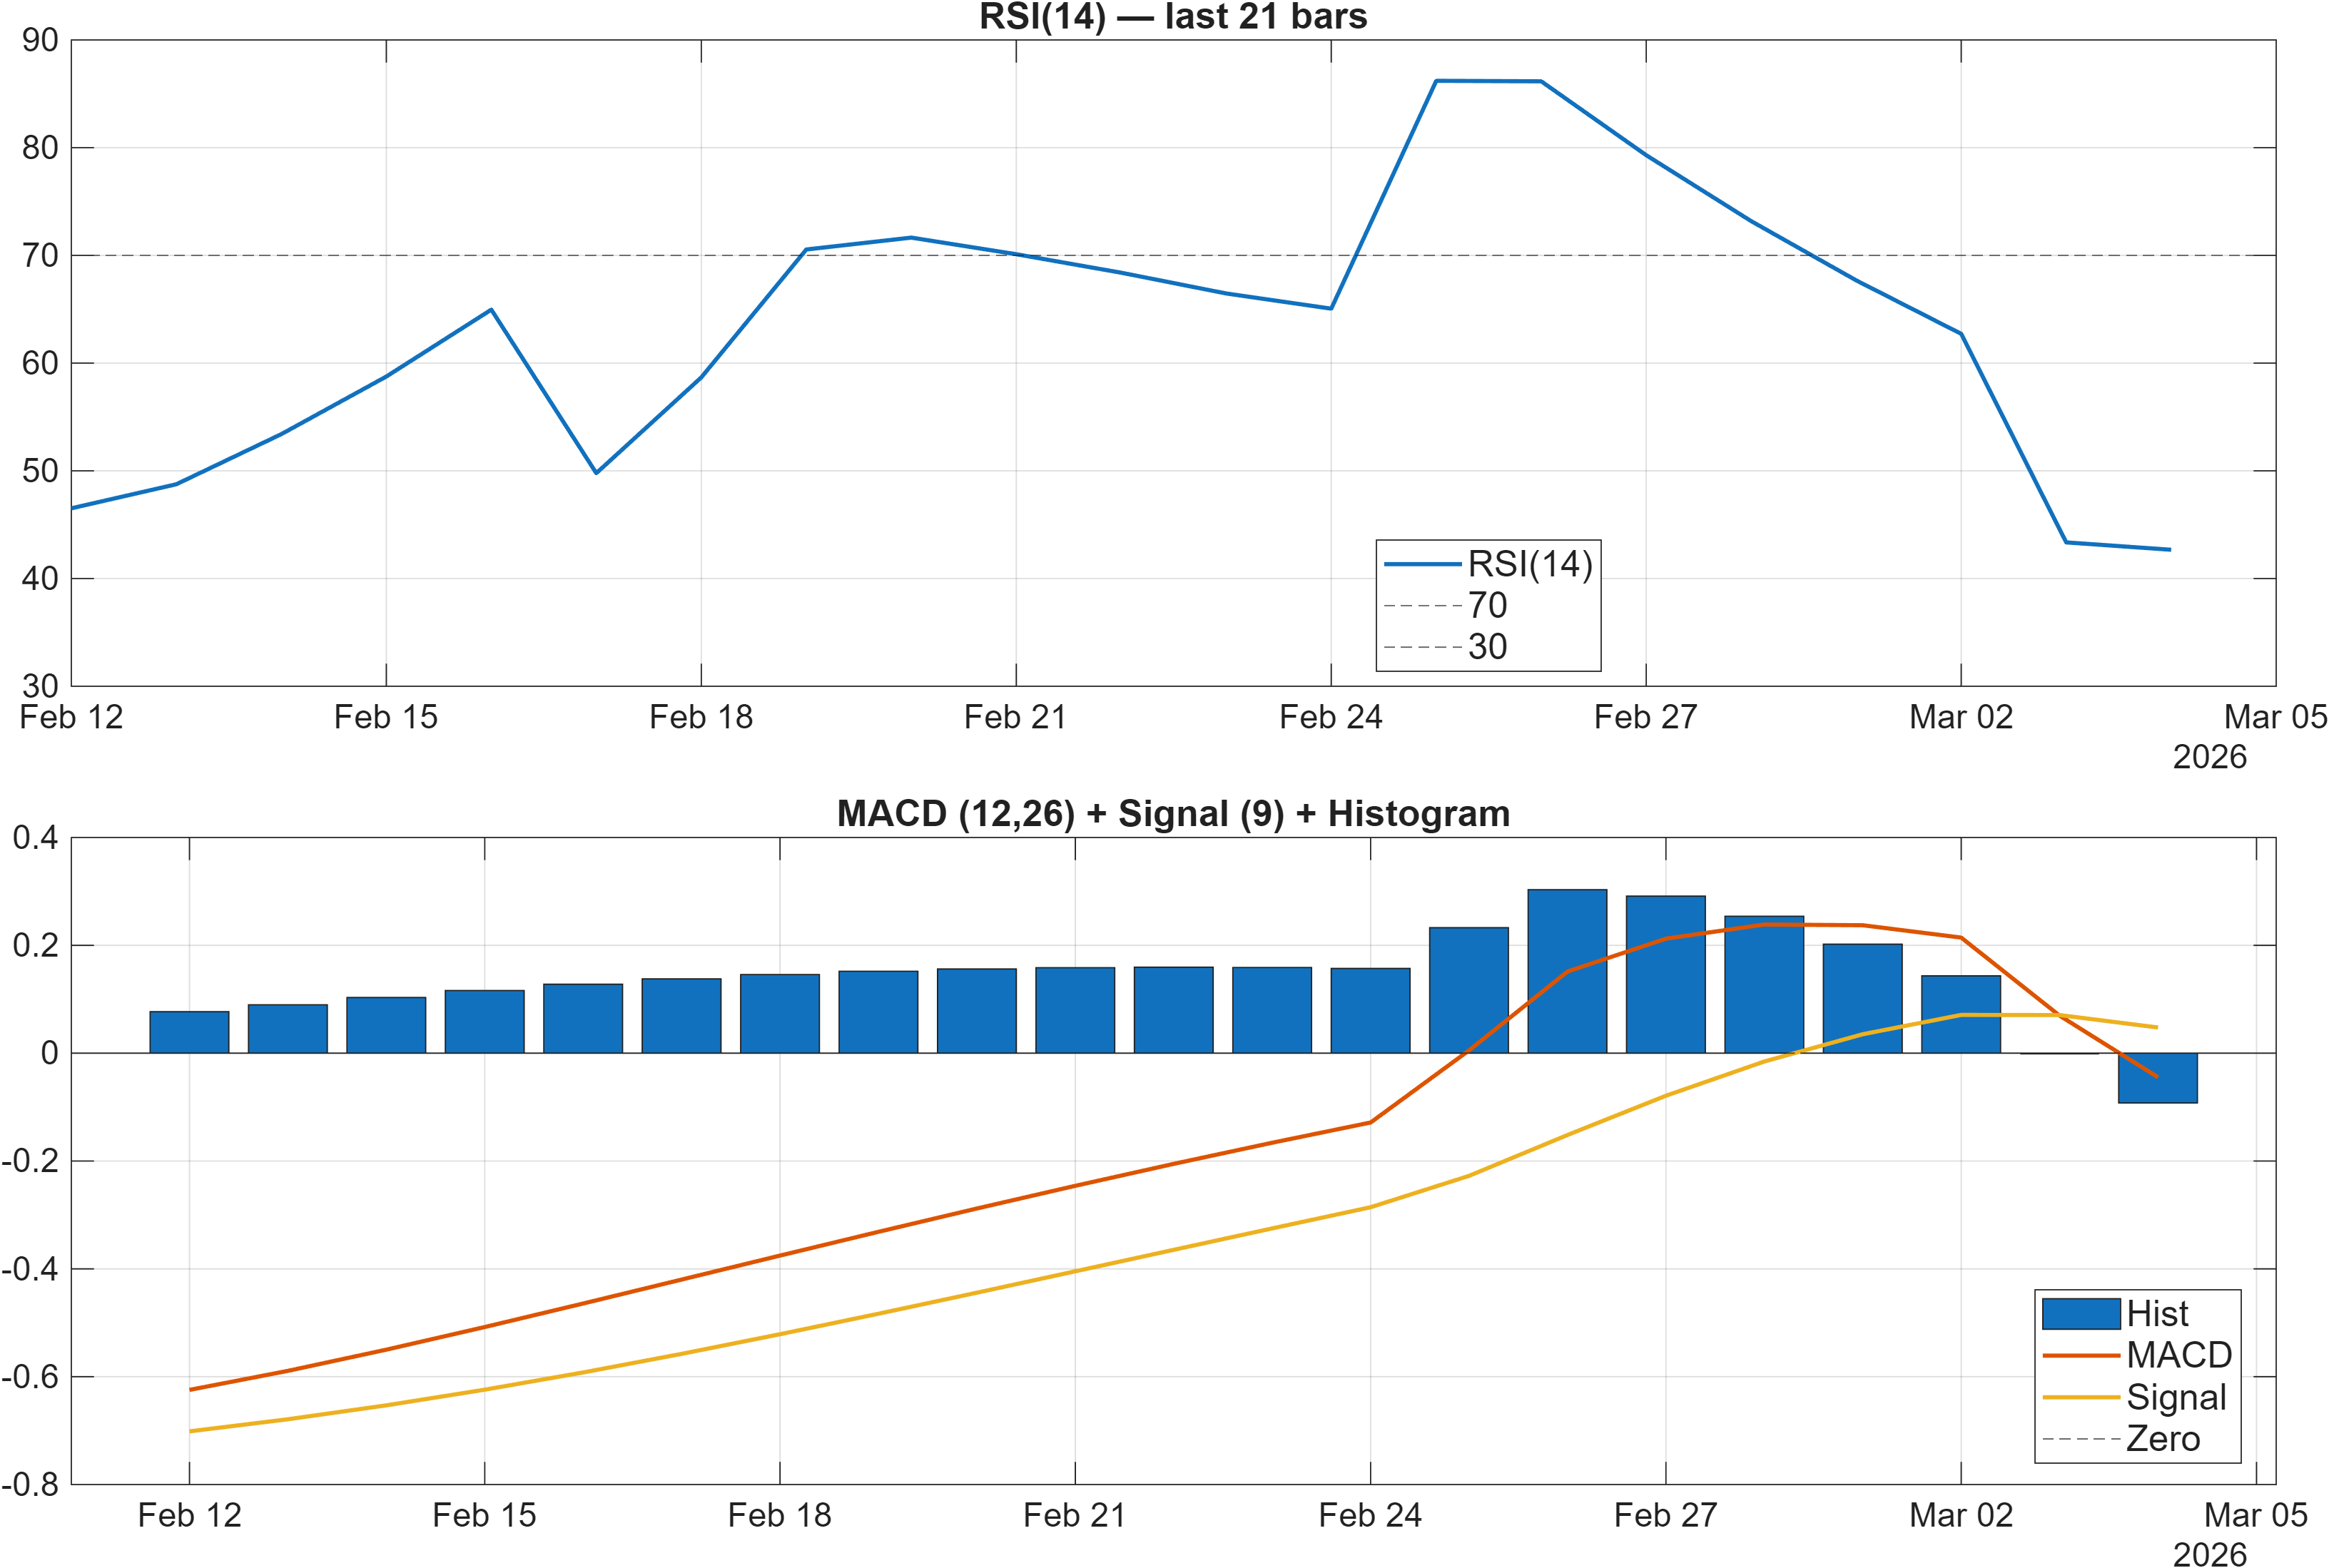
Interpretation: RSI bias = Neutral, MACD hist = -0.0923.
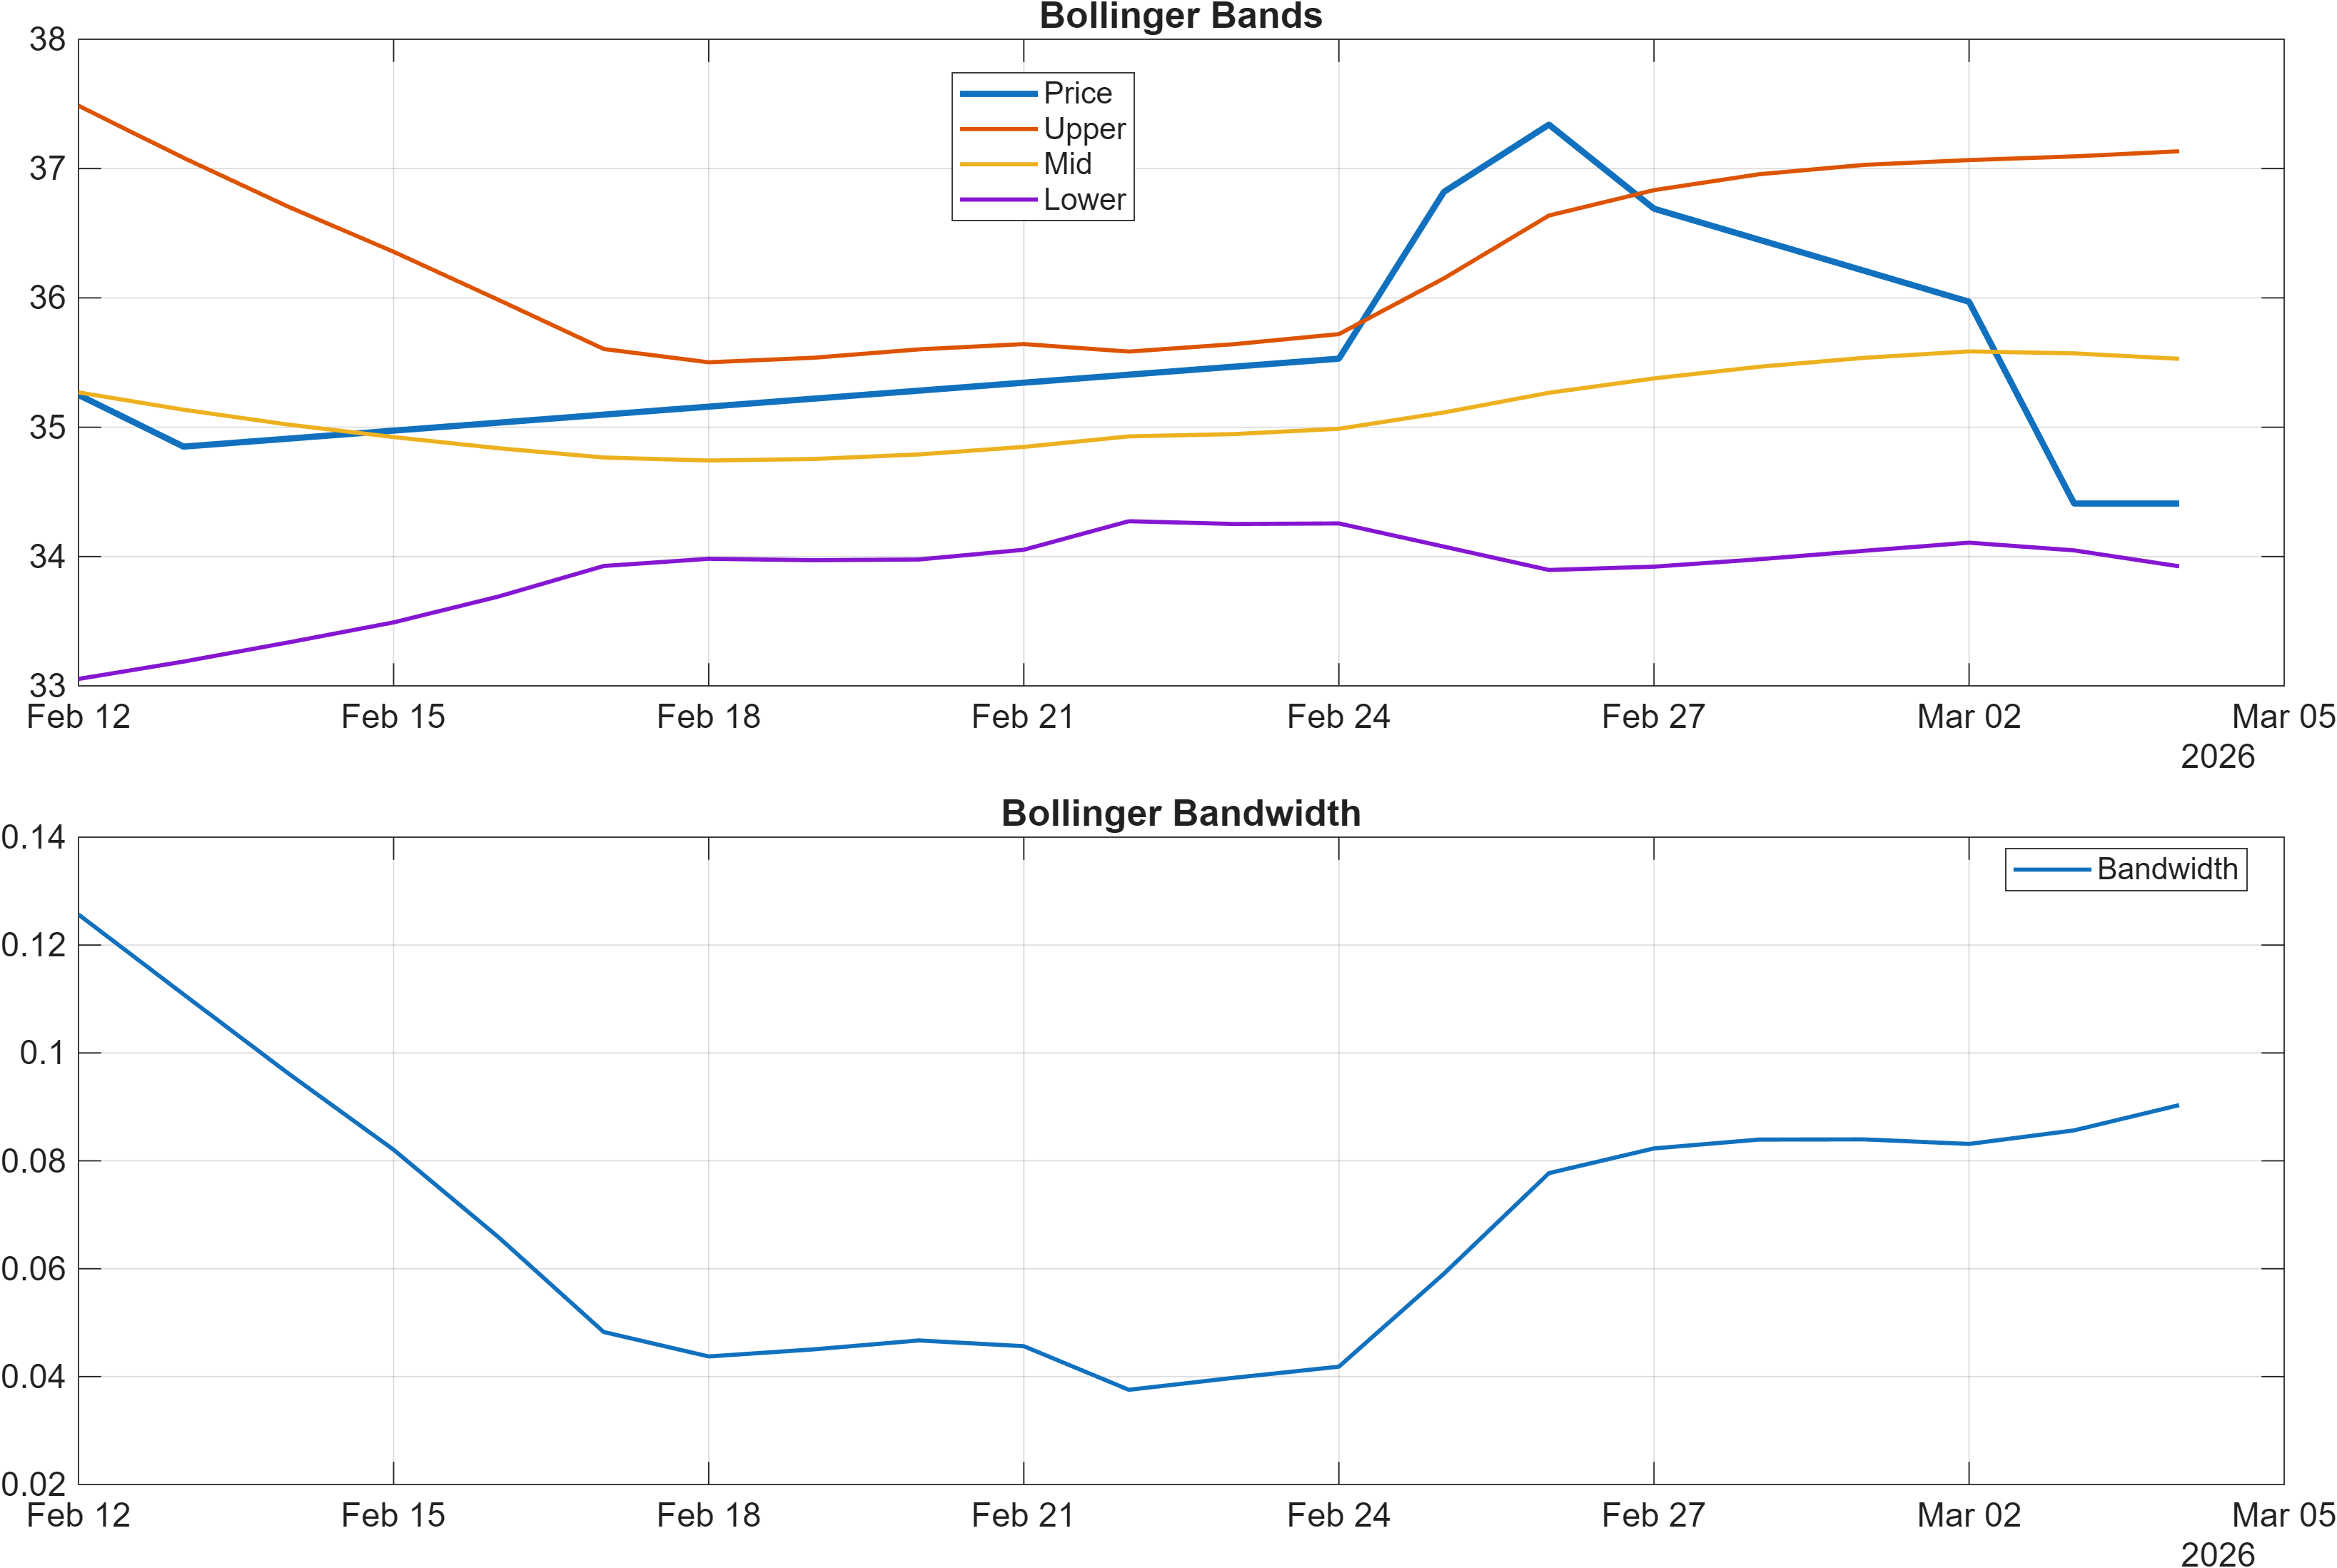
Interpretation: Bandwidth (volatility regime) latest = 0.0903.
Momentum divergence: neutral RSI vs negative MACD impulse
Momentum inputs are not fully synchronized. The dashboard labels RSI bias as Neutral, while the MACD histogram is -0.0923, pointing to negative impulse in the MACD complex even as RSI avoids a strongly oversold characterization. This split often appears in conditions where selling pressure is persistent but not accelerating enough to push oscillators into capitulation territory—consistent with a market that can drift lower or chop without triggering strong mean-reversion signals.
Signal-level detail reinforces this view: the table shows RSI(14) at 42.67 flagged bearish, while Stoch %K (0.6061) is bullish—another example of oscillators not moving in lockstep. When MACD remains negative and RSI hovers in the low-to-mid range, rallies can occur, but they tend to face re-selling unless trend conditions (Section 2) and participation signals improve simultaneously.
Volatility state: bandwidth suggests room for expansion
Volatility is measurable but not extreme. The Bollinger bandwidth at 0.0903 (also reflected as BB Width 0.09033 with a neutral label in the signal table) implies a regime where volatility could compress further or expand quickly if price challenges major levels. This matters because the nearest probabilistic zones are relatively well spaced (34.1667 to 39.9633), so a volatility expansion could translate into directional tests rather than minor oscillations.
In sum, the momentum/volatility dashboard reads as bearish impulse with incomplete exhaustion. That combination tends to reward discipline around confirmation: improving MACD dynamics and a sustained move away from the lower decision zone would be more informative than isolated oscillator rebounds.
4) Support / Resistance zones
Support ~ 34.1667 | Resistance ~ 39.9633
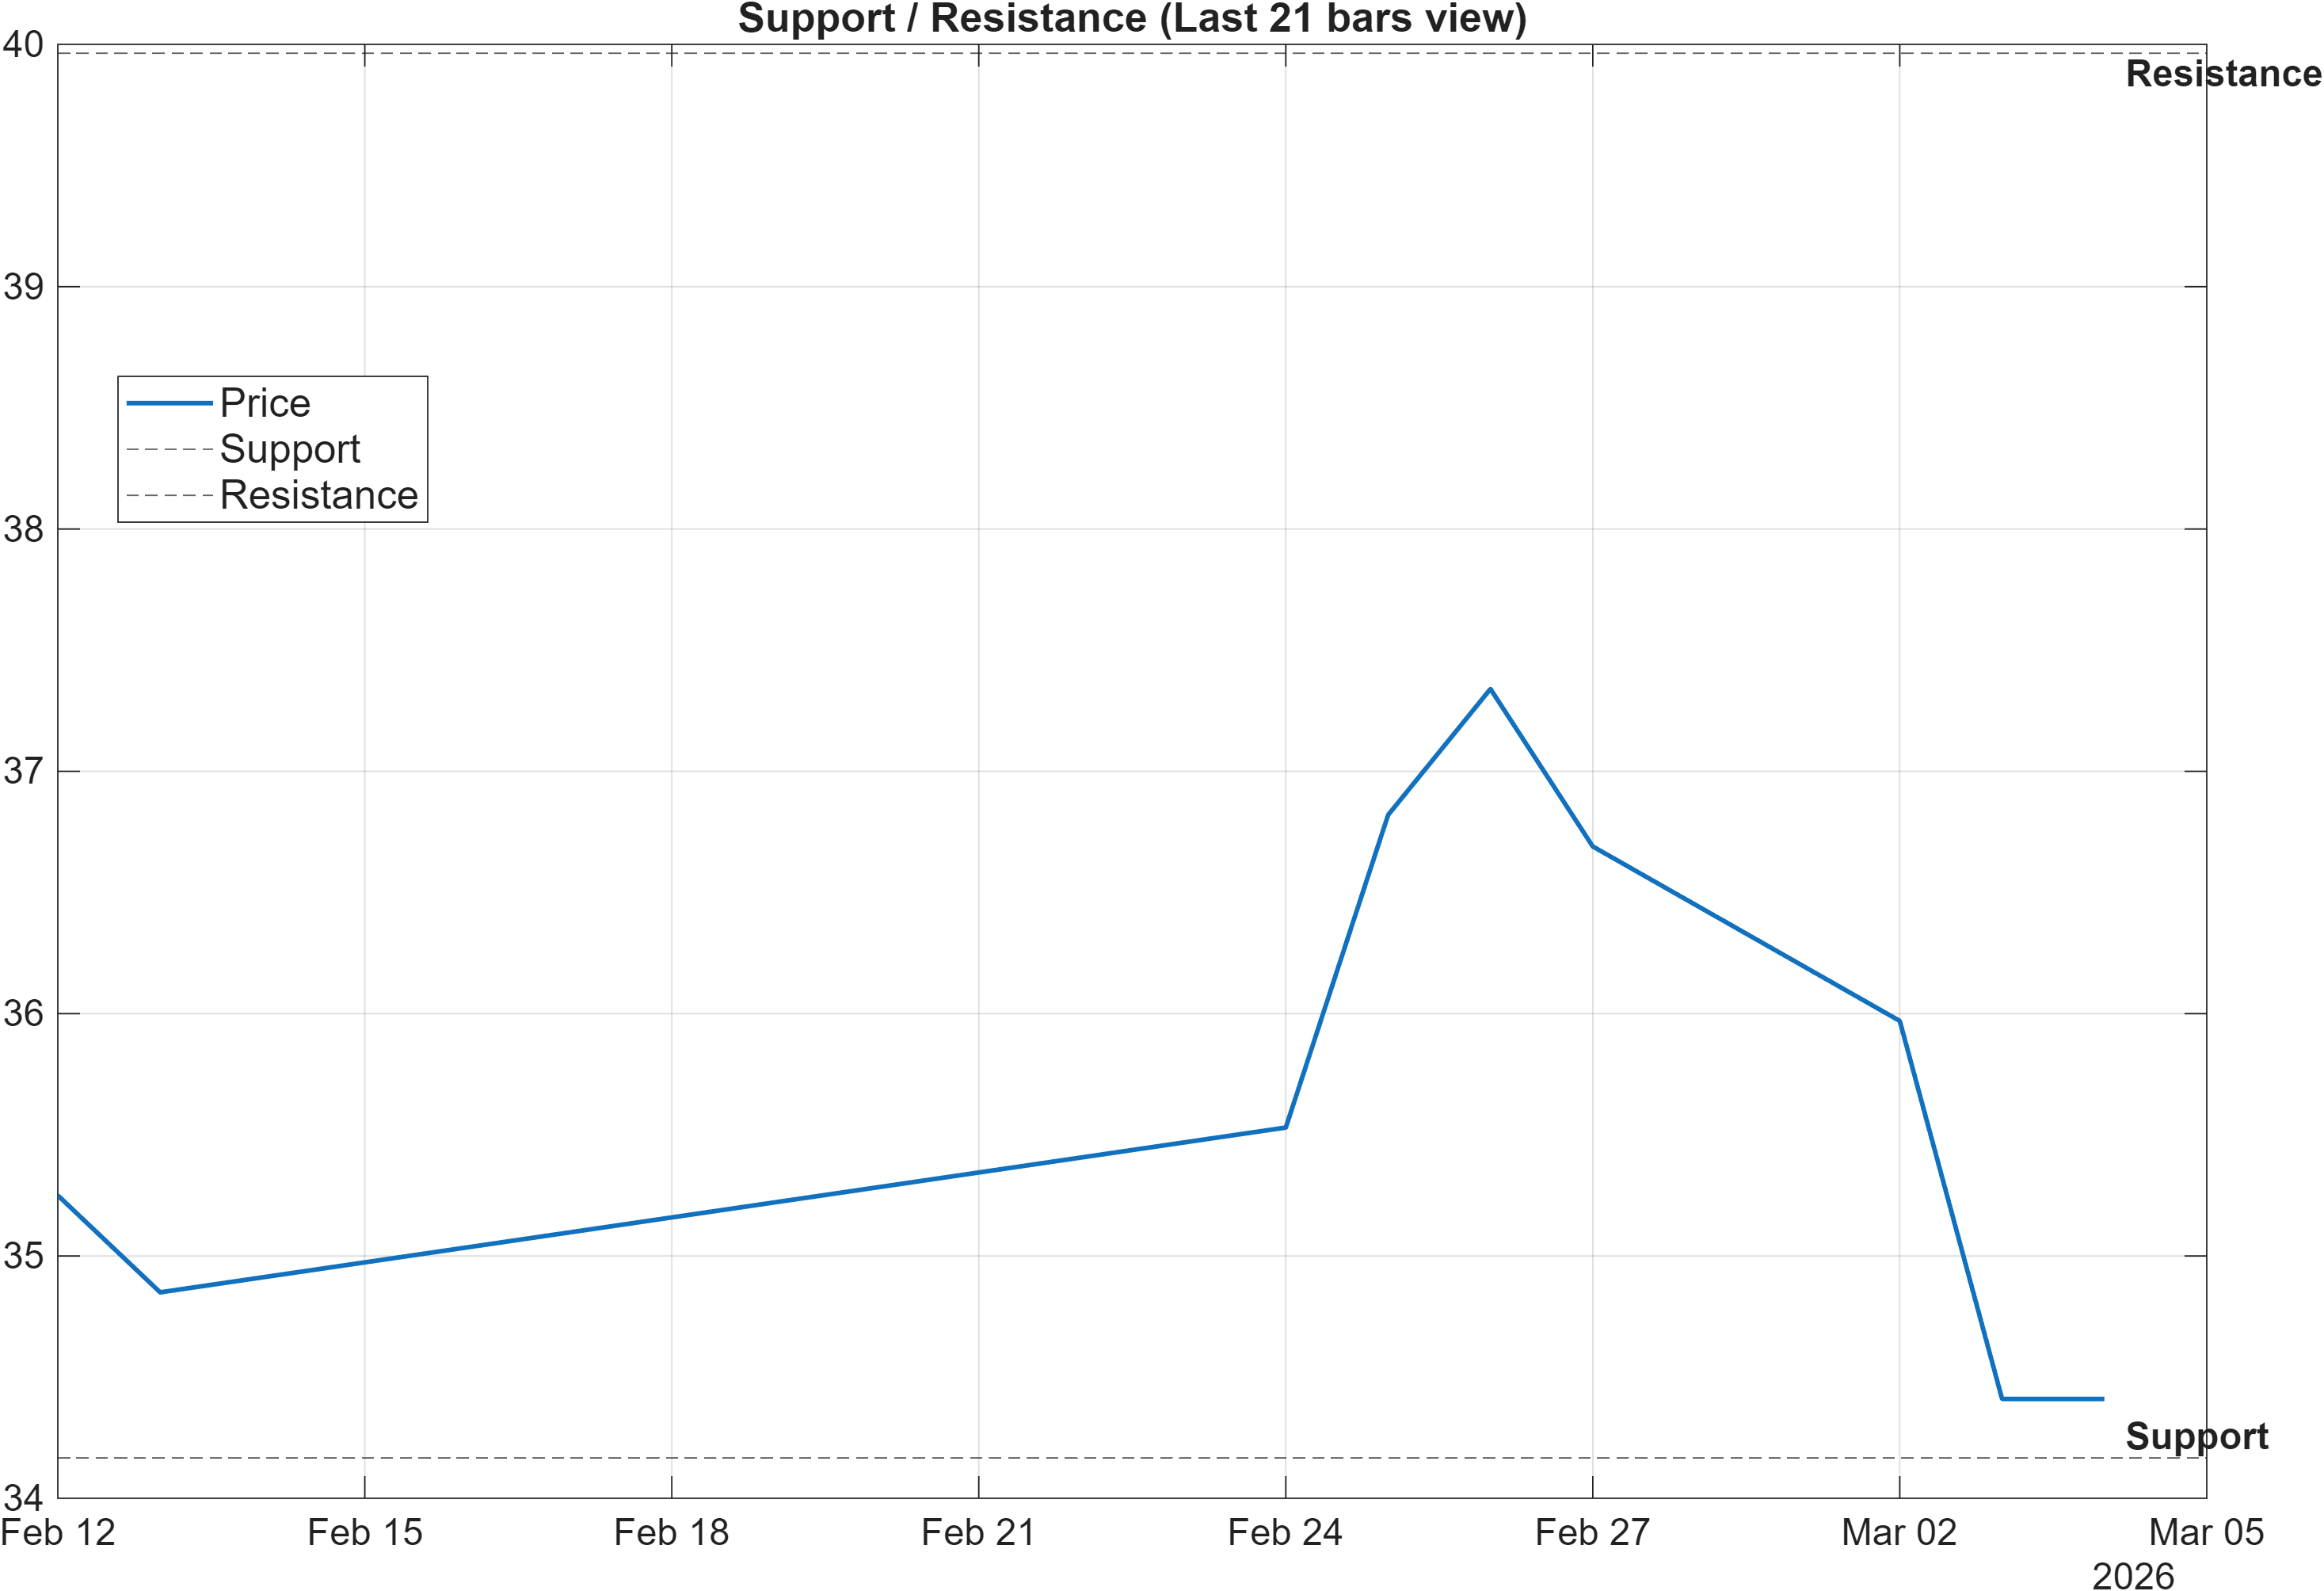
Scenario view: Break above resistance with volume → continuation. Close below support → signal deterioration risk.
Decision zones: mapping trend pressure into tradeable thresholds
The current map is clean: support ~34.1667 and resistance ~39.9633. With the broader trend stack bearish (close vs MA50 and MA50 vs MA200 both bearish), these levels function less as symmetry points and more as stress tests for whether downside pressure is stabilizing or intensifying.
Downside framing is straightforward: a close below 34.1667 is explicitly flagged as deterioration risk. That condition would also align with several already-weak participation and flow proxies in the signal table (e.g., negative slopes in OBV and AD Line), which collectively suggest that a break of support could occur without immediate internal confirmation of accumulation.
Upside framing requires more evidence. The scenario calls for a break above 39.9633 with volume to support continuation. This is consistent with the technical score context in Section 5: the blended view is -0.453 (Bearish), and the DRL technical rank is #1120—both implying that a simple touch of resistance is less informative than a volume-confirmed transition through it.
These zones also interface with the momentum mix in Section 3: with MACD histogram negative (-0.0923) and RSI bias neutral, tests of resistance without improving impulse can fail. Conversely, if volatility (bandwidth 0.0903) expands while price holds above support, the market may be shifting from drift to range resolution—making level behavior more important than indicator noise.
5) Quant Technical Dashboard (18 Signals)
KGNAI AI Technical Analysis Score (Deep Reinforcement Learning): Rank #1120 out of 1293 (Rank 1 represents the strongest technical positioning and a higher probability of favorable price behavior. As ranks increase toward the maximum, the probability of favorable outcomes weakens and bearish positioning becomes more dominant.) | Label: Bearish | Score: -0.732
18-Signal Technical Confluence Score: -0.333 (Bearish)
Overall Technical Score (18-signal confluence + DRL rank blend): -0.453 (Bearish)
Note: The blended score reflects signal strength weighted against broader AI technical ranking, which may temporarily diverge.
Blended technical score breakdown: -0.453 (Bearish | Bull 5 / Bear 11 / Neutral 2)
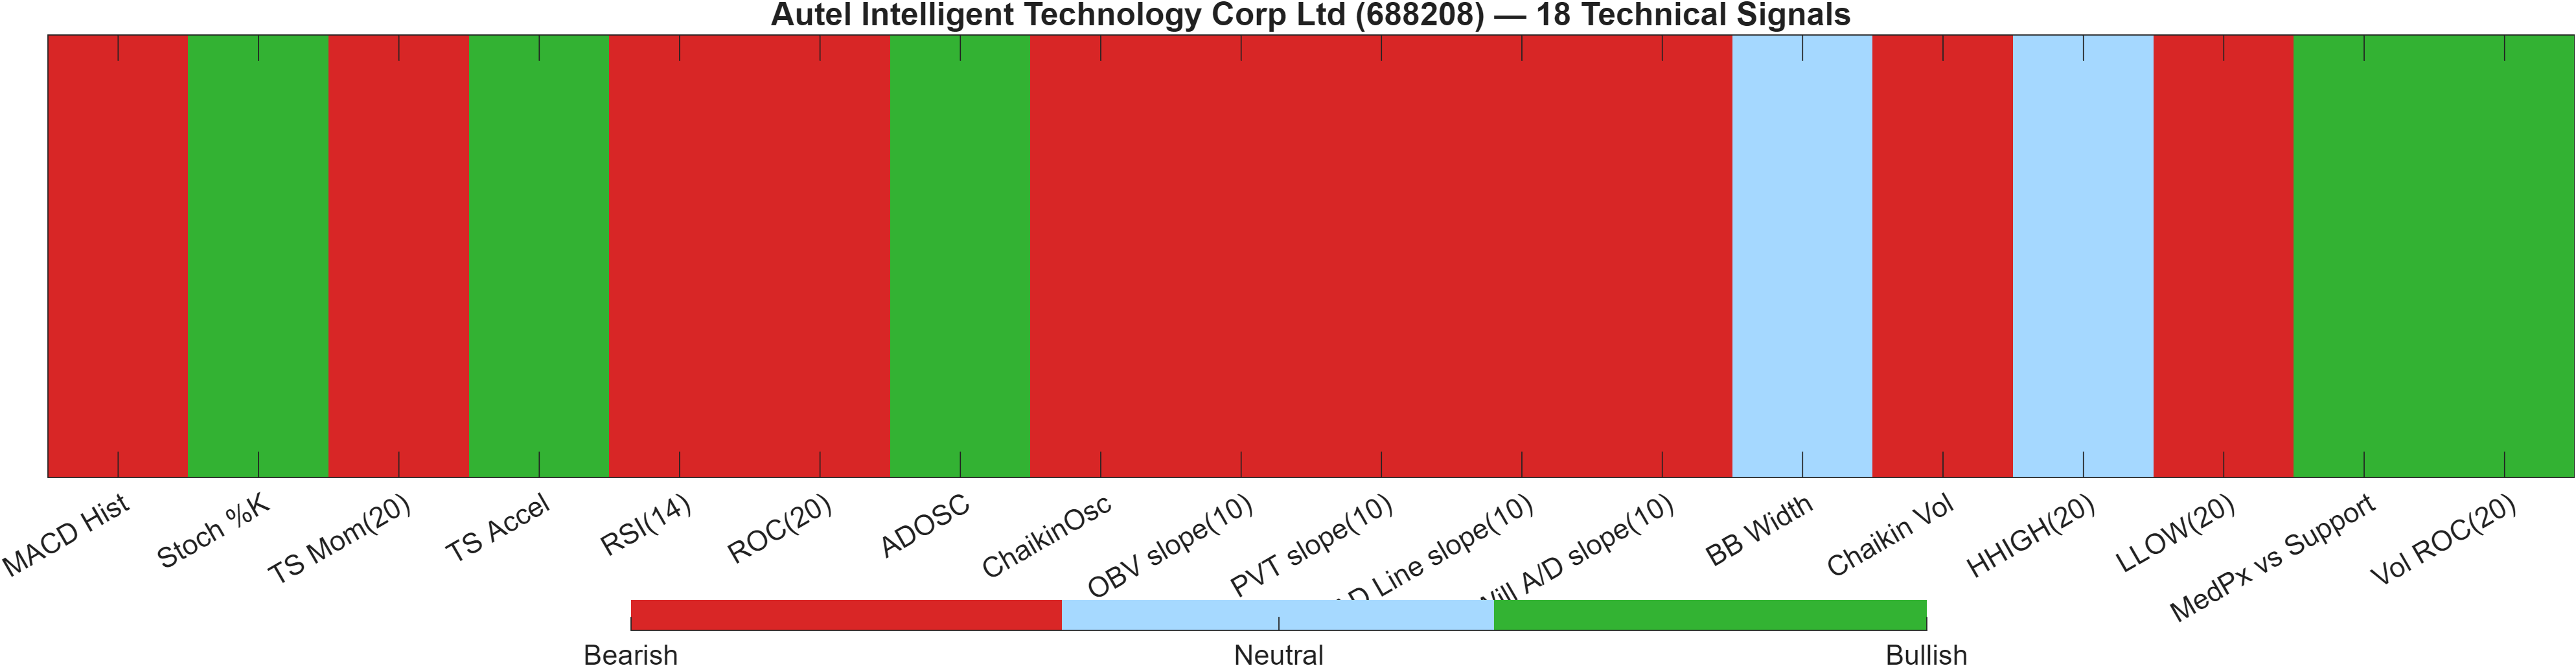
Signal balance: bearish majority with selective bullish pockets
The technical layer is decisively negative on aggregation. The 18-signal confluence score (-0.333) is bearish, and the overall blended technical score (-0.453) remains bearish after incorporating the separate DRL model. The DRL rank itself—#1120 out of 1293 with a -0.732 score—places the instrument in a weaker technical cohort, which typically implies that bullish setups require clearer confirmation than usual.
The most informative aspect is not any single indicator but the distribution: Bear 11 / Bull 5 / Neutral 2. That mix indicates that bullish signals exist but are not dominant enough to control the composite state. For example, some measures register bullish (e.g., Stoch %K 0.6061, TS Accel 1.927, ADOSC 7.583, and Vol ROC(20) 125.8), suggesting episodic participation bursts or short-cycle rebounds can occur. However, multiple momentum and flow proxies lean bearish, including MACD Hist -0.09231 and TS Mom(20) -0.44, alongside negative slopes in volume-derived measures.
Compression vs confirmation: why the blend matters
The note that the blended score can “temporarily diverge” is material here: a market can show short-lived improvements in a subset of indicators while the broader AI technical rank remains weak. This is consistent with the current configuration—bullish pockets coexist with a weak DRL cohort classification. In that setting, level-based confirmation (Section 4: 39.9633) tends to carry more weight than oscillator flickers.
Signal table (Bull/Bear/Neutral)
| Indicator | Value | Signal |
|---|---|---|
| MACD Hist | -0.09231 | Bearish |
| Stoch %K | 0.6061 | Bullish |
| TS Mom(20) | -0.44 | Bearish |
| TS Accel | 1.927 | Bullish |
| RSI(14) | 42.67 | Bearish |
| ROC(20) | -1.263 | Bearish |
| ADOSC | 7.583 | Bullish |
| ChaikinOsc | -1.676e+07 | Bearish |
| OBV slope(10) | -6.616e+06 | Bearish |
| PVT slope(10) | -2.172e+05 | Bearish |
| AD Line slope(10) | -3.249e+07 | Bearish |
| Will A/D slope(10) | -0.9009 | Bearish |
| BB Width | 0.09033 | Neutral |
| Chaikin Vol | 47.8 | Bearish |
| HHIGH(20) | 37.69 | Neutral |
| LLOW(20) | 34.39 | Bearish |
| MedPx vs Support | 1.278 | Bullish |
| Vol ROC(20) | 125.8 | Bullish |
Interpretation: Indicator-level signals form the base confluence, which is then adjusted using a separate AI-driven technical ranking model. The final technical score summarizes this combined view.
6) News sentiment + extractive gist
Note: Instrument-specific news matches were not found, so the digest includes broader market/sector headlines. Links are provided for verification.
Sentiment score (avg): 0.013 | Positive: 19% | Neutral: 69% | Negative: 12%
KGNAI AI News Sentiment Score (normalized -1 to +1): Not available (as of —) | Label: Not available | Overall news score: 0.01
Positive Developments
Recent coverage across major financial outlets indicates a mildly constructive backdrop, though not directly company-specific. A portion of the news flow points to ongoing policy and technology discussion in China, including attention on high-tech priorities and competitive positioning—context that can support selective risk appetite even when single-name technicals are weak. The sentiment distribution remains skewed toward neutral (69%), but the positive share (19%) and slightly positive average score (0.013) suggest the informational environment is not broadly risk-off. For 688208, that matters mainly as a potential catalyst amplifier: if price action begins to stabilize above key levels, a neutral-to-slightly-positive news tone can help sustain follow-through rather than fade quickly. However, because the digest is sector/macro-oriented and not instrument-matched, the positive component should be treated as contextual rather than explanatory for current chart behavior.
Neutral / Mixed Developments
The dominant signal remains informational rather than directional. Broad coverage includes geopolitical and trade-related developments that can shift cross-asset volatility without mapping cleanly to individual equities. This “headline density” often produces short bursts of correlation across risk assets, while leaving underlying single-name trend structure unchanged. The lack of instrument-specific matches also limits the usefulness of attributing near-term price moves to discrete narratives; in this case, the chart-based framework (bearish moving-average stack; MACD histogram -0.0923) remains the higher-weight input. With the overall news score at 0.01 and the normalized KGNAI news sentiment score listed as Not available, the news layer should be used primarily to gauge background risk conditions rather than to infer direction for 688208.
Negative / Risk Signals
Risk-oriented items in the broader feed highlight macro uncertainty channels—such as potential shifts in rate expectations and evolving competitive pressure in AI-related ecosystems—that can tighten financial conditions or increase dispersion across technology-linked names. Even when the negative share is relatively contained (12%), risk narratives can matter more during bearish technical regimes because they tend to accelerate downside moves while offering limited support to rebounds. For 688208, the key risk is not that sentiment is sharply negative (it is not), but that technical fragility (overall technical score -0.453; DRL technical rank #1120) leaves the instrument more sensitive to volatility spikes. In that setting, adverse macro headlines can act as the trigger for a support test near 34.1667 even if the average sentiment reading stays near neutral.
- Whether volatility expands from bandwidth 0.0903 while price approaches 34.1667 or 39.9633.
- Whether momentum confirms: improvement in MACD dynamics from -0.0923 alongside RSI behavior.
- Whether rank pressure eases: weekly rank (#1155) stabilizing versus further deterioration.
Snapshot: AI Rank (Short–Mid–Long): Mixed (Bearish–Neutral–Neutral) · Technical Confluence: Bearish · Key Levels: Support ~34.17 | Resistance ~39.96 · News Sentiment: Neutral
Sources referenced: Reuters, Bloomberg, Yahoo Finance, MarketWatch, Investing.com
7) Sources
- US and China trade chiefs to meet mid-March before Trump-Xi summit — https://www.scmp.com/news/china/diplomacy/article/3345326/us-and-china-trade-chiefs-meet-mid-march-trump-xi-summit?utm_source=rss_feed
- China urges Israel to end war in Iran as regional tensions escalate — https://www.scmp.com/news/china/diplomacy/article/3345325/china-urges-israel-end-war-iran-regional-tensions-escalate?utm_source=rss_feed
- Iran will not ‘automatically’ fall after Khamenei’s death, shah’s widow says — https://www.scmp.com/news/world/middle-east/article/3345324/iran-will-not-automatically-fall-after-khameneis-death-shahs-widow-says?utm_source=rss_feed
- Dad who gave gun to US school shooting suspect found guilty of second-degree murder — https://www.scmp.com/news/world/united-states-canada/article/3345323/dad-who-gave-gun-us-school-shooting-suspect-found-guilty-second-degree-murder?utm_source=rss_feed
- More than 1 million Philippine overseas workers at risk amid Middle East crisis — https://www.scmp.com/news/asia/southeast-asia/article/3345322/more-1-million-philippine-overseas-workers-risk-amid-middle-east-crisis?utm_source=rss_feed
- Hong Kong court convicts British woman of blackmailing banker over false rape claim — https://www.scmp.com/news/hong-kong/law-and-crime/article/3345316/hong-kong-court-convicts-british-woman-blackmailing-banker-over-false-rape-claim?utm_source=rss_feed
- Global sell-off in stocks slams Wall Street as oil prices leap even higher on war woes — https://www.scmp.com/news/world/united-states-canada/article/3345318/global-sell-stocks-slams-wall-street-oil-prices-leap-even-higher-war-woes?utm_source=rss_feed
- How will China adjust Israel ties as US-led strikes on Iran reshape Middle East? — https://www.scmp.com/news/china/diplomacy/article/3345308/how-will-china-adjust-israel-ties-us-led-strikes-iran-reshape-middle-east?utm_source=rss_feed
You may also like: How KGNAI AI ranks instruments across global markets
Disclaimer: KGNAI provides AI-generated analytics and educational market commentary only. This is not financial advice. Markets involve risk. Always do your own research.