
600887 — Inner Mongolia Yili Industrial Group Co Ltd (24-May-2026) | Mid/Long ranks constructive, technicals still pressured
AI-Based Technical, Rank & Sentiment Analysis
Inner Mongolia Yili Industrial Group Co Ltd (600887) enters this snapshot with a notable split between cross-horizon KGNAI ranks and the near-term technical tape. The daily rank sits at #759 (neutral), while the weekly and monthly ranks improve materially to #148 and #61, respectively—placing the mid-term profile in the upper quartile of the 1292-instrument universe. That said, the technical layer remains heavy: the 18-signal confluence is -0.556 and the blended technical score is -0.629, supported by a DRL technical rank of #1164. Momentum indicators also skew weak (e.g., MACD histogram -0.2329 and RSI(14) 8.824), while volatility appears contained with Bollinger bandwidth near 0.0848. The decision framework centers on support ~25.2300 versus resistance ~27.9800, with news sentiment readings modestly positive in score terms but largely neutral in composition.
- Rank stance: Short-term Neutral (Daily #759); Mid-term Bullish (Weekly #148 / Monthly #61); Long-term Bullish (3M #22 / 6M #16 / Yearly #85).
- Technical confluence: Bearish (18-signal -0.556; blended -0.629; DRL rank #1164).
- Key levels: Support ~ 25.2300 | Resistance ~ 27.9800.
- News sentiment bias: Slightly positive score skew (avg 0.013; normalized 0.99) with predominantly neutral classification (Neutral 81%).
- Confirmation / invalidation: A break above 27.9800 with volume supports continuation; a close below 25.2300 increases deterioration risk per the scenario framework.
KGNAI evaluates assets using large cross-sectional datasets built from millions of structured data points. Inputs incorporate fundamental metrics, technical structures, and systematically processed news sentiment. Statistical models, machine learning, and AI frameworks are used to assess relative positioning, signal alignment, and probabilistic behavior across broad universes.
- Ranks are comparative across the tracked universe, not absolute price targets.
- Confluence reflects alignment among independent signal groups.
- Support/resistance levels are probabilistic decision zones, not guarantees.
- Sentiment provides contextual bias within the broader analytical framework.
1) KGNAI AI Analysis
Region: CHINA
Total universe size: 1292 ranked instruments
- Daily rank: #759 out of 1292 — Neutral
- Weekly rank: #148 out of 1292 — Bullish
- Monthly rank: #61 out of 1292 — Bullish
- 3-Monthly rank: #22 out of 1292 — Bullish
- 6-Monthly rank: #16 out of 1292 — Bullish
- Yearly rank: #85 out of 1292 — Bullish
The rank curve for 600887 is constructive beyond the immediate horizon but not yet confirmed by near-term behavior. The daily placement at #759 sits in the lower half of the universe, consistent with a market that is not rewarding the latest short-window setup. By contrast, the weekly #148 and monthly #61 move into the upper quartile, implying the intermediate regime remains comparatively resilient versus peers.
The persistence is more visible further out: 3-month #22 and 6-month #16 place the instrument near the top-decile boundary, suggesting that—despite current technical stress—its broader cross-sectional profile has remained competitive. The yearly rank at #85 reinforces that the longer-cycle posture has not collapsed into a structurally weak cohort.
This specific configuration often reflects a timing mismatch: longer-window factors remain supportive while shorter-window price/flow signals lag. In practice, it raises the bar for immediate follow-through and increases reliance on level-based confirmation (notably the 25.2300 / 27.9800 framework later in the report).
Term view: Short-term: Neutral. Mid-term: Bullish. Long-term: Bullish.
KGNAI ranks each instrument across large universes using multiple proprietary AI tests and statistical models (millions of data points). Lower ranks generally indicate stronger probability of favorable performance behavior, while higher ranks indicate weaker probability and more bearish positioning.
2) Price & trend overview
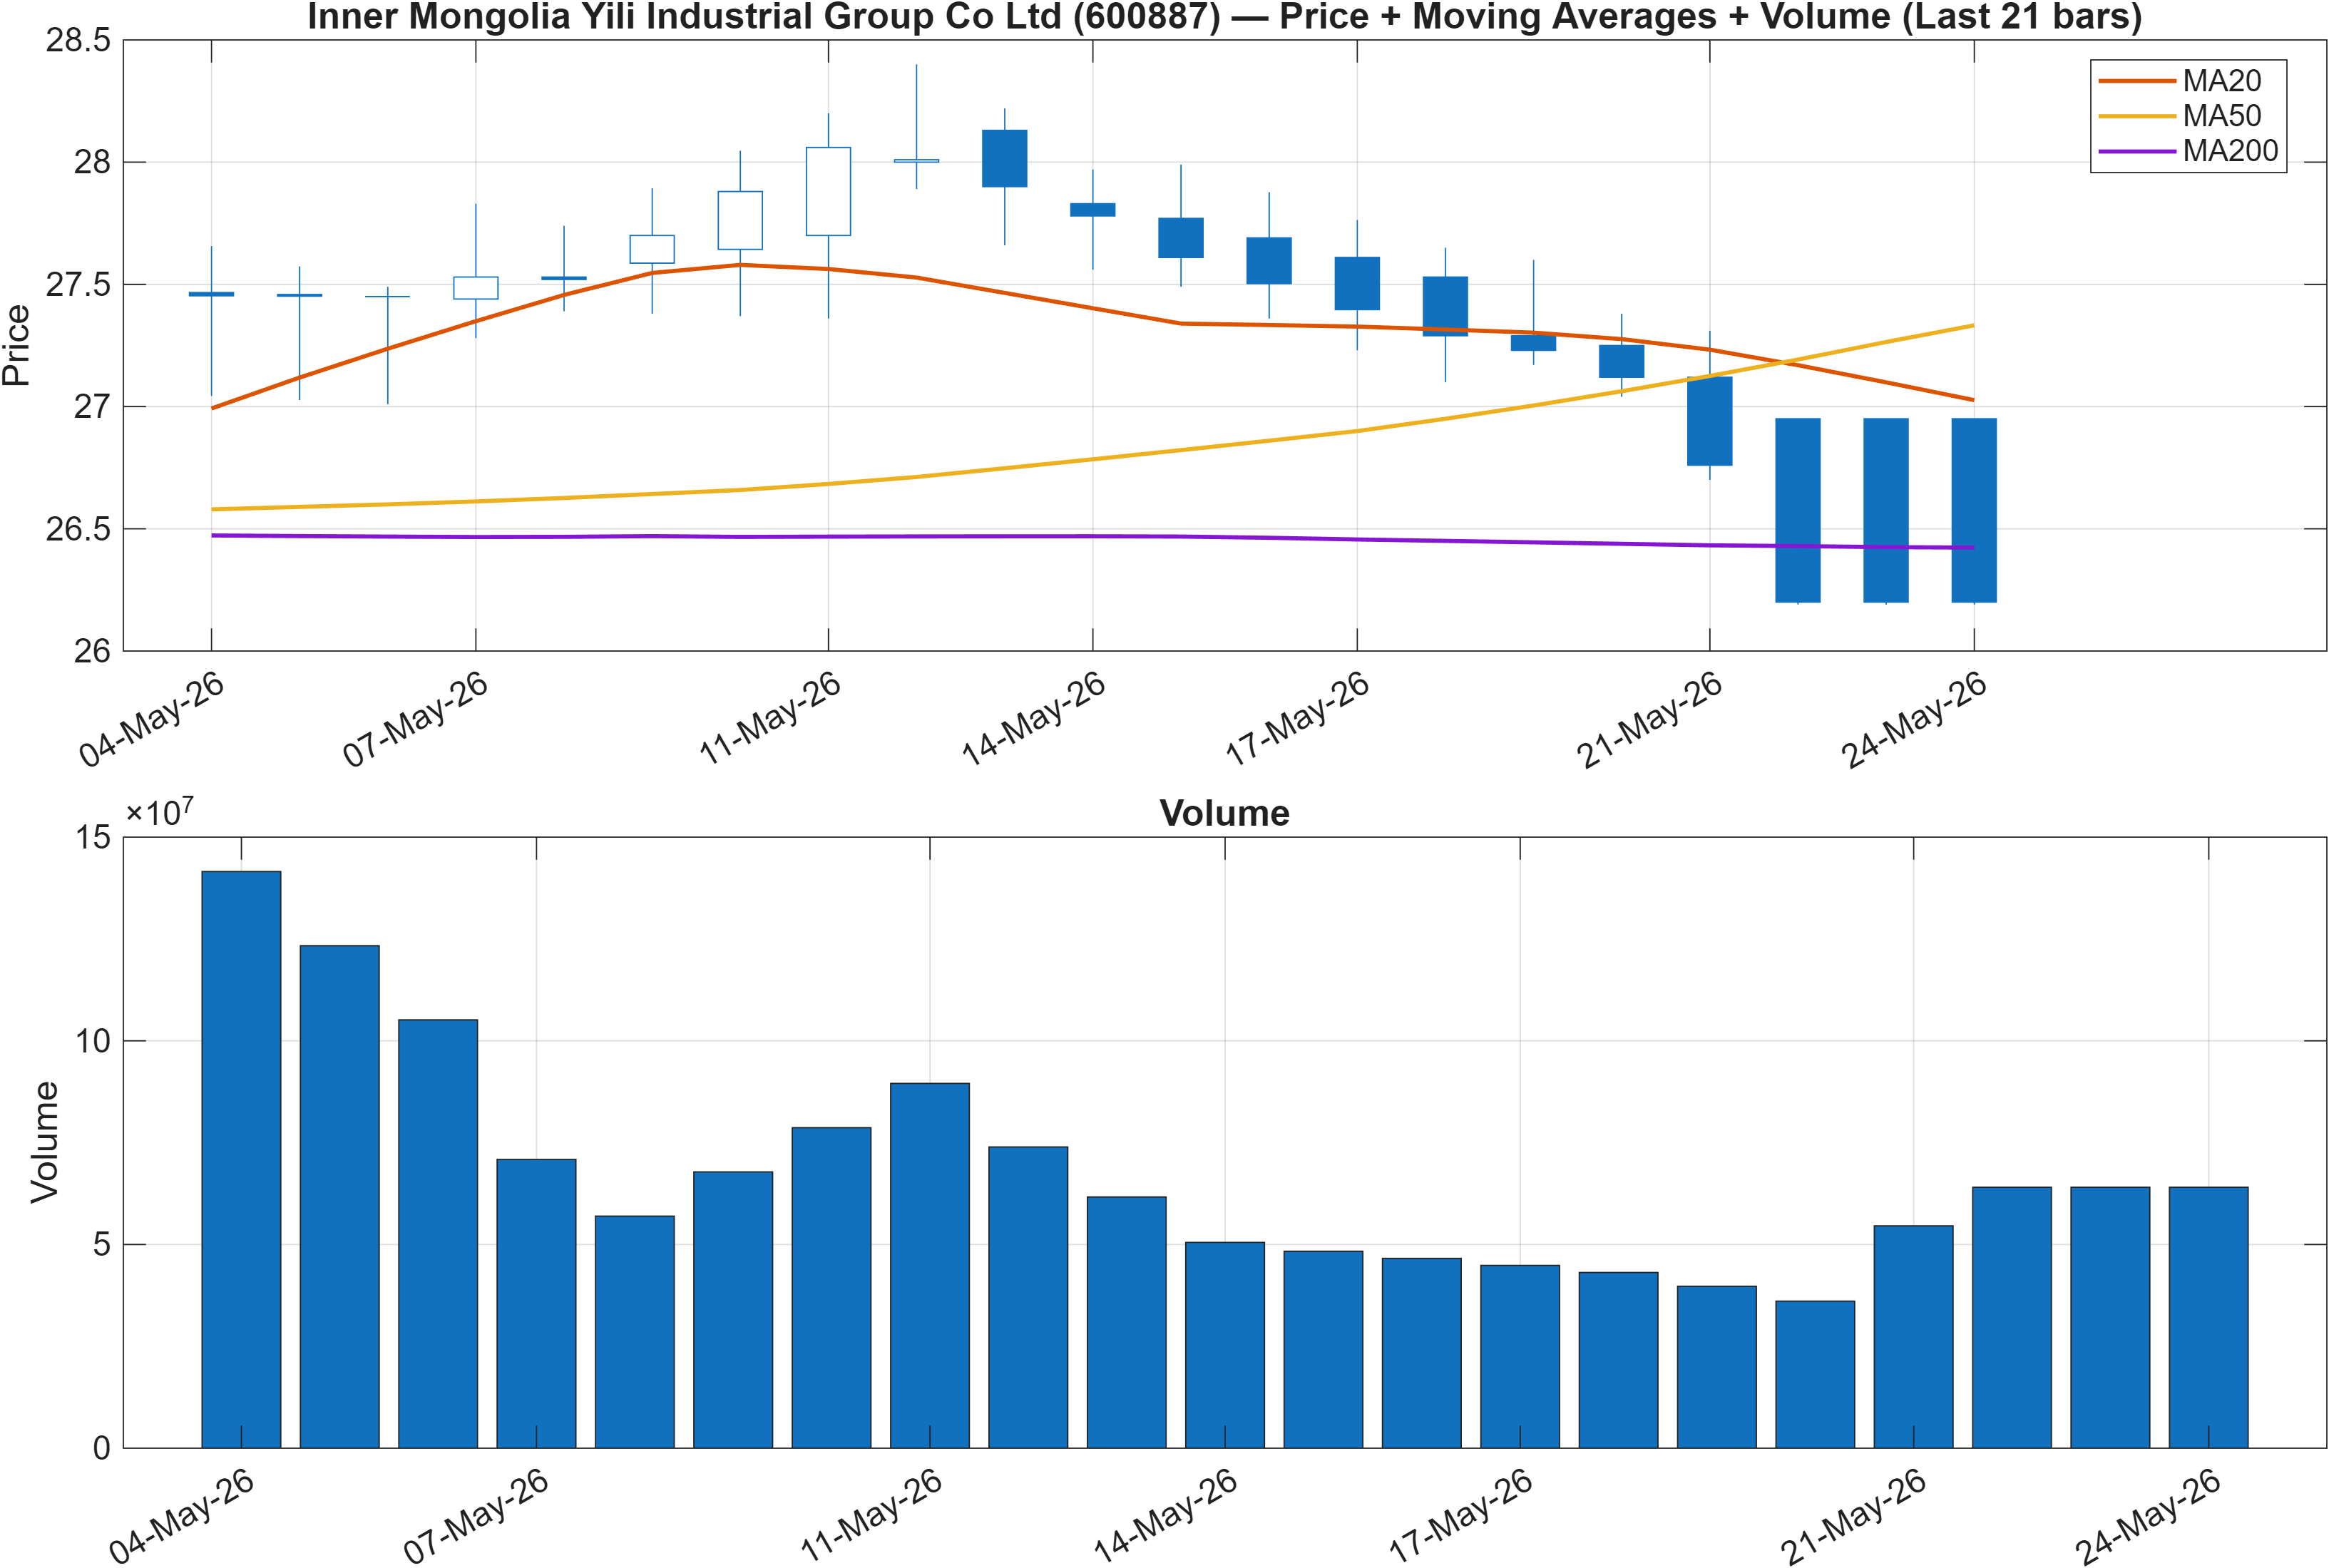
The trend read is internally mixed, with the short window leaning weaker while the longer window remains constructive. The interpretation states Close vs MA50 = Bearish, which typically implies recent price is trading below a key intermediate moving average and that pullbacks have not yet been fully absorbed. At the same time, MA50 vs MA200 = Bullish indicates the broader moving-average structure has not flipped into a longer-cycle downtrend.
This is a classic regime transition risk zone: price can be temporarily soft within an otherwise positive longer-horizon structure, but if the weakness persists, it can pressure the MA50 and eventually threaten the MA50/MA200 relationship. That makes the next phase less about forecasting and more about monitoring whether the instrument can reassert itself above the MA50 while maintaining the longer-run slope relationship.
The rank profile aligns with this nuance: intermediate-to-long ranks are strong (e.g., #61 monthly, #22 3-month, #16 6-month) even as the daily rank (#759) is non-committal. When ranks and moving-average structure disagree across horizons, the trade-off is typically between patience (waiting for trend repair) and risk control (respecting nearby failure points).
Interpretation: Close vs MA50 = Bearish, MA50 vs MA200 = Bullish.
3) Momentum & volatility dashboard
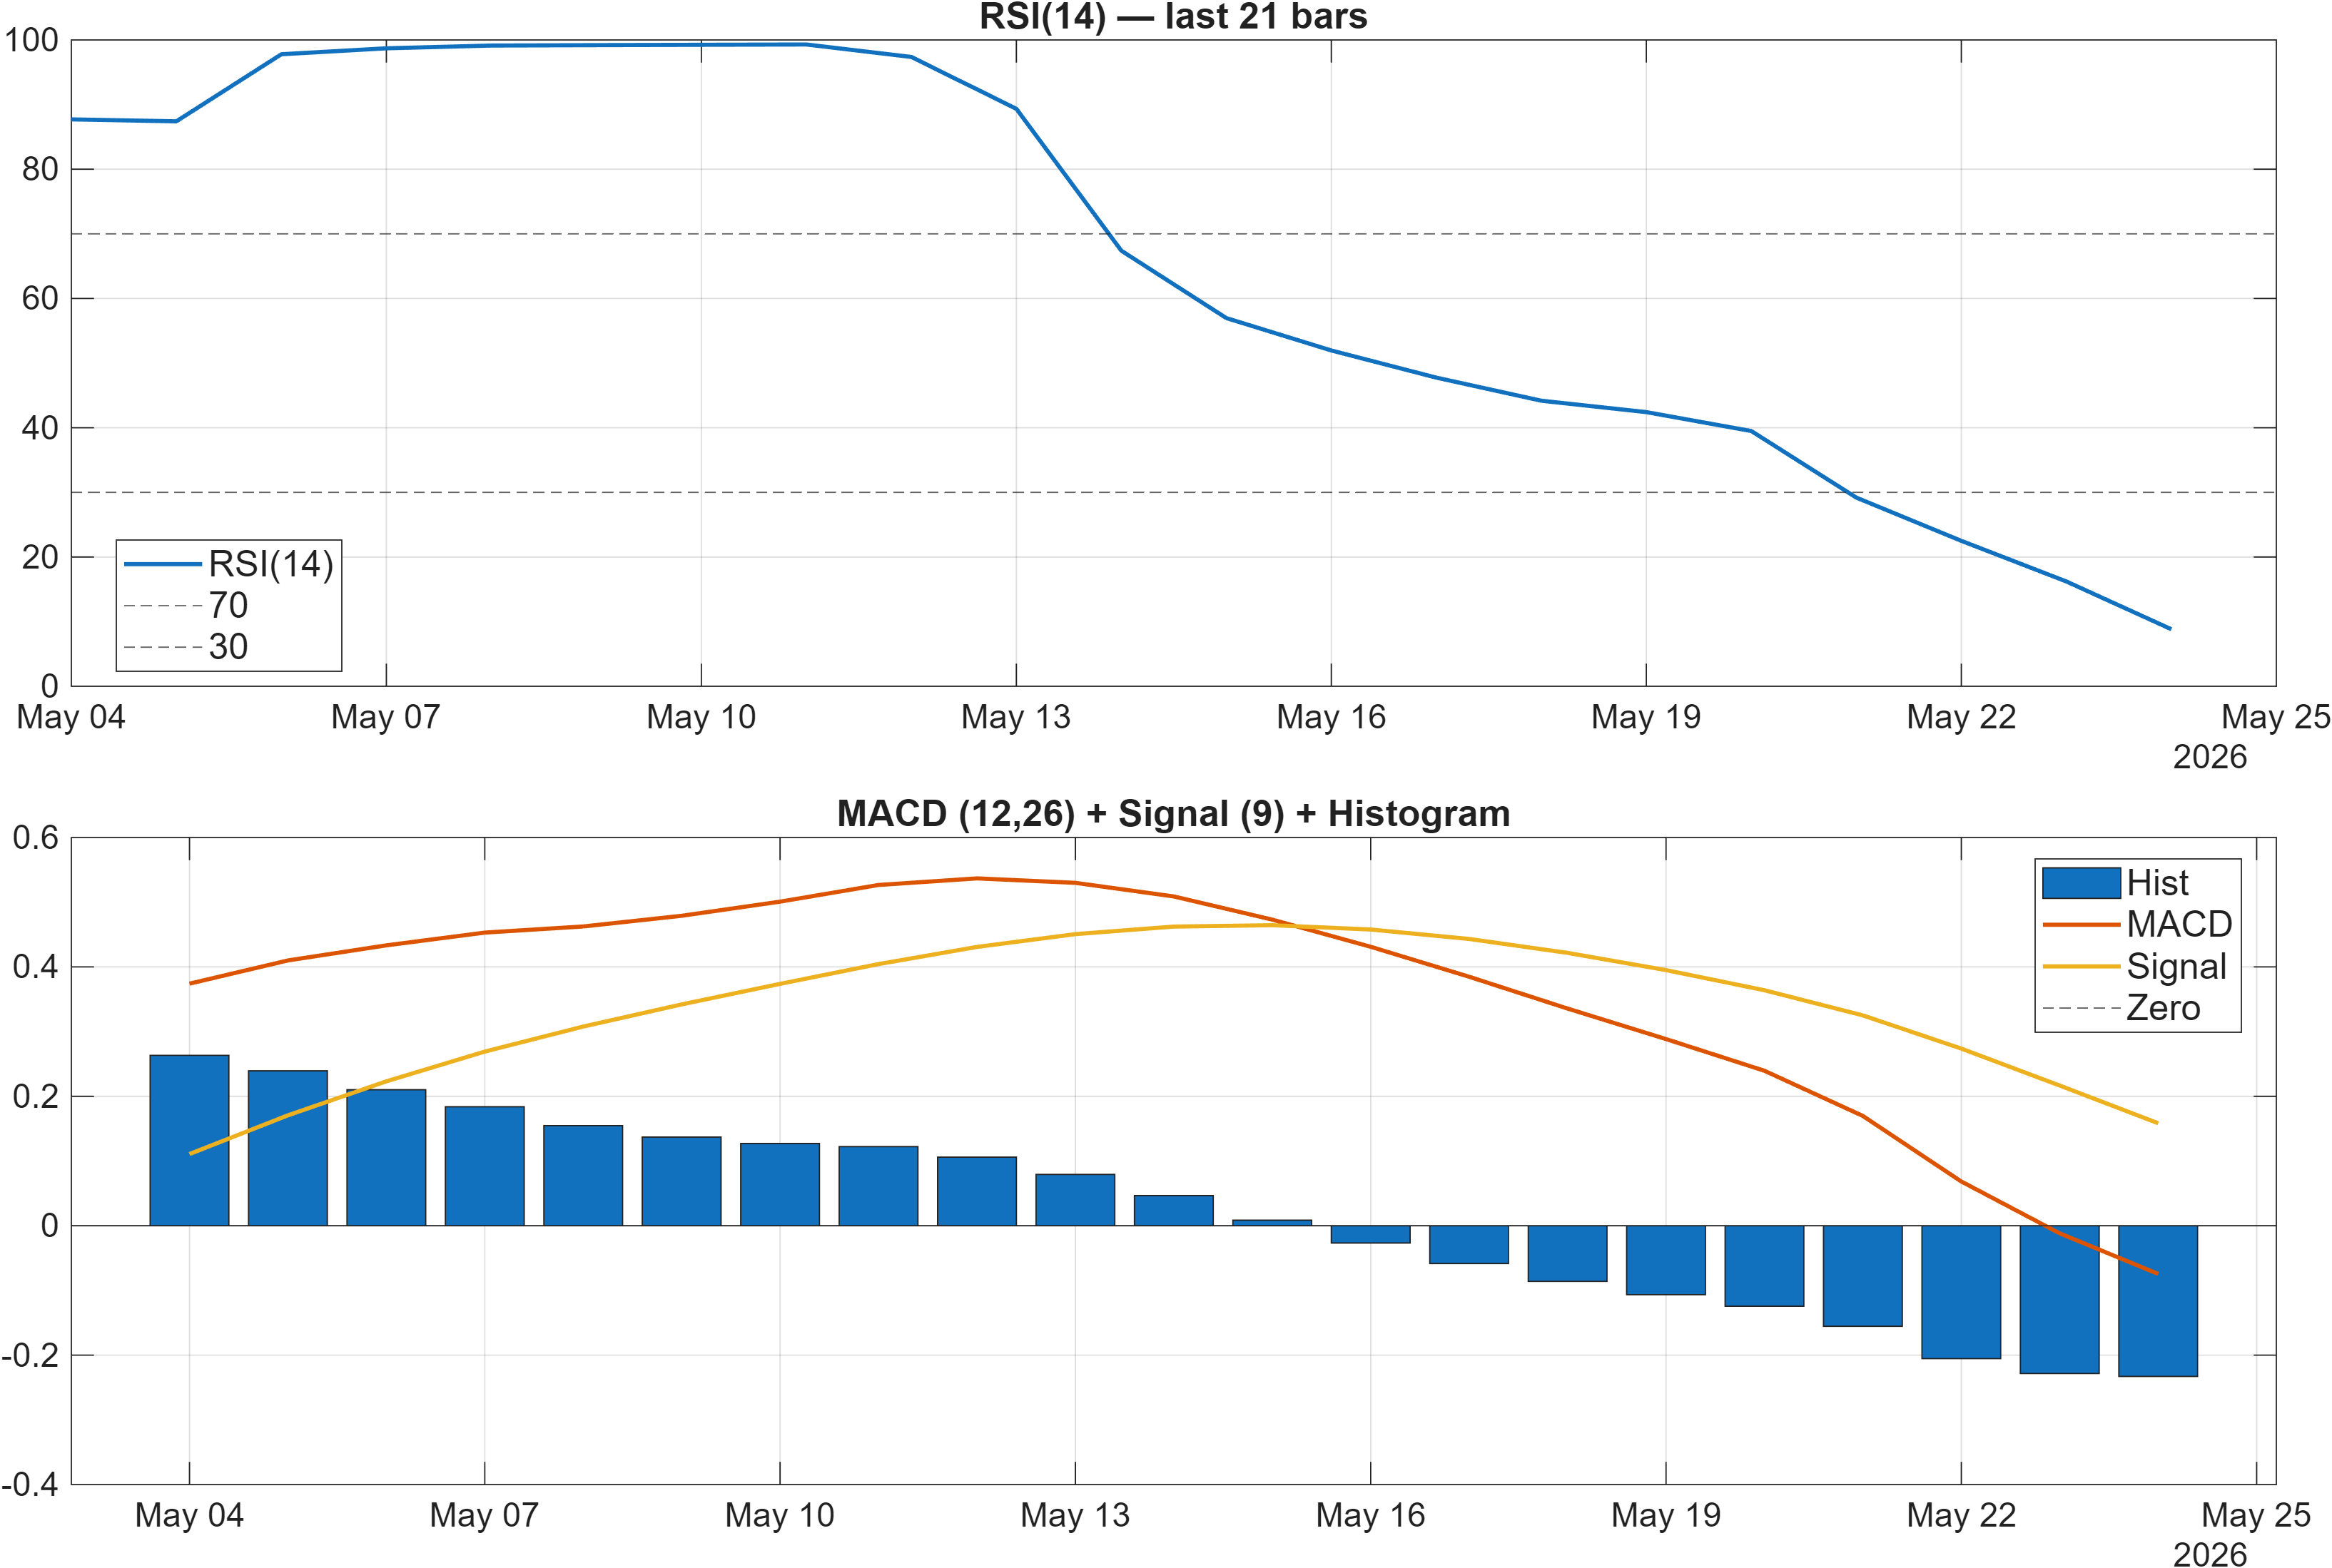
Momentum is currently the primary constraint. The stated RSI bias = Bearish, and the signal table quantifies this with RSI(14) at 8.824, a deeply oversold-style reading that often coincides with either capitulation dynamics or a persistently one-sided down-move. Oversold alone is not a reversal signal; rather, it sets a condition where reaction rallies can be sharp but also prone to failure if trend/flow do not improve.
MACD is also aligned with weakness. The report shows a MACD histogram of -0.2329, consistent with negative momentum and incomplete basing. In combination, very weak RSI with a negative MACD histogram can indicate either late-stage selling pressure or trend continuation risk, depending on whether subsequent bars start to compress the MACD histogram toward zero and lift RSI off extremes.
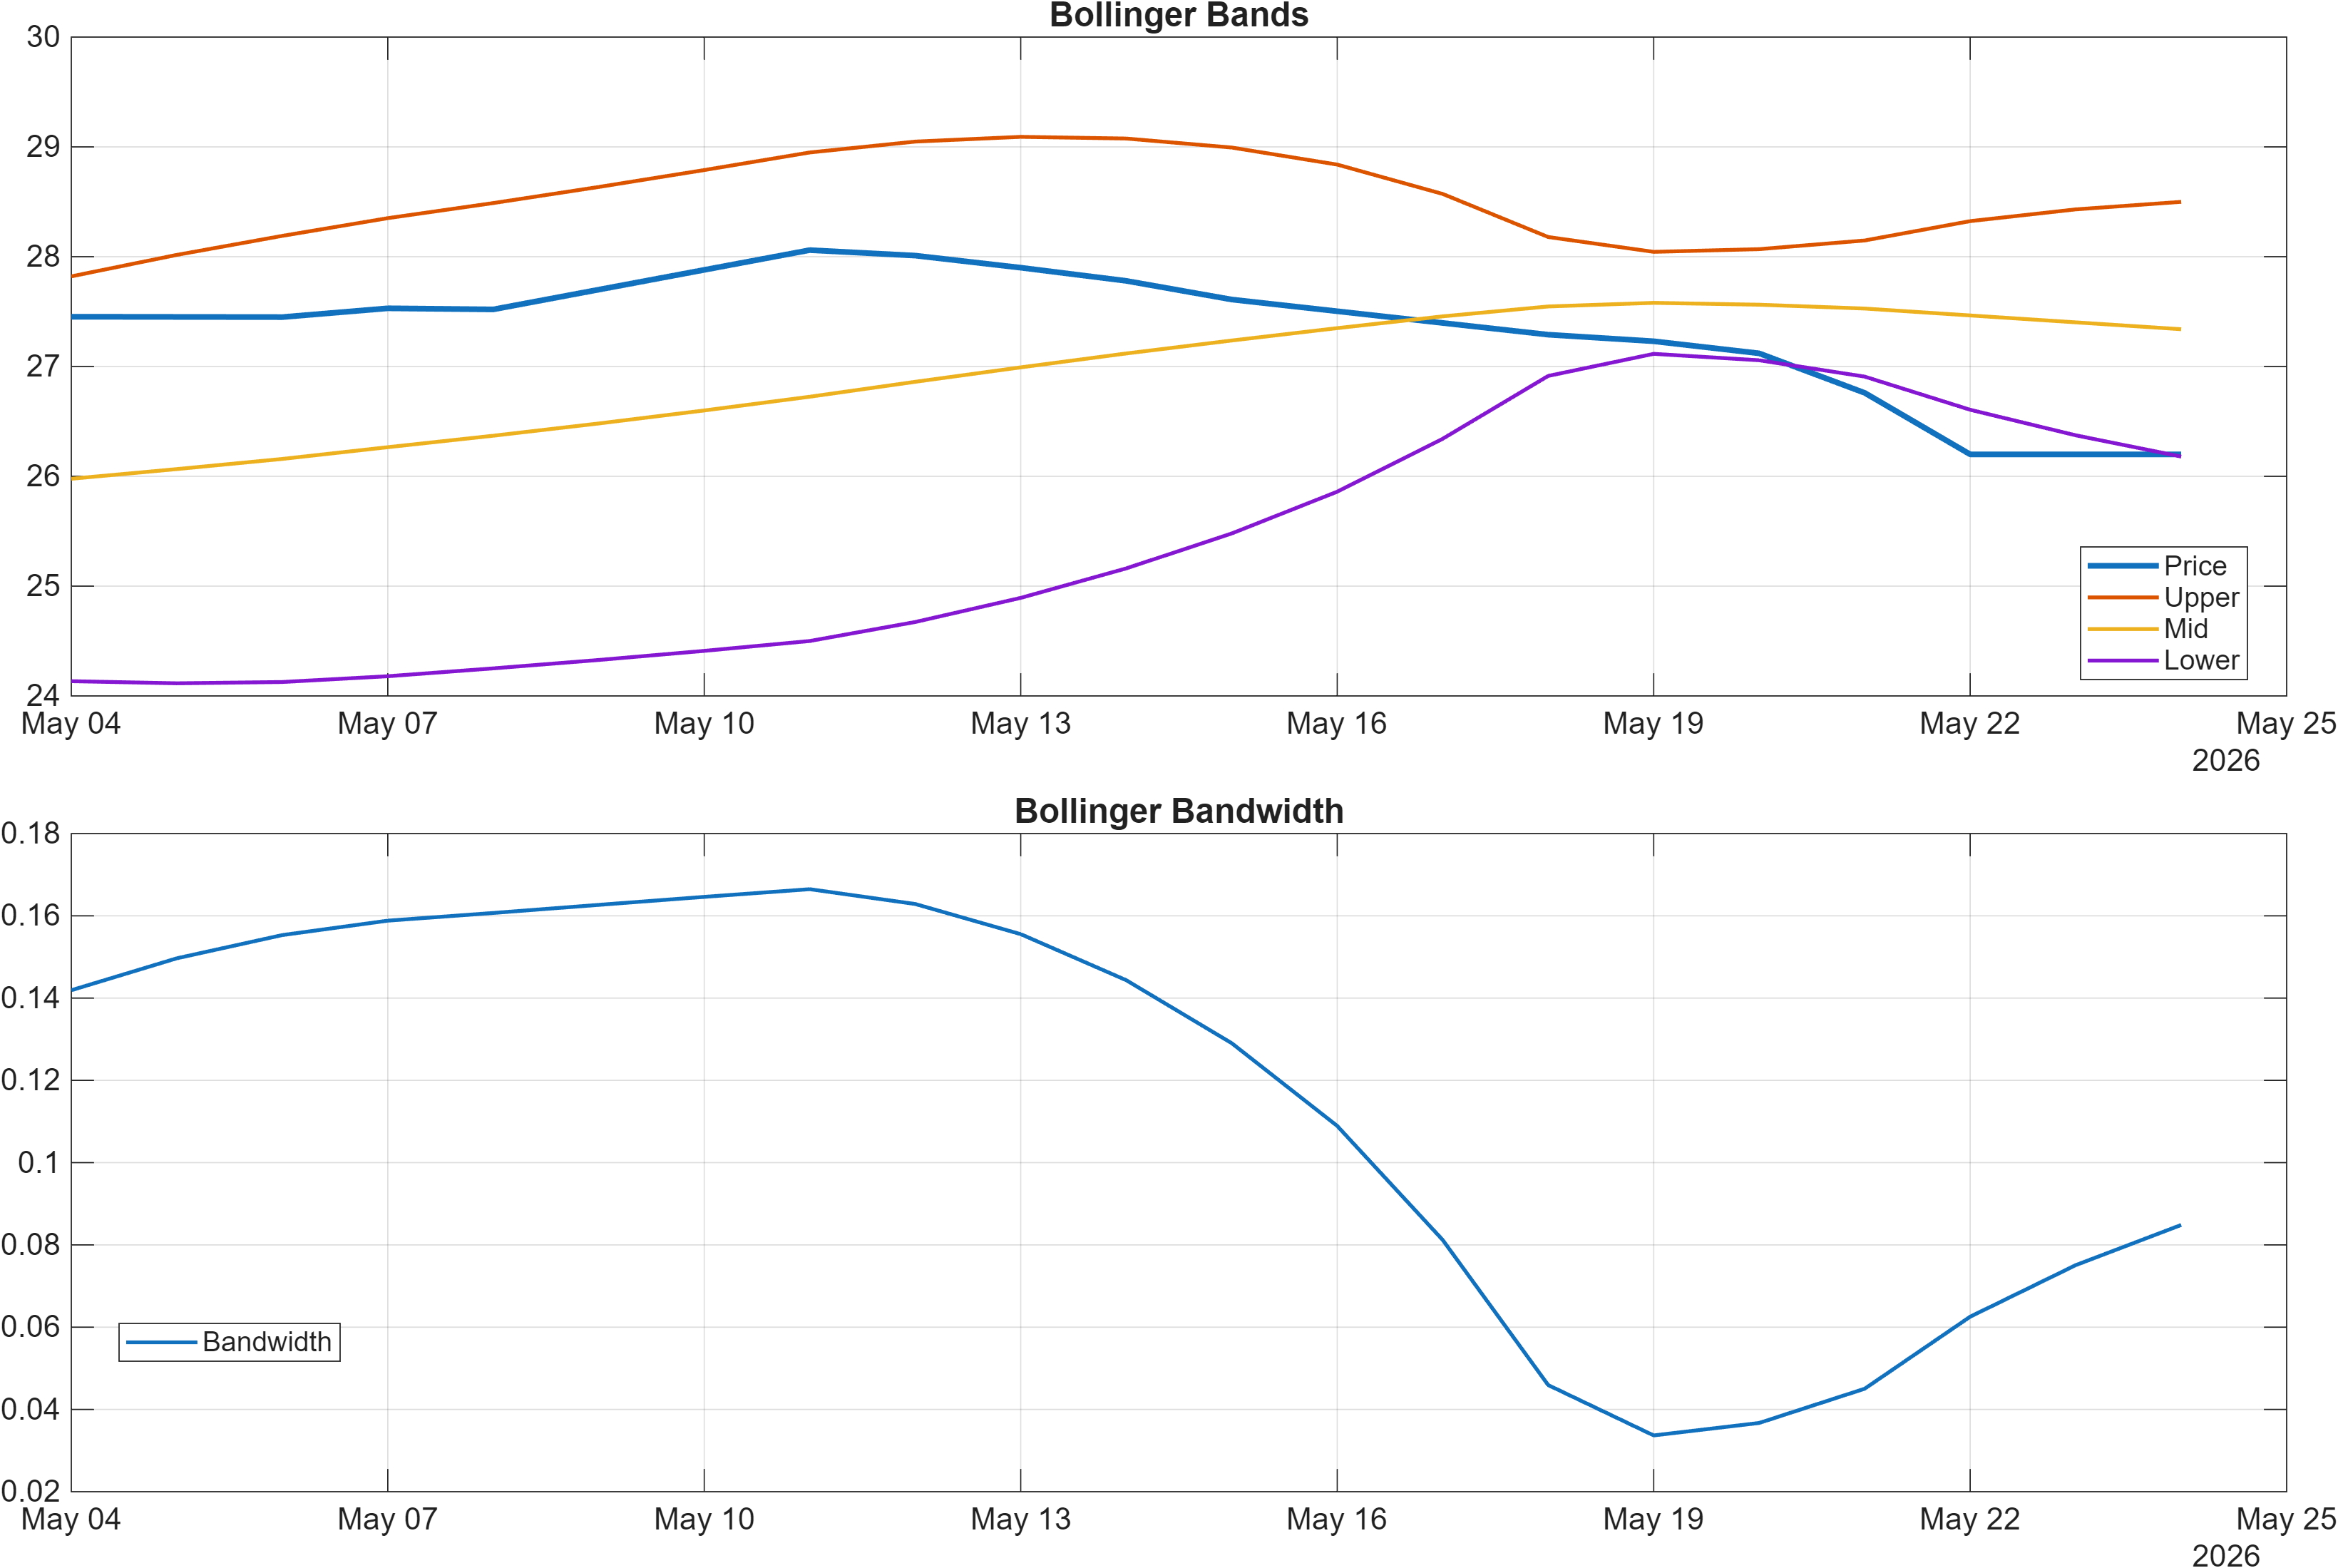
Volatility, however, does not appear to be expanding aggressively. The latest Bollinger bandwidth is 0.0848 (also consistent with the BB Width line item at 0.08485). A contained bandwidth alongside stressed momentum can indicate compression under pressure: price weakens, but volatility is not yet “blowing out.” If bandwidth begins widening while momentum remains negative, that would typically signal risk escalation; if momentum stabilizes while bandwidth stays contained, it can support a more controlled mean-reversion phase.
Interpretation: RSI bias = Bearish, MACD hist = -0.2329. | Bandwidth (volatility regime) latest = 0.0848.
4) Support / Resistance zones
Support ~ 25.2300 | Resistance ~ 27.9800
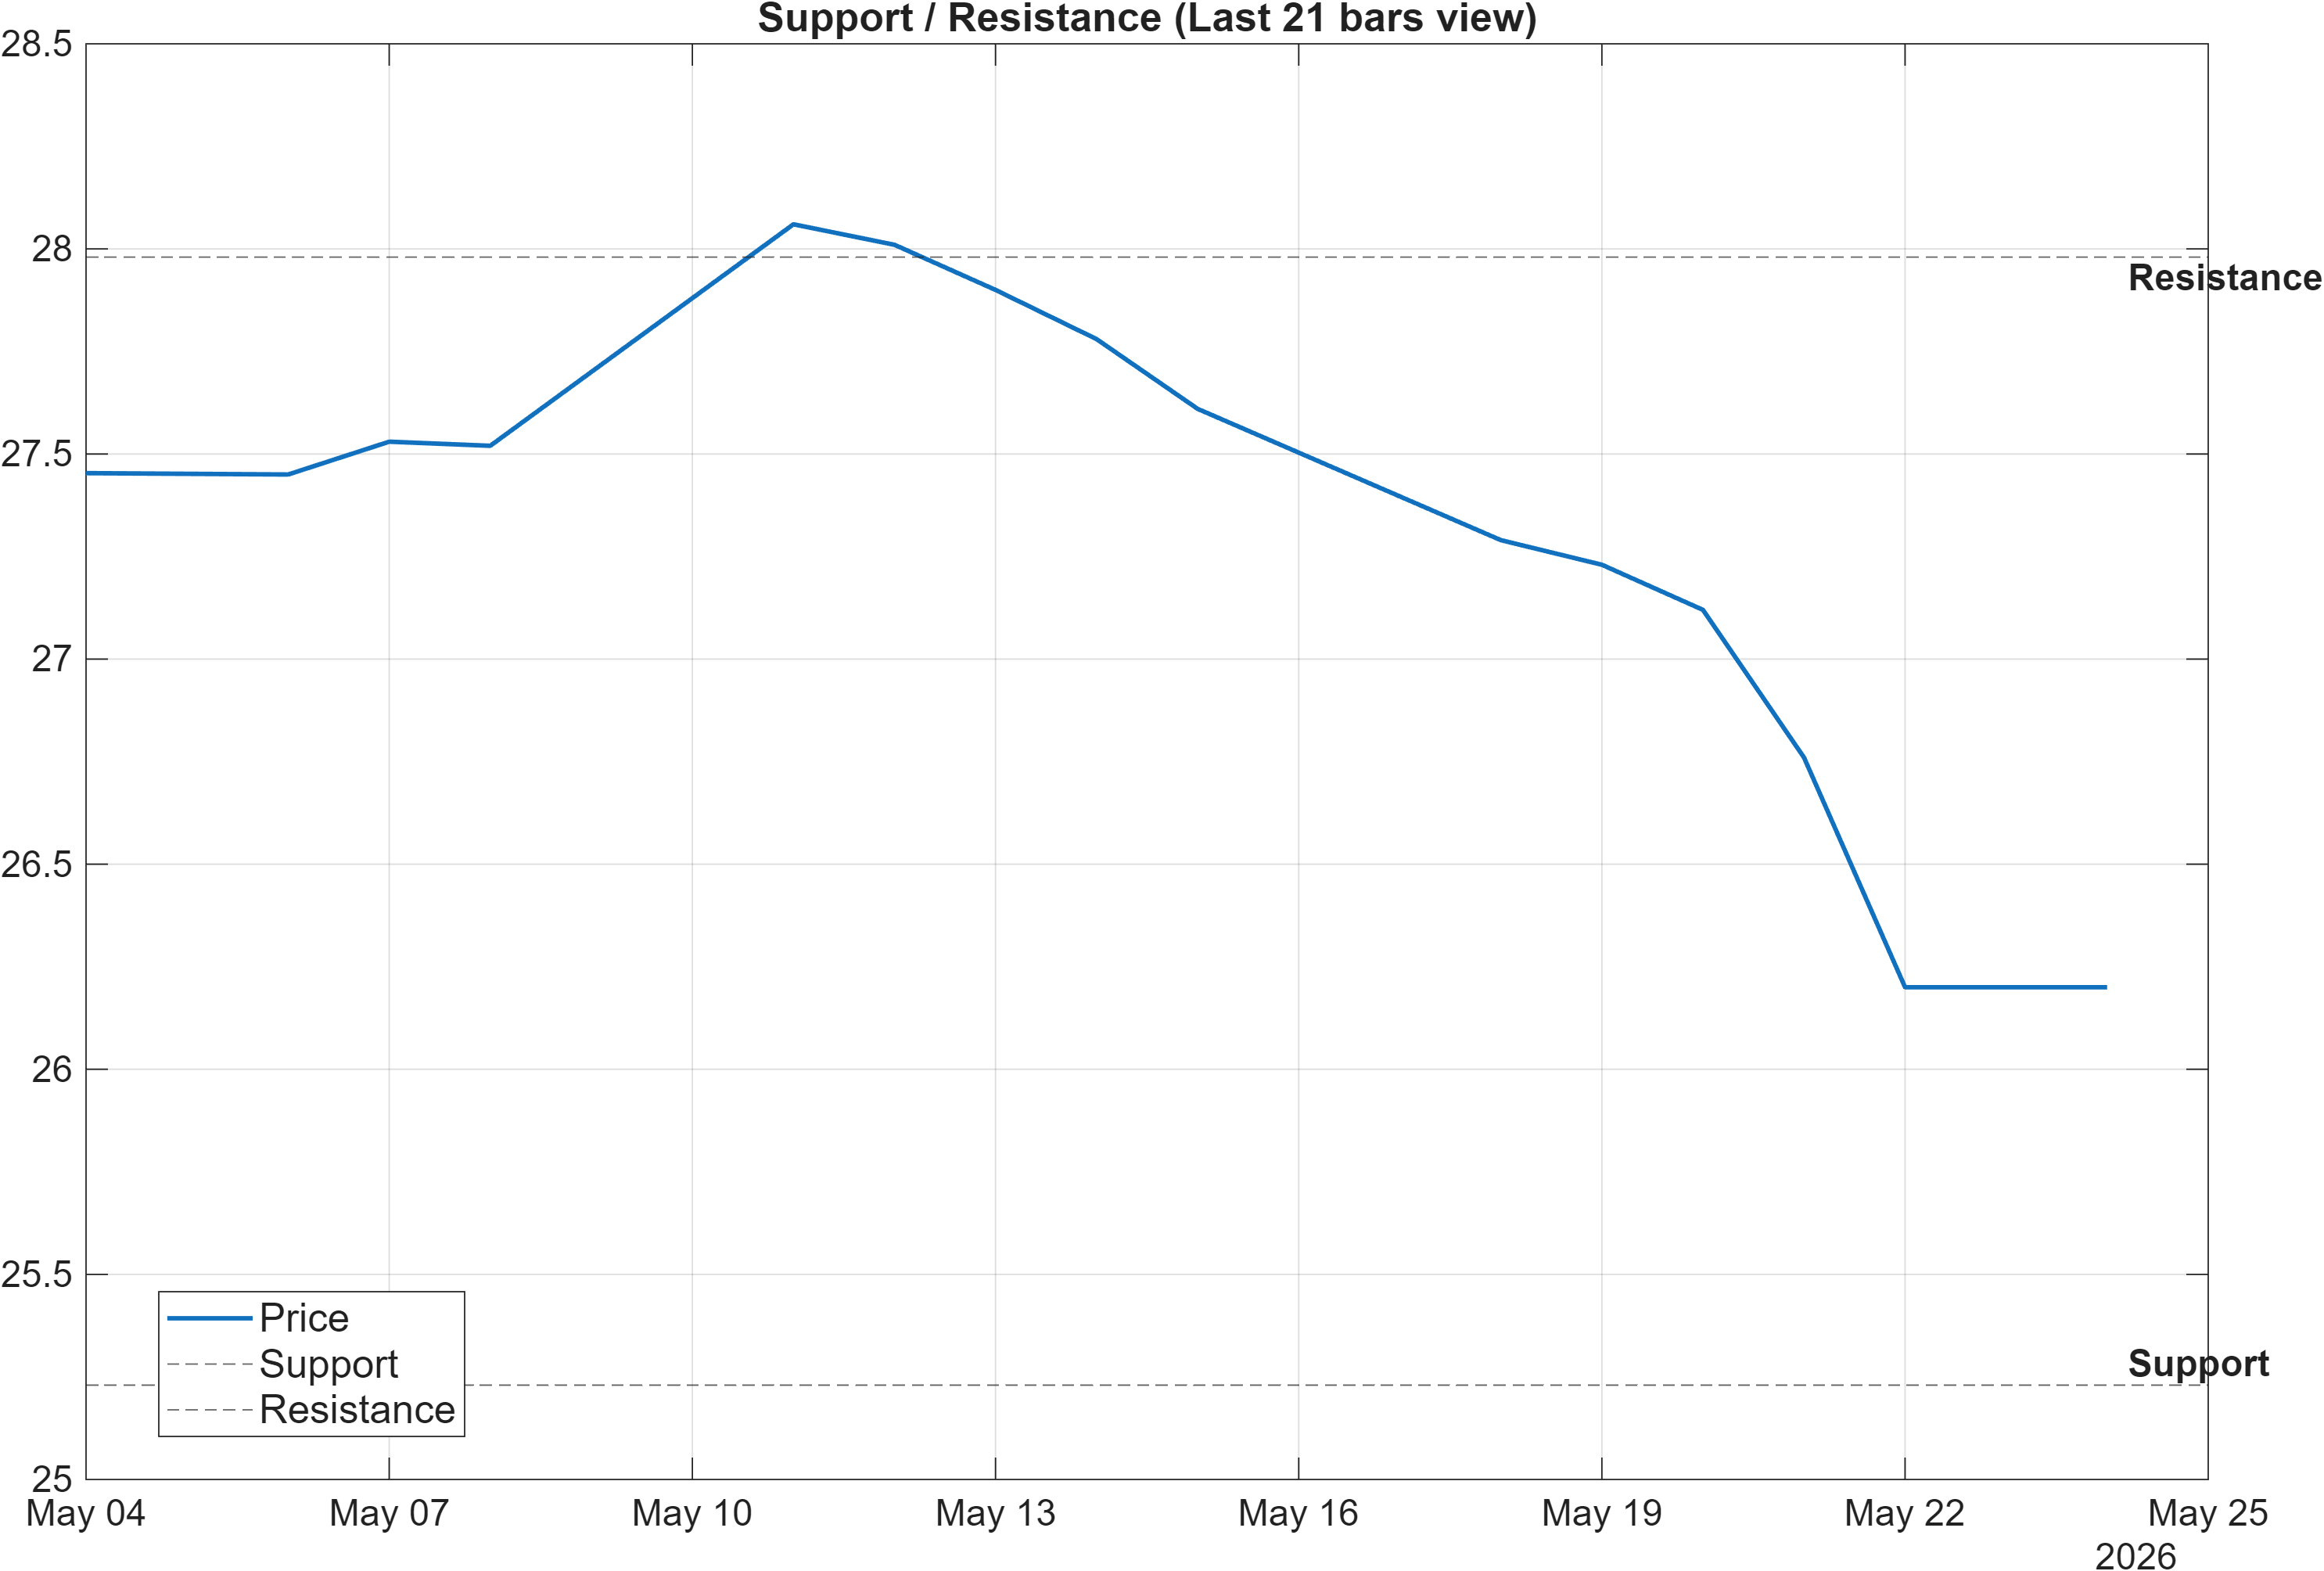
The level map is tight enough to matter because it intersects with a market that is weak in momentum but stronger in higher-horizon ranks. The stated framework is explicit: break above 27.9800 with volume → continuation, while a close below 25.2300 → deterioration risk. With RSI(14) at 8.824 and MACD histogram at -0.2329, levels can act as the primary decision boundary when indicator messages skew heavily bearish.
Conceptually, this is a verification zone rather than a forecast. A push through 27.9800 would do more than tag resistance: it would likely coincide with improving short-window measures (e.g., RSI recovering off extremes, MACD histogram compressing toward zero) and potentially better near-term rank behavior versus the current daily placement at #759. Conversely, a close below 25.2300 would place the instrument in a configuration where the longer-horizon strength (e.g., #22 3-month, #16 6-month) is forced to coexist with a more fragile price structure, increasing the chance that longer-window measures start to mean-revert lower.
The spacing between the two levels also matters for risk framing: it defines a bounded area where false breaks and failed mean-reversion attempts can occur. In that environment, waiting for a decisive close relative to these zones generally provides cleaner information than reacting to intraday movement alone.
Scenario view: Break above resistance with volume → continuation. Close below support → signal deterioration risk.
5) Quant Technical Dashboard (18 Signals)
KGNAI AI Technical Analysis Score (Deep Reinforcement Learning): Rank #1164 out of 1292 (Rank 1 represents the strongest technical positioning and a higher probability of favorable price behavior. As ranks increase toward the maximum, the probability of favorable outcomes weakens and bearish positioning becomes more dominant.) | Label: Bearish | Score: -0.802
18-Signal Technical Confluence Score: -0.556 (Bearish)
Overall Technical Score (18-signal confluence + DRL rank blend): -0.629 (Bearish)
Note: The blended score reflects signal strength weighted against broader AI technical ranking, which may temporarily diverge.
Blended technical score breakdown: -0.629 (Bearish | Bull 3 / Bear 13 / Neutral 2)
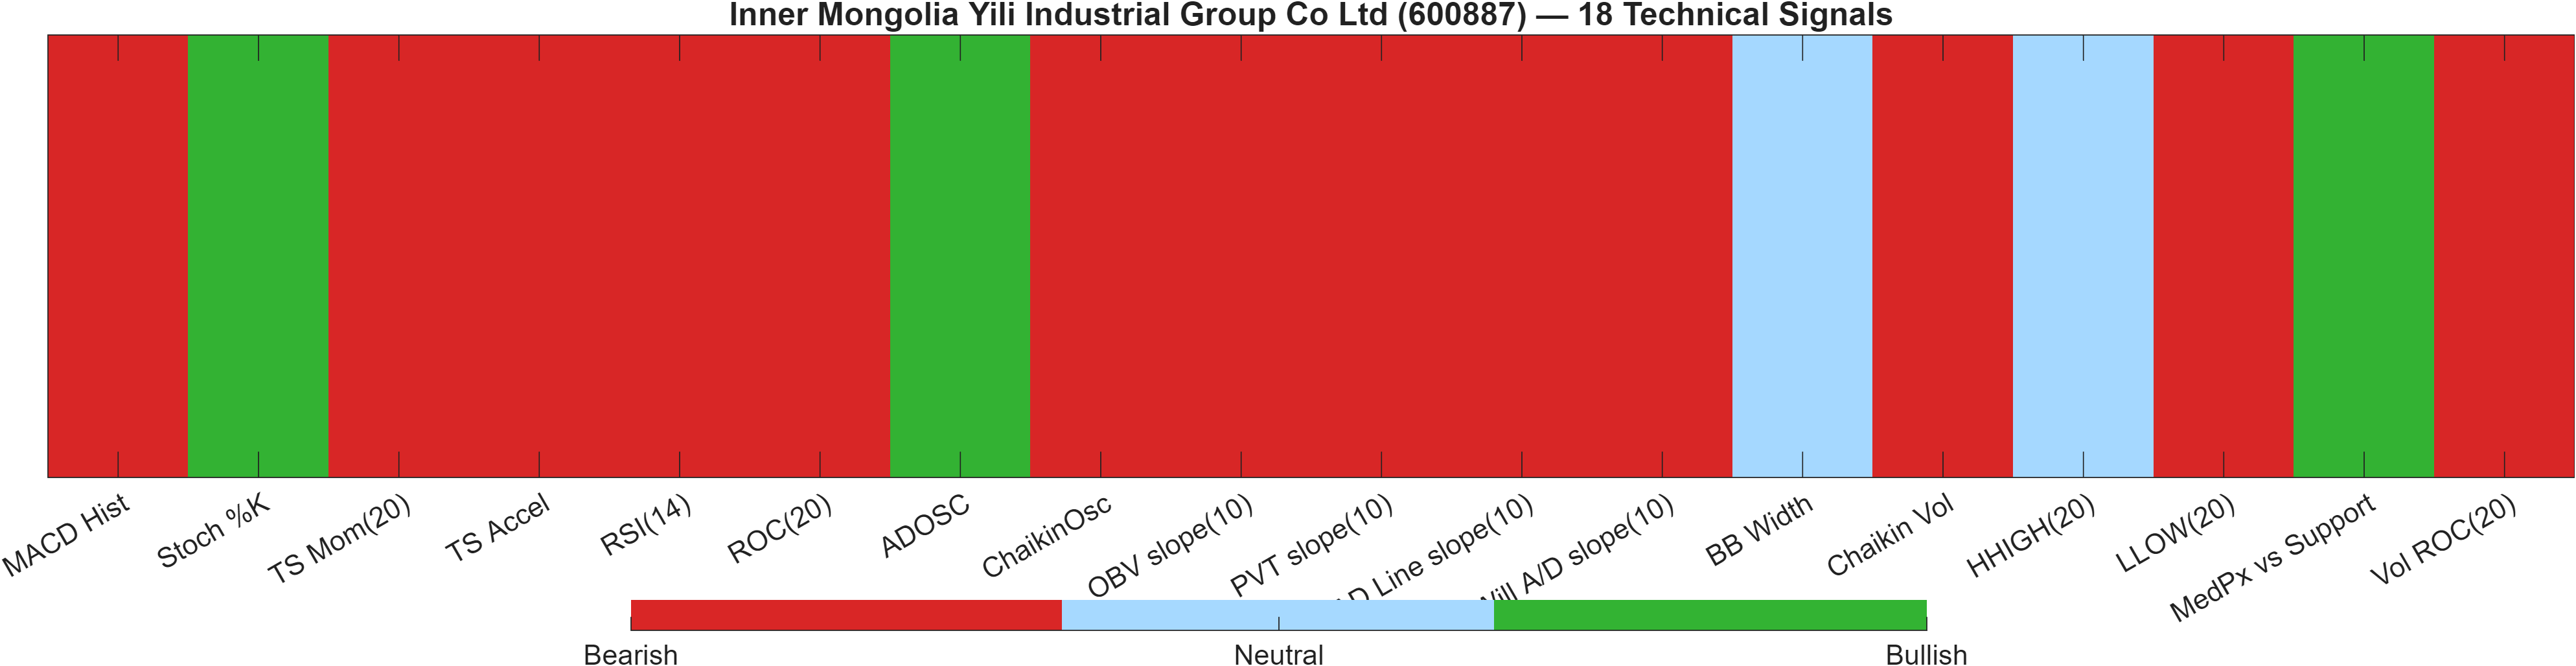
The technical stack is decisively negative in aggregate, and importantly, it is negative from two independent layers: the 18-signal confluence and the DRL technical rank. The confluence score at -0.556 and blended score at -0.629 are consistent with a market where multiple indicator families are aligned toward downside bias. The DRL technical rank at #1164 (score -0.802) reinforces that, within the broader universe, the current technical posture is comparatively weak.
The breadth of bearish signals matters more than any single indicator. The breakdown shows Bear 13 / Bull 3 / Neutral 2, suggesting limited offsetting strength. In the signal list, momentum and rate-of-change elements are negative (e.g., TS Mom(20) -1.252, ROC(20) -4.56), while the volume/participation read is also pressured (e.g., Vol ROC(20) -48.07 and a negative OBV slope(10) -3.775e+08). That combination implies that weakness is not purely “price-only”; it is supported by a broader set of flow-sensitive measures.
There are, however, isolated counter-signals that can matter for stabilization: Stoch %K 0.5556 is flagged bullish, and ADOSC 0.6579 is also bullish. These do not override the dominant bearish stack, but they can be consistent with early attempts at basing—particularly if they begin to align with improved price behavior near 25.2300 and a reduction in negative MACD histogram magnitude (-0.2329 currently).
Signal table (Bull/Bear/Neutral)
| Indicator | Value | Signal |
|---|---|---|
| MACD Hist | -0.2329 | Bearish |
| Stoch %K | 0.5556 | Bullish |
| TS Mom(20) | -1.252 | Bearish |
| TS Accel | -3.103 | Bearish |
| RSI(14) | 8.824 | Bearish |
| ROC(20) | -4.56 | Bearish |
| ADOSC | 0.6579 | Bullish |
| ChaikinOsc | -1.105e+08 | Bearish |
| OBV slope(10) | -3.775e+08 | Bearish |
| PVT slope(10) | -3.116e+06 | Bearish |
| AD Line slope(10) | -3.548e+08 | Bearish |
| Will A/D slope(10) | -3.41 | Bearish |
| BB Width | 0.08485 | Neutral |
| Chaikin Vol | 14.29 | Bearish |
| HHIGH(20) | 28.4 | Neutral |
| LLOW(20) | 26.19 | Bearish |
| MedPx vs Support | 1.34 | Bullish |
| Vol ROC(20) | -48.07 | Bearish |
Interpretation: Indicator-level signals form the base confluence, which is then adjusted using a separate AI-driven technical ranking model. The final technical score summarizes this combined view.
6) News sentiment + extractive gist
Note: Instrument-specific news matches were not found, so the digest includes broader market/sector headlines.
Sentiment score (avg): 0.013 | Positive: 12% | Neutral: 81% | Negative: 6%
KGNAI AI News Sentiment Score (normalized -1 to +1): 0.99 (as of 2026-03-02) | Label: Bullish | Overall news score: 0.99
Positive Developments
Recent coverage across major financial outlets indicates a generally constructive backdrop for consumer-facing and cross-border growth narratives, even if the items are not instrument-specific. The sentiment distribution still reads mostly neutral (81%), but the presence of a positive bucket (12%) alongside a near-flat average sentiment score (0.013) suggests that incremental “good news” is not being overwhelmed by overtly negative flow. In this context, the normalized sentiment score of 0.99 acts more as a contextual tailwind than a standalone catalyst: it can reduce the probability that negative narratives dominate the tape while the chart works through a technically bearish configuration. If technical conditions begin to stabilize (e.g., easing downside momentum from the current MACD histogram -0.2329), a supportive news tone can help sustain follow-through rather than reverse it.
Neutral / Mixed Developments
A large share of the digest remains informational and macro-adjacent, which is consistent with the note that instrument-specific matches were not found. That aligns with the 81% neutral classification: the news flow, in aggregate, appears to be providing background rather than direct pricing impulses. For positioning, this often means price action is more likely to be governed by technical levels—notably 25.2300 and 27.9800—and by whether the market transitions from a short-term neutral rank (daily #759) toward the stronger mid-term cohort (weekly #148). In other words, the news tape is not currently a decisive differentiator; it is a framing variable around risk appetite and regime.
Negative / Risk Signals
Risk items in the digest skew toward broader trade and policy friction themes. Even with only 6% negative classification, these macro-style risks can matter because the technical dashboard is already Bearish (18-signal -0.556, blended -0.629). When momentum is stressed (e.g., RSI(14) 8.824) and flow-sensitive metrics are weak (e.g., Vol ROC(20) -48.07), externally driven uncertainty can amplify downside sensitivity near support. The practical takeaway is not to over-weight the news score alone—even at 0.99—but to treat negative risk headlines as a potential catalyst for level breaks, particularly if the market tests 25.2300 without evidence of stabilization.
- Whether price action can reclaim resistance near 27.9800 with credible participation.
- Whether any risk-driven tape coincides with a close below 25.2300.
- Whether sentiment stays constructive while the technical score remains -0.629, or begins to converge with the technical weakness.
Sources referenced: Reuters, Bloomberg, Yahoo Finance, MarketWatch, Investing.com
7) Sources
Not available in the provided data.
You may also like: How KGNAI AI ranks instruments across global markets
Disclaimer: KGNAI provides AI-generated analytics and educational market commentary only. This is not financial advice. Markets involve risk. Always do your own research.