
601360 (360 Security Technology Inc) — 22-May-2026 Technicals Skew Bearish While Ranks Stay Mixed
360 Security Technology Inc (601360) sits in a mixed regime where cross-horizon ranks are not uniformly aligned, while the technical stack leans bearish. In the KGNAI universe of 1292 instruments, the daily and weekly placements are neutral, the monthly rank is bearish, and the yearly rank remains bullish—an internal tension that often coincides with transition phases rather than clean trend continuation. Price structure also flags downside pressure, with Close vs MA50 and MA50 vs MA200 both bearish. Momentum indicators reinforce that tone: RSI(14) at 18.45 is deeply weak and MACD histogram at -0.0960 remains negative. Volatility, via Bollinger Bandwidth 0.1227, suggests a moderate regime where a directional break can be meaningful if confirmed. Key decision zones remain Support ~10.4350 and Resistance ~11.6600, with news sentiment broadly neutral.
- Rank stance (Short / Mid / Long): Short-term Neutral | Mid-term Bearish | Long-term Neutral
- Technical confluence: Bearish (18-signal confluence -0.444; overall technical score -0.439)
- Key levels: Support ~ 10.4350 | Resistance ~ 11.6600
- News sentiment bias: Neutral (avg -0.024; Neutral 94%)
- Confirmation / invalidation: A break above 11.6600 with volume supports continuation; a close below 10.4350 increases deterioration risk.
KGNAI evaluates assets using large cross-sectional datasets built from millions of structured data points. Inputs incorporate fundamental metrics, technical structures, and systematically processed news sentiment. Statistical models, machine learning, and AI frameworks are used to assess relative positioning, signal alignment, and probabilistic behavior across broad universes.
- Ranks are comparative across the tracked universe, not absolute price targets.
- Confluence reflects alignment among independent signal groups.
- Support/resistance levels are probabilistic decision zones, not guarantees.
- Sentiment provides contextual bias within the broader analytical framework.
1) KGNAI AI Analysis
Region: CHINA
Total universe size: 1292 ranked instruments
- Daily rank: #762 out of 1292 — Neutral
- Weekly rank: #647 out of 1292 — Neutral
- Monthly rank: #1041 out of 1292 — Bearish
- 3-Monthly rank: #529 out of 1292 — Neutral
- 6-Monthly rank: #558 out of 1292 — Neutral
- Yearly rank: #222 out of 1292 — Bullish
The rank stack is best read as time-horizon disagreement rather than a single directional verdict. The yearly rank (#222) sits in the upper portion of the universe (stronger relative behavior), while the monthly rank (#1041) falls in the weaker tail, consistent with mid-term pressure. Meanwhile, the daily (#762) and weekly (#647) placements remain neutral—often a sign that the market is still processing the prior move instead of trending cleanly.
This combination can be interpreted as a potential regime handoff: longer-run relative standing remains constructive, but shorter-cycle tests are not yet validating that stance. The 3-month and 6-month readings (#529 and #558) cluster near the mid-pack, suggesting the asset is not persistently dominating or underperforming peers on those horizons. When ranks compress around neutral while a single horizon (here, monthly) deteriorates, it frequently points to a localized drawdown within a broader distribution, rather than a uniform breakdown across timeframes.
KGNAI ranks are derived from multiple proprietary tests across large datasets and are designed to emphasize stability over sensitivity. Practically, the key analytical question is whether the weaker mid-term placement reverses back toward the neutral cluster, or whether it starts pulling adjacent horizons (weekly/3-month) lower. The declared term view remains: Short-term Neutral, Mid-term Bearish, Long-term Neutral—a mix that places greater weight on confirmation at the chart-defined decision zones than on any single rank print.
2) Price & trend overview
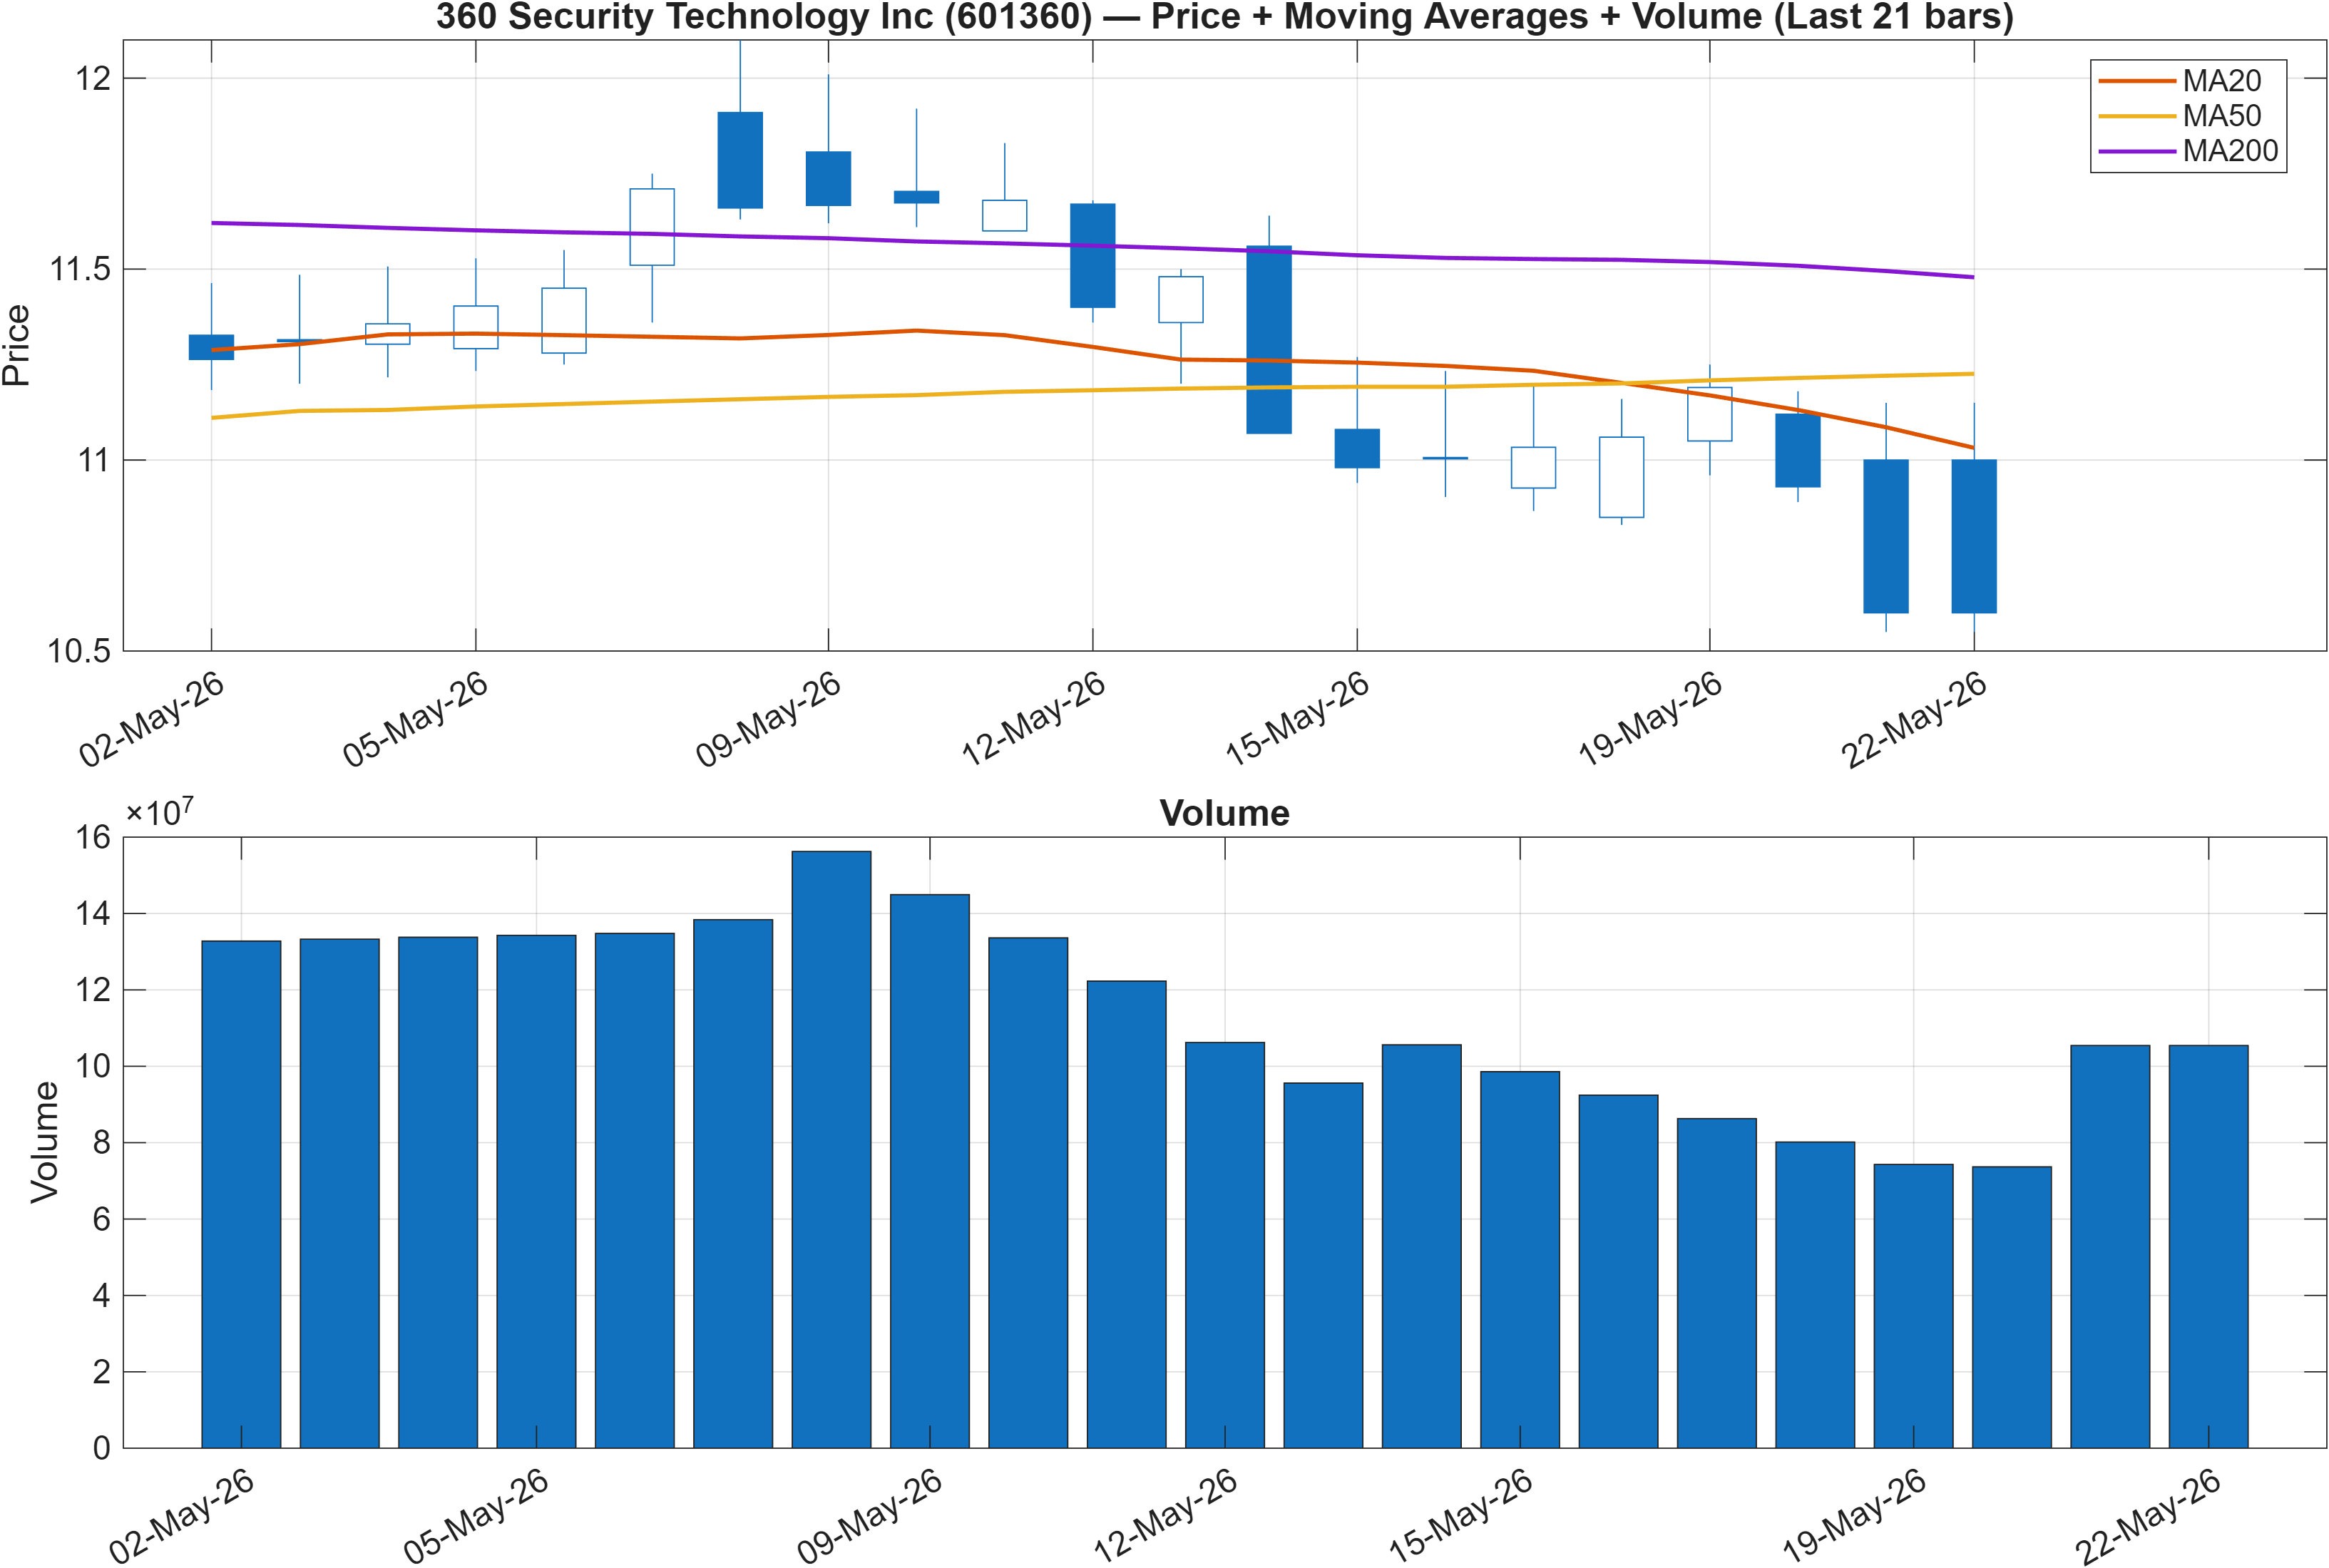
Trend diagnostics are currently defined by a bearish moving-average stack. The interpretation flags Close vs MA50 = Bearish and MA50 vs MA200 = Bearish, a configuration that typically reflects downside persistence and limits the quality of counter-trend rebounds until price can reclaim at least the faster average. In this structure, rallies often behave as mean-reversion attempts rather than trend resumptions, unless supported by broadening participation.
The nearby reference levels provide a practical framework for trend validation. With Support ~10.4350 and Resistance ~11.6600, the market is effectively trading within a defined corridor where range mechanics can dominate: sellers tend to defend overhead supply while buyers attempt to stabilize at known demand. Because the medium trend signals remain bearish, tests of resistance that fail to convert into acceptance (sustained trading above) can reinforce the prevailing bias.
What differentiates a routine bounce from a structural improvement is whether the move is accompanied by evidence consistent with a transition out of the bearish regime. In this report, the scenario logic is explicit: a break above resistance with volume is the continuation trigger, while a close below support increases deterioration risk. This framing avoids point forecasting and instead ties the trend narrative to observable conditions. Given the mixed rank picture (notably yearly #222 versus monthly #1041), the trend section is less about declaring direction and more about identifying which side of the corridor gains control.
3) Momentum & volatility dashboard
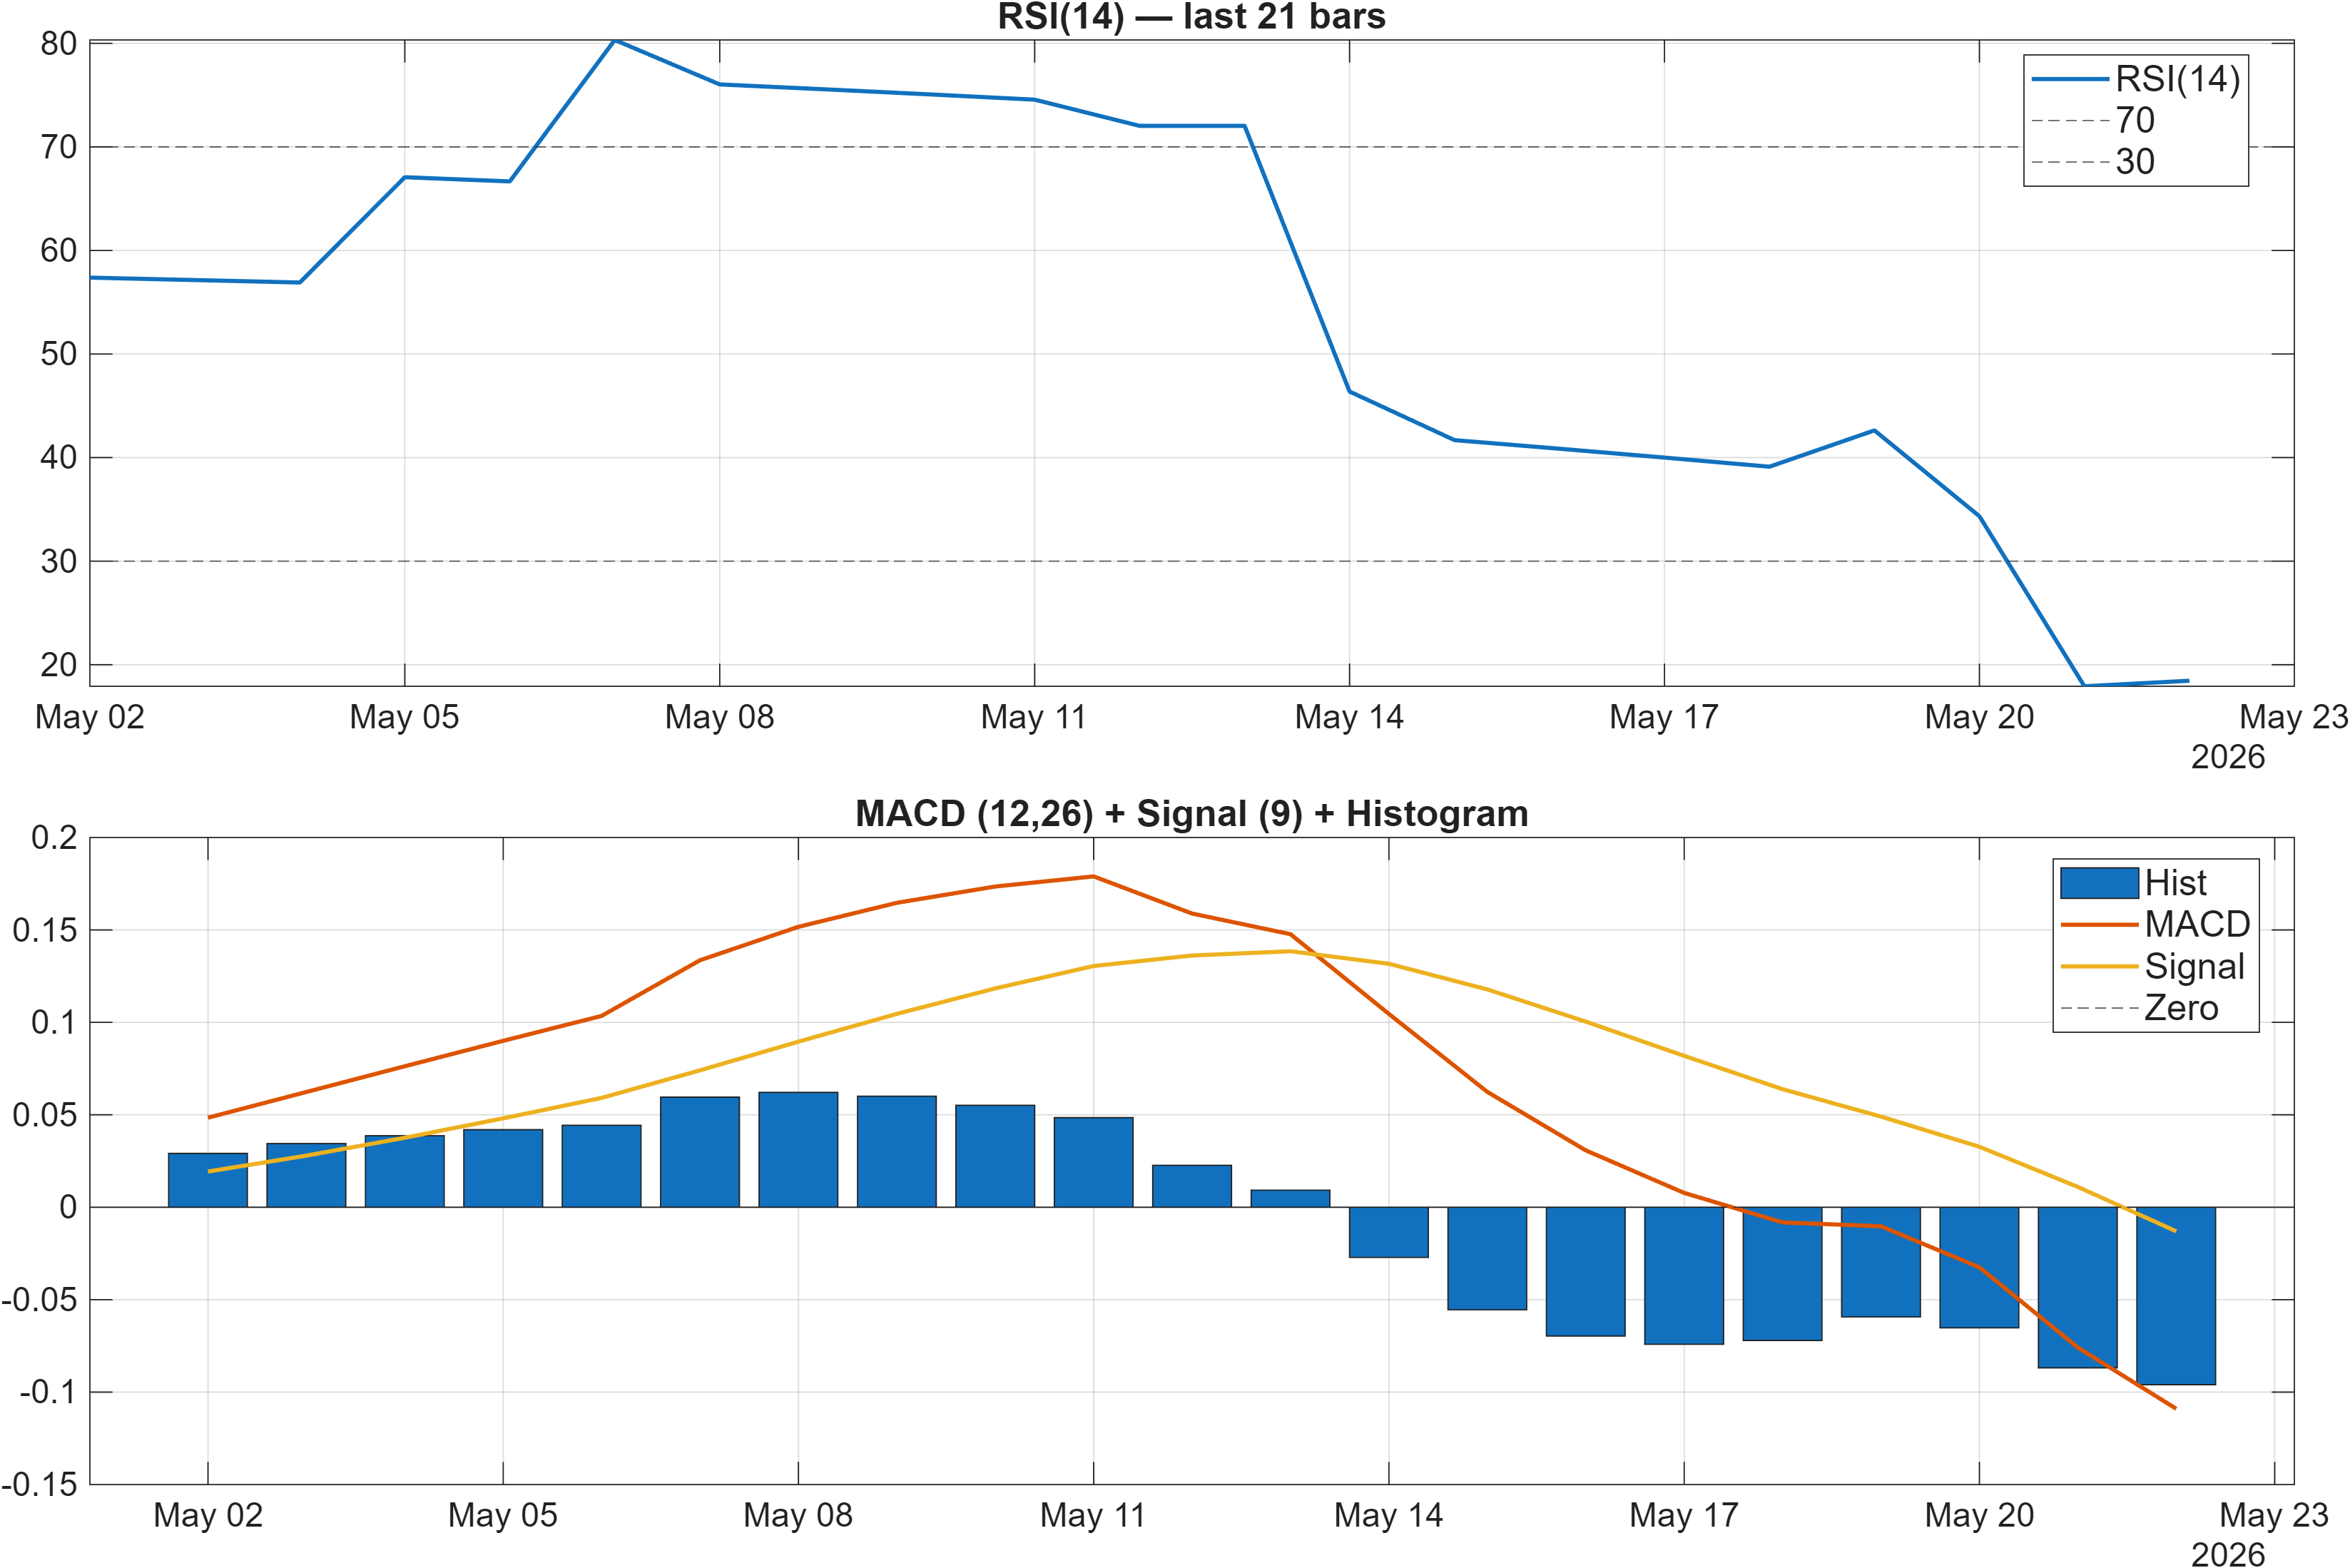
Momentum readings lean decisively weak. RSI(14) at 18.45 is consistent with an oversold condition, but oversold is a state, not a reversal signal. In bearish trends, RSI can remain depressed longer than expected, and rebounds may stall before the broader structure improves. The MACD histogram at -0.0960 reinforces that downside momentum remains dominant; until the histogram improves materially toward zero, the signal set continues to favor caution on trend persistence.
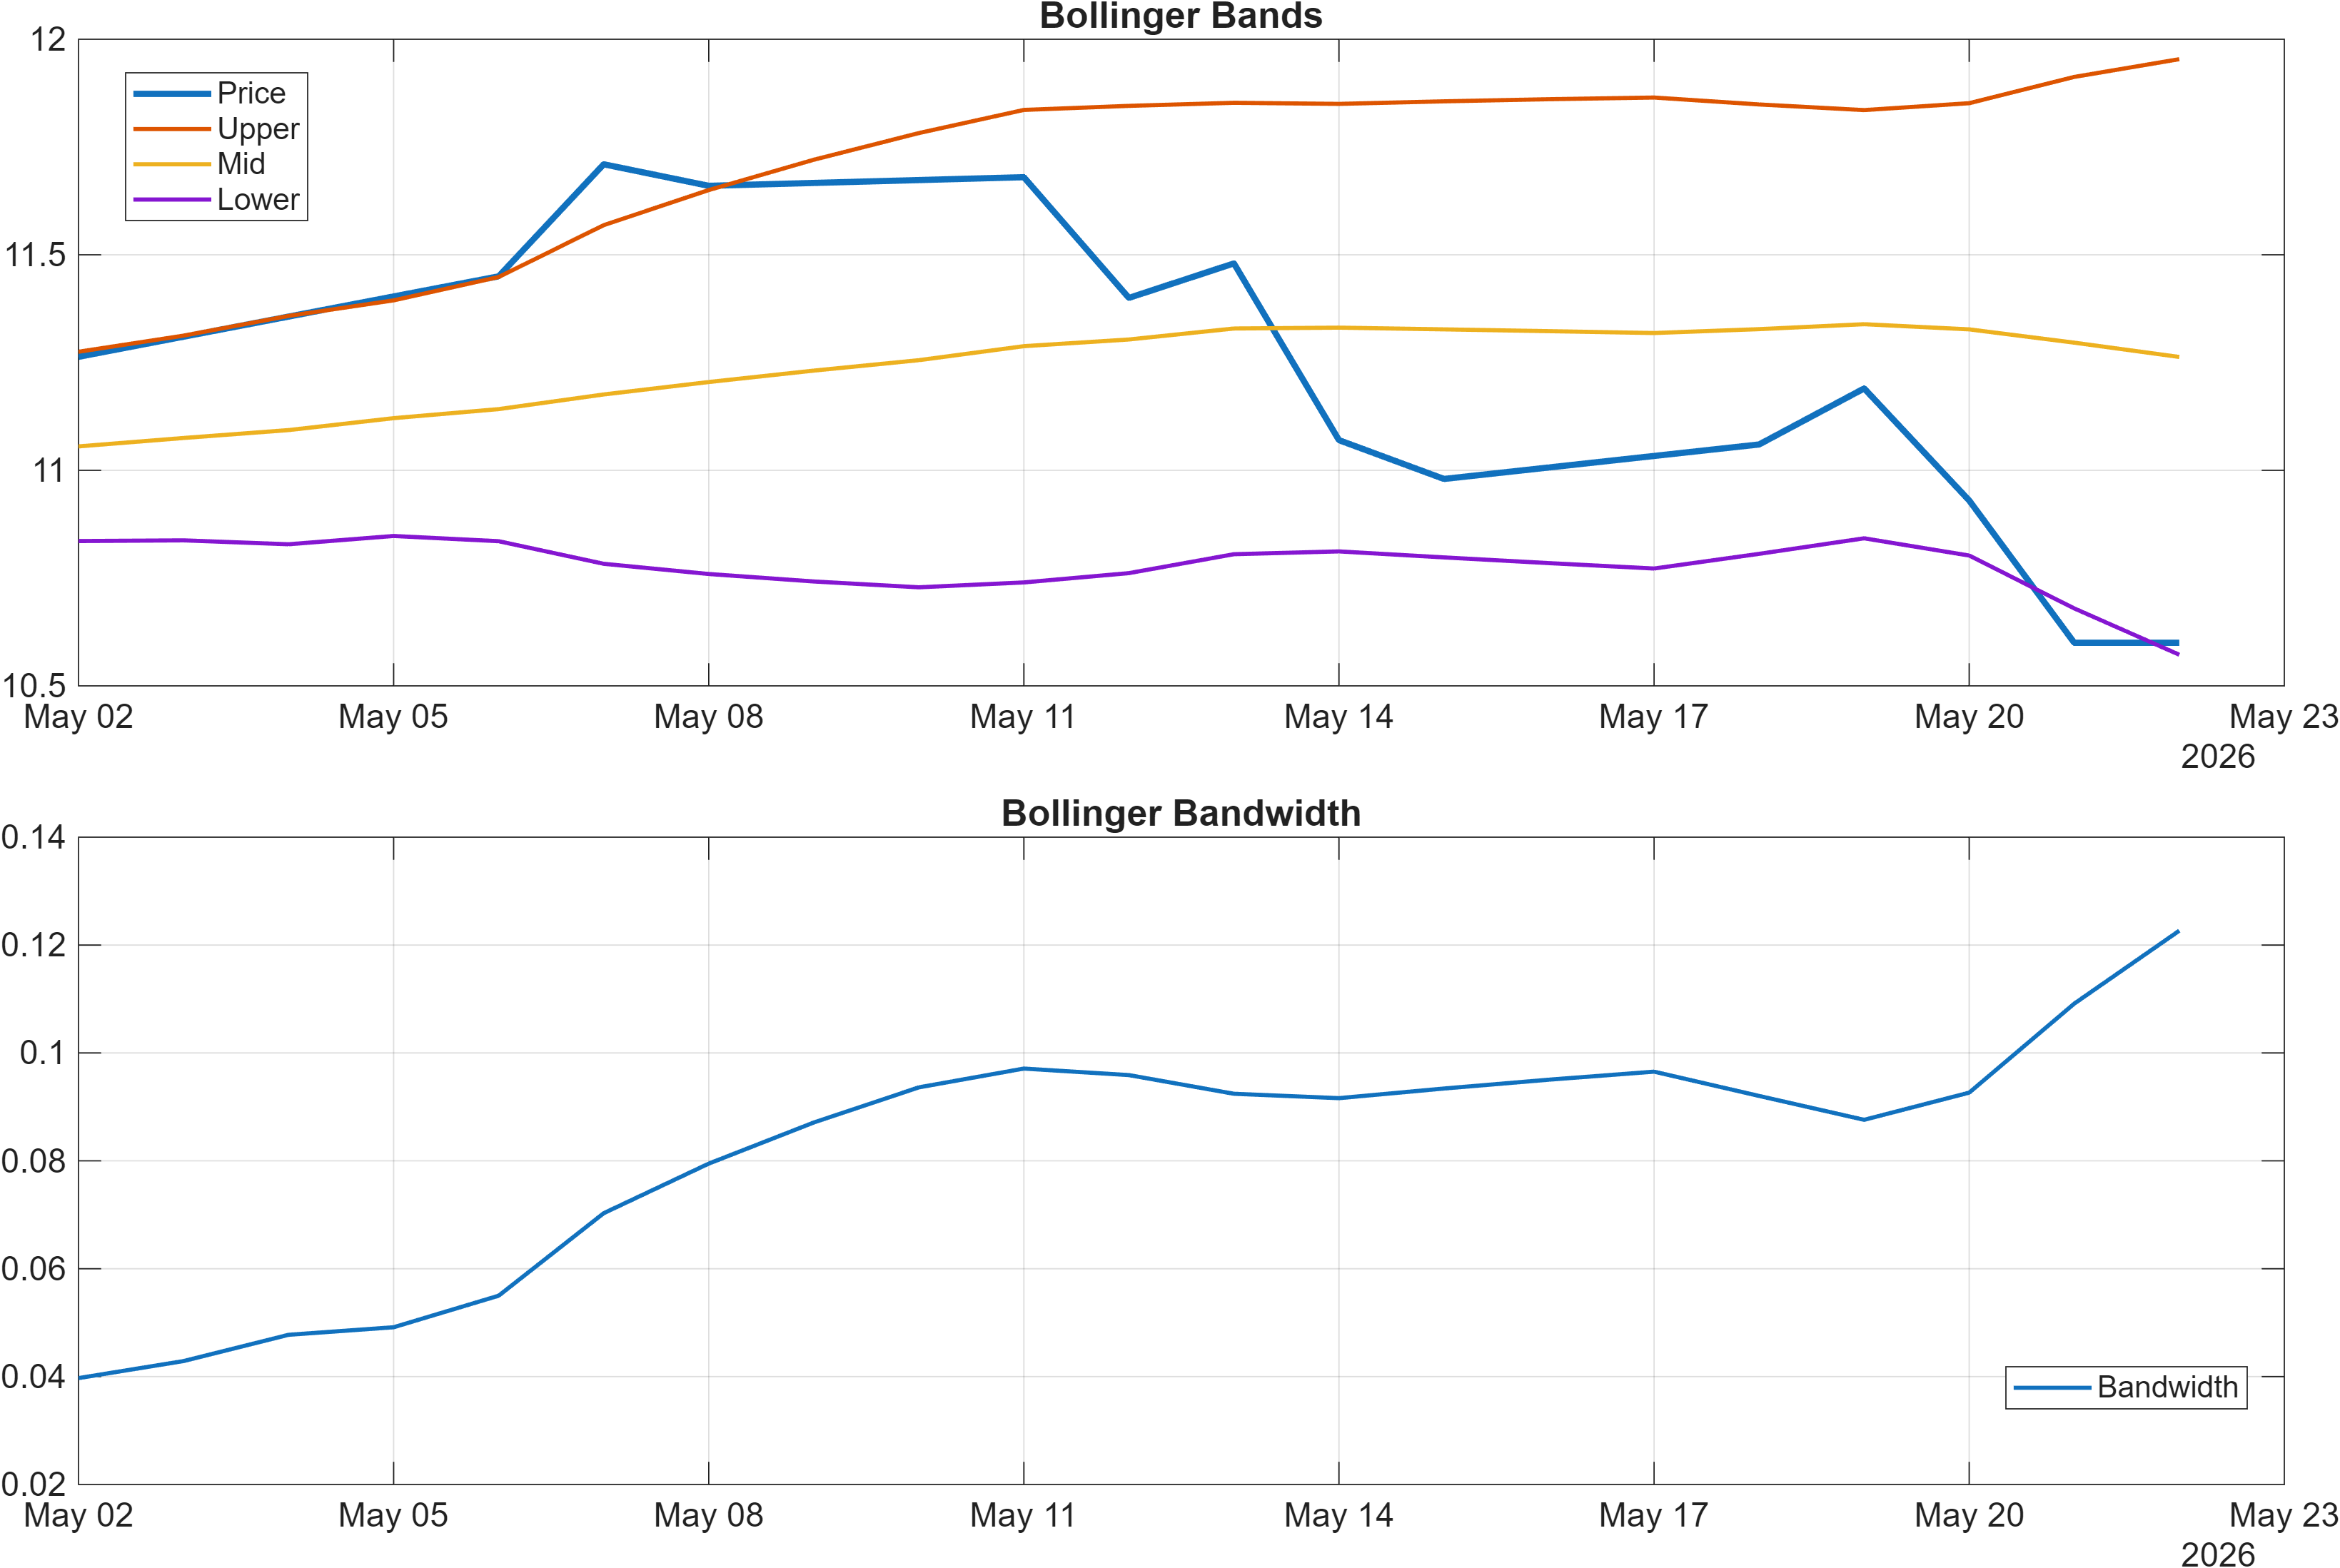
Volatility conditions are best summarized by Bollinger Bandwidth 0.1227, indicating a moderate regime rather than an extreme squeeze or blow-off. This matters because bandwidth regimes influence how traders interpret momentum signals: a moderate bandwidth environment can support directional follow-through if price breaks key levels, while very low bandwidth is often associated with imminent expansion and whipsaw risk.
The most relevant analytical tension is between momentum exhaustion and trend continuation. RSI at 18.45 argues that downside has been intense, but the negative MACD histogram argues that the trend impulse is not yet repaired. That combination often produces one of two outcomes: (1) a reflex rally that fails beneath resistance (11.6600), or (2) a stabilization phase near support (10.4350) where indicators begin to heal before price does. With ranks mixed across horizons and the trend stack bearish, the momentum dashboard suggests prioritizing confirmation (via level breaks and participation) over interpreting oversold as sufficient evidence of a turn.
4) Support / Resistance zones
Support ~ 10.4350 | Resistance ~ 11.6600
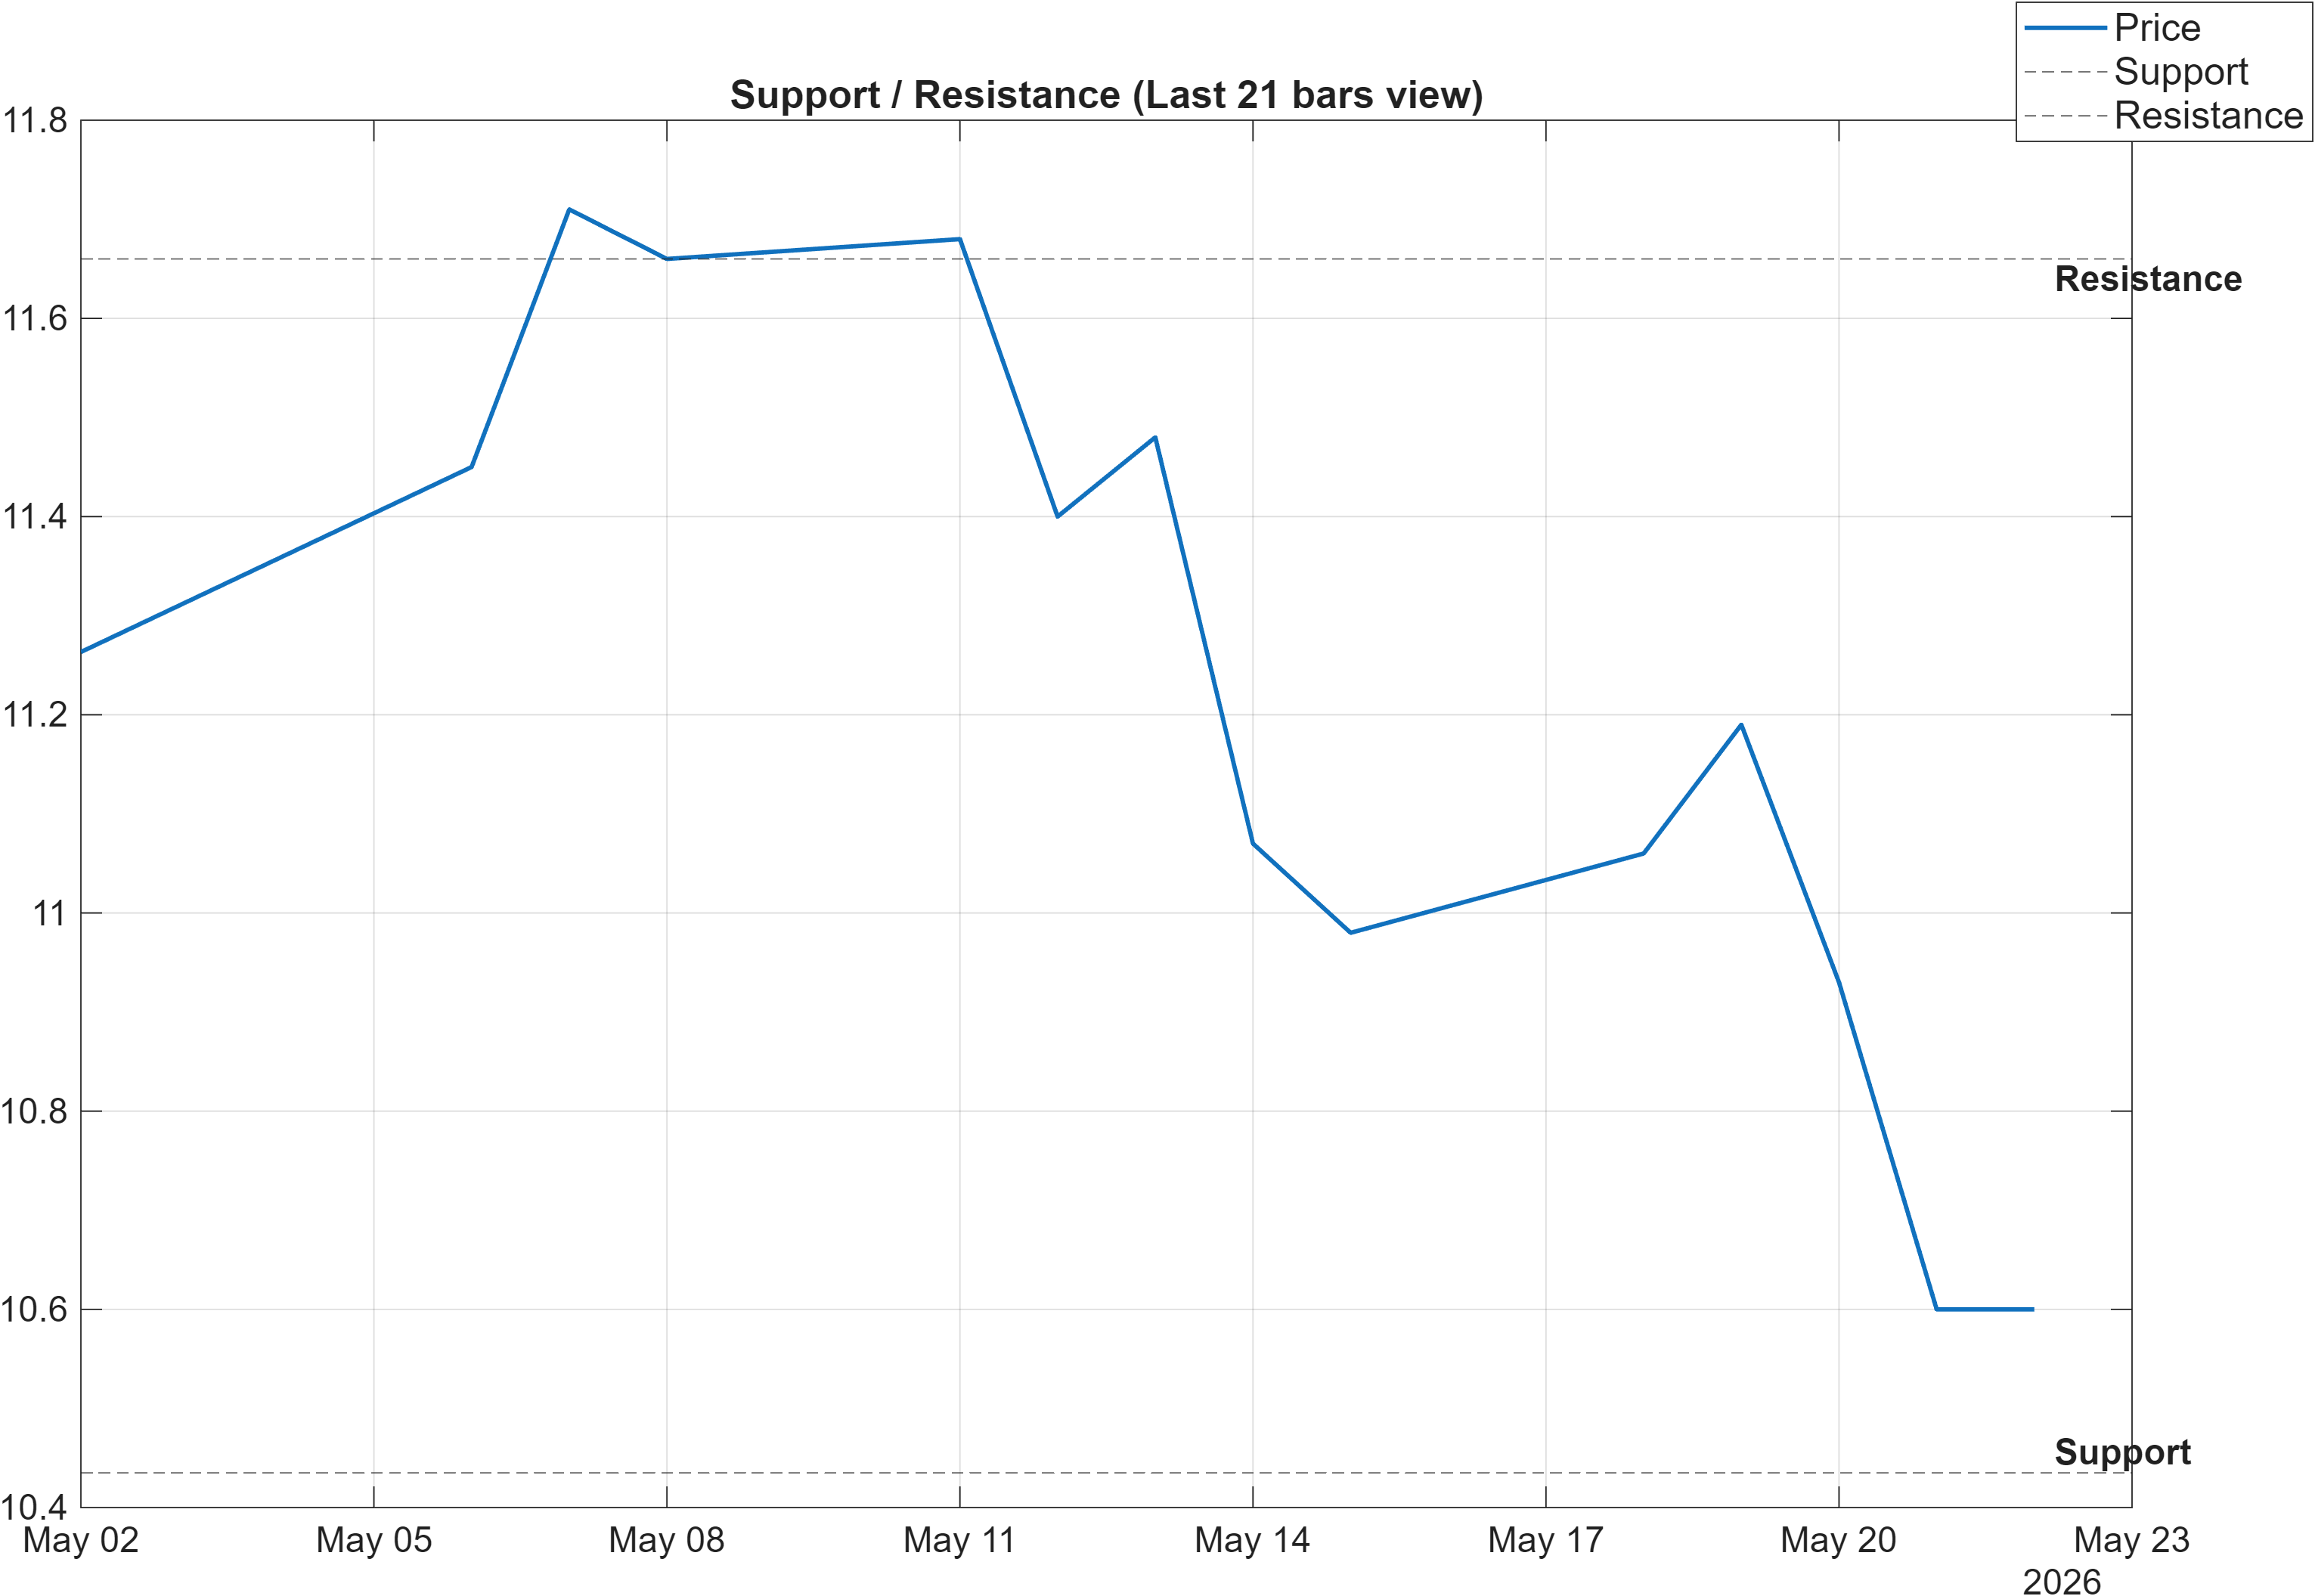
The current map is straightforward: 10.4350 defines the primary downside decision zone, while 11.6600 is the nearest level that must be reclaimed to reduce bearish pressure. In a bearish moving-average regime, support is not only a price floor; it is also a test of whether sellers can still force acceptance lower. A close below support would align with the mid-term rank weakness (monthly #1041) and extend the bearish technical narrative.
Resistance at 11.6600 functions as a validation threshold. The scenario framing calls for a break above resistance with volume to support continuation, which implicitly targets a shift from rejection (failed rallies) to acceptance (sustained trading above the level). Without that confirmation, rebounds can remain tactical and vulnerable to rollover, particularly while momentum remains soft (e.g., MACD histogram -0.0960).
These zones are most informative when paired with regime context. With bandwidth at 0.1227, the market is not in an ultra-compressed volatility state; that reduces (but does not eliminate) the probability that price will oscillate tightly around the level without resolving. In practice, the highest-information signals tend to come from how price behaves after a level is touched: quick rejections and weak follow-through are consistent with bearish control, while repeated tests that hold and attract participation can mark stabilization. Given the mixed long-horizon rank strength (yearly #222) against mid-term weakness, the support/resistance framework serves as the primary arbiter of whether this is a controlled pullback or a deeper deterioration.
5) Quant Technical Dashboard (18 Signals)
KGNAI AI Technical Analysis Score (Deep Reinforcement Learning): Rank #921 out of 1292 (Rank 1 represents the strongest technical positioning and a higher probability of favorable price behavior. As ranks increase toward the maximum, the probability of favorable outcomes weakens and bearish positioning becomes more dominant.) | Label: Neutral | Score: -0.426
18-Signal Technical Confluence Score: -0.444 (Bearish)
Overall Technical Score (18-signal confluence + DRL rank blend): -0.439 (Bearish)
Note: The blended score reflects signal strength weighted against broader AI technical ranking, which may temporarily diverge.
Blended technical score breakdown: -0.439 (Bearish | Bull 4 / Bear 12 / Neutral 2)
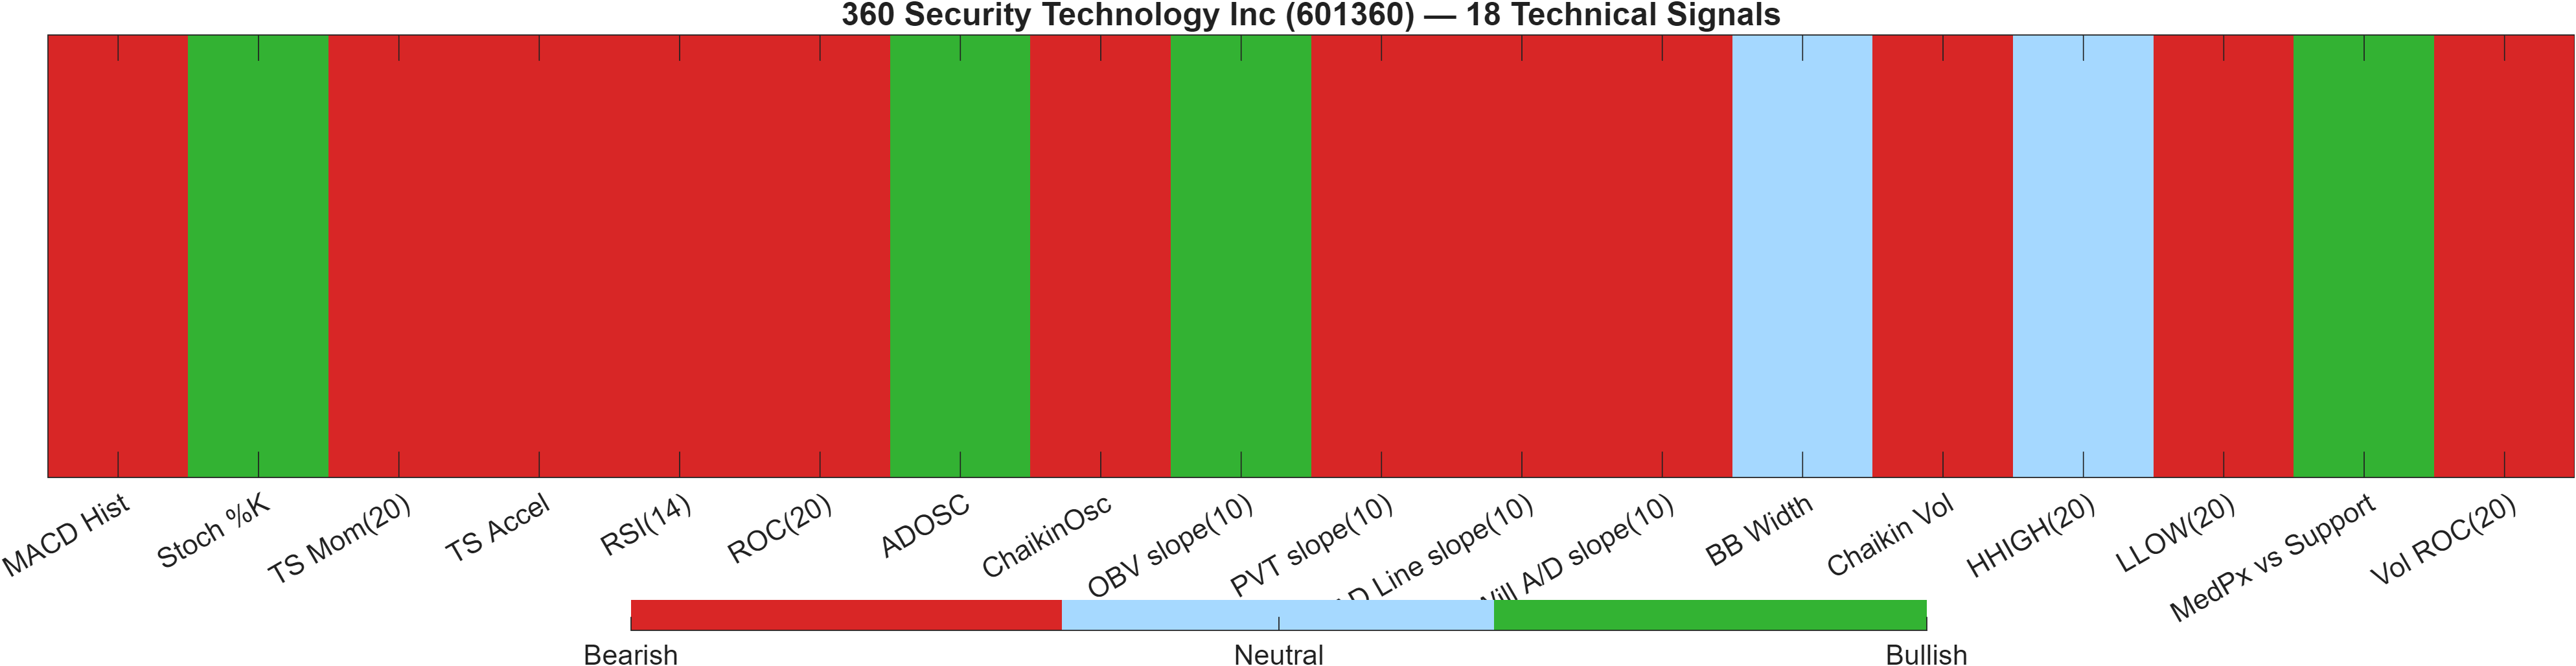
The dashboard shows a bearish majority across the signal set: the blended breakdown is Bear 12 / Bull 4 / Neutral 2, producing a confluence score of -0.444 and an overall technical score of -0.439. This is not a marginal call; the negative skew indicates multiple independent indicators are pointing in the same direction, which often increases the reliability of the technical bias—while still requiring level-based confirmation for execution.
A key nuance is the relationship between the confluence layer and the separate AI technical rank layer. The Deep Reinforcement Learning technical rank is #921 with a Neutral label, while the blended score remains bearish (-0.426 DRL score feeding into the -0.439 overall). That divergence suggests the broader pattern-recognition model is less decisive than the raw indicator stack—often observed when markets are potentially transitioning, with some features stabilizing while classic momentum/volume measures still lag.
Indicator highlights reinforce why the confluence is negative: RSI(14) at 18.45 and MACD histogram at -0.09601 both reflect weak momentum, while the volume/participation subset is mixed (e.g., OBV slope(10) bullish, but Vol ROC(20) at -20.89 bearish). This internal split matters: if price approaches 10.4350 and participation improves, the bearish confluence can soften without immediately flipping bullish. Until then, the dashboard implies that rallies should be evaluated for quality (breadth and follow-through) rather than assumed to be durable solely because of oversold readings.
Signal table (Bull/Bear/Neutral)
| Indicator | Value | Signal |
|---|---|---|
| MACD Hist | -0.09601 | Bearish |
| Stoch %K | 4.587 | Bullish |
| TS Mom(20) | -0.71 | Bearish |
| TS Accel | -1.03 | Bearish |
| RSI(14) | 18.45 | Bearish |
| ROC(20) | -6.278 | Bearish |
| ADOSC | 16.67 | Bullish |
| ChaikinOsc | -1.161e+08 | Bearish |
| OBV slope(10) | 4.552e+07 | Bullish |
| PVT slope(10) | -7.297e+06 | Bearish |
| AD Line slope(10) | -2.85e+08 | Bearish |
| Will A/D slope(10) | -0.66 | Bearish |
| BB Width | 0.1227 | Neutral |
| Chaikin Vol | 31.5 | Bearish |
| HHIGH(20) | 12.1 | Neutral |
| LLOW(20) | 10.55 | Bearish |
| MedPx vs Support | 0.415 | Bullish |
| Vol ROC(20) | -20.89 | Bearish |
Interpretation: Indicator-level signals form the base confluence, which is then adjusted using a separate AI-driven technical ranking model. The final technical score summarizes this combined view.
6) News sentiment + extractive gist
Note: Instrument-specific news matches were not found, so the digest includes broader market/sector headlines. Links are provided for verification.
Sentiment in the sampled coverage is mostly neutral, with an average score of -0.024 and a distribution of 94% neutral versus 6% negative (positive measured at 0%). This mix reads less like a catalyst-driven tape and more like a market where information flow is present but not yet forcing aggressive repricing. In that context, price is likely to be driven primarily by technical positioning—especially given the bearish confluence (-0.444) and weak momentum (e.g., RSI 18.45).
Positive Developments
Recent coverage across major financial outlets indicates a constructive undertone around continued institutional attention to AI-related governance and enforcement themes. While the digest is not instrument-specific, it does point to ongoing policy activity and legal frameworks that can shape how AI-adjacent sectors are discussed and valued. With sentiment overwhelmingly neutral rather than optimistic, “positive” here is best interpreted as reduced uncertainty through clearer rule-setting, not as a direct demand catalyst. For 601360, the market implication is indirect: clearer regulatory narratives can sometimes stabilize sector risk premia, which matters when the chart is attempting to base near Support ~10.4350. However, without a corresponding improvement in confirmation signals—such as a break above Resistance ~11.6600—any sentiment tailwind remains secondary to the dominant technical bias.
Neutral / Mixed Developments
The neutral skew (94%) suggests the information environment is currently non-committal. That tends to coincide with price action where technical levels act as the primary decision mechanisms and where volatility remains contained to moderate regimes (consistent with Bollinger Bandwidth 0.1227). Mixed policy commentary can also create alternating impulses—brief risk-on/risk-off reactions—without establishing a persistent trend. Under those conditions, the most practical approach is to treat sentiment as a backdrop and focus on whether the market can repair momentum (e.g., MACD histogram -0.0960 moving toward neutral) while holding key support.
Negative / Risk Signals
The negative slice (6%) is small but relevant because the technical state is already fragile. Risk signals in broader coverage tend to cluster around event risk and policy uncertainty, which can amplify downside moves when an asset is already in a bearish technical configuration (overall technical score -0.439). In a market where Close vs MA50 and MA50 vs MA200 are both bearish, even modest adverse sentiment can accelerate a move toward (and potentially through) the 10.4350 decision zone. With ranks mixed—particularly the contrast between the monthly #1041 and yearly #222—negative headlines are most consequential if they coincide with a technical failure (a close below support) rather than occurring in isolation.
- Whether price can hold above 10.4350 on retests while momentum stabilizes (RSI/MACD).
- Evidence of volume confirmation on any move toward/through 11.6600.
- Whether sentiment distribution remains mostly neutral or shifts away from 94% neutral.
Sources referenced: Reuters, Bloomberg, Yahoo Finance, MarketWatch, Investing.com
7) Sources
Not available in the provided data.
You may also like: How KGNAI AI ranks instruments across global markets
Disclaimer: KGNAI provides AI-generated analytics and educational market commentary only. This is not financial advice. Markets involve risk. Always do your own research.