
600905 — China Three Gorges New Energy Group Co Ltd (06-Mar-2026) | Mixed rank profile with bullish technical confluence
China Three Gorges New Energy Group Co Ltd (600905) enters 06-Mar-2026 with a split setup: the cross-sectional KGNAI ranks lean neutral in the near term but weaken on the monthly horizon, while the technical dashboard remains decisively constructive. Within a 1293-instrument China universe, the daily rank #861 and weekly rank #792 sit in the weaker half, yet the monthly rank #1161 pushes the mid-term view into a more defensive bucket. Against that, the model-driven technical layer is strong: the Deep Reinforcement Learning technical rank is #71 with a 0.890 score, and the 18-signal blend holds a 0.734 bullish reading. Price is framed by tight decision levels—support ~4.0764 and resistance ~4.1950—with momentum indicators (including MACD histogram 0.0161 and RSI(14) 90.18) signaling strength that can also increase reversal sensitivity near resistance.
Key Takeaways
- Rank stance (Short / Mid / Long): Neutral (daily #861; weekly #792) / Bearish (monthly #1161) / Not available in the provided data.
- Technical confluence: Bullish (overall technical score 0.734; DRL rank #71, score 0.890)
- Key levels: Support ~4.0764 | Resistance ~4.1950
- News sentiment bias: Slightly negative/mostly neutral (avg -0.026; 88% neutral; 12% negative; overall news score -0.03)
- Confirmation / invalidation condition: A break above 4.1950 with volume supports continuation; a close below 4.0764 increases deterioration risk.
What KGNAI Measures
KGNAI evaluates assets using large cross-sectional datasets built from millions of structured data points. Inputs incorporate fundamental metrics, technical structures, and systematically processed news sentiment. Statistical models, machine learning, and AI frameworks are used to assess relative positioning, signal alignment, and probabilistic behavior across broad universes.
How to Read This Report
- Ranks are comparative across the tracked universe, not absolute price targets.
- Confluence reflects alignment among independent signal groups.
- Support/resistance levels are probabilistic decision zones, not guarantees.
- Sentiment provides contextual bias within the broader analytical framework.
1) KGNAI AI Analysis
Region: CHINA
Total universe size: 1293 ranked instruments
- Daily rank: #861 out of 1293 — Neutral
- Weekly rank: #792 out of 1293 — Neutral
- Monthly rank: #1161 out of 1293 — Bearish
- 3-Monthly rank: Not available for this horizon — Not available
- 6-Monthly rank: Not available for this horizon — Not available
- Yearly rank: Not available for this horizon — Not available
The rank stack highlights a time-horizon divergence. On faster horizons, 600905 sits in the weaker half of the tracked universe (daily #861, weekly #792 out of 1293), consistent with a Neutral short-term categorization. The monthly rank deteriorates to #1161, moving the mid-term classification to Bearish, which typically implies that recent behavior has been less favorable versus peers when evaluated through the same standardized tests.
This is a classic setup where cross-sectional pressure can coexist with improving chart-based structure. Ranks are not single-indicator calls; they compress multiple tests into a relative measure. Here, the short-term neutrality paired with a weak monthly rank suggests the market may be rewarding a recent move, but the broader peer-relative profile has not yet repaired on the mid-term horizon. Long-horizon ranks (3-month, 6-month, yearly) are Not available in the provided data, limiting regime attribution beyond the monthly window.
Term view: Short-term: Neutral. Mid-term: Bearish. Long-term: Not available.
Want the full universe and complete rank tables? Unlock full access on KGNAI: https://www.kgnai.com/pricing
2) Price & trend overview
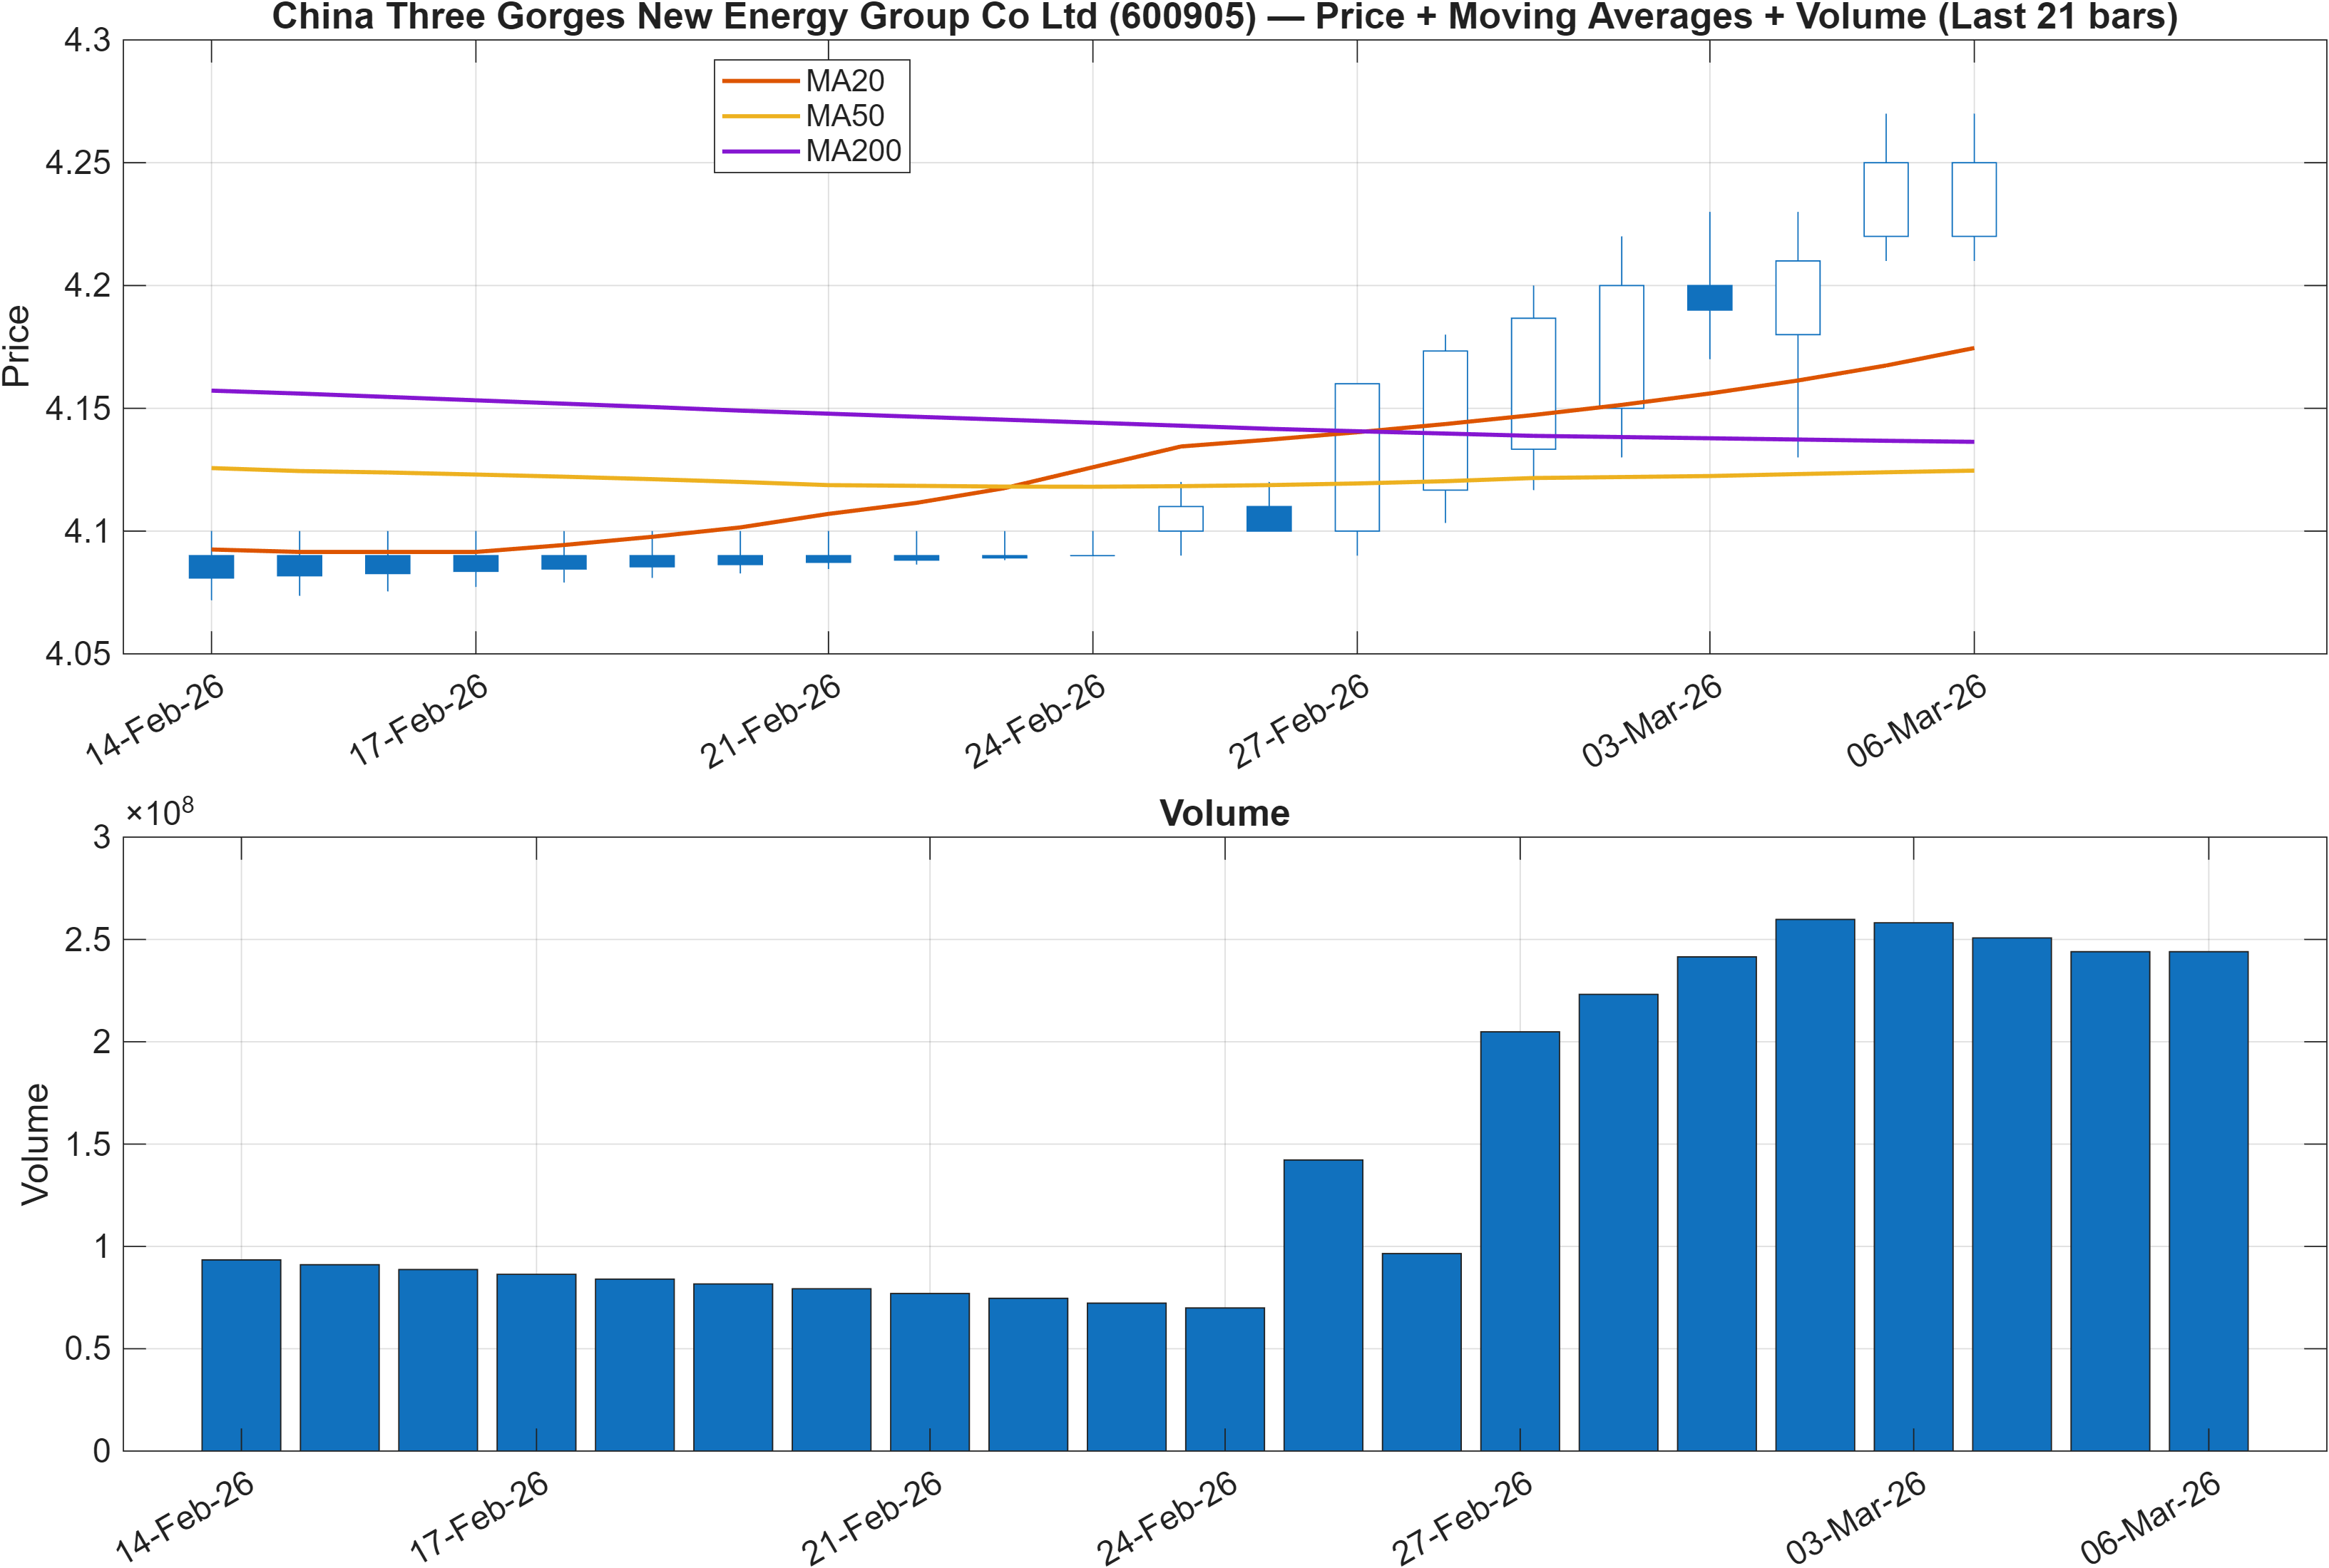
Interpretation: Close vs MA50 = Bullish, MA50 vs MA200 = Bearish.
Trend state: short-term traction vs longer-term drag
The moving-average readthrough defines a two-speed trend. The close is positioned above the MA50 (bullish on the short/intermediate tape), while the MA50 remains below the MA200 (bearish on the longer trend filter). In practice, this combination often occurs during recovery phases where price has improved faster than longer-term trend measures can re-anchor.
The broader report reinforces that tension: the ranks are Neutral on daily/weekly horizons (daily #861, weekly #792), but turn materially weaker on the monthly horizon (#1161). When price is above MA50 but the MA50/MA200 relationship remains bearish, the market frequently becomes more sensitive to level-based validation—particularly nearby support/resistance, here identified as 4.0764 and 4.1950.
A constructive read is that the trend structure is attempting to transition, but has not yet achieved full confirmation. That puts added emphasis on whether price can maintain strength without losing the nearby structural floor. The short-term technical engines (seen later via DRL rank #71 and blended technical score 0.734) argue that current tape behavior has improved; the longer MA relationship argues that trend repair is incomplete.
3) Momentum & volatility dashboard
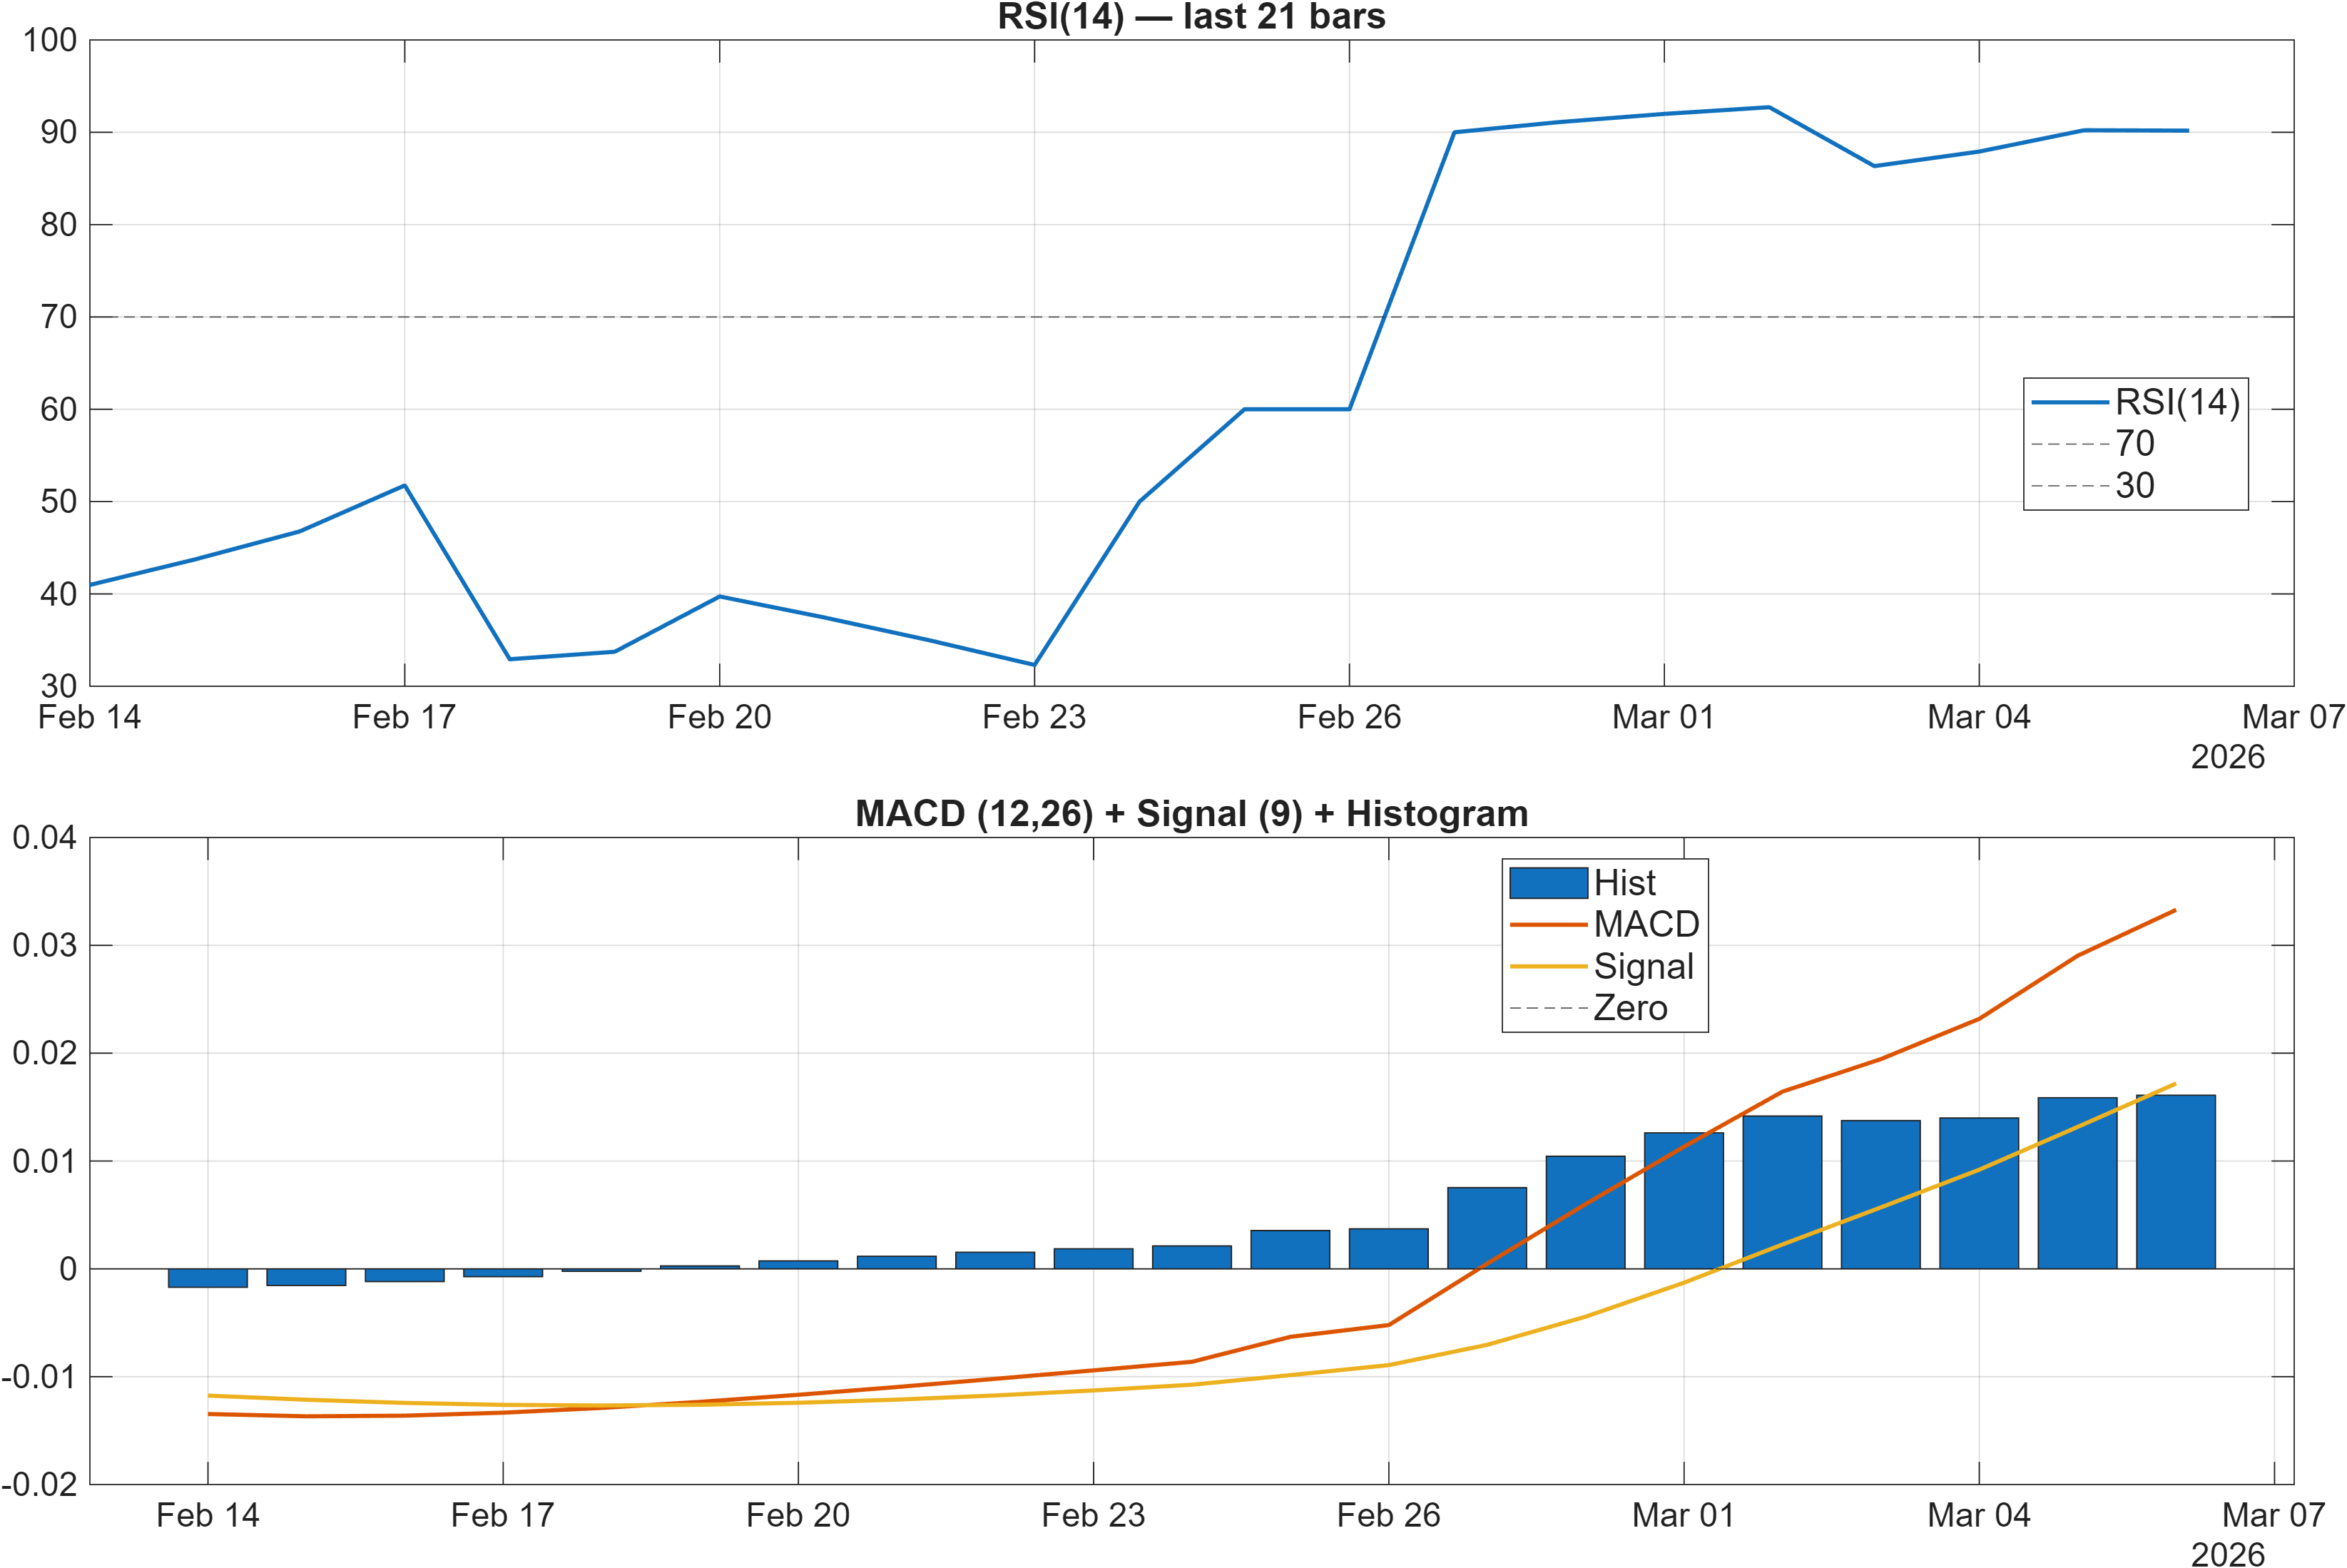
Interpretation: RSI bias = Bullish, MACD hist = 0.0161.
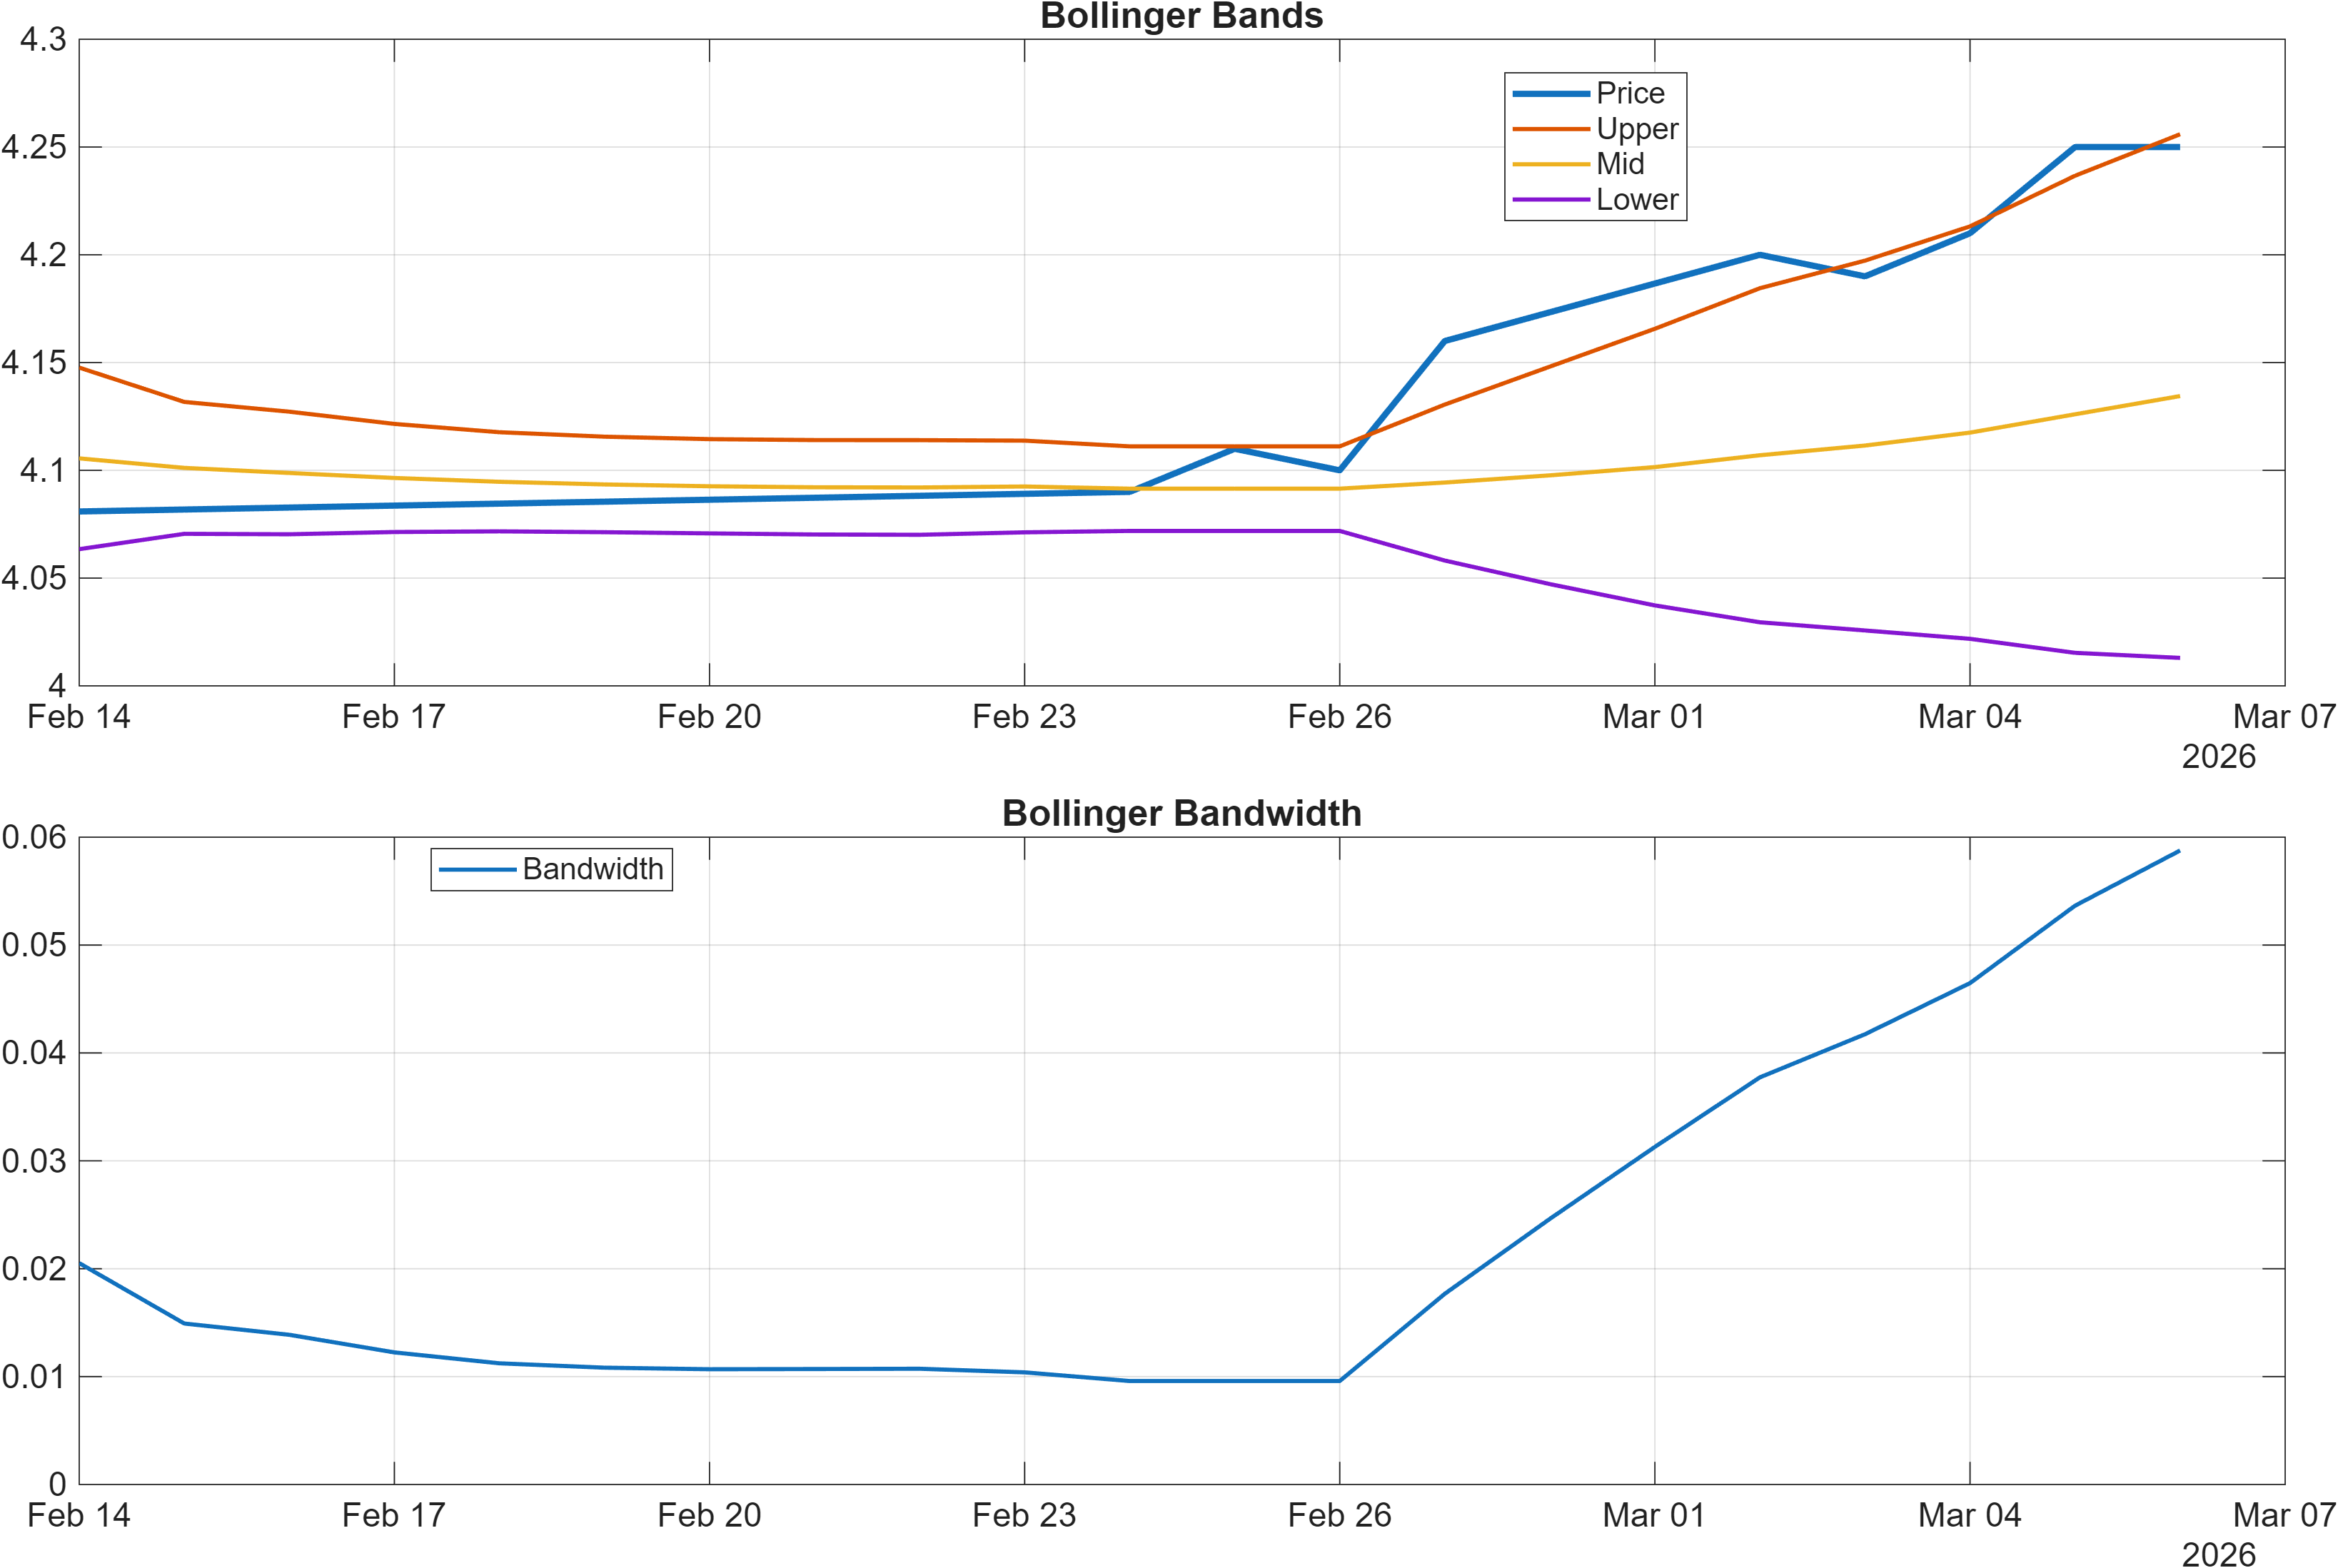
Interpretation: Bandwidth (volatility regime) latest = 0.0588.
Momentum strength with elevated reversal sensitivity
Momentum signals skew strongly constructive. The MACD histogram at 0.0161 indicates positive momentum pressure, and the dashboard marks the RSI bias as Bullish with RSI(14) at 90.18. That RSI reading is unusually high, which can coincide with strong trend impulses—but it also tends to compress the margin for error if price meets nearby resistance.
Volatility conditions look comparatively contained. The Bollinger bandwidth is 0.0588 (with BB Width shown as 0.05877 in the signal table), implying a relatively tight regime versus high-expansion environments. When momentum is strong while bandwidth remains modest, the market can experience directional drift punctuated by sharp mean-reversion events rather than persistent, broad-range swings.
Internally, momentum and participation measures also lean supportive: ROC(20) is 4.12 and TS Mom(20) is 0.1682, aligning with a positive impulse backdrop. The main caution flag inside the momentum cluster is the Stoch %K at 88.89 printing a bearish signal, which often reflects near-term overextension rather than a confirmed trend break. With resistance at 4.1950 and support at 4.0764, the key is whether strong momentum can translate into acceptance above resistance without triggering a volatility expansion that reverses back through the range.
4) Support / Resistance zones
Support ~ 4.0764 | Resistance ~ 4.1950
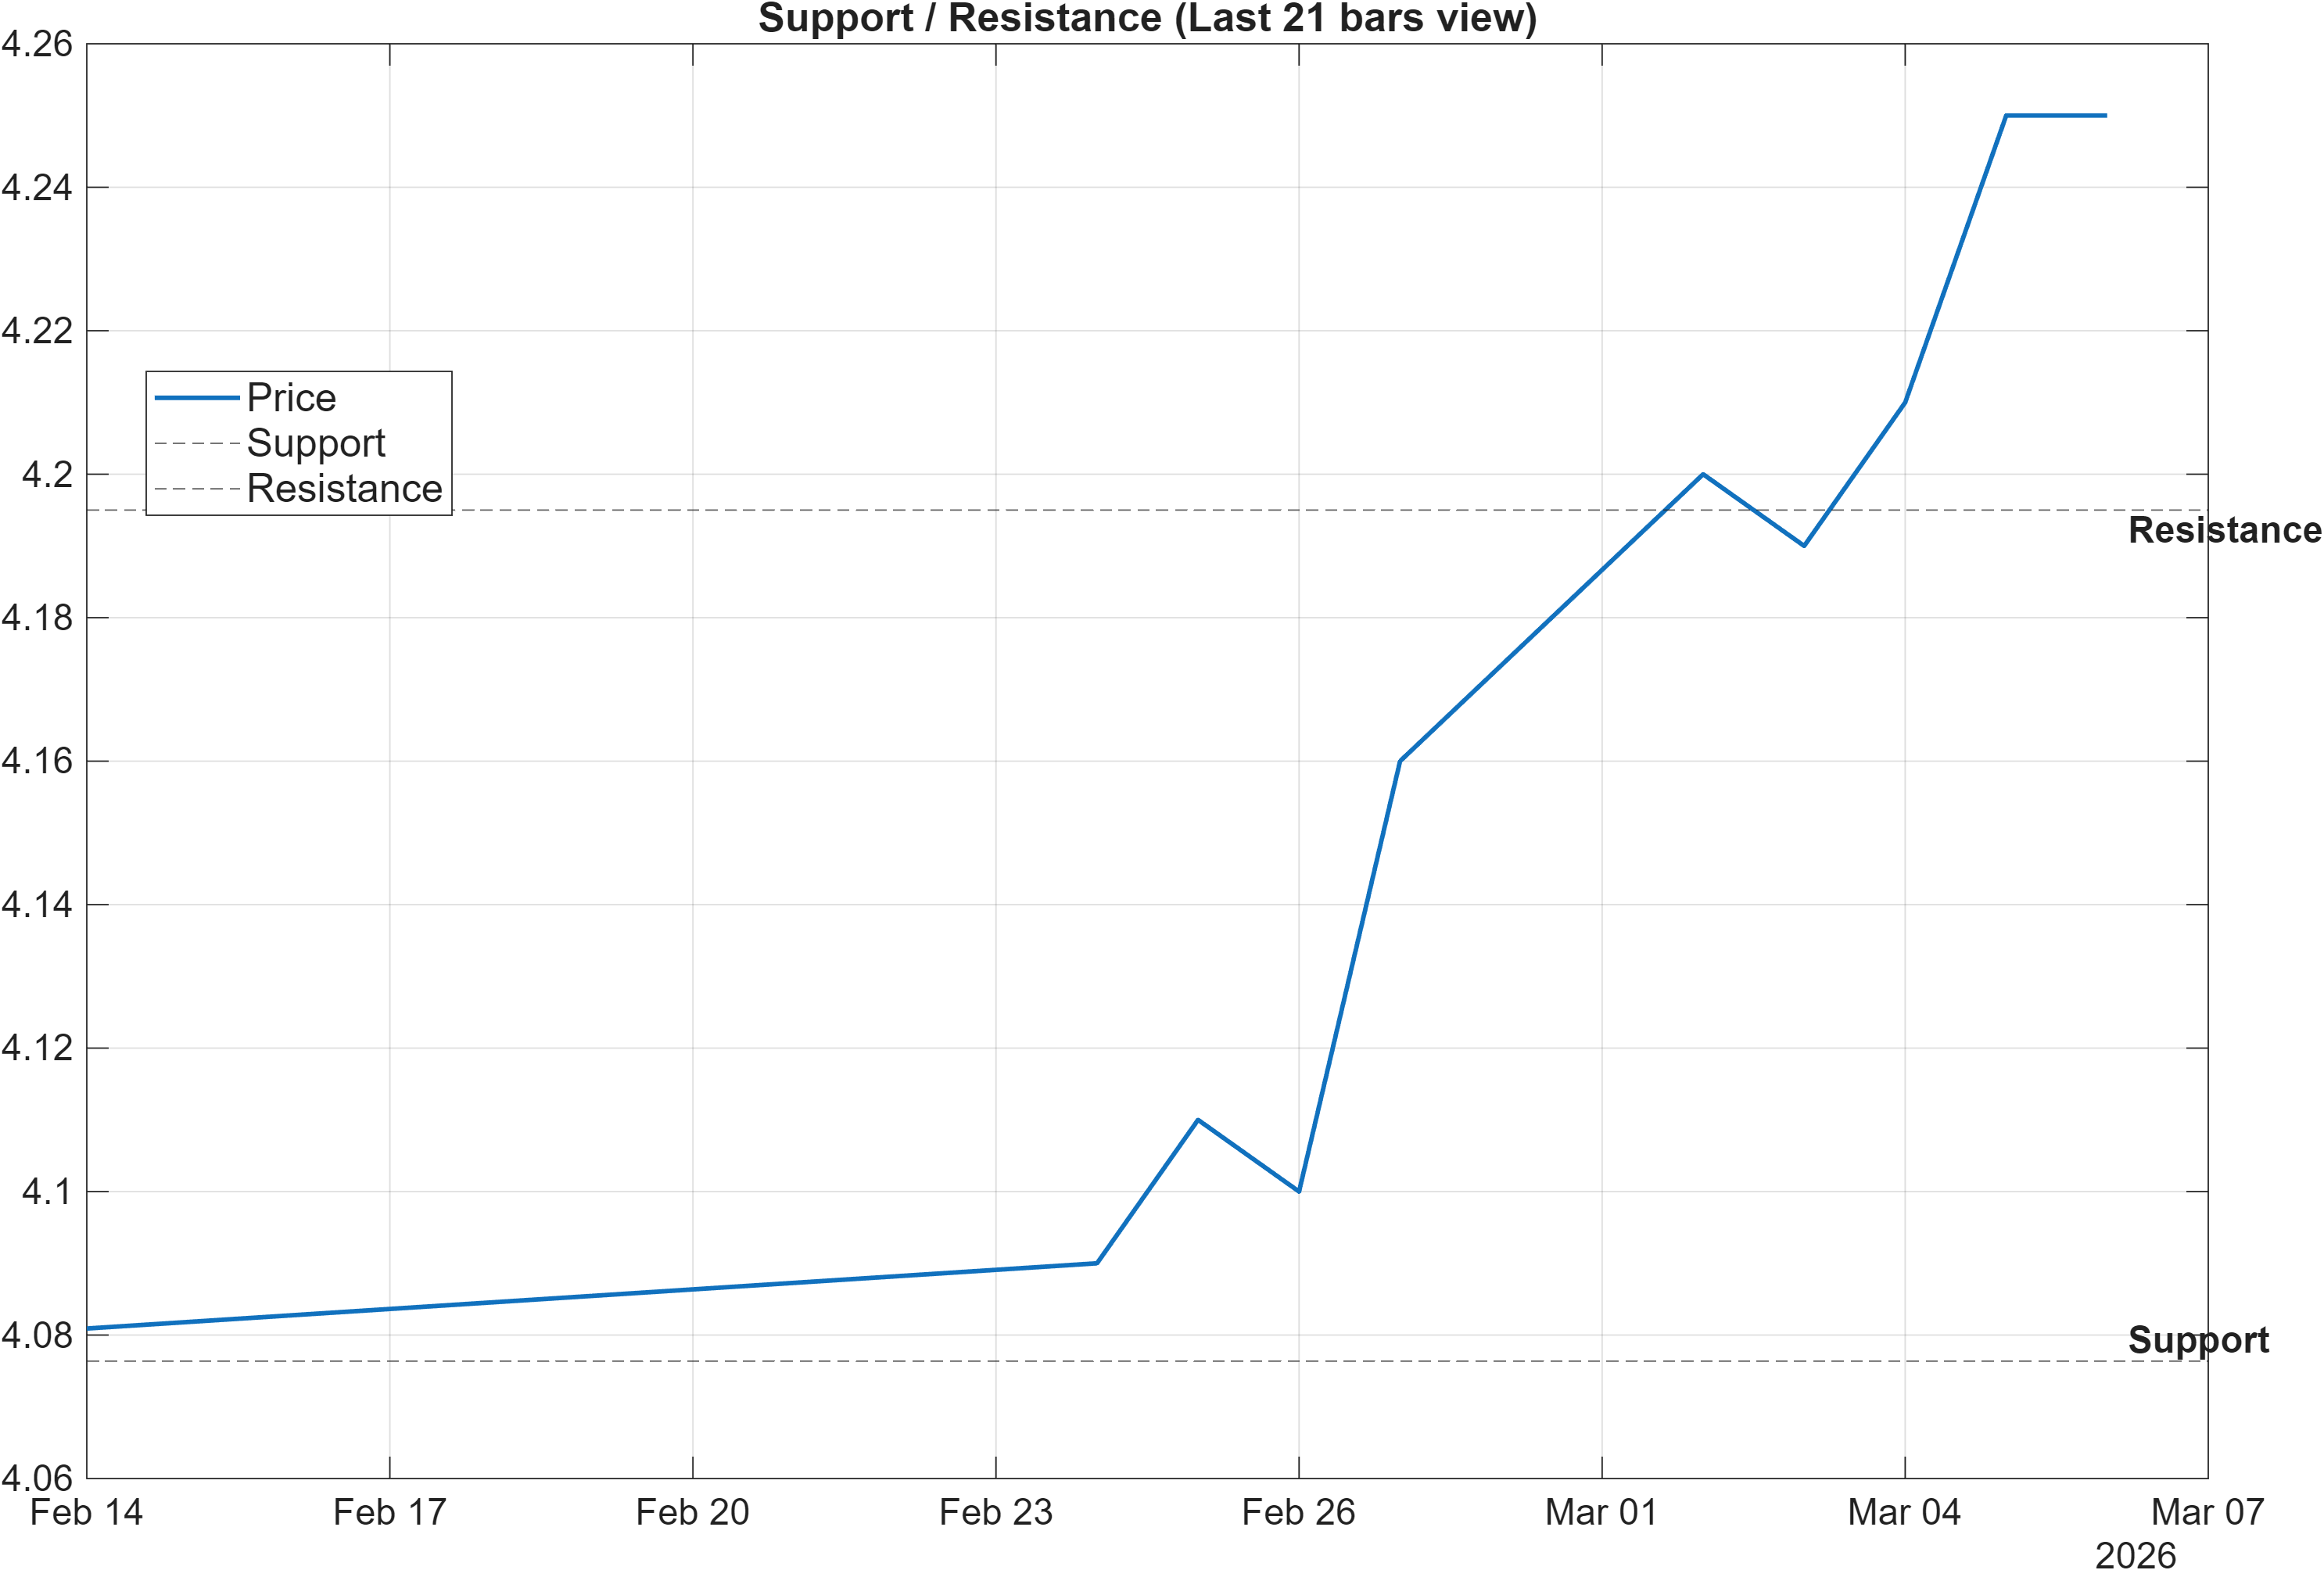
Scenario view: Break above resistance with volume → continuation. Close below support → signal deterioration risk.
Decision zones: tight range, high informational value
The defined range is tight and therefore informational. With support ~4.0764 and resistance ~4.1950, the market is working with a narrow decision corridor where closes and volume behavior can rapidly shift the interpretation from consolidation to breakout, or from pullback to deterioration.
Several internal signals validate the importance of these zones. The signal table includes LLOW(20) at 4.074 (neutral), effectively reinforcing the support region as a nearby structural floor, while HHIGH(20) at 4.27 (bullish) suggests there is room above the current resistance if acceptance develops. In addition, MedPx vs Support at 0.1636 is flagged bullish, consistent with price sitting meaningfully above the identified base.
Given the RSI(14) at 90.18 and Stoch %K at 88.89, the upper boundary at 4.1950 matters not only as resistance but as an overextension checkpoint. If a break occurs without follow-through (or with fading participation), the market can revert quickly back toward the midpoint of the range. Conversely, maintaining closes above support while the technical composite remains bullish (overall technical score 0.734) supports the view that pullbacks are being absorbed rather than compounding into a trend failure.
5) Quant Technical Dashboard (18 Signals)
KGNAI AI Technical Analysis Score (Deep Reinforcement Learning): Rank #71 out of 1293 (Rank 1 represents the strongest technical positioning and a higher probability of favorable price behavior. As ranks increase toward the maximum, the probability of favorable outcomes weakens and bearish positioning becomes more dominant.) | Label: Bullish | Score: 0.890
18-Signal Technical Confluence Score: 0.667 (Bullish)
Overall Technical Score (18-signal confluence + DRL rank blend): 0.734 (Bullish)
Note: The blended score reflects signal strength weighted against broader AI technical ranking, which may temporarily diverge.
Blended technical score breakdown: 0.734 (Bullish | Bull 14 / Bear 2 / Neutral 2)
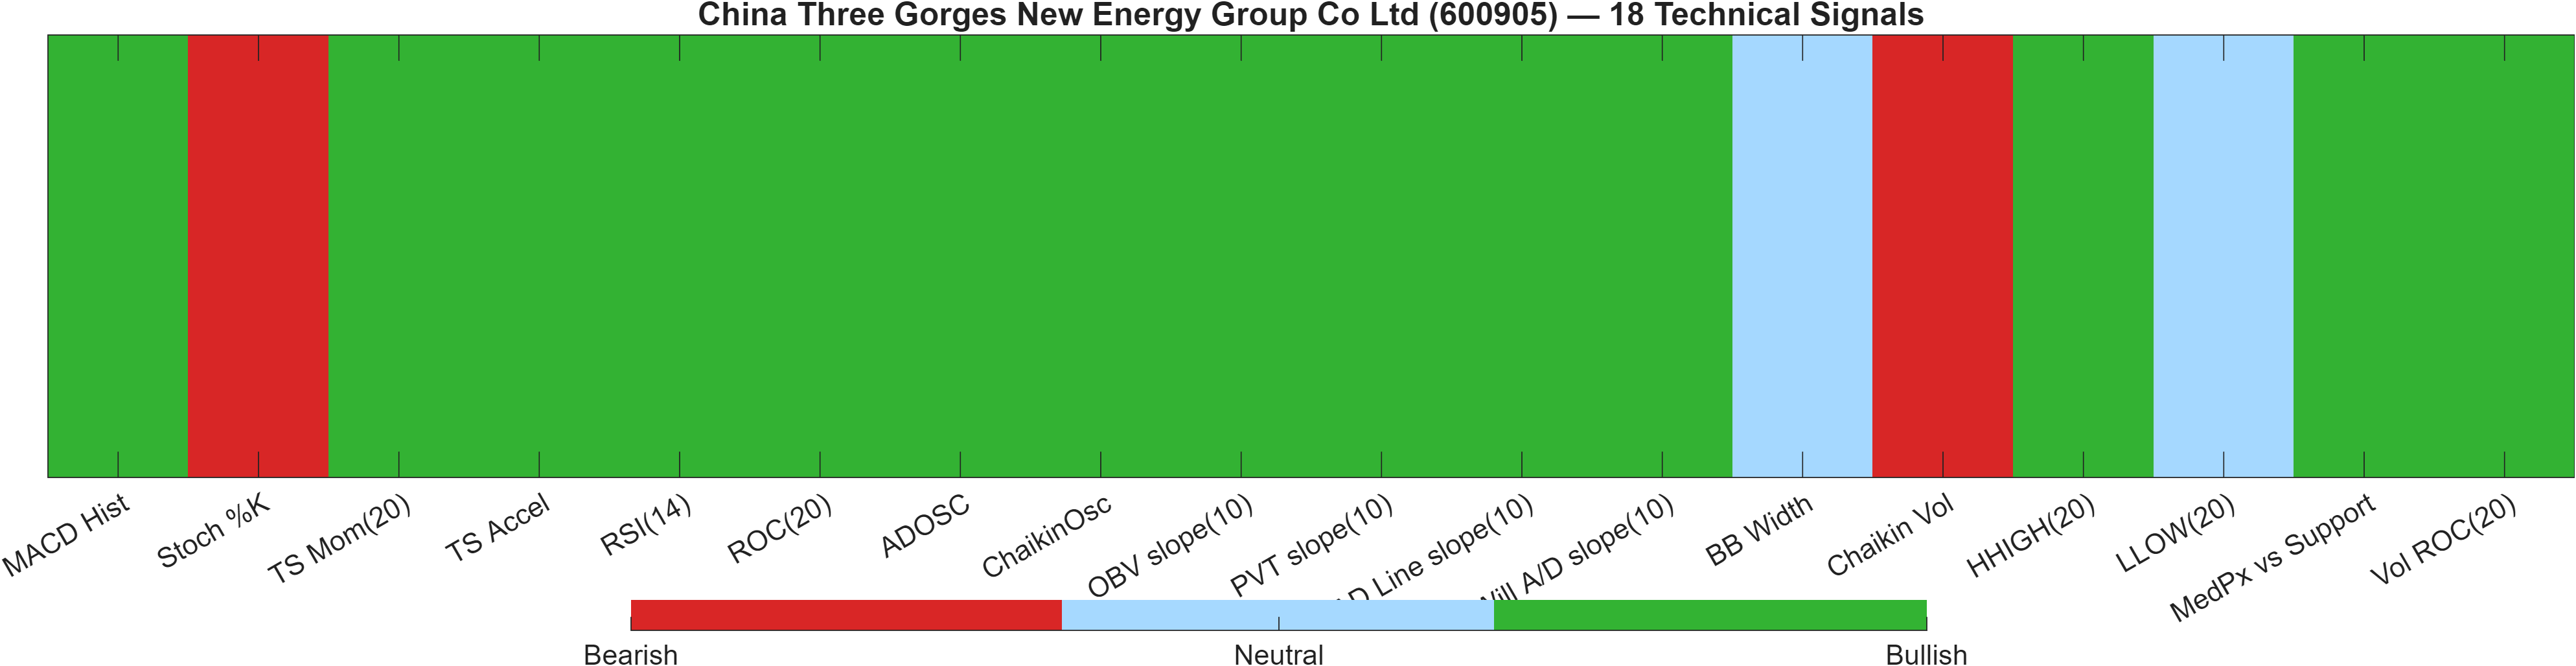
Signal alignment: breadth is bullish, but watch the “overheat” cluster
| Indicator | Value | Signal |
|---|---|---|
| MACD Hist | 0.0161 | Bullish |
| Stoch %K | 88.89 | Bearish |
| TS Mom(20) | 0.1682 | Bullish |
| TS Accel | 0.2164 | Bullish |
| RSI(14) | 90.18 | Bullish |
| ROC(20) | 4.12 | Bullish |
| ADOSC | 75 | Bullish |
| ChaikinOsc | 2.3e+08 | Bullish |
| OBV slope(10) | 1.212e+09 | Bullish |
| PVT slope(10) | 8.673e+06 | Bullish |
| AD Line slope(10) | 8.757e+08 | Bullish |
| Will A/D slope(10) | 0.36 | Bullish |
| BB Width | 0.05877 | Neutral |
| Chaikin Vol | 214.7 | Bearish |
| HHIGH(20) | 4.27 | Bullish |
| LLOW(20) | 4.074 | Neutral |
| MedPx vs Support | 0.1636 | Bullish |
| Vol ROC(20) | 168 | Bullish |
The technical stack is unusually cohesive: the 18-signal confluence score is 0.667 and the blended overall technical score is 0.734, with 14 bullish, 2 bearish, and 2 neutral signals. The DRL technical rank (#71 out of 1293, score 0.890) further supports the idea that recent price behavior has improved relative to a broad peer set.
The critical nuance is where the bearish signals sit. A bearish Stoch %K (88.89) combined with a very high RSI(14) (90.18) can be read as an “overheat cluster”: momentum remains positive (e.g., MACD histogram 0.0161), but the probability of short, sharp pullbacks increases—especially as price approaches the defined resistance at 4.1950. At the same time, participation measures (e.g., OBV slope(10) 1.212e+09 and Vol ROC(20) 168) point to demand-side confirmation rather than a hollow move.
Interpretation: Indicator-level signals form the base confluence, which is then adjusted using a separate AI-driven technical ranking model. The final technical score summarizes this combined view.
6) News sentiment + extractive gist
Note: Instrument-specific news matches were not found, so the digest includes broader market/sector headlines. Links are provided for verification.
Sentiment score (avg): -0.026 | Positive: 0% | Neutral: 88% | Negative: 12%
KGNAI AI News Sentiment Score (normalized -1 to +1): Not available (as of —) | Label: Not available | Overall news score: -0.03
Positive Developments
Recent coverage across major financial outlets has been broadly constructive in tone at the macro and cross-asset level rather than company-specific. The distribution is dominated by neutrality (88% neutral), which can be supportive for technical price formation by reducing the chance of headline-driven volatility shocks. While the average sentiment is slightly negative (-0.026), the absence of instrument-matched news means the “positive” contribution is best interpreted as a lack of direct adverse catalysts rather than affirmative fundamental developments. In this context, market participants often defer more heavily to observable price/volume behavior. That aligns with the report’s technical profile: a bullish blended technical score (0.734) and a strong DRL technical rank (#71) can dominate near-term decision-making when news flow is generalized and not issuer-specific.
Neutral / Mixed Developments
The news signal is primarily a context filter here, not a driver. With positive at 0% and negative at 12%, the net effect is a mild drag (overall news score -0.03) but not an extreme risk-off reading. Because the feed is sector/broader-market oriented, it can still influence risk appetite and volatility in the aggregate, which may matter given the tight structural range between 4.0764 support and 4.1950 resistance. In mixed environments, the market often treats resistance tests as “prove it” levels; momentum can remain strong, but acceptance above a key boundary tends to require cleaner participation and follow-through.
Negative / Risk Signals
The negative slice (12%) is modest, but it is directionally consistent with the slightly negative average sentiment (-0.026). For 600905, the main risk is not a specific issuer headline (not available in the provided data), but a macro-driven volatility impulse that interrupts the current momentum profile. This matters because internal technical readings are extended—RSI(14) at 90.18 and bearish Stoch %K at 88.89 increase sensitivity to abrupt reversals, particularly near resistance at 4.1950. If broader risk tone deteriorates, extended momentum setups can unwind quickly back toward support (4.0764) without requiring a change in the longer-term rank structure.
- What to monitor next: Whether sentiment remains mostly neutral (88%) or shifts toward a higher negative share from 12%.
- What to monitor next: Price behavior at 4.1950 under changing headline intensity (break/hold vs rejection).
- What to monitor next: Any emergence of instrument-specific coverage (currently not available in the provided data).
Snapshot: AI Rank (Short–Mid–Long): Mixed (Neutral–Bearish–Not available) · Technical Confluence: Bullish · Key Levels: Support ~4.08 | Resistance ~4.20 · News Sentiment: Neutral
Sources referenced: Reuters, Bloomberg, Yahoo Finance, MarketWatch, Investing.com
7) Sources
The source list in the base draft contains multiple external links. Per KGNAI editorial format, the news section above is presented as an aggregated digest without reproducing headline lists or outbound URLs.
You may also like: How KGNAI AI ranks instruments across global markets
Disclaimer: KGNAI provides AI-generated analytics and educational market commentary only. This is not financial advice. Markets involve risk. Always do your own research.