
Daqin Railway Co Ltd (601006) — 01-May-2026 Technical & Rank View Shows Long-Term Strength With Short-Term Fragility
Daqin Railway Co Ltd (601006) presents a mixed cross-horizon profile as of 01-May-2026: the short-term rank is weak (daily rank #1118 out of 1292), while the long-term ranking remains constructive (6-month rank #89; yearly rank #111). Technically, the chart-based trend read is supportive—Close vs MA50 = Bullish and MA50 vs MA200 = Bullish—yet the broader technical stack is not fully synchronized, with an 18-signal confluence score of 0.278 (Neutral) and a blended overall technical score of 0.051 (Neutral). Momentum signals are restrained rather than directional (RSI(14) 52.38; MACD histogram 0.0039), and volatility remains contained (Bollinger bandwidth 0.0373). With support near 5.1638 and resistance near 5.4033, the near-term decision zone is well-defined: price acceptance above resistance would strengthen continuation conditions, while a close below support would increase deterioration risk under already-soft short-term ranking.
- Rank stance: Short-term Bearish (daily #1118/1292) | Mid-term Neutral (weekly #337; monthly #404) | Long-term Bullish (6-month #89; yearly #111)
- Technical confluence: Neutral (18-signal score 0.278; blended 0.051)
- Key levels: Support ~ 5.1638 | Resistance ~ 5.4033
- News sentiment bias: Neutral (avg sentiment -0.013; Positive 12% / Neutral 69% / Negative 19%)
- Confirmation / invalidation condition: Break above 5.4033 with volume supports continuation; close below 5.1638 increases deterioration risk.
KGNAI evaluates assets using large cross-sectional datasets built from millions of structured data points. Inputs incorporate fundamental metrics, technical structures, and systematically processed news sentiment. Statistical models, machine learning, and AI frameworks are used to assess relative positioning, signal alignment, and probabilistic behavior across broad universes.
- Ranks are comparative across the tracked universe, not absolute price targets.
- Confluence reflects alignment among independent signal groups.
- Support/resistance levels are probabilistic decision zones, not guarantees.
- Sentiment provides contextual bias within the broader analytical framework.
1) KGNAI AI Analysis
Region: CHINA
Total universe size: 1292 ranked instruments
- Daily rank: #1118 out of 1292 — Bearish
- Weekly rank: #337 out of 1292 — Neutral
- Monthly rank: #404 out of 1292 — Neutral
- 3-Monthly rank: #364 out of 1292 — Neutral
- 6-Monthly rank: #89 out of 1292 — Bullish
- Yearly rank: #111 out of 1292 — Bullish
The rank stack for 601006 is best read as a regime split across horizons. Daily positioning sits in the lower tier of the universe (rank #1118), which is consistent with short-horizon fragility or mean-reversion risk. In contrast, the 6-month and yearly ranks (#89 and #111) remain in the upper decile region of the tracked set, suggesting the longer-run behavior profile has been more resilient than the most recent daily window implies.
Mid-horizon ranks are notably compressed around neutral (weekly #337; monthly #404; 3-month #364). That clustering matters: it indicates that while the longer-term profile is still constructive, the intermediate windows are not uniformly confirming strong upside skew. This is often the “hinge” state where small changes in participation and trend persistence can meaningfully tilt the multi-period view.
The practical implication is an asymmetric monitoring problem: long-horizon ranks provide a supportive backdrop, but the daily weakness increases the probability that any breakout attempt lacks durability unless reinforced by broader signal alignment. In this report, the later technical sections show a neutral blended technical score (0.051) and contained volatility (bandwidth 0.0373), which aligns with the idea that the market is not currently expressing a strong consensus trend impulse despite supportive long-run ranks.
Term view: Short-term: Bearish. Mid-term: Neutral. Long-term: Bullish.
Want the full universe and complete rank tables? Unlock full access on KGNAI: https://www.kgnai.com/pricing
2) Price & trend overview
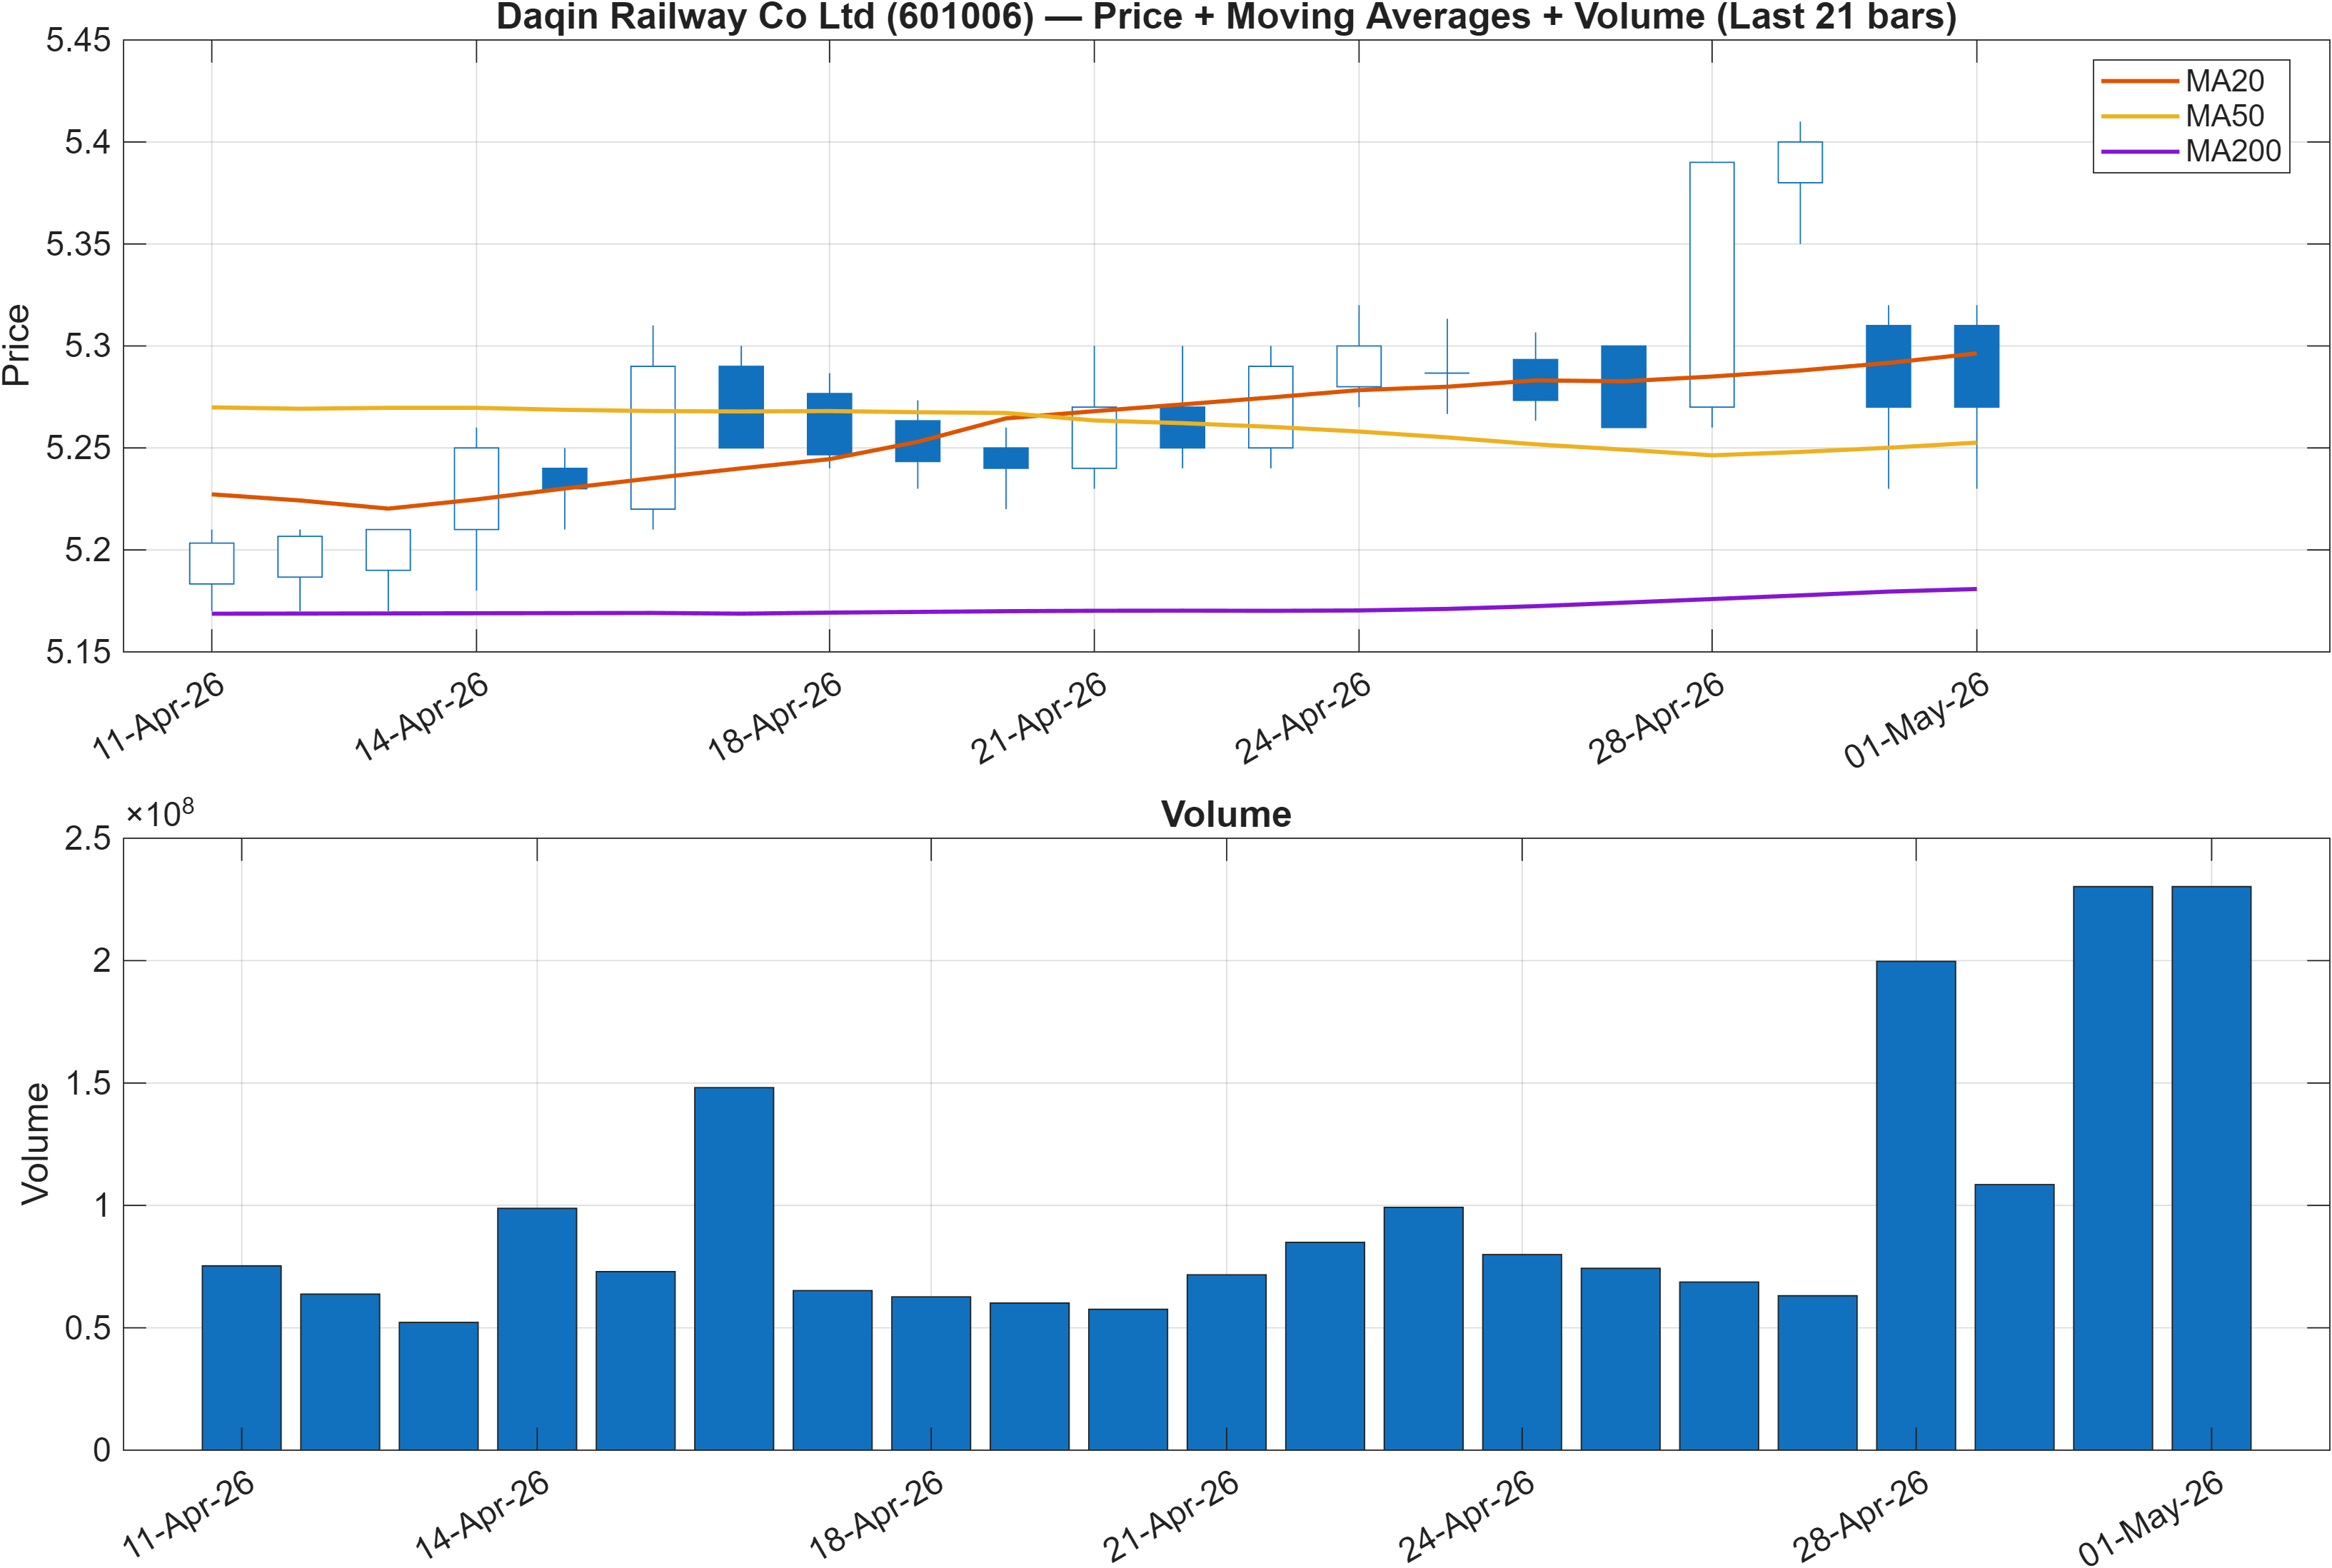
The trend layer is constructive on the two core moving-average tests: Close vs MA50 = Bullish and MA50 vs MA200 = Bullish. This combination typically indicates that the market is trading above its intermediate baseline while the intermediate baseline remains above the long baseline—an arrangement consistent with an established uptrend framework rather than a late-cycle rebound.
The key analytical tension is that this bullish trend scaffolding is occurring alongside a weak daily rank (#1118), implying that the most recent behavior has not matched the longer-run structure. When that divergence appears, the price chart often becomes sensitive to confirming participation—not just direction. In the dashboard later, some volume/flow measures are constructive (e.g., ADOSC 27.78; AD Line slope(10) 1.357e+08), while others are adverse (OBV slope(10) -3.396e+07; PVT slope(10) -3.414e+05), which is consistent with a market that is trending but not uniformly “sponsored.”
From a structure perspective, the nearby level geometry (support 5.1638; resistance 5.4033) sits close enough that price is likely to reveal whether the MA configuration is translating into follow-through. A market can remain above MA50 and still fail at resistance if participation fades; conversely, sustained acceptance above resistance tends to pull mid-horizon ranks up toward the long-horizon strength (6-month #89; yearly #111).
Given the neutral overall technical score (0.051), the trend read should be treated as supportive context rather than a standalone directional verdict.
3) Momentum & volatility dashboard
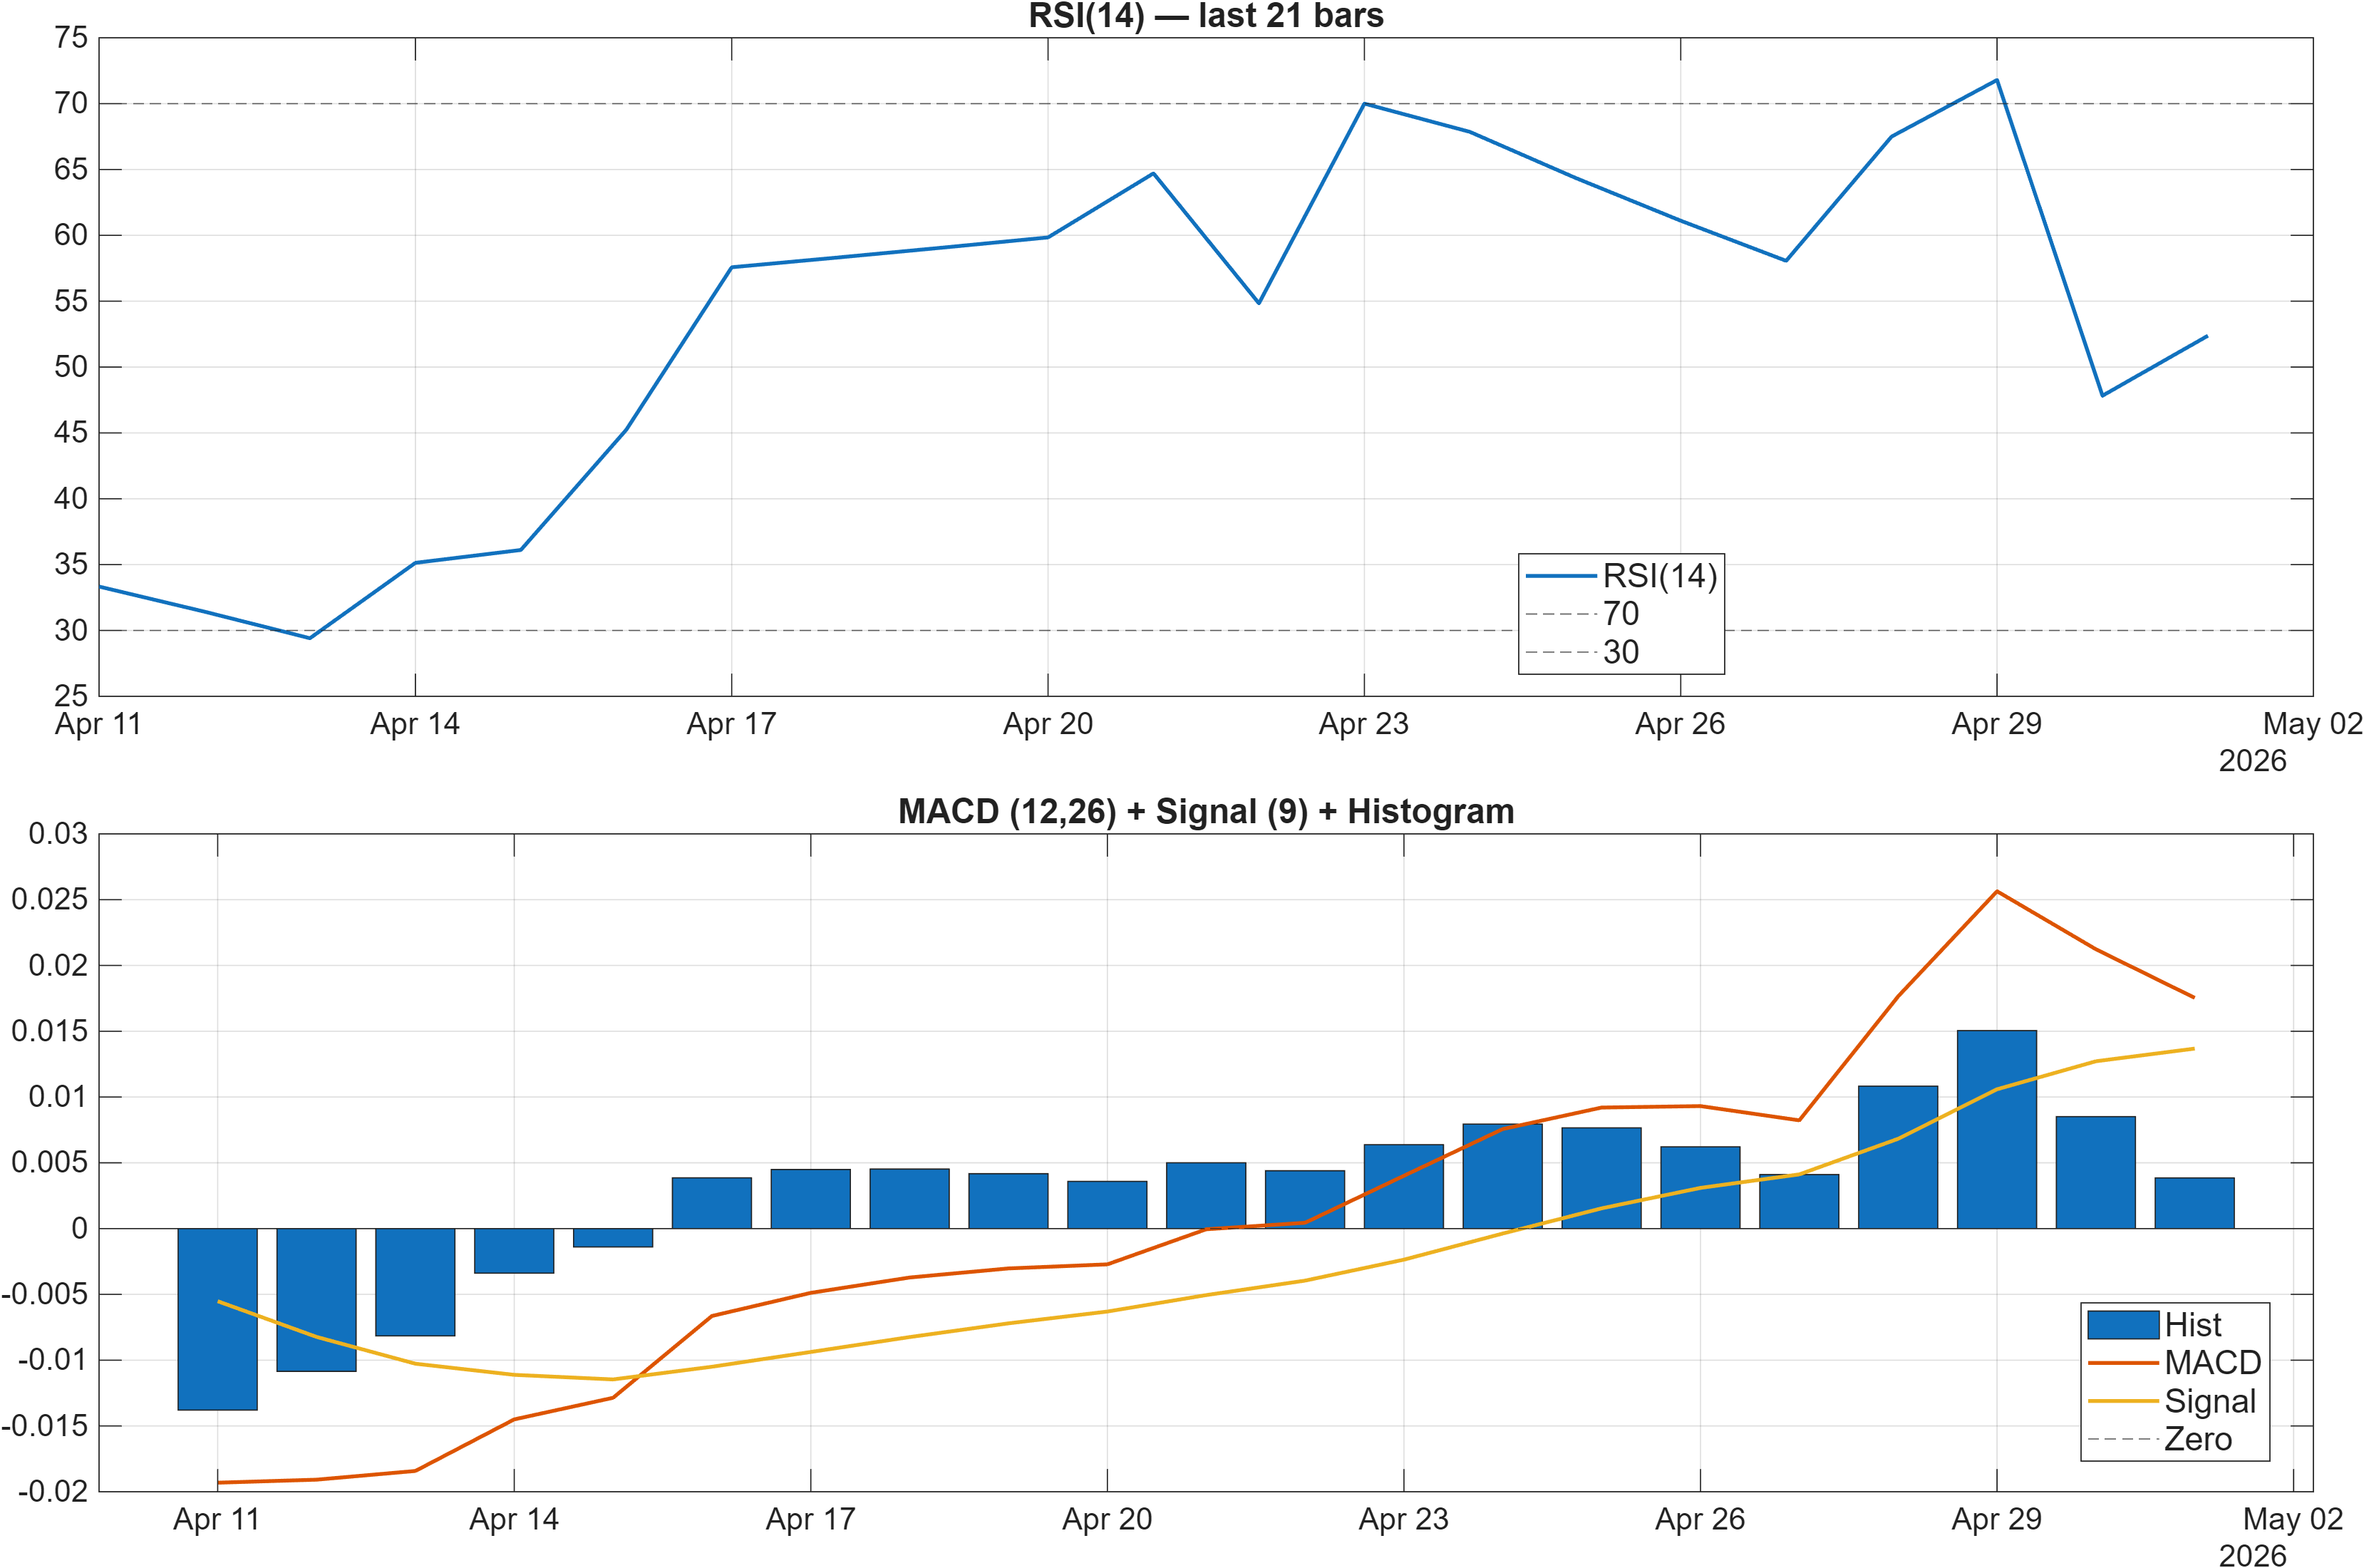
Momentum is currently characterized by controlled, non-extreme readings. RSI bias is neutral, with RSI(14) at 52.38, which typically reflects balanced demand rather than overbought/oversold conditions. At the same time, the MACD histogram is positive at 0.0039, a mild constructive impulse that can support trend persistence if it expands rather than stalls.
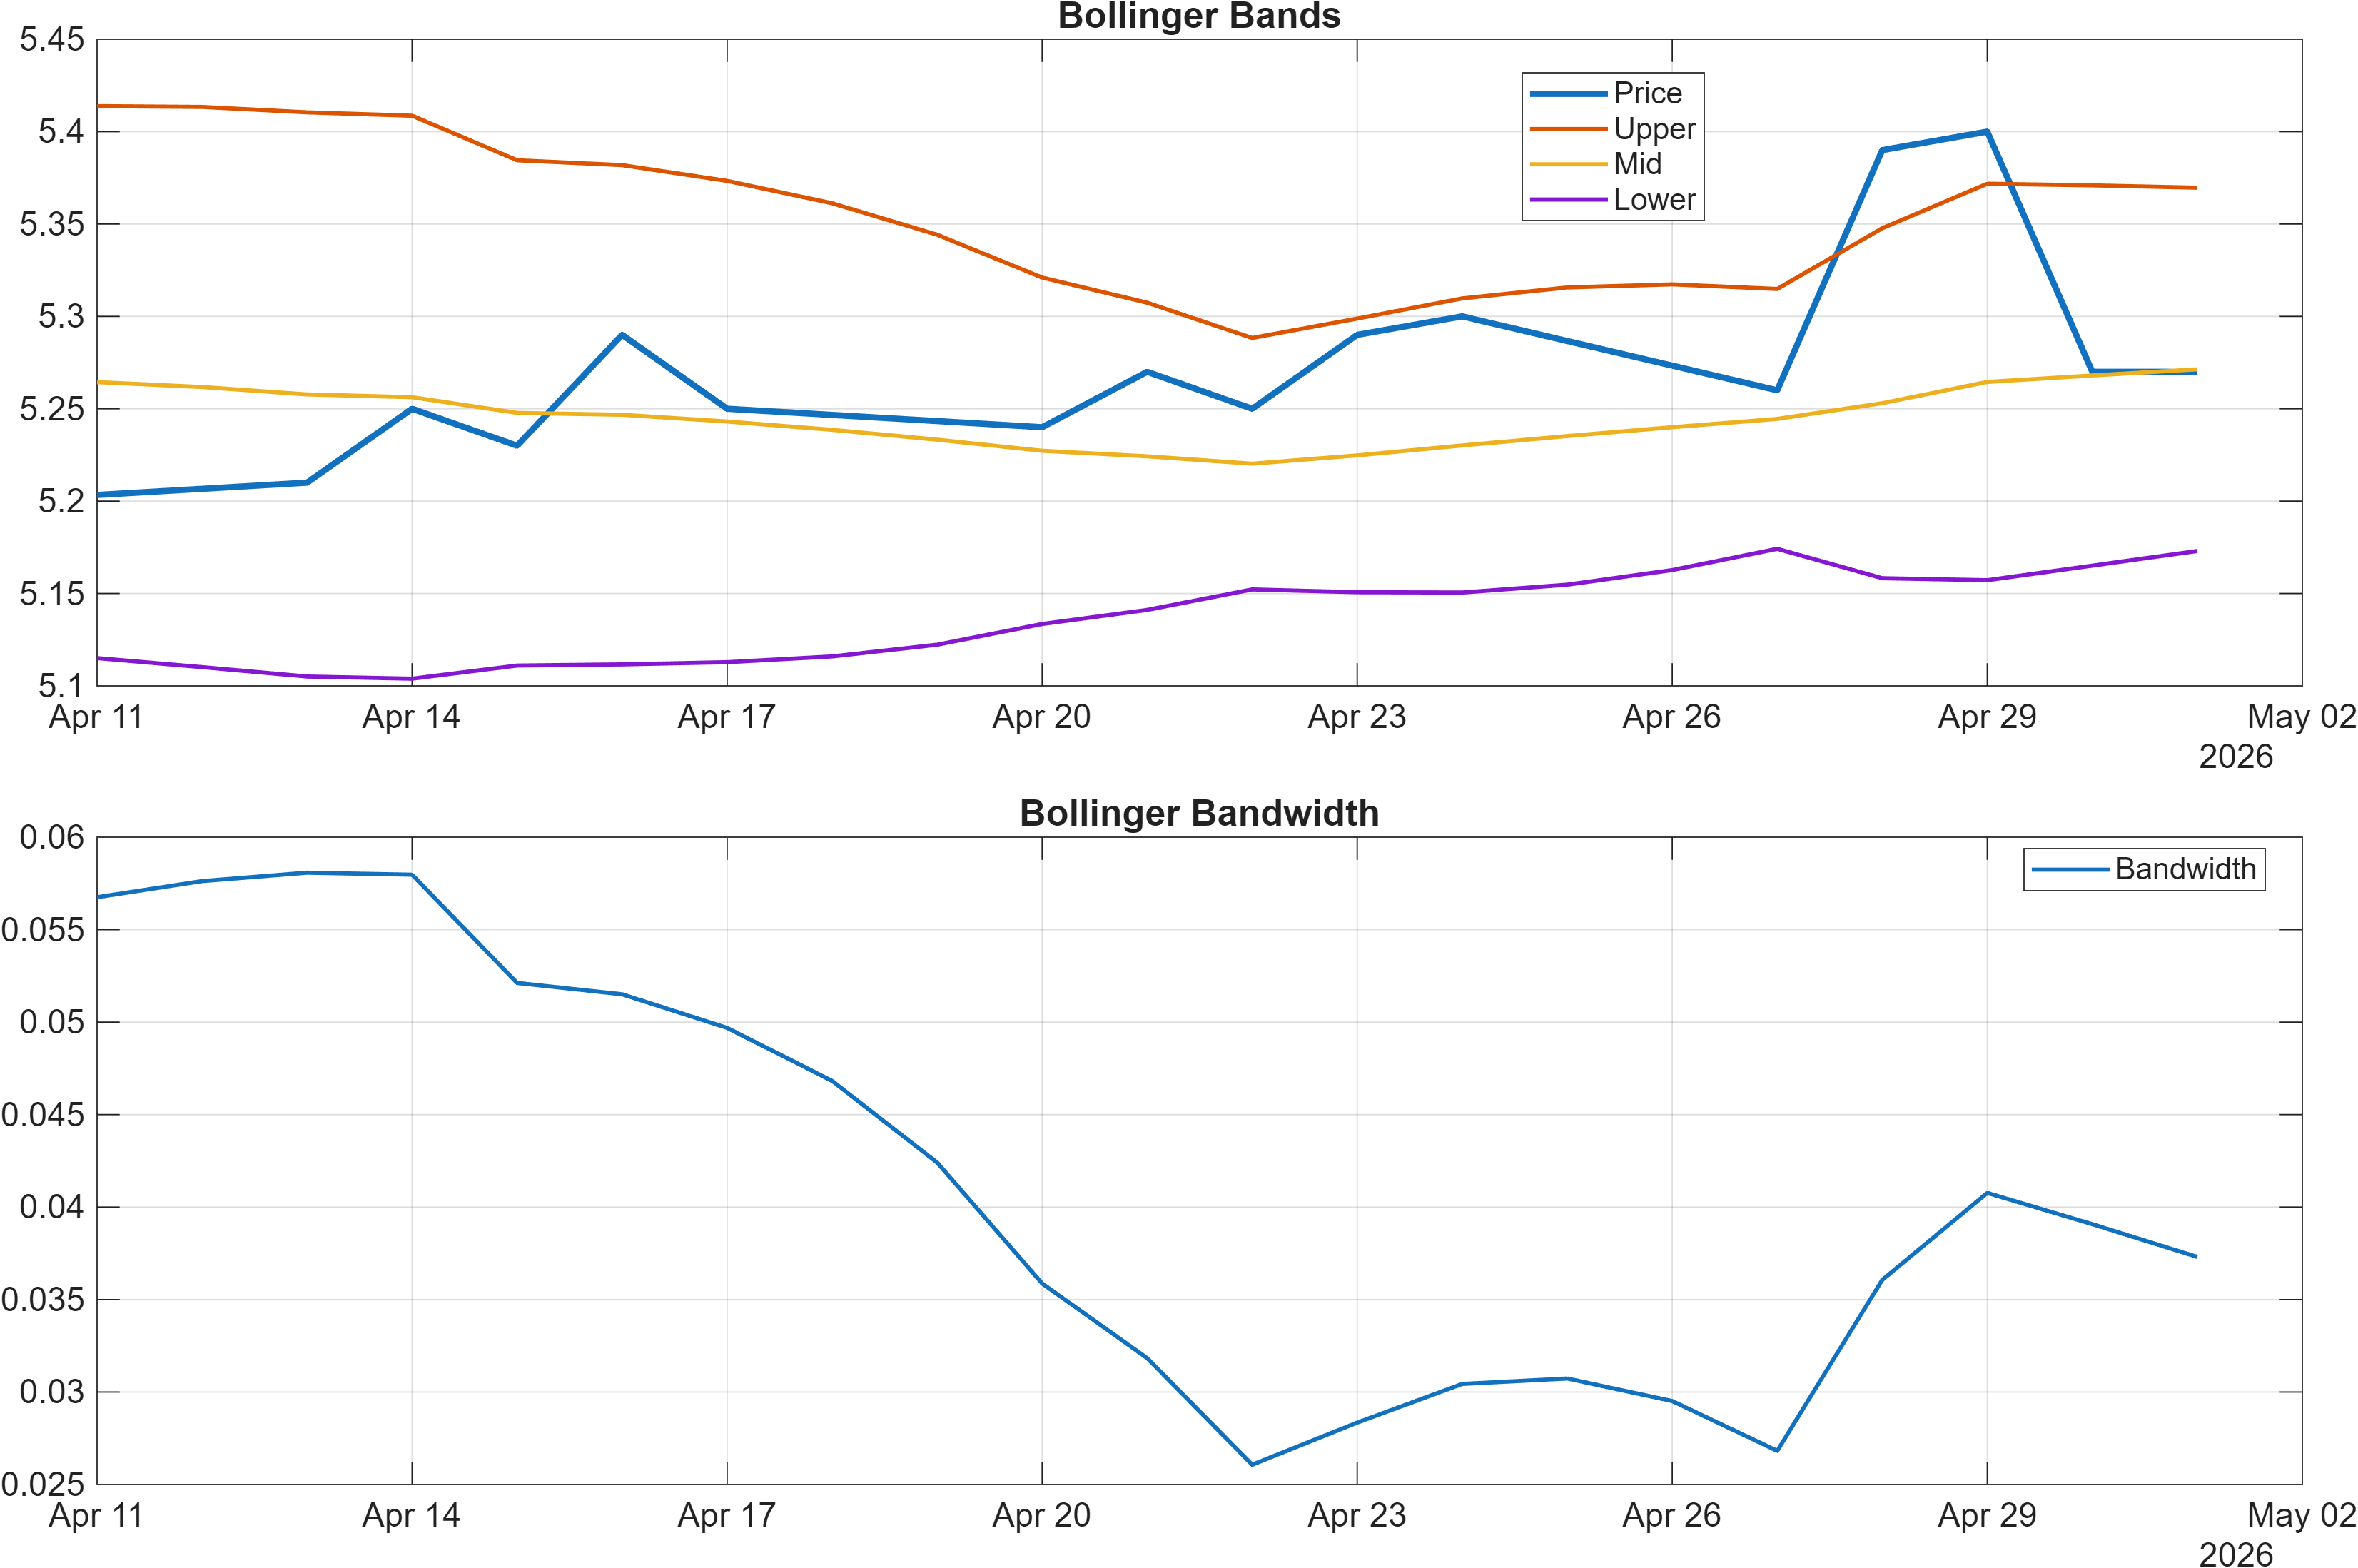
Volatility sits in a compressed regime, with the latest Bollinger bandwidth at 0.0373. Compression tends to shift analytical emphasis from “how far” to “whether”: price can travel quickly once volatility expands, but direction is often dictated by who steps in first at defined levels. This matters because the support/resistance band (5.1638 / 5.4033) is relatively tight; low bandwidth can make that range behave like a coiled state where a break requires confirmation.
Additional momentum/price-change measures in the signal stack lean constructive without being emphatic (e.g., ROC(20) 1.216 is Bullish; TS Mom(20) 0.06333 is Bullish), yet the stochastic reading is not strongly aligned (Stoch %K 22.22 is Neutral). That mix suggests momentum is present but not broadly synchronized—consistent with a neutral confluence score (0.278) rather than a high-conviction trend acceleration state.
In this setup, the more informative development is typically MACD/RSI confirmation during a volatility expansion, rather than isolated improvements in a single oscillator.
4) Support / Resistance zones
Support ~ 5.1638 | Resistance ~ 5.4033
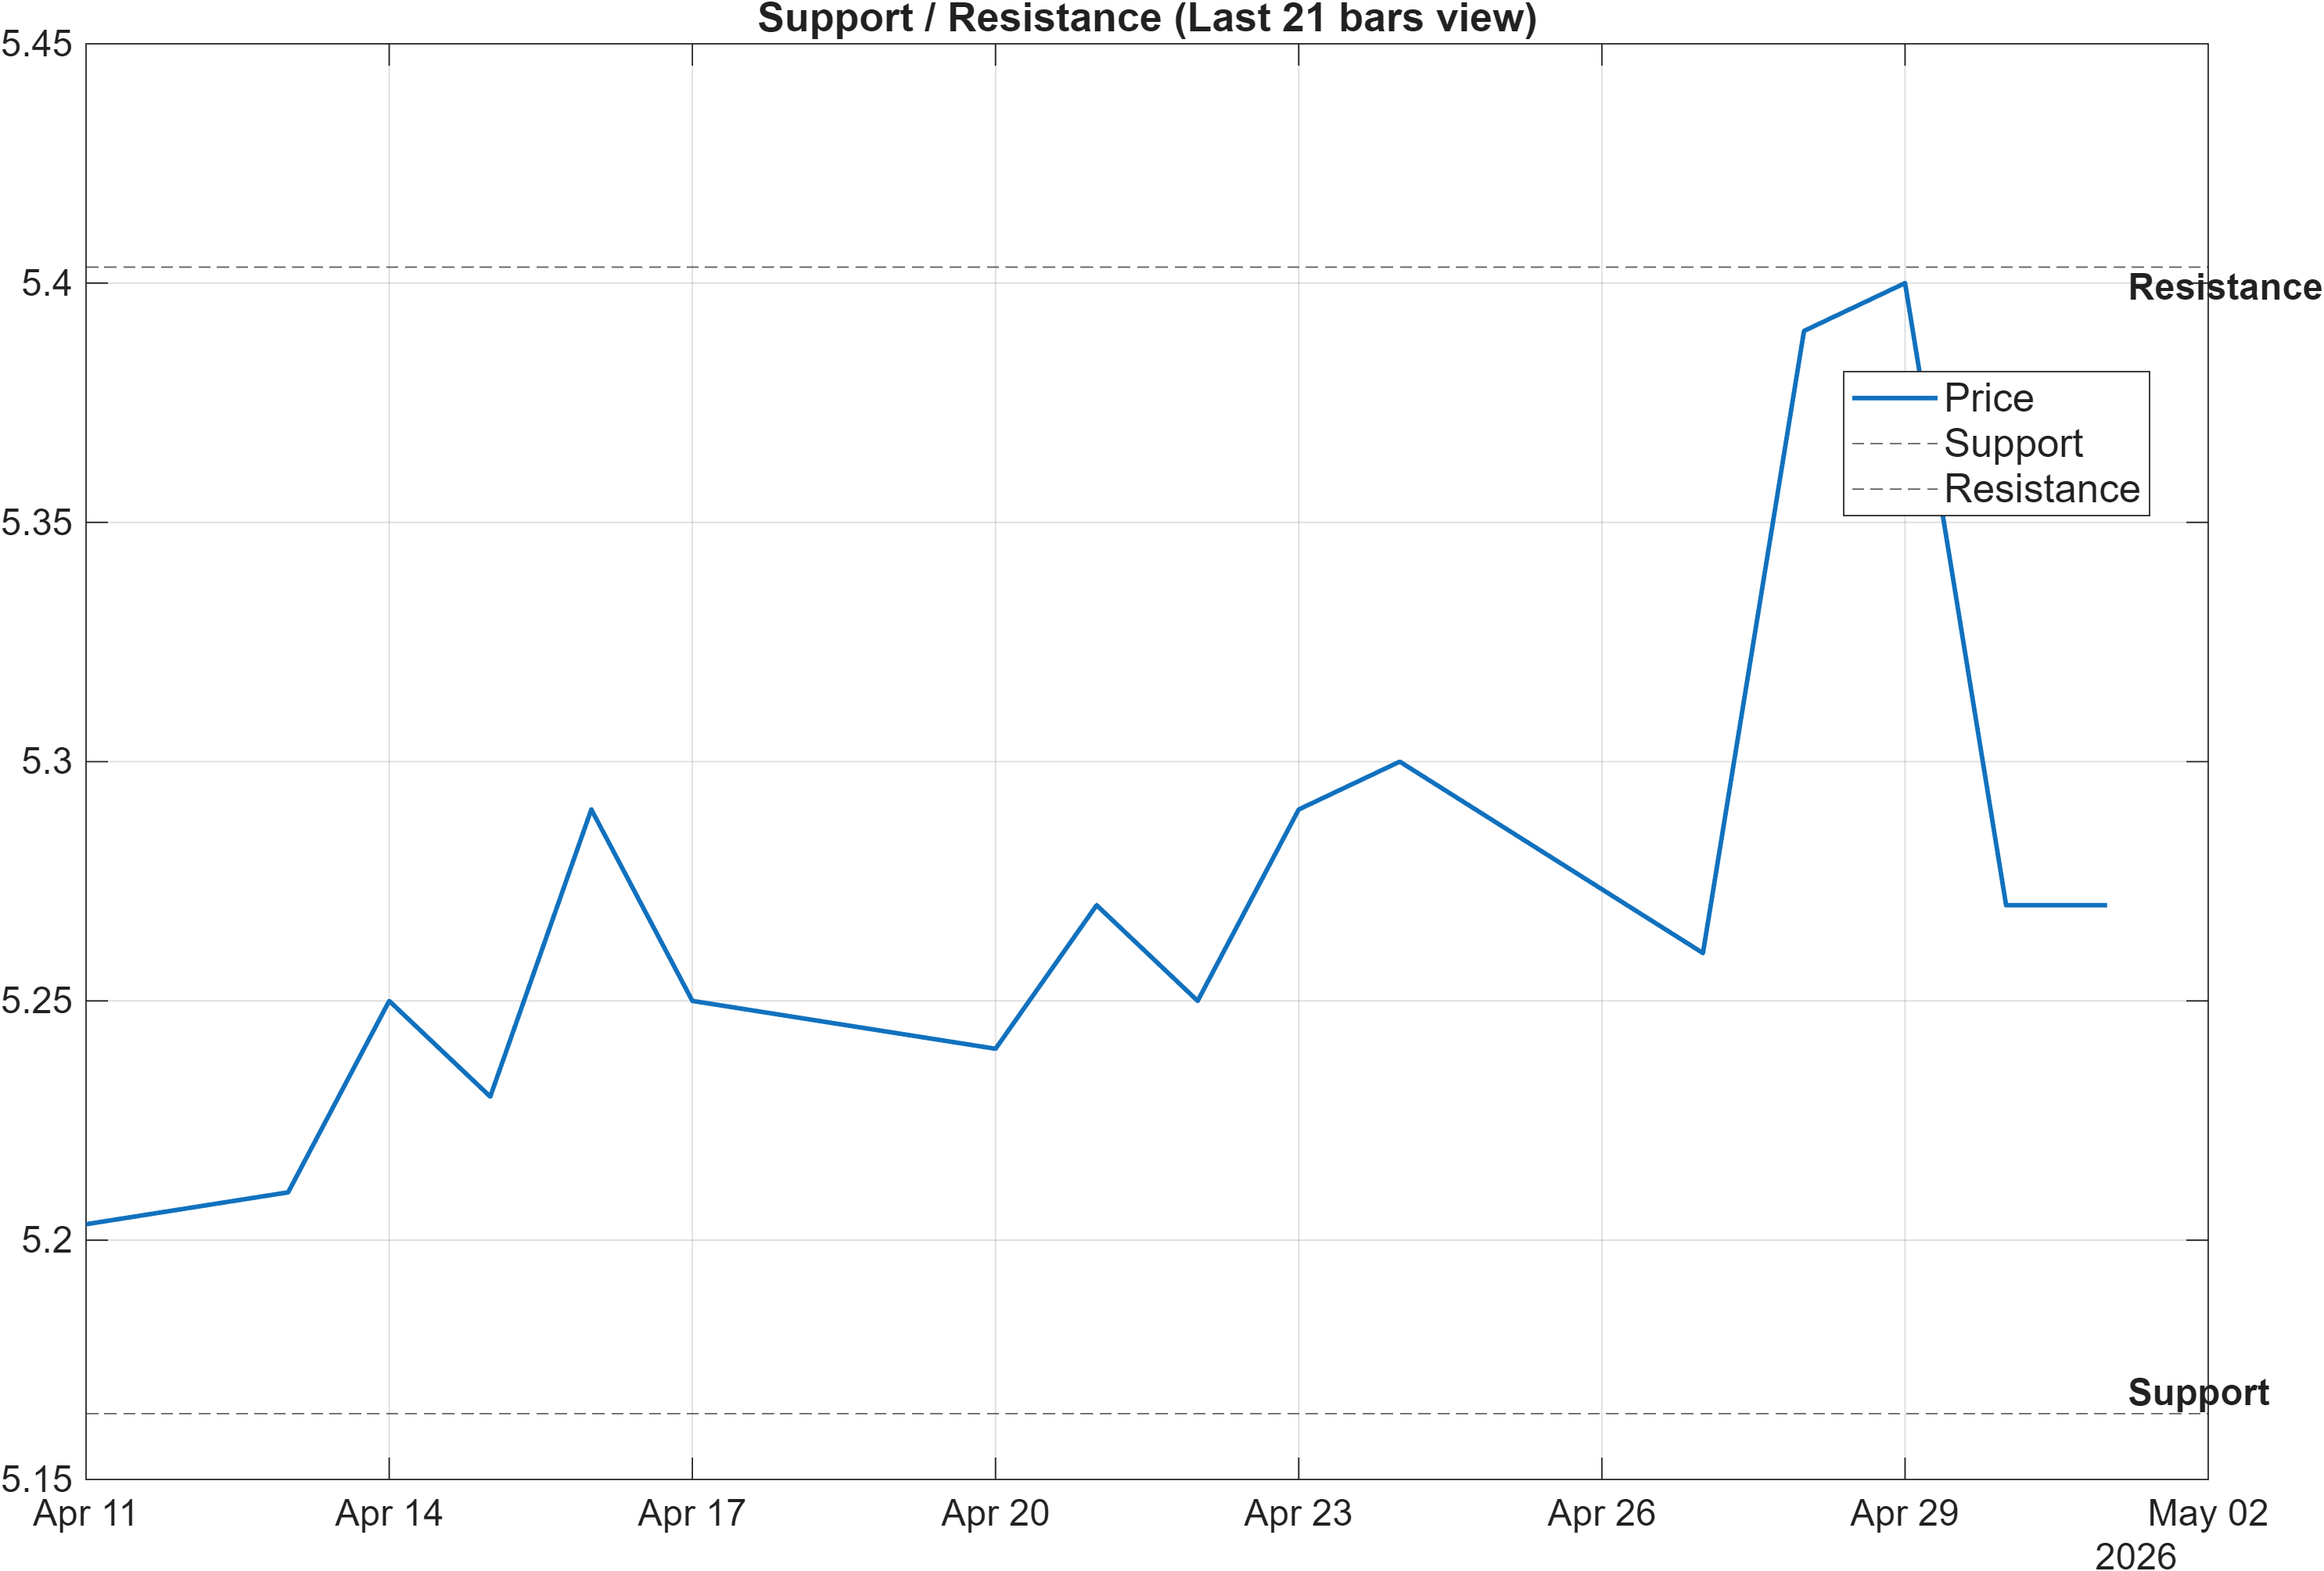
The level map for 601006 is clean: support at 5.1638 and resistance at 5.4033. With trend measures leaning constructive (Close vs MA50 Bullish; MA50 vs MA200 Bullish) but the blended technical score still neutral (0.051), these boundaries become the primary arbiter of whether the market is transitioning from “supported” to “advancing.”
A break above 5.4033 accompanied by volume confirmation aligns with the report’s scenario framing (“continuation”). This is where the internal signal mix becomes relevant: some participation proxies are already supportive (Vol ROC(20) 261.2 is Bullish; ADOSC 27.78 is Bullish), but the negative slopes in OBV and PVT (-3.396e+07 and -3.414e+05) indicate that not all volume-based measures are endorsing the move. In other words, resistance is a likely participation test rather than a purely technical line.
On the downside, a close below 5.1638 would do more than violate a level—it would validate the weak daily rank (#1118) as a meaningful short-horizon warning, particularly in a low-volatility regime (bandwidth 0.0373) where downside breaks can trigger regime expansion. The “MedPx vs Support” signal is Bullish at 0.1113, which implies price has not been pressing support aggressively; a decisive close below support would therefore represent a clearer state change than a routine intraday probe.
Until either boundary is resolved, the market reads as range-defined with upward trend context, not as a confirmed directional breakout.
5) Quant Technical Dashboard (18 Signals)
KGNAI AI Technical Analysis Score (Deep Reinforcement Learning): Rank #954 out of 1292 (Rank 1 represents the strongest technical positioning and a higher probability of favorable price behavior. As ranks increase toward the maximum, the probability of favorable outcomes weakens and bearish positioning becomes more dominant.) | Label: Neutral | Score: -0.477
18-Signal Technical Confluence Score: 0.278 (Neutral)
Overall Technical Score (18-signal confluence + DRL rank blend): 0.051 (Neutral)
Note: The blended score reflects signal strength weighted against broader AI technical ranking, which may temporarily diverge.
Blended technical score breakdown: 0.051 (Neutral | Bull 9 / Bear 4 / Neutral 5)
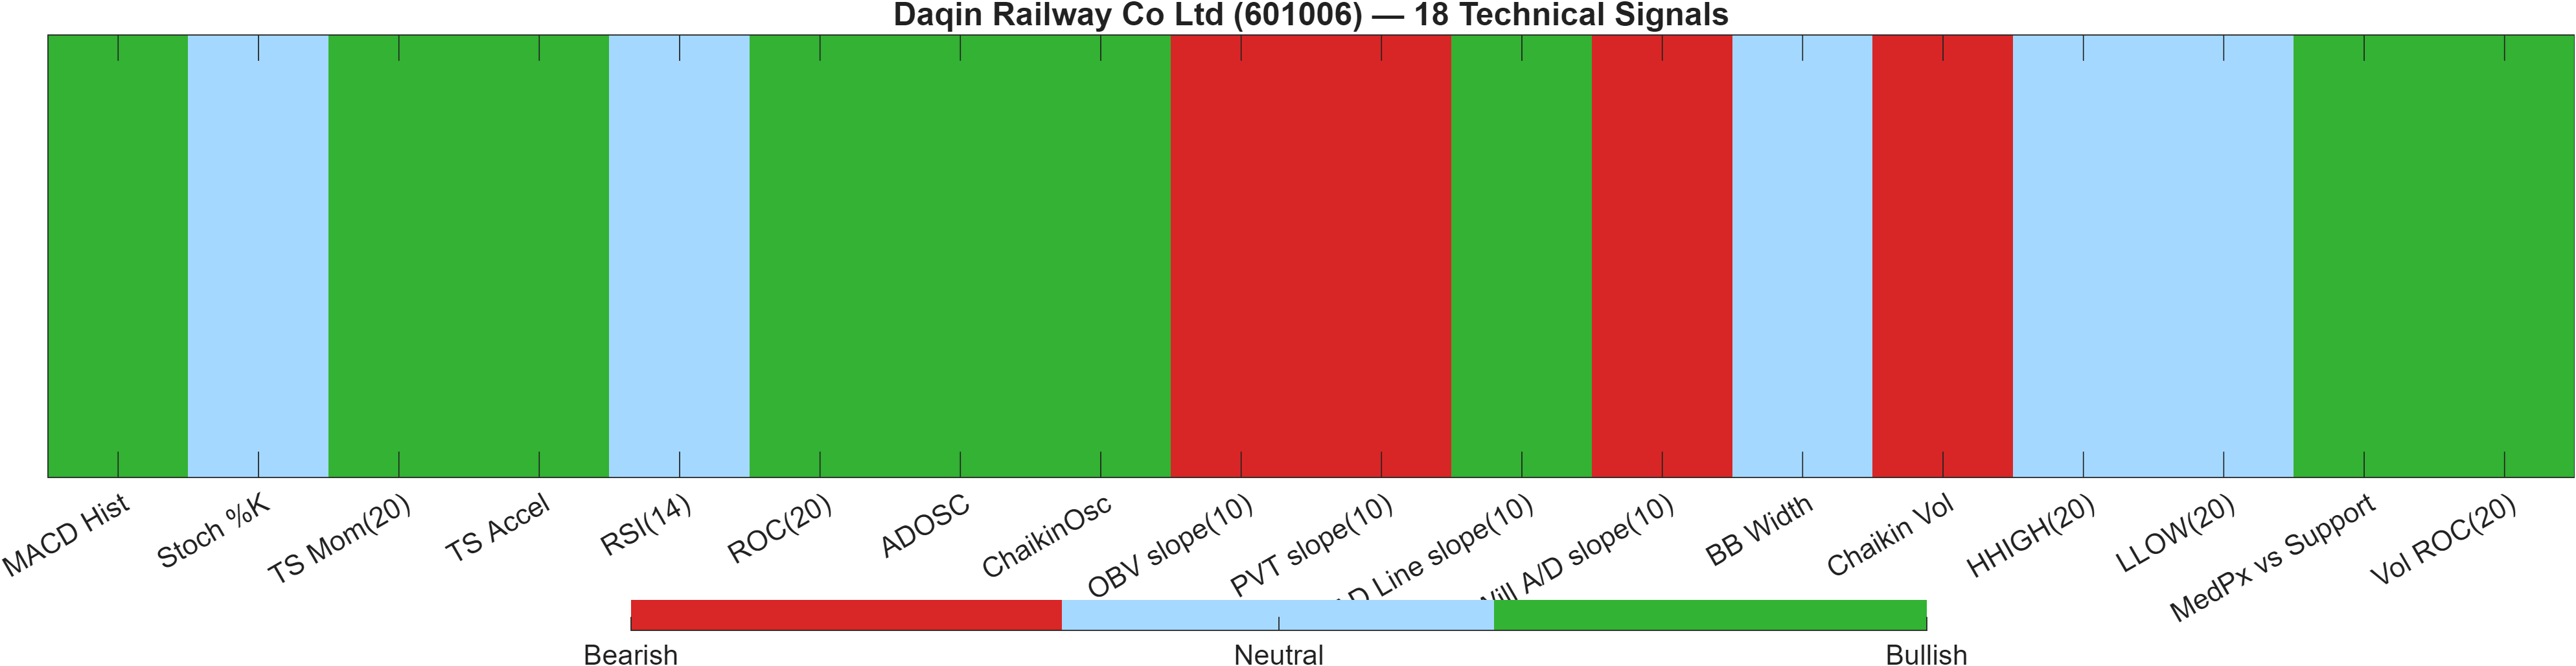
The quant dashboard highlights signal breadth without full coherence. The 18-signal confluence score is 0.278 (Neutral), and the blended overall technical score is 0.051 (Neutral), despite 9 bullish components versus 4 bearish and 5 neutral. That distribution often indicates that while multiple indicators lean constructive, the bearish subset is concentrated in higher-impact areas—here, notably in volume/flow slope metrics that can influence breakout quality.
The Deep Reinforcement Learning technical rank sits at #954 with a score of -0.477 (Neutral label). This is a meaningful counterweight to the trend layer: it suggests that within KGNAI’s broader technical universe, 601006 is not currently behaving like a strong technical leader even if its longer-horizon ranks are favorable (6-month #89; yearly #111). In practice, this kind of divergence can show up when trend is intact but the tape lacks consistency across micro-regimes.
At the indicator level, momentum and price-change measures are mildly supportive (MACD histogram 0.003854 Bullish; ROC(20) 1.216 Bullish), but the volatility signal is neutral (BB Width 0.0373), reinforcing the view that the market is not in an expansionary impulse phase. Meanwhile, participation is mixed: AD Line slope(10) 1.357e+08 is Bullish, while OBV slope(10) -3.396e+07 and PVT slope(10) -3.414e+05 are Bearish, a combination consistent with “selective” rather than broad accumulation.
Signal table (Bull/Bear/Neutral)
| Indicator | Value | Signal |
|---|---|---|
| MACD Hist | 0.003854 | Bullish |
| Stoch %K | 22.22 | Neutral |
| TS Mom(20) | 0.06333 | Bullish |
| TS Accel | 0.1467 | Bullish |
| RSI(14) | 52.38 | Neutral |
| ROC(20) | 1.216 | Bullish |
| ADOSC | 27.78 | Bullish |
| ChaikinOsc | 6.12e+07 | Bullish |
| OBV slope(10) | -3.396e+07 | Bearish |
| PVT slope(10) | -3.414e+05 | Bearish |
| AD Line slope(10) | 1.357e+08 | Bullish |
| Will A/D slope(10) | -0.02 | Bearish |
| BB Width | 0.0373 | Neutral |
| Chaikin Vol | 27.89 | Bearish |
| HHIGH(20) | 5.41 | Neutral |
| LLOW(20) | 5.17 | Neutral |
| MedPx vs Support | 0.1113 | Bullish |
| Vol ROC(20) | 261.2 | Bullish |
Net: the dashboard supports a neutral base case with a constructive tilt that still requires confirmation through stronger participation alignment and a decisive resolution of the 5.4033 resistance level.
6) News sentiment + extractive gist
Note: Instrument-specific news matches were not found, so the digest includes broader market/sector headlines. Links are provided for verification.
Sentiment score (avg): -0.013 | Positive: 12% | Neutral: 69% | Negative: 19%
KGNAI AI News Sentiment Score (normalized -1 to +1): Not available (as of —) | Label: Not available | Overall news score: -0.01
Positive Developments
Recent coverage across major financial outlets indicates a modestly constructive macro backdrop in parts of the global policy and industrial landscape, with some developments framed as supportive for operational continuity and risk reduction. The current sentiment mix—12% positive and an average score of -0.013—implies that genuinely upbeat narratives exist but are not dominant. For a stock with neutral technical confluence (0.278) and a defined resistance ceiling at 5.4033, marginally positive external tone can matter most when it coincides with technical “release valves” such as volatility expansion from a low bandwidth state (0.0373). In this context, positive coverage functions less as a standalone catalyst and more as a potential contributor to participation—particularly relevant given the mixed volume/flow slopes (e.g., OBV slope(10) -3.396e+07 versus AD Line slope(10) 1.357e+08).
Neutral / Mixed Developments
The dominant tone is informational rather than directional: 69% neutral sentiment aligns with the report’s broader signal profile, where multiple indicators lean constructive but do not synchronize into a high-conviction trend state (overall technical score 0.051, Neutral). A neutral news regime often coincides with technically range-defined markets, where price responds more to internal structure—moving averages, RSI/MACD confirmation, and support/resistance—than to narrative pressure. With RSI(14) at 52.38 and MACD histogram at 0.0039, the momentum setup is consistent with “wait-and-see” positioning: enough stability to avoid capitulation, but not enough urgency to force a breakout without incremental confirmation in volume and volatility.
Negative / Risk Signals
Negative coverage is present but not overwhelming (19% negative; overall news score -0.01), which suggests risk signals are currently more about uncertainty than acute stress. For 601006, this matters because the daily rank (#1118/1292) already points to short-horizon weakness; a risk-tilted news drift can amplify sensitivity to technical invalidation levels. In practical terms, the most consequential risk signal remains price-based: a close below 5.1638 would align deteriorating price structure with the weaker short-term rank and could coincide with volatility regime change from the currently low bandwidth (0.0373). Where news is broadly negative or uncertain, failed breaks at 5.4033 also tend to carry more weight, particularly when participation indicators are mixed (PVT slope(10) -3.414e+05).
- Whether price accepts above 5.4033 as volatility expands from bandwidth 0.0373.
- Whether mixed participation resolves (e.g., OBV/PVT slopes stabilizing versus continued divergence).
- Whether short-horizon rank weakness persists alongside neutral momentum (RSI(14) 52.38; MACD hist 0.0039).
Sources referenced: Reuters, Bloomberg, Yahoo Finance, MarketWatch, Investing.com
7) Sources
Not available in the provided data.
You may also like: How KGNAI AI ranks instruments across global markets
Disclaimer: KGNAI provides AI-generated analytics and educational market commentary only. This is not financial advice. Markets involve risk. Always do your own research.