
601778 — Jinko Power Technology Co Ltd (29-Apr-2026) | Ranks Deteriorate Despite Pockets of Technical Strength
Jinko Power Technology Co Ltd (601778) shows a split profile as of 29-Apr-2026: the short-term and monthly KGNAI ranks sit in the weaker end of the China universe, yet several price-based momentum readings remain constructive. This kind of cross-signal tension often matters most near decision zones, where trend confirmation becomes more dependent on participation and follow-through than on indicator direction alone. On the technical side, the blended framework leans Bullish (overall score 0.305) even as the 18-signal confluence is Neutral (0.222), implying that some supportive signals are being offset by weaker breadth/volume behavior. Key levels are clearly defined: support ~4.6300 and resistance ~7.2650. News sentiment is slightly negative on average (-0.024), but the digest reflects broader market/sector coverage rather than instrument-specific items.
Key Takeaways
- Rank stance: Short Bearish | Mid Neutral | Long Not available
- Technical confluence label: 18-signal confluence Neutral (0.222); blended overall Bullish (0.305)
- Key levels: Support ~ 4.6300 | Resistance ~ 7.2650
- News sentiment bias: Slightly negative / mostly neutral mix (avg -0.024; Neutral 69%)
- Confirmation / invalidation: A close below 4.6300 elevates deterioration risk; a break above 7.2650 with volume is the primary continuation confirmation.
What KGNAI Measures
KGNAI evaluates assets using large cross-sectional datasets built from millions of structured data points. Inputs incorporate fundamental metrics, technical structures, and systematically processed news sentiment. Statistical models, machine learning, and AI frameworks are used to assess relative positioning, signal alignment, and probabilistic behavior across broad universes.
How to Read This Report
- Ranks are comparative across the tracked universe, not absolute price targets.
- Confluence reflects alignment among independent signal groups.
- Support/resistance levels are probabilistic decision zones, not guarantees.
- Sentiment provides contextual bias within the broader analytical framework.
1) KGNAI AI Analysis
Region: CHINA
Total universe size: 1292 ranked instruments
- Daily rank: #1036 out of 1292 — Bearish
- Weekly rank: #315 out of 1292 — Neutral
- Monthly rank: #1172 out of 1292 — Bearish
- 3-Monthly rank: #1028 out of 1292 — Neutral
- 6-Monthly rank: Not available for this horizon — Not available
- Yearly rank: Not available for this horizon — Not available
The rank profile is concentrated in the weaker portion of the universe on the most time-sensitive horizons. A daily rank of #1036 and monthly rank of #1172 (out of 1292) place the instrument in the lower tier on short and intermediate lookbacks, consistent with a market that is either struggling to sustain recent gains or exhibiting higher downside sensitivity relative to peers. By contrast, the weekly rank of #315 sits closer to the upper quartile, suggesting that the very near-term tape has been more resilient than the broader monthly context implies.
This short/weekly divergence can occur when a rebound is underway but has not yet “earned” cross-sectional confirmation at longer windows. It also raises the importance of invalidation logic: if the recent improvement was primarily tactical (rather than structural), rank pressure typically reasserts quickly once momentum slows. The 3-month view is Neutral at #1028, reinforcing the idea that the asset is not cleanly trending relative to the universe; instead, it is rotating between supportive bursts and periods of deterioration.
Longer-horizon ranks are Not available in the provided data. For positioning, the most actionable implication is regime fragility: with short-term rank weak while weekly rank is comparatively better, confirmation needs to show up in breadth/volume behavior and in price acceptance above defined resistance rather than in oscillator strength alone.
2) Price & trend overview
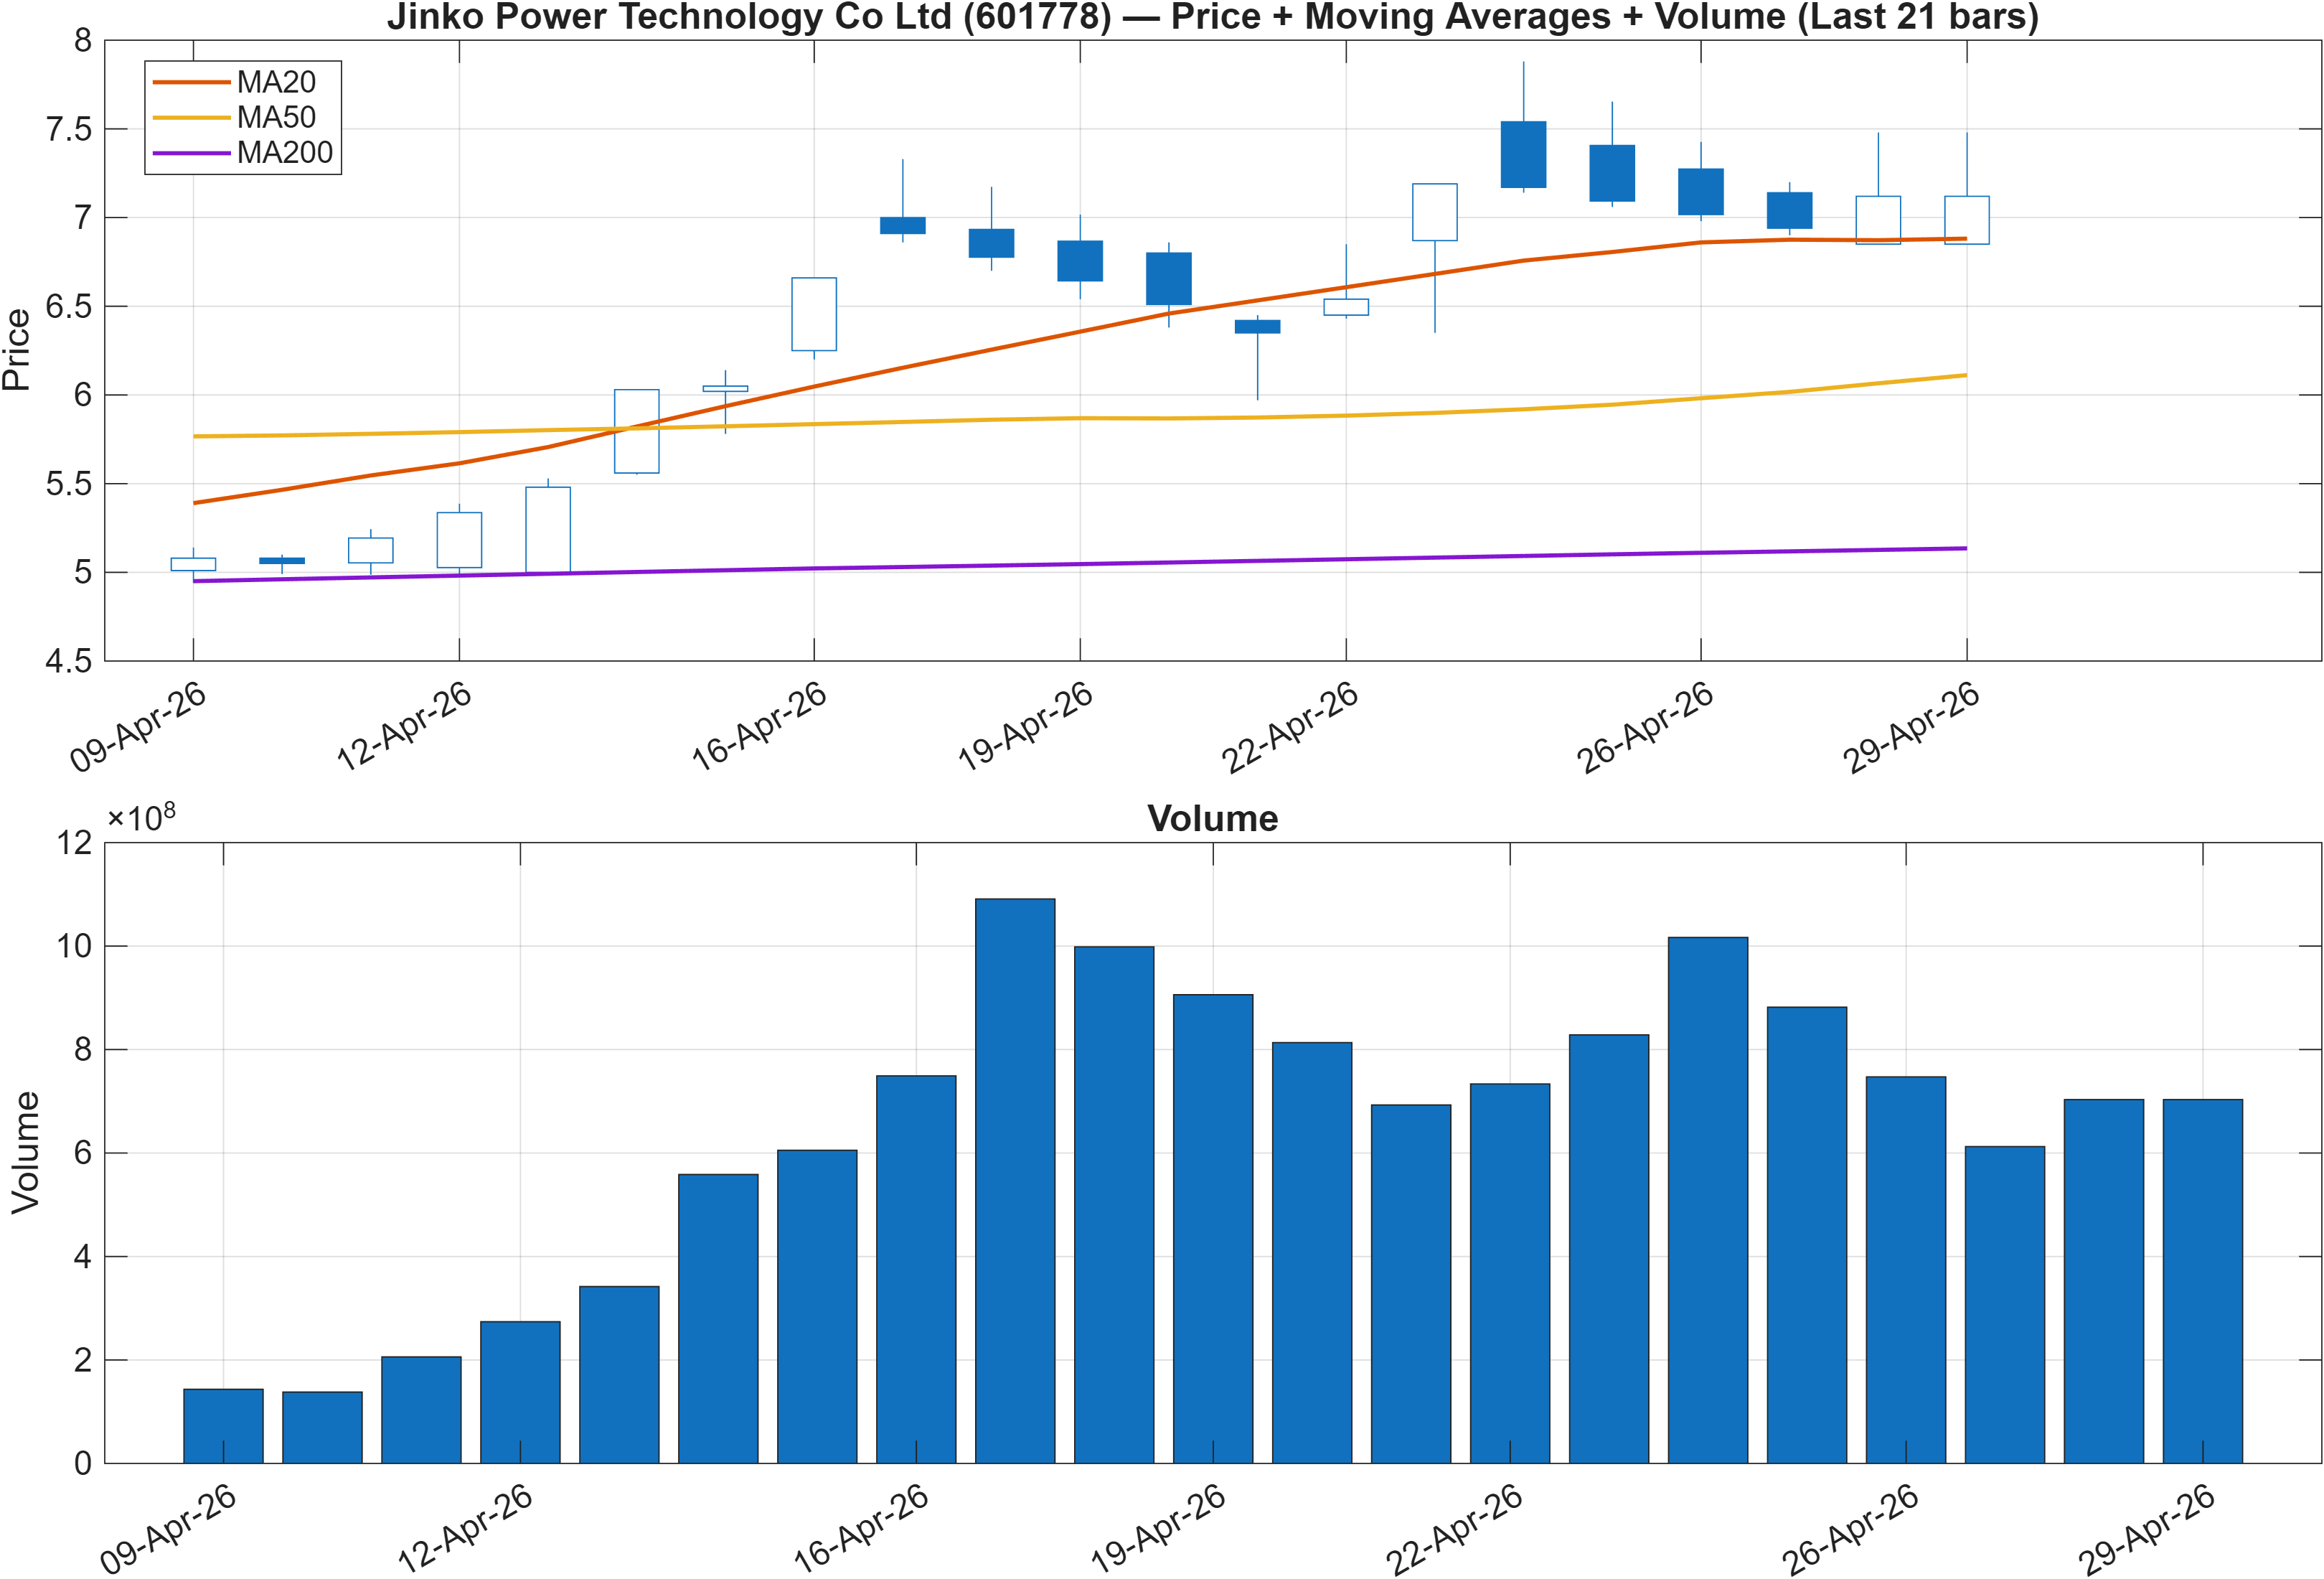
The moving-average structure is constructive on its face: the snapshot flags close vs MA50 = Bullish and MA50 vs MA200 = Bullish. In many equities, that combination points to a trend that has transitioned away from a purely defensive posture. However, the broader KGNAI ranks argue that this improvement has not translated into strong cross-sectional positioning—an important distinction between “trend up” and “trend that attracts persistent relative demand.”
One way to reconcile the two is to treat the current tape as a trend-with-conditions. The moving averages can remain supportive even while participation fades, particularly if rallies are driven by short bursts rather than consistent accumulation. That risk is consistent with later signal details showing some volume/breadth measures leaning Bearish (discussed in the technical dashboard), which can limit the durability of an MA-based uptrend.
From a structure perspective, the market is trading between a clearly defined decision band: support ~4.6300 and resistance ~7.2650. With the MA stack bullish, acceptance above resistance would typically be the clearest way to reduce the probability that this is a mean-reversion advance. Conversely, because the daily and monthly ranks are weak (e.g., #1036 and #1172), trend traders often demand stricter confirmation—especially around resistance—before treating the MA signals as regime-stable.
Net: the chart bias is not purely negative, but the rank regime suggests the trend is vulnerable to any stall that invites supply back into the tape.
3) Momentum & volatility dashboard
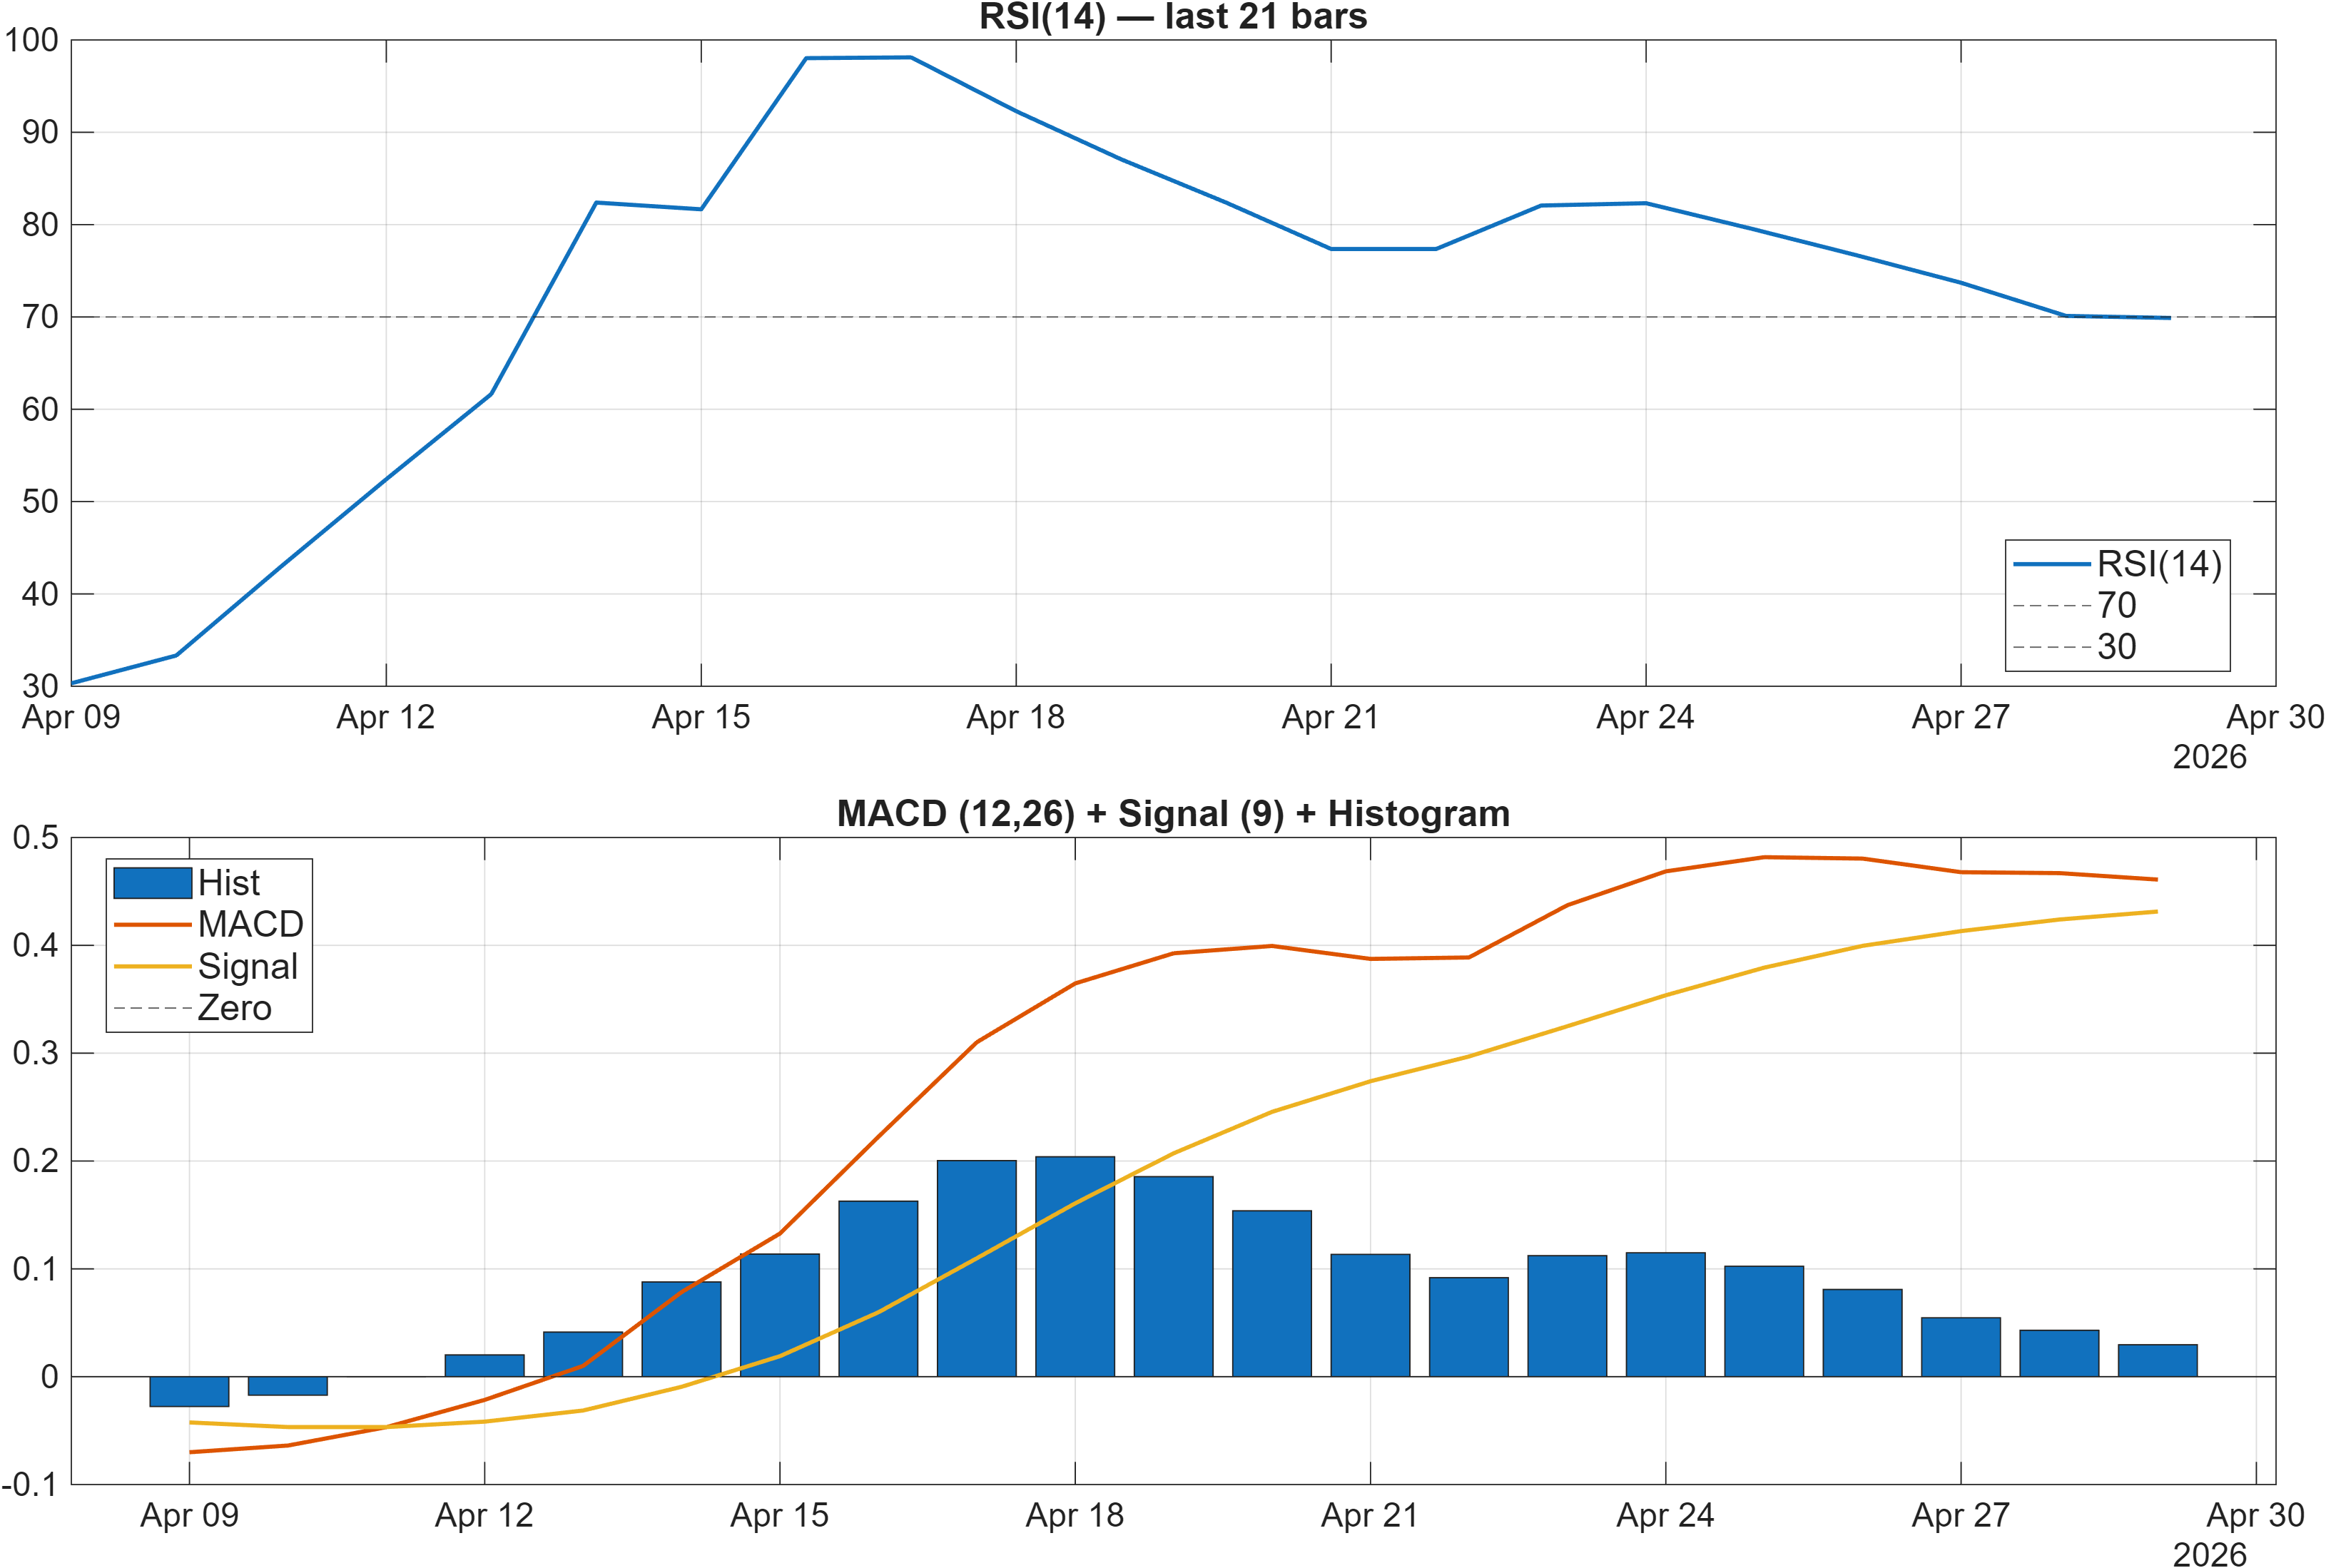
Momentum readings lean constructive, but with signs of late-stage sensitivity. The dashboard flags RSI bias = Bullish, and within the 18-signal table the RSI(14) is 69.89, which sits near the typical overbought threshold. That is not inherently bearish; in strong trends, RSI can remain elevated. The analytical question becomes whether elevated RSI is paired with expanding participation and follow-through, or whether it is occurring into resistance and thinning demand.
MACD remains supportive with a positive histogram (MACD hist = 0.0296; table shows 0.02961)—often consistent with positive short-to-intermediate momentum. The presence of positive MACD alongside a high RSI frequently describes a market that has already traveled meaningfully; the next incremental move tends to be more dependent on volatility regime and volume confirmation than on oscillator direction alone.
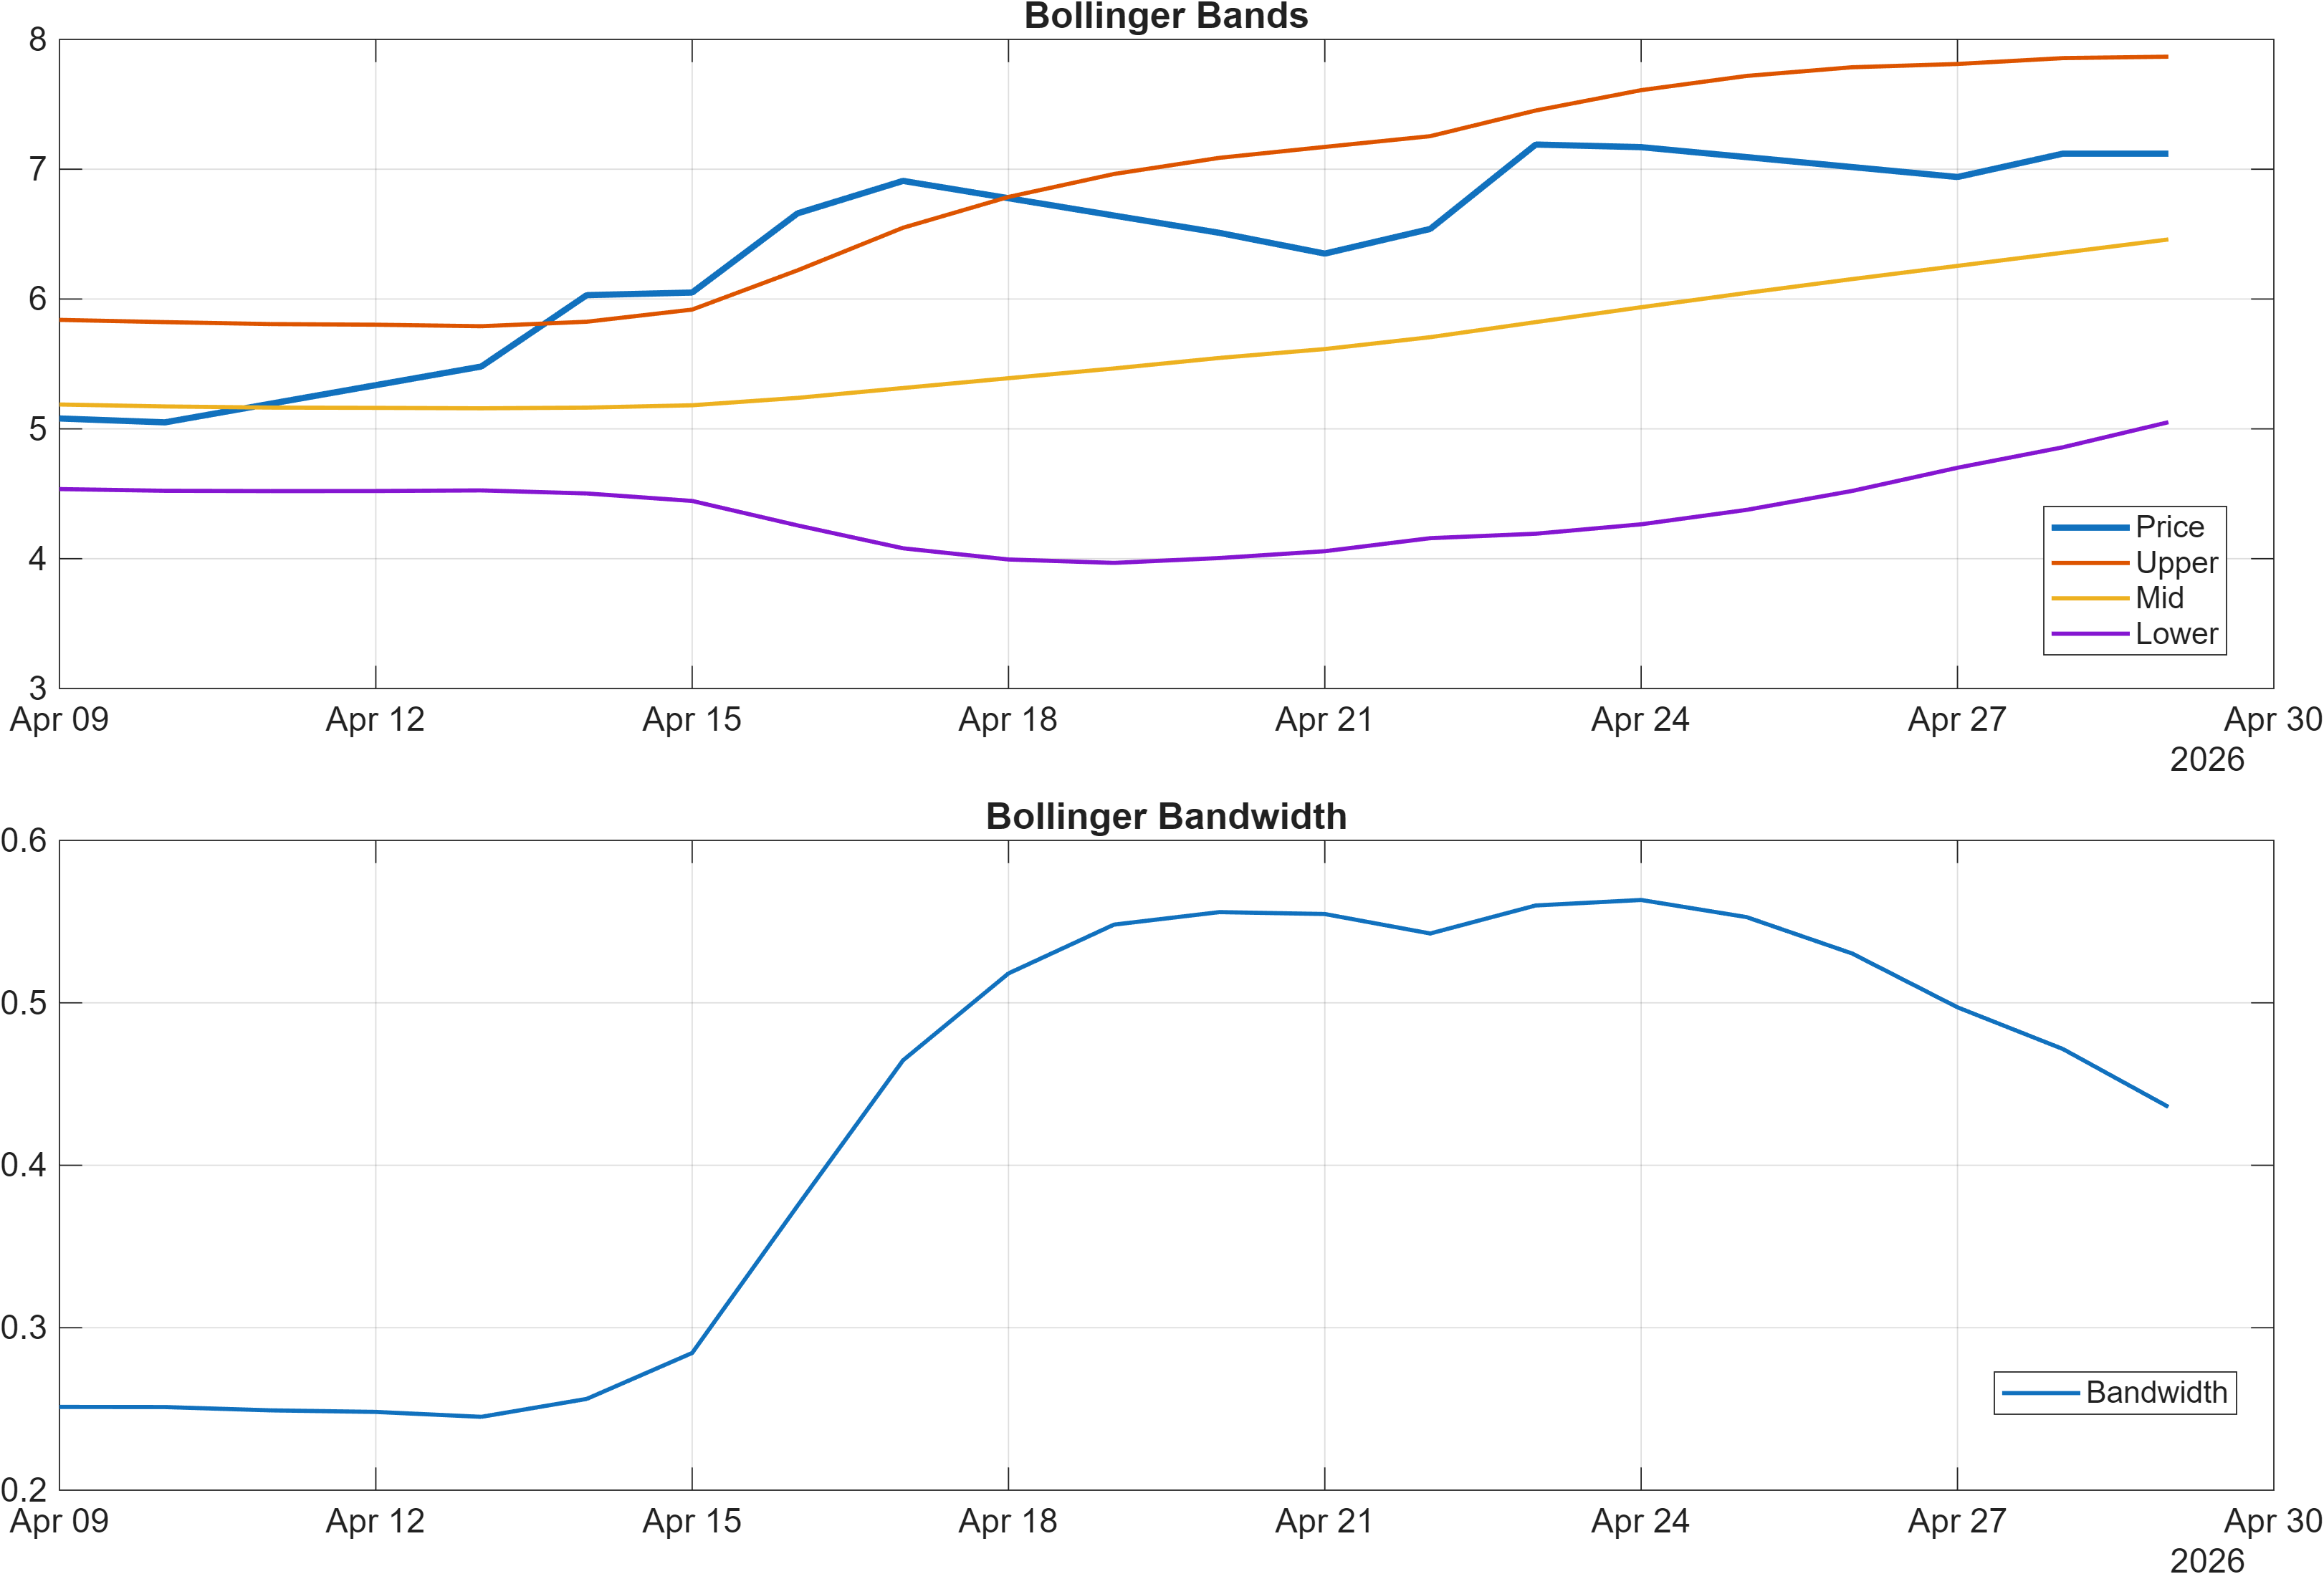
Volatility conditions are also relevant: Bollinger Bandwidth is 0.4359, indicating the market is not in a compressed, low-volatility coil. When bandwidth is elevated, breakouts can travel—but reversals can also be sharper if momentum exhausts. In that context, RSI near 70 and positive MACD can coexist with rising two-way risk.
Overall, the momentum dashboard supports the idea of constructive impulse, while the volatility regime argues for disciplined level-based confirmation (support/resistance) rather than relying solely on oscillator continuation.
4) Support / Resistance zones
Support ~ 4.6300 | Resistance ~ 7.2650
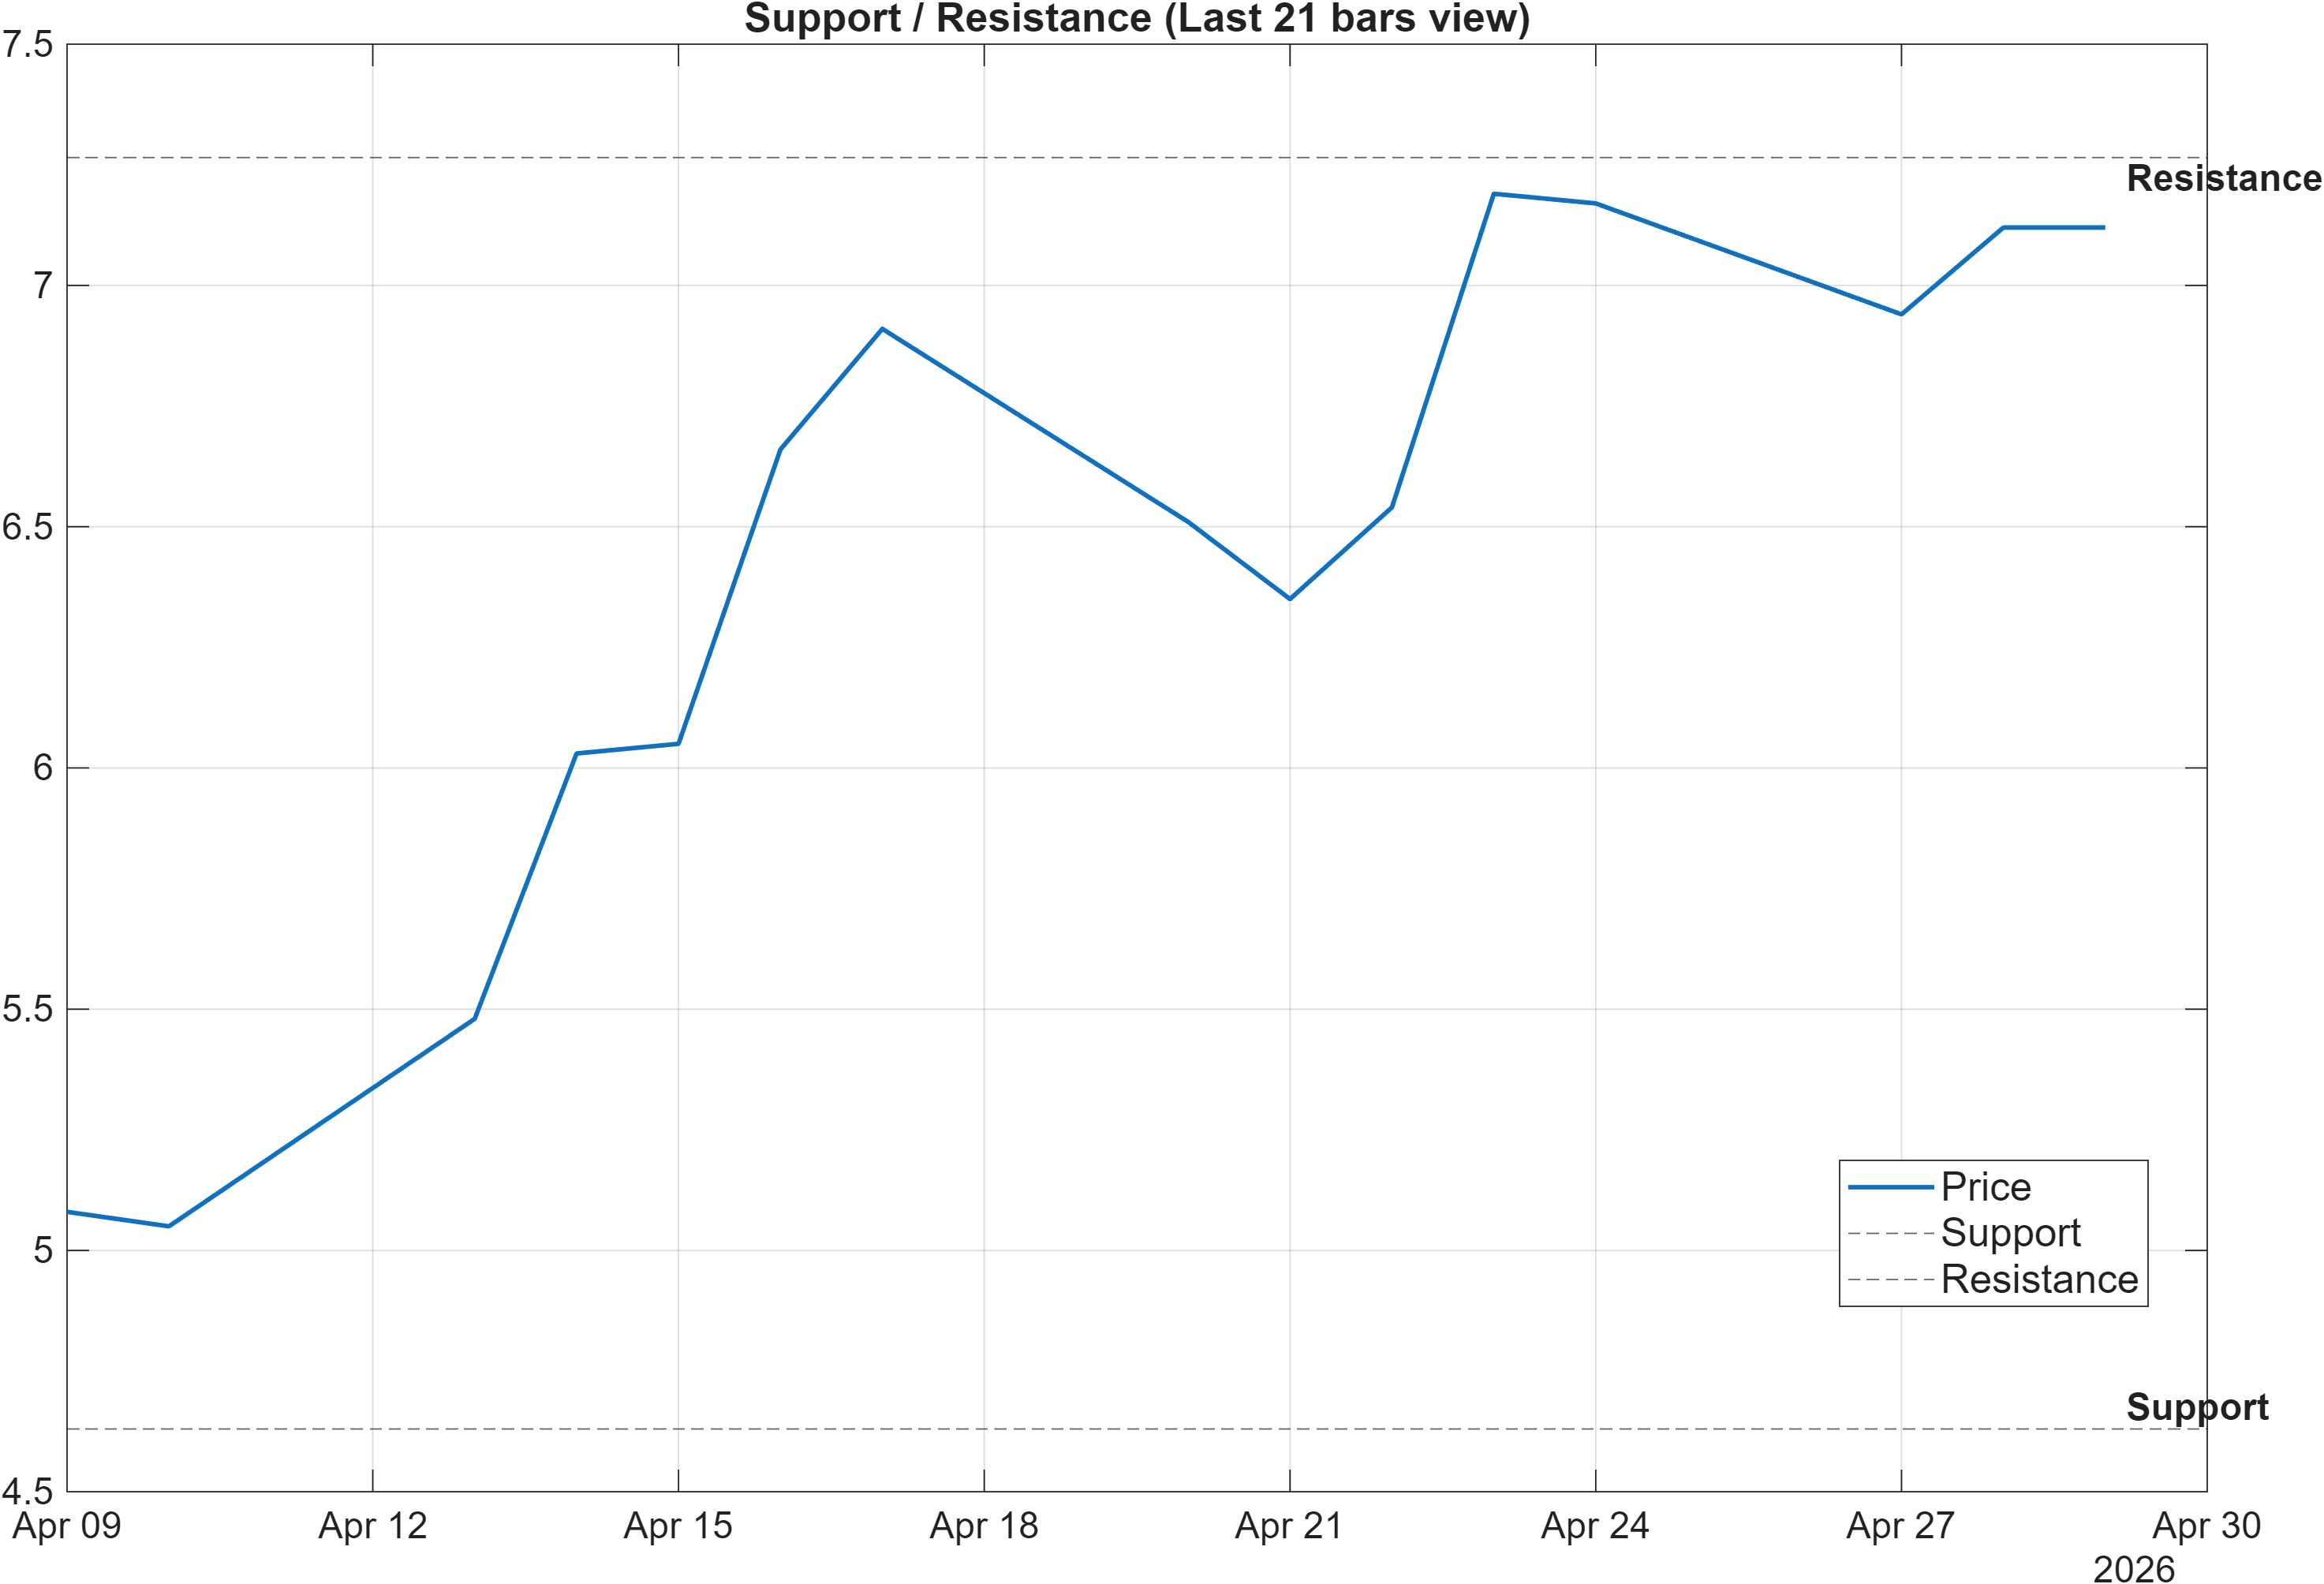
The level map frames the current setup as a range-defined regime with asymmetric information at the boundaries. With resistance ~7.2650, upside progress requires price acceptance above a known supply zone; without that, oscillator strength can remain “right” while price still fails to transition into a higher regime. This is particularly relevant given the cross-sectional weakness in the ranks (daily #1036, monthly #1172), which tends to penalize failed tests of resistance.
The support region at ~4.6300 functions as the primary invalidation line for the current constructive technical readings. A close below support would not merely be a local breakdown; it would also align with the existing bearishness embedded in the short-term and monthly rank structure, increasing the probability that recent momentum was counter-trend or mean-reverting rather than persistent.
The scenario guidance in the draft is appropriately conditional: break above resistance with volume → continuation, while close below support → deterioration risk. Those conditions also help reconcile the mixed signal set: momentum and MA structure can remain constructive, but the market still needs to prove it can attract demand through the resistance zone. In addition, the volatility regime (bandwidth 0.4359) suggests that if either boundary is violated, the follow-through can be quicker than in a compressed regime—making closes (not intraday wicks) more informative for confirmation.
5) Quant Technical Dashboard (18 Signals)
KGNAI AI Technical Analysis Score (Deep Reinforcement Learning): Rank #324 out of 1292 (Rank 1 represents the strongest technical positioning and a higher probability of favorable price behavior. As ranks increase toward the maximum, the probability of favorable outcomes weakens and bearish positioning becomes more dominant.) | Label: Neutral | Score: 0.498
18-Signal Technical Confluence Score: 0.222 (Neutral)
Overall Technical Score (18-signal confluence + DRL rank blend): 0.305 (Bullish)
Note: The blended score reflects signal strength weighted against broader AI technical ranking, which may temporarily diverge.
Blended technical score breakdown: 0.305 (Bullish | Bull 9 / Bear 5 / Neutral 4)
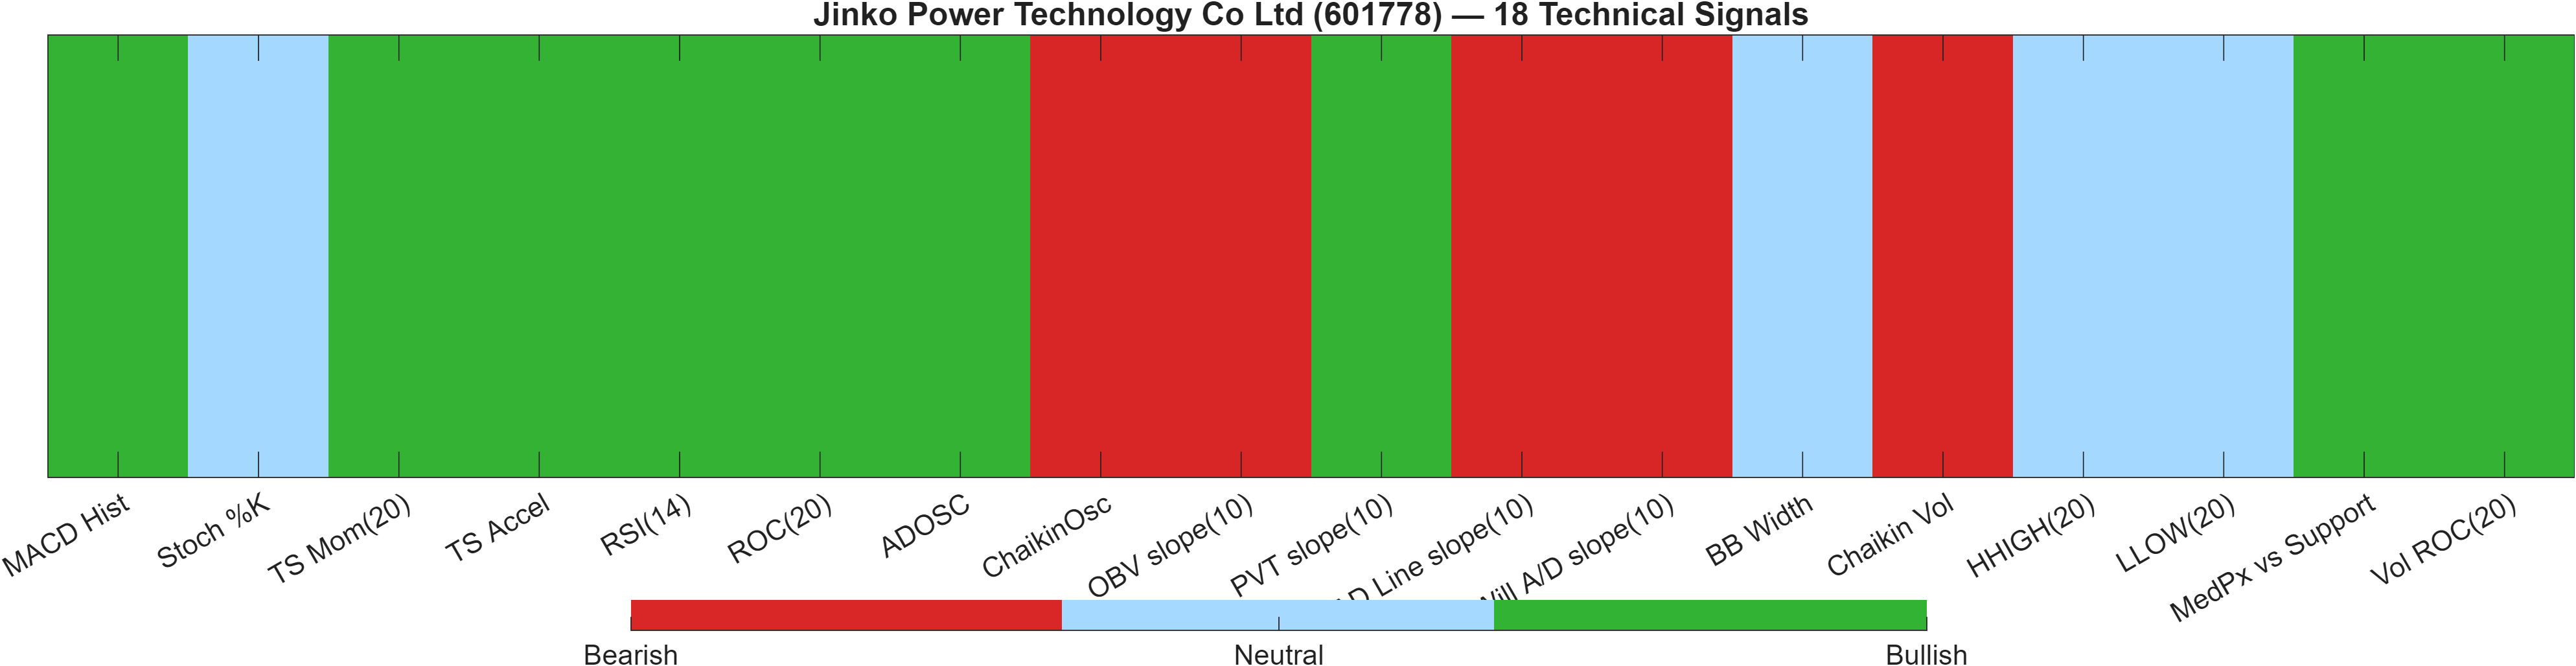
The dashboard highlights a meaningful distinction between signal agreement and rank-weighted technical standing. The 18-signal confluence is Neutral (0.222), indicating that independent indicators are not strongly aligned in one direction. Yet the blended overall technical score is 0.305 (Bullish), helped by the DRL model’s rank #324 (upper quartile-ish in a 1292 universe) and a 0.498 score labeled Neutral. This is a classic “mildly constructive, not unanimous” technical state.
Within the signals, price momentum is a clear source of support: ROC(20) at 40.99 and TS Mom(20) at 2.07 are Bullish, consistent with the positive MACD Hist 0.02961. At the same time, multiple participation/breadth proxies lean against the move—e.g., OBV slope(10) at -2.499e+09 and AD Line slope(10) at -2.481e+09 are Bearish—suggesting that not all volume-based measures corroborate the price impulse.
This mix often produces a market that can continue rising in the short run but is more sensitive to failed breakouts or pullbacks, because “who is participating” is less convincing than “what price is doing.” Volatility is also not giving a simple answer: BB Width 0.4359 is Neutral, while Vol ROC(20) 409.9 is Bullish—implying activity is present but not necessarily stabilizing trend persistence.
Signal table (Bull/Bear/Neutral)
| Indicator | Value | Signal |
|---|---|---|
| MACD Hist | 0.02961 | Bullish |
| Stoch %K | 60.21 | Neutral |
| TS Mom(20) | 2.07 | Bullish |
| TS Accel | 2.387 | Bullish |
| RSI(14) | 69.89 | Bullish |
| ROC(20) | 40.99 | Bullish |
| ADOSC | 71.43 | Bullish |
| ChaikinOsc | -9.652e+08 | Bearish |
| OBV slope(10) | -2.499e+09 | Bearish |
| PVT slope(10) | 6.214e+07 | Bullish |
| AD Line slope(10) | -2.481e+09 | Bearish |
| Will A/D slope(10) | -1.15 | Bearish |
| BB Width | 0.4359 | Neutral |
| Chaikin Vol | 26.8 | Bearish |
| HHIGH(20) | 7.88 | Neutral |
| LLOW(20) | 4.98 | Neutral |
| MedPx vs Support | 2.535 | Bullish |
| Vol ROC(20) | 409.9 | Bullish |
Taken together, the dashboard reads as momentum-led strength with incomplete participation confirmation. That is compatible with tactical upside, but it increases the importance of how price behaves at 7.2650 and whether weakness emerges before any break is sustained.
6) News sentiment + extractive gist
Note: Instrument-specific news matches were not found, so the digest includes broader market/sector headlines.
Sentiment score (avg): -0.024 | Positive: 12% | Neutral: 69% | Negative: 19%
KGNAI AI News Sentiment Score (normalized -1 to +1): Not available (as of —) | Label: Not available | Overall news score: -0.02
Positive Developments
Recent coverage across major financial outlets indicates a modest constructive backdrop in parts of the broader renewables and adjacent technology landscape, with attention on capital activity and investor interest that can periodically lift sector-wide risk appetite. In parallel, some reporting highlights ongoing technology and systems deployment themes (outside the issuer specifically) that can influence headline sensitivity toward energy-transition names. Within this digest, the key takeaway is not issuer-specific catalysts—those were not available in the provided data—but rather a mild, episodic tailwind where “clean energy” and related industrial-tech narratives can attract flows. That said, the quantified mix still shows a small negative tilt on average (-0.024), suggesting constructive items are present but not dominant enough to shift the aggregate tone meaningfully.
Neutral / Mixed Developments
The predominant tone is neutral (69%), reflecting a news tape that is largely informational rather than strongly directional for risk assets. Several items in the feed are macro-political or regulatory in nature and not tightly linked to company-specific fundamentals, which helps explain why the sentiment distribution clusters around neutrality even with occasional positive and negative spikes. For market participants, this tends to translate into a context layer rather than a catalyst layer: price action and technical structure (e.g., resistance at 7.2650 and support at 4.6300) are more likely to dominate near-term behavior than the news flow represented here. With the overall news score at -0.02, the neutral baseline still carries a slight risk skew.
Negative / Risk Signals
Risk items in the digest skew toward policy and geopolitical uncertainty and to pressure narratives around parts of the China technology and EV complex. Even when not directly tied to this issuer, such themes can affect the broader risk premium applied to domestic growth and transition-linked equities. Quantitatively, the negative share sits at 19%, which is not extreme but is enough to keep the average sentiment slightly below zero (-0.024). In periods where technicals show mixed participation (as reflected by Bearish volume/breadth signals such as OBV slope(10) -2.499e+09), a modest negative news skew can matter more—because it can reduce dip-buying urgency and increase sensitivity around key invalidation levels.
What to monitor next
- Whether sentiment remains slightly negative (avg -0.024) or re-centers toward neutral as sector narratives evolve.
- Any shift from sector-level stories to instrument-specific coverage (currently not available in the provided data).
- Whether negative policy/regulatory themes broaden into wider risk-off positioning across related China equities.
Sources referenced: Reuters, Bloomberg, Yahoo Finance, MarketWatch, Investing.com
Snapshot: AI Rank (Short–Mid–Long): Bearish (Bearish–Bearish–Not available) · Technical Confluence: Neutral · Key Levels: Support ~4.63 | Resistance ~7.27 · News Sentiment: Neutral
7) Sources
Not available in the provided data.
You may also like: How KGNAI AI ranks instruments across global markets
Disclaimer: KGNAI provides AI-generated analytics and educational market commentary only. This is not financial advice. Markets involve risk. Always do your own research.