
603129 — Zhejiang CFMoto Power Co Ltd (03-May-2026) | Long-term strength with near-term neutral technical confluence
Zhejiang CFMoto Power Co Ltd (603129) enters 03-May-2026 with a distinctly bullish longer-horizon profile in KGNAI’s cross-sectional ranks, while the short-term posture remains neutral. The yearly rank sits at #4 (top decile), and the 3-month and 6-month ranks remain constructive at #22 and #39, respectively—suggesting persistent relative strength versus the 1292-instrument China universe. At the same time, the technical blend is more balanced: the 18-signal confluence score is -0.111 (Neutral), and the DRL technical rank is #656 (Neutral). Momentum readings show mixed internals—RSI(14) 50.51 (Neutral) alongside a MACD histogram of -1.0255—while volatility is moderate with Bollinger Bandwidth 0.1036. Key decision zones remain anchored at support ~223.0850 and resistance ~282.0000.
- Rank stance: Short-term Neutral; Mid-term Bullish; Long-term Bullish (Yearly rank #4).
- Technical confluence label: Neutral (Overall Technical Score -0.082).
- Key levels: Support ~223.0850 | Resistance ~282.0000.
- News sentiment bias: Neutral (avg 0.026; 75% neutral share).
- Confirmation / invalidation: Continuation risk-on improves on a volume-backed break above 282.0000; deterioration risk increases on a close below 223.0850.
KGNAI evaluates assets using large cross-sectional datasets built from millions of structured data points. Inputs incorporate fundamental metrics, technical structures, and systematically processed news sentiment. Statistical models, machine learning, and AI frameworks are used to assess relative positioning, signal alignment, and probabilistic behavior across broad universes.
- Ranks are comparative across the tracked universe, not absolute price targets.
- Confluence reflects alignment among independent signal groups.
- Support/resistance levels are probabilistic decision zones, not guarantees.
- Sentiment provides contextual bias within the broader analytical framework.
1) KGNAI AI Analysis
Region: CHINA
Total universe size: 1292 ranked instruments
- Daily rank: #647 out of 1292 — Neutral
- Weekly rank: #494 out of 1292 — Neutral
- Monthly rank: #209 out of 1292 — Bullish
- 3-Monthly rank: #22 out of 1292 — Bullish
- 6-Monthly rank: #39 out of 1292 — Bullish
- Yearly rank: #4 out of 1292 — Bullish
The rank stack is defined by a clear time-horizon split. Short-horizon ranks sit near the middle of the universe (daily #647, weekly #494), consistent with a market that is not currently offering a strong near-term statistical edge. By contrast, the longer windows cluster in the upper tier: the 3-month rank at #22 and yearly rank at #4 place 603129 among the strongest relative performers in KGNAI’s China universe.
That divergence typically reflects a transition from trend leadership (longer windows) into short-term consolidation (near windows), rather than a full trend reversal. The monthly rank of #209 supports this interpretation: it remains bullish, but not as extreme as the 3–12 month readings, implying the market may be digesting prior gains.
Structurally, this configuration often benefits from a “confirm rather than anticipate” approach: use the longer-horizon strength as the backdrop, but treat the neutral daily/weekly posture as a reminder that entry timing and confirmation conditions matter. KGNAI’s term view—Short-term Neutral, Mid-term Bullish, Long-term Bullish—summarizes that balance without requiring a point forecast.
Want the full universe and complete rank tables? Unlock full access on KGNAI: https://www.kgnai.com/pricing
2) Price & trend overview
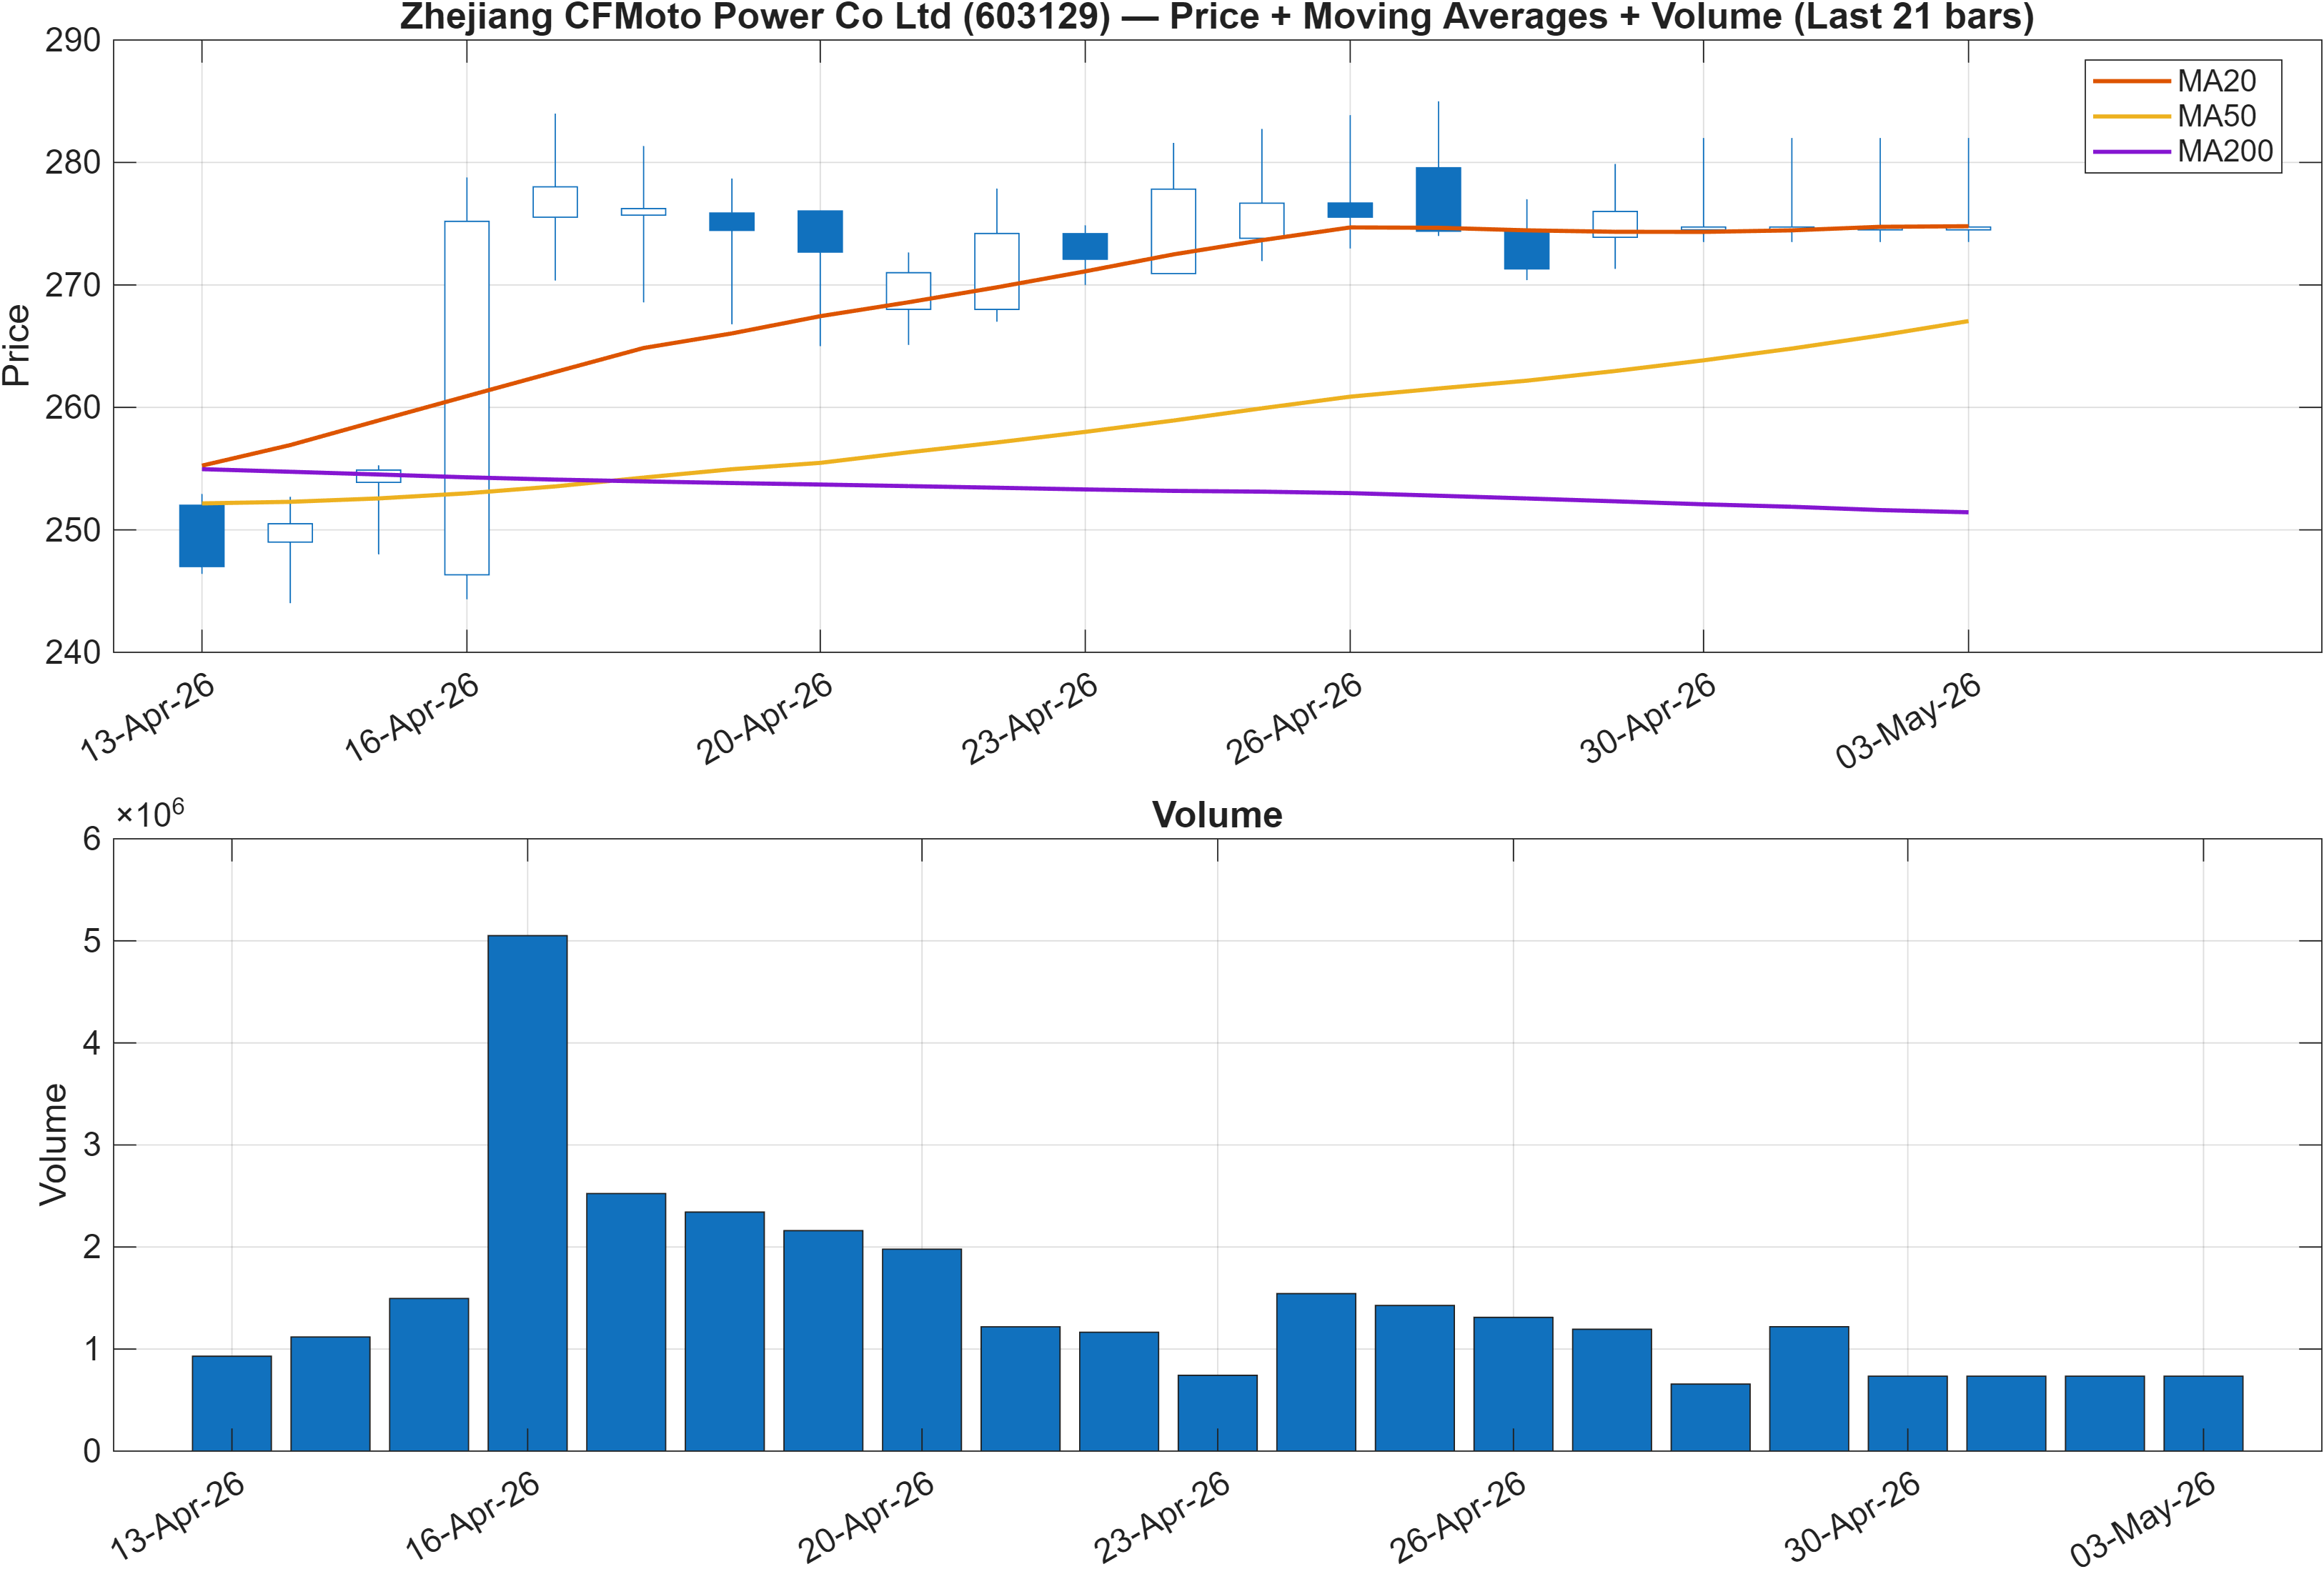
Trend structure remains constructive on standard moving-average diagnostics. The signal states that close vs MA50 is Bullish and MA50 vs MA200 is Bullish, a combination typically associated with trend persistence rather than mean-reversion regimes. This aligns with the longer-horizon KGNAI ranks (notably the #22 3-month and #4 yearly readings), which tend to strengthen when intermediate trends remain intact.
Alignment vs. divergence across horizons
The more nuanced read is that trend strength can coexist with near-term neutrality. With the daily rank at #647 and weekly at #494, the market is not currently pricing a strong short-window impulse despite the positive MA structure. In practical trading terms, that often corresponds to range-building above rising averages or a slower grind where momentum oscillators can flatten without breaking the trend.
Participation context (volume) within a trend regime
Because the continuation condition referenced later explicitly requires a break with volume, the price/MA alignment should be treated as a necessary—but not sufficient—feature for follow-through. The nearest high-level decision zones remain 223.0850 and 282.0000, which provide a framework for assessing whether trend structure is translating into directional expansion or simply holding a constructive base.
Interpretation: Close vs MA50 = Bullish, MA50 vs MA200 = Bullish.
3) Momentum & volatility dashboard
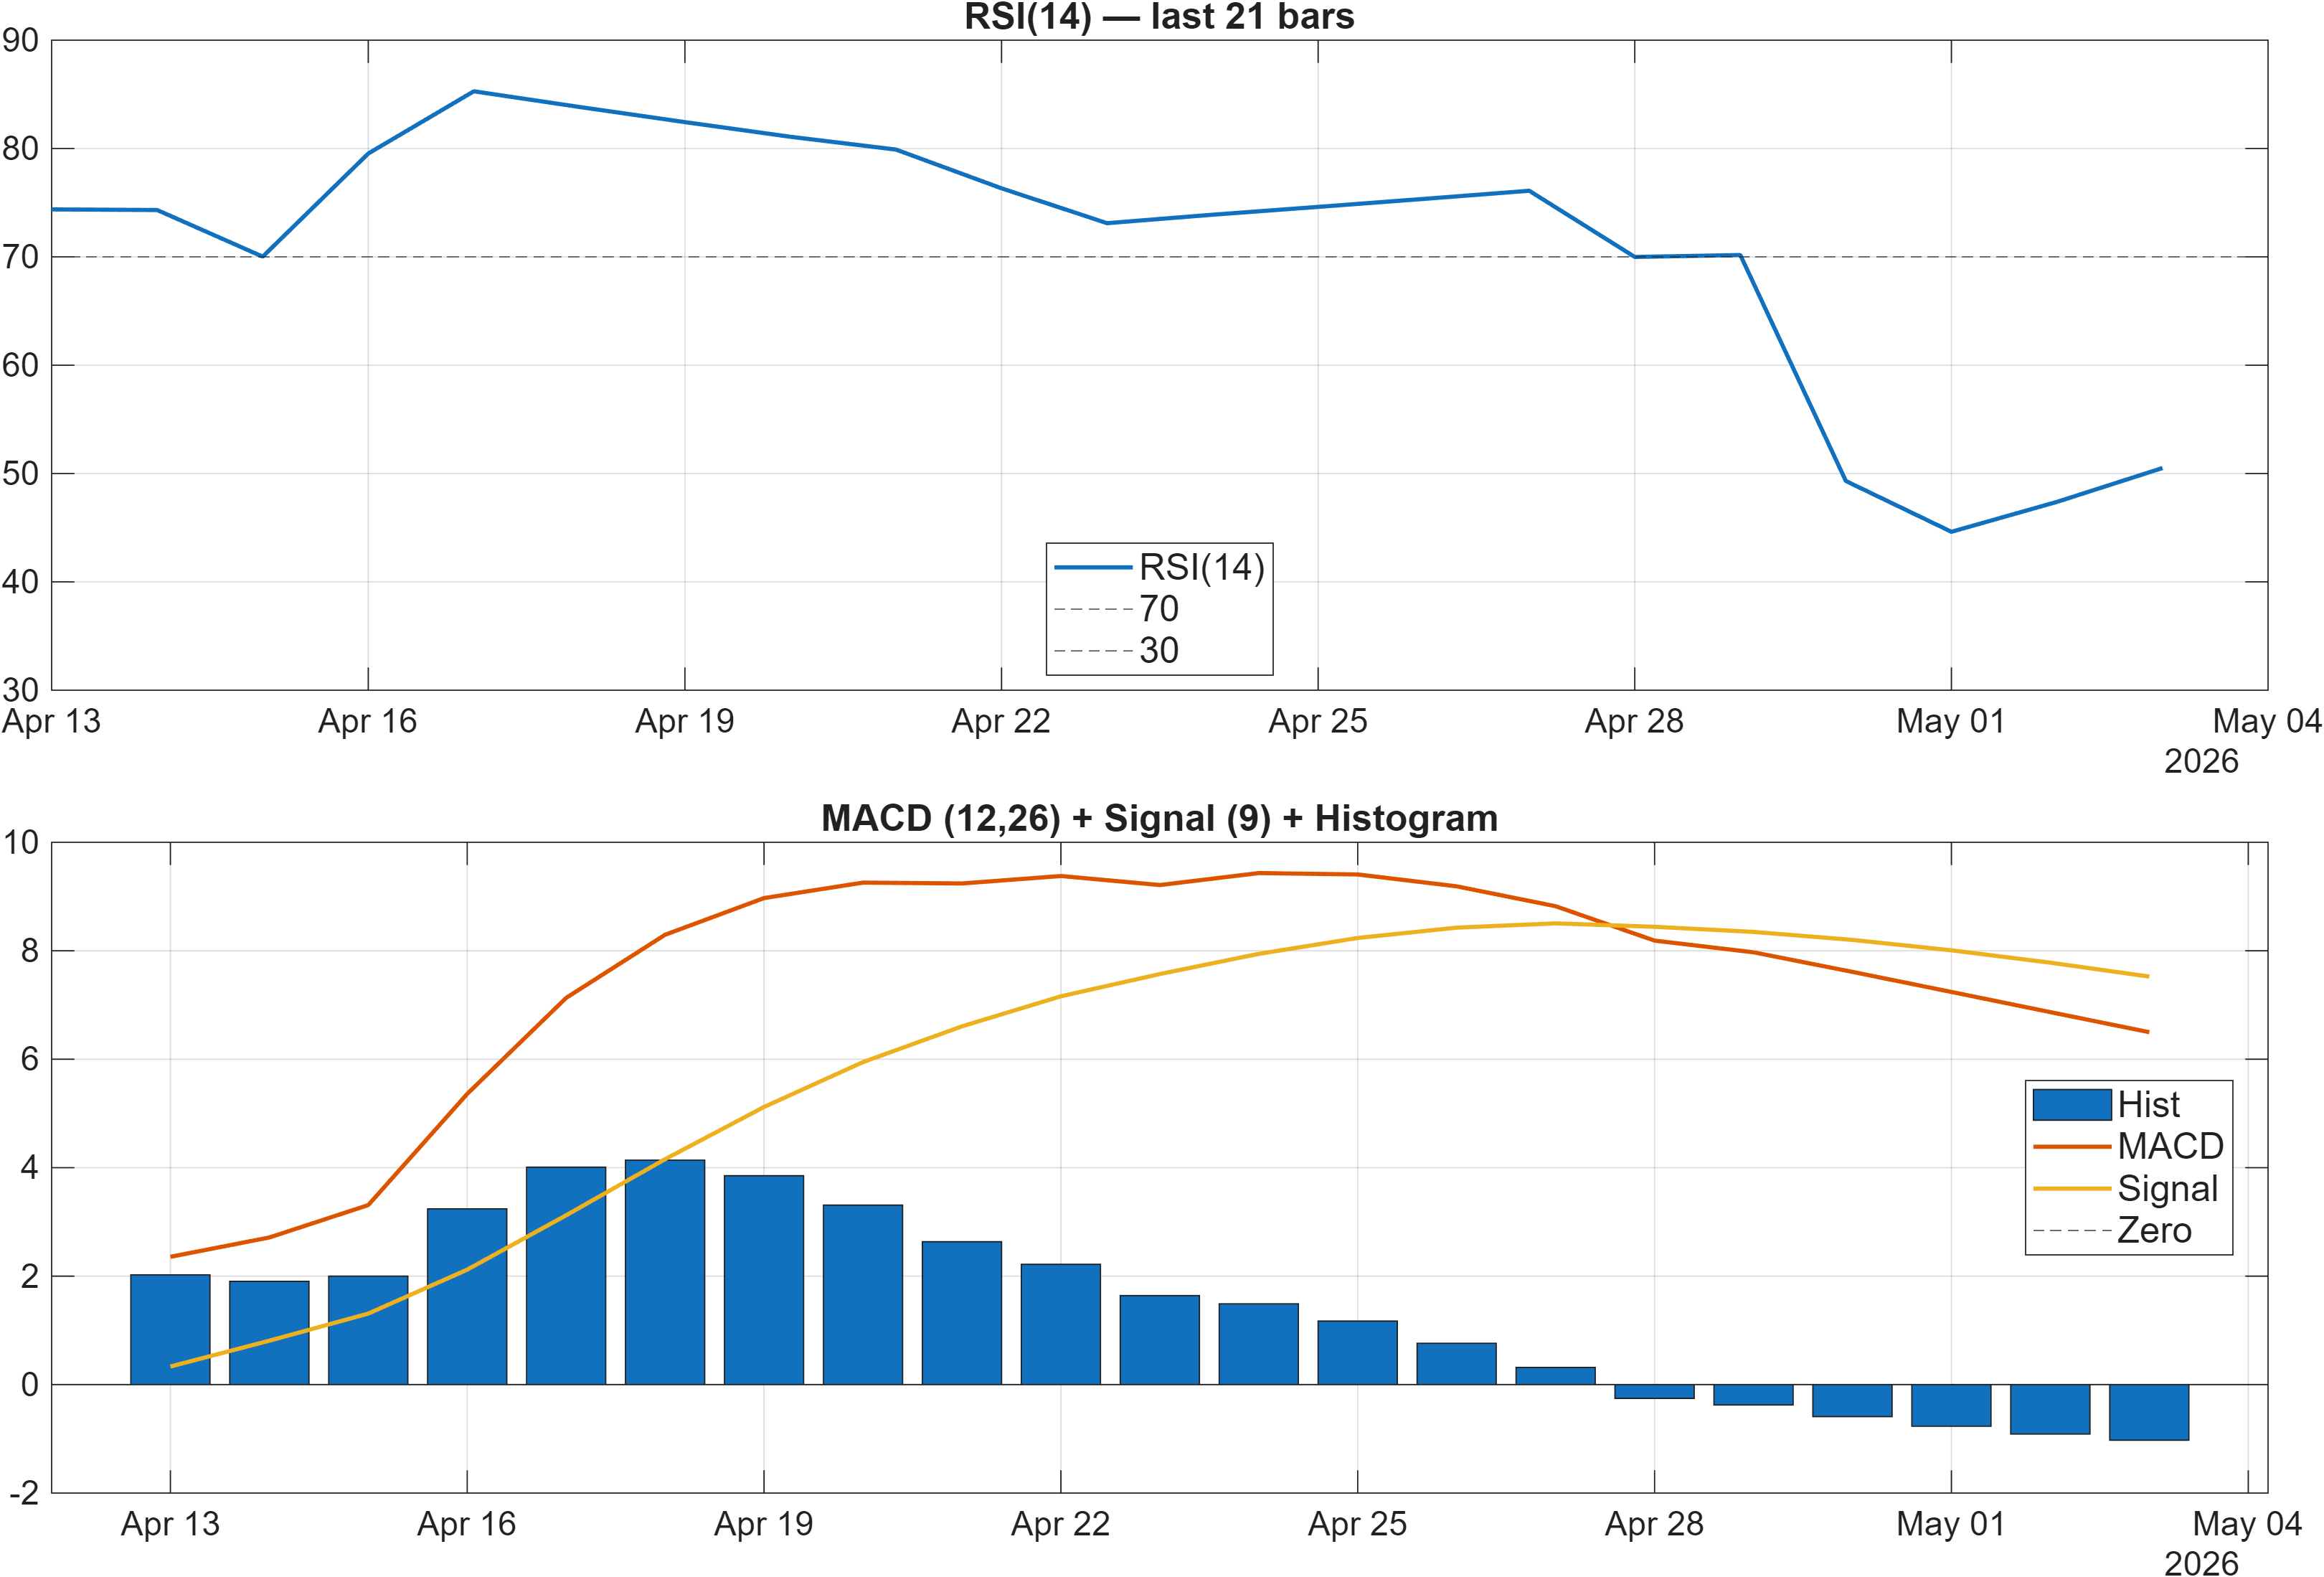
Interpretation: RSI bias = Neutral, MACD hist = -1.0255.
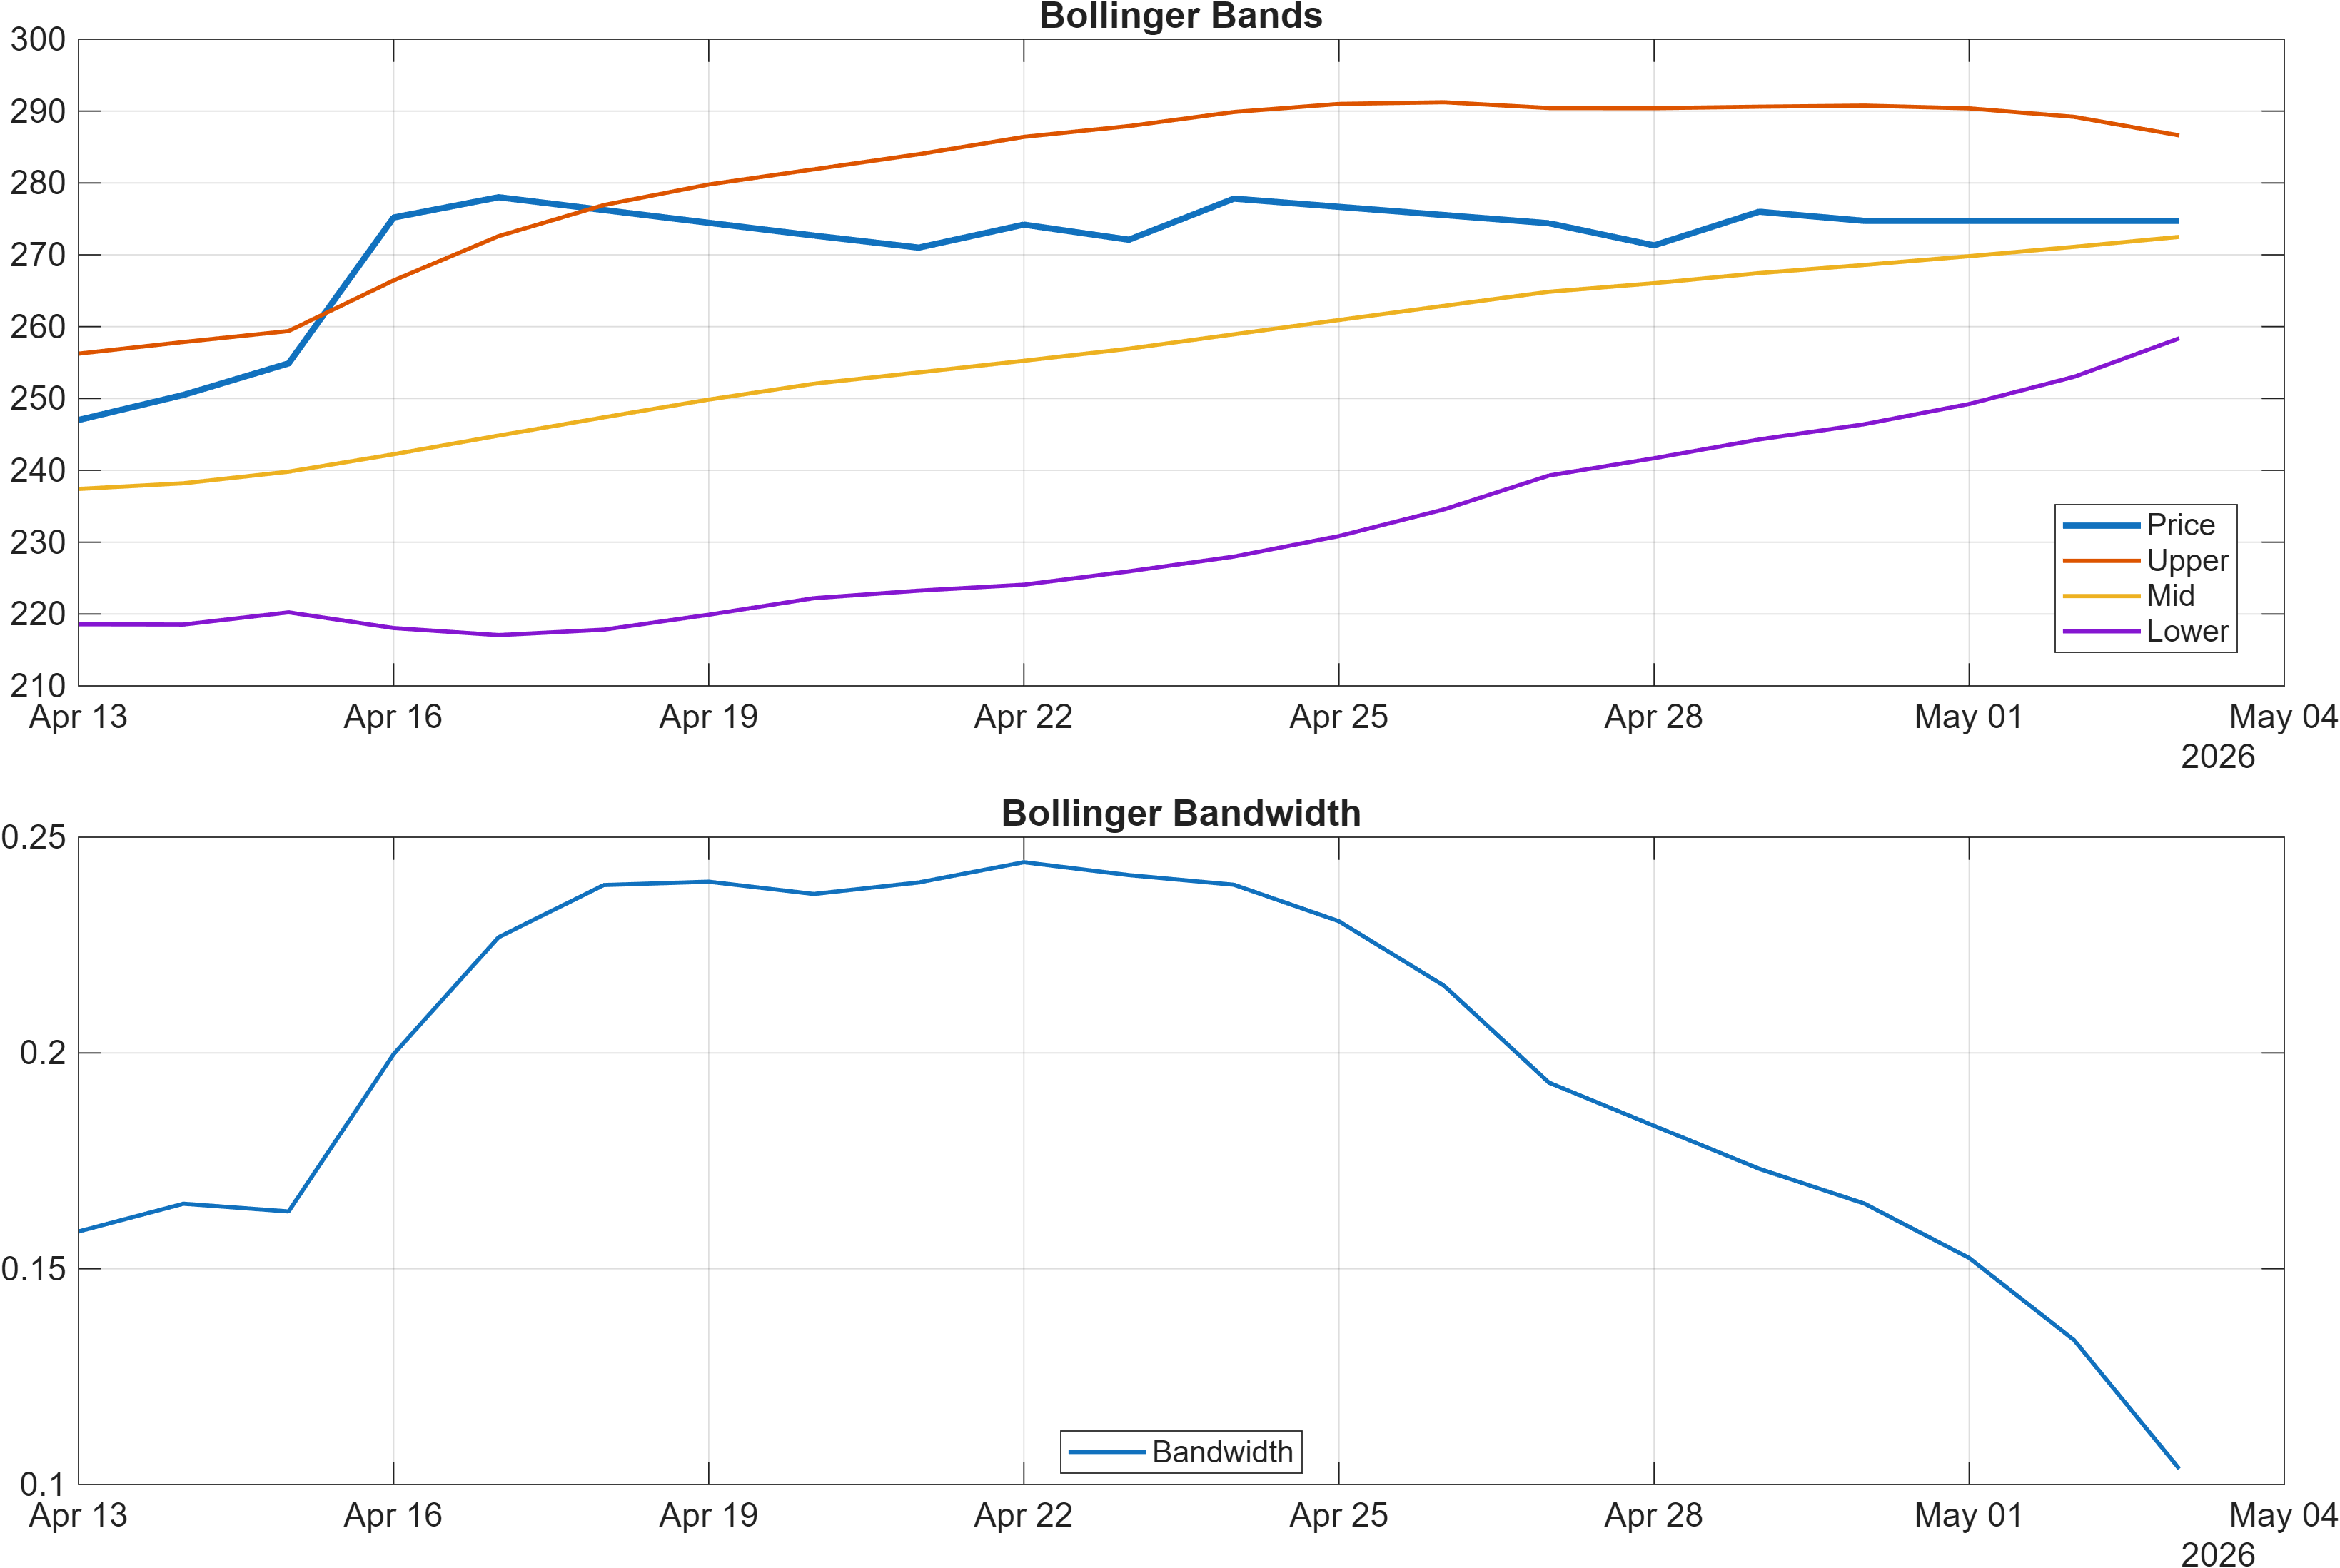
Interpretation: Bandwidth (volatility regime) latest = 0.1036.
Momentum and volatility read as compressed rather than impulsive, which fits the broader “bullish long-term / neutral short-term” configuration. RSI(14) sits at 50.51, a midpoint reading that typically signals balance between buying and selling pressure rather than an overbought or oversold condition. Meanwhile, the MACD histogram at -1.0255 indicates the recent momentum impulse has softened, even if the broader trend backdrop remains positive.
Trend persistence vs. momentum exhaustion
A negative MACD histogram alongside a neutral RSI often shows cooling momentum without structural breakdown. This is consistent with trend-following regimes where pullbacks and consolidations occur while price remains supported by moving averages (Section 2). Whether that cooling becomes a deeper drawdown depends on how price behaves around the defined support zone at 223.0850 and whether momentum re-accelerates into the resistance area.
Volatility regime and expectation management
Bollinger Bandwidth at 0.1036 suggests a moderate volatility environment, not an extreme expansion phase. In such regimes, breakouts can be more selective: they often require a clearer catalyst in price/volume behavior to escape the prevailing range dynamics. This volatility context also helps explain why the technical blend (Section 5) can remain Neutral despite strong multi-month rank strength.
4) Support / Resistance zones
Support ~ 223.0850 | Resistance ~ 282.0000
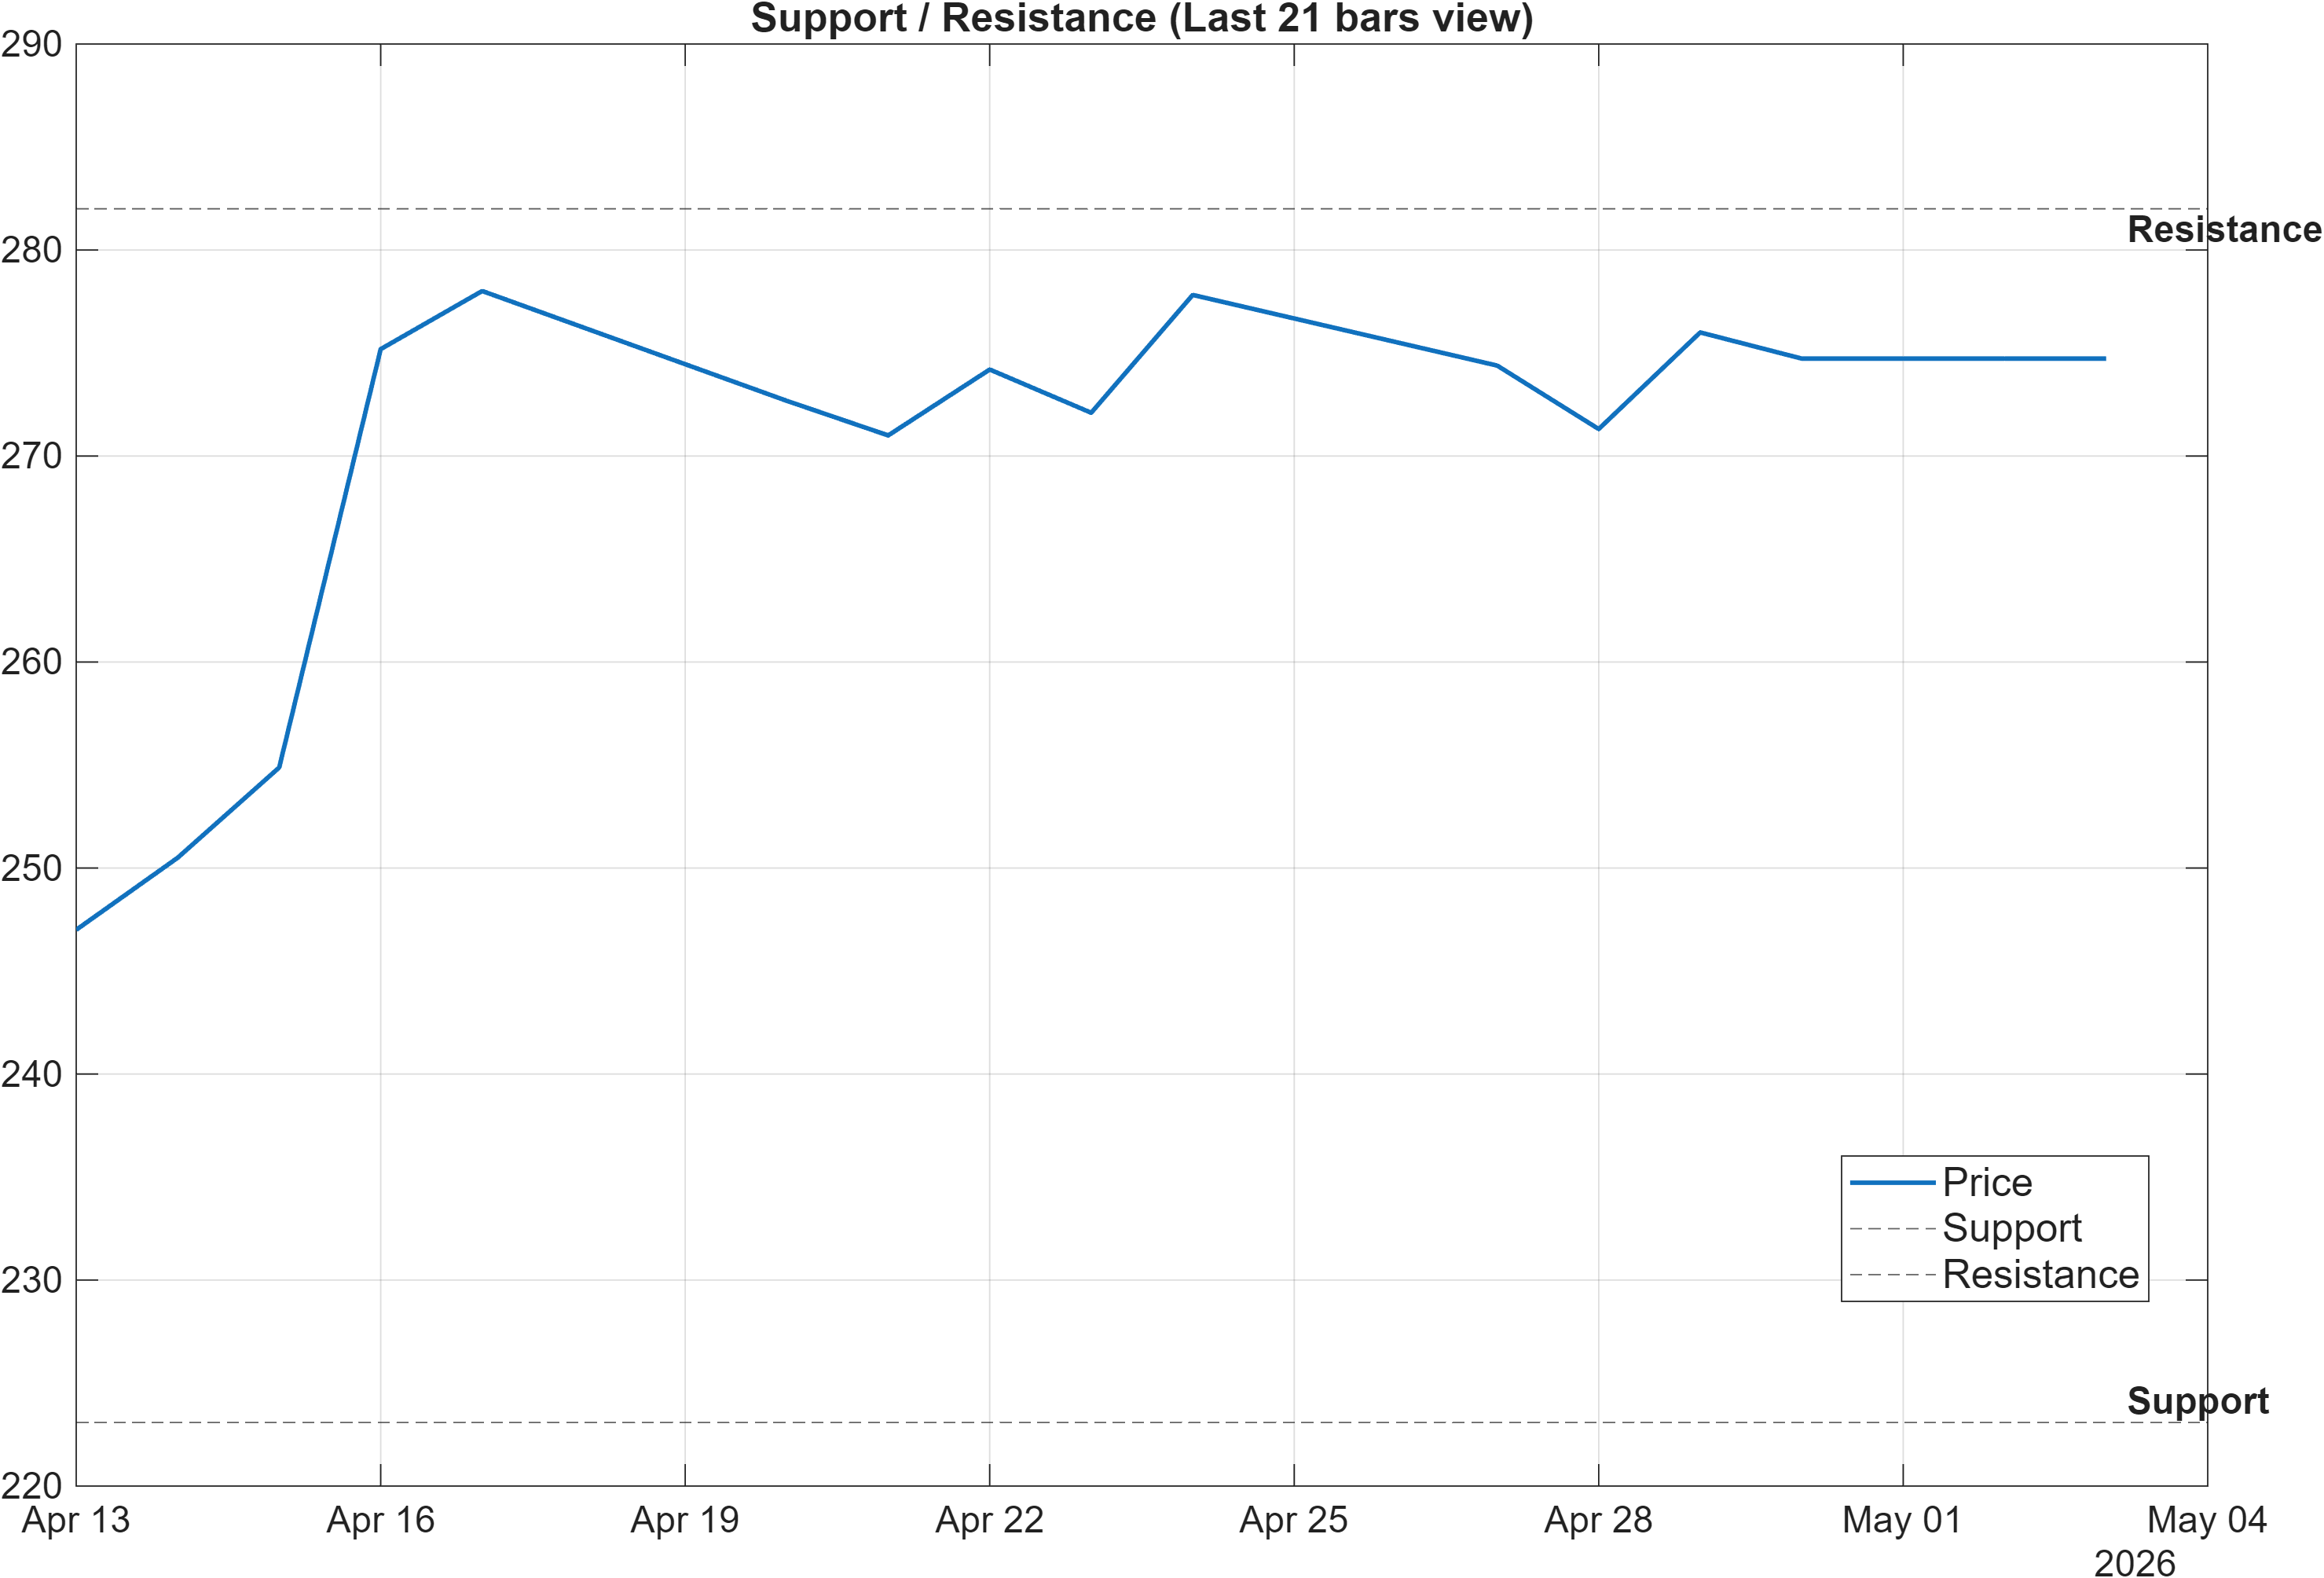
The current map is clean: 223.0850 defines the primary downside decision zone, while 282.0000 caps the upside as the key resistance level. With longer-horizon ranks still bullish (3-month #22, 6-month #39, yearly #4), these levels matter less as “targets” and more as validation checkpoints for whether that longer-term strength remains intact.
Regime continuation vs. transition
A break above 282.0000 with volume would be consistent with a transition from consolidation into renewed trend continuation, particularly in a volatility regime (Bandwidth 0.1036) that can shift quickly once price leaves a tight structure. Conversely, a close below 223.0850 would raise the probability that the neutral short-term ranks (daily #647, weekly #494) are not merely “noise,” but early signs of regime deterioration.
Using levels to manage signal conflict
This is a market where signals are not unanimously aligned: momentum is mixed (RSI 50.51 vs MACD histogram -1.0255), and the blended technical score is neutral (Section 5). In that context, support/resistance zones become the disciplined way to arbitrate between “trend intact” and “trend compromised” without overfitting to a single oscillator.
Scenario view: Break above resistance with volume → continuation. Close below support → signal deterioration risk.
5) Quant Technical Dashboard (18 Signals)
KGNAI AI Technical Analysis Score (Deep Reinforcement Learning): Rank #656 out of 1292 (Rank 1 represents the strongest technical positioning and a higher probability of favorable price behavior. As ranks increase toward the maximum, the probability of favorable outcomes weakens and bearish positioning becomes more dominant.) | Label: Neutral | Score: -0.015
18-Signal Technical Confluence Score: -0.111 (Neutral)
Overall Technical Score (18-signal confluence + DRL rank blend): -0.082 (Neutral)
Note: The blended score reflects signal strength weighted against broader AI technical ranking, which may temporarily diverge.
Blended technical score breakdown: -0.082 (Neutral | Bull 5 / Bear 7 / Neutral 6)
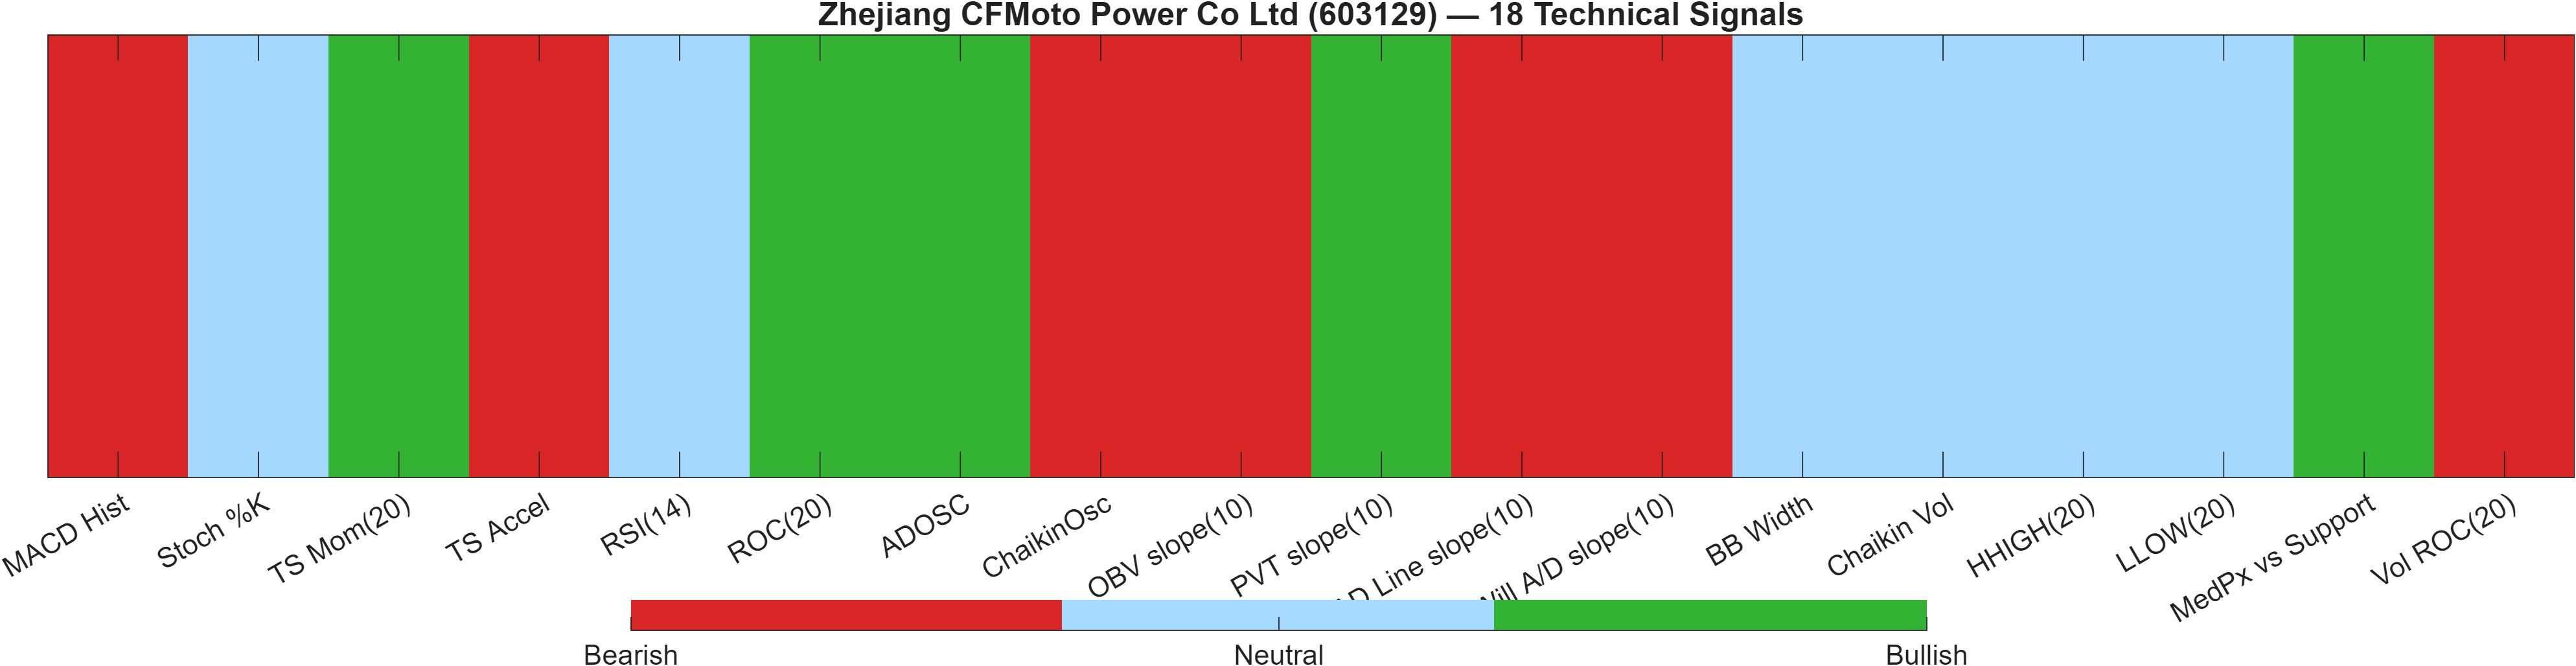
The technical dashboard is best read as net-neutral with internal disagreement. The 18-signal confluence score is -0.111 (Neutral), and the blended overall technical score is -0.082 (Neutral). The balance of signals—Bull 5 / Bear 7 / Neutral 6—explains why the model does not currently classify the setup as a high-conviction technical “all-clear,” despite the bullish moving-average structure and strong longer-horizon ranks.
Where the dashboard agrees—and where it does not
Momentum is mixed: RSI(14) 50.51 is neutral, while MACD histogram reads bearish (table value -1.025), signaling softer incremental momentum. At the same time, some rate-of-change measures remain supportive, including ROC(20) 9.673 and TS Mom(20) 24.23 (both bullish). This combination often reflects a market that has not broken trend, but is rotating through a digestion phase.
Participation and breadth as the gating factor
Several participation-style inputs skew bearish, including OBV slope(10) -2.56e+06 and Vol ROC(20) -34.36, which can be consistent with reduced follow-through during rallies. That matters because a resistance break at 282.0000 is explicitly framed as needing volume confirmation. Volatility remains neutral via BB Width 0.1036, implying the setup may require a decisive trigger to shift from neutral confluence to a clearer directional state.
Signal table (Bull/Bear/Neutral)
| Indicator | Value | Signal |
|---|---|---|
| MACD Hist | -1.025 | Bearish |
| Stoch %K | 29.71 | Neutral |
| TS Mom(20) | 24.23 | Bullish |
| TS Accel | -3.62 | Bearish |
| RSI(14) | 50.51 | Neutral |
| ROC(20) | 9.673 | Bullish |
| ADOSC | 51.35 | Bullish |
| ChaikinOsc | -9.62e+05 | Bearish |
| OBV slope(10) | -2.56e+06 | Bearish |
| PVT slope(10) | 2.652e+04 | Bullish |
| AD Line slope(10) | -3.977e+06 | Bearish |
| Will A/D slope(10) | -26.38 | Bearish |
| BB Width | 0.1036 | Neutral |
| Chaikin Vol | -12.34 | Neutral |
| HHIGH(20) | 285 | Neutral |
| LLOW(20) | 244 | Neutral |
| MedPx vs Support | 54.66 | Bullish |
| Vol ROC(20) | -34.36 | Bearish |
Interpretation: Indicator-level signals form the base confluence, which is then adjusted using a separate AI-driven technical ranking model. The final technical score summarizes this combined view.
6) News sentiment + extractive gist
Note: Instrument-specific news matches were not found, so the digest includes broader market/sector headlines. Links are provided for verification.
Sentiment score (avg): 0.026 | Positive: 19% | Neutral: 75% | Negative: 6%
KGNAI AI News Sentiment Score (normalized -1 to +1): Not available (as of —) | Label: Not available | Overall news score: 0.03
Positive Developments
Recent coverage across major financial outlets indicates a modestly constructive tone in the broader backdrop, but it is not strongly asset-specific. The news mix contains a limited positive skew (19% positive) and a small negative share (6%), with the average sentiment reading slightly above zero at 0.026. In this setting, positive narratives tend to function as contextual tailwinds rather than direct drivers, particularly because instrument-level matches were not found in the provided data. For 603129, that matters because the technical picture is currently neutral (overall technical score -0.082) while longer-horizon ranks remain bullish (yearly #4). A modestly constructive news tone can help sustain risk appetite during consolidation, but the price-based confirmation condition still dominates: the market will generally require a clearer impulse—often expressed through a volume-backed move—before news context translates into directional expansion.
Neutral / Mixed Developments
The dominant characteristic is neutrality: 75% of the news classification is neutral, consistent with an information flow that is not strongly one-sided. This aligns with the report’s broader “pause within trend” profile—neutral short-term ranks (daily #647, weekly #494) alongside stronger multi-month standings. With the normalized KGNAI news sentiment score listed as Not available, the news layer should be treated as a context overlay rather than a primary signal. In practice, neutral-heavy news regimes often coincide with more technically driven price discovery, where levels such as 223.0850 and 282.0000 carry increased importance for decision-making.
Negative / Risk Signals
Risk content is present but limited in share (6% negative), suggesting no broad-based deterioration in tone within the provided aggregation. However, when technical confluence is neutral and momentum is mixed (RSI 50.51, MACD histogram -1.0255), even a small negative pulse can matter if it coincides with weakening participation (e.g., bearish volume-related inputs in the technical dashboard). The key is whether negative narratives amplify a breakdown through support rather than simply adding noise during consolidation. For this report, the clean invalidation zone remains a close below 223.0850; absent that, negative news flow is more likely to express as volatility around range boundaries than as a confirmed trend change.
- Whether sentiment stays near-neutral (avg 0.026) or the negative share rises materially above 6%.
- Any news-driven volatility expansion relative to Bollinger Bandwidth (0.1036).
- Price behavior at 282.0000 (break with volume) versus 223.0850 (close below).
Sources referenced: Reuters, Bloomberg, Yahoo Finance, MarketWatch, Investing.com
Snapshot: AI Rank (Short–Mid–Long): Mixed (Bullish tilt) (Neutral–Bullish–Bullish) · Technical Confluence: Neutral · Key Levels: Support ~223.09 | Resistance ~282.00 · News Sentiment: Neutral
7) Sources
Not available in the provided data.
You may also like: How KGNAI AI ranks instruments across global markets
Disclaimer: KGNAI provides AI-generated analytics and educational market commentary only. This is not financial advice. Markets involve risk. Always do your own research.