
601169 Bank of Beijing Co Ltd — Neutral cross-horizon ranks with bullish technical confluence (24-Apr-2026)
Bank of Beijing Co Ltd (601169) screens as a mixed setup when separating cross-sectional ranks from pure technical structure. Across KGNAI’s 1292-instrument China universe, the stock sits in the neutral zone on most horizons (e.g., daily #337 and weekly #274), while the longer-horizon monthly rank (#829) leans comparatively weaker within the universe. In contrast, the technical layer is notably stronger: the Deep Reinforcement Learning technical rank is #53 with a 0.918 score, and the blended technical score is 0.781 (Bullish). Momentum indicators support the positive technical bias, with RSI(14) at 68 and a positive MACD histogram reading, while volatility remains contained with a Bollinger bandwidth of 0.0228. Key decision zones remain well-defined at support ~5.3500 and resistance ~5.5300, framing continuation versus deterioration scenarios.
- Rank stance (Short / Mid / Long): Neutral / Neutral / Neutral (daily #337, weekly #274, monthly #829 in a 1292-instrument universe)
- Technical confluence: Bullish (overall technical score 0.781; DRL technical rank #53)
- Key levels: Support ~5.3500; Resistance ~5.5300
- News sentiment bias: Neutral (avg sentiment -0.013; 94% neutral; 6% negative)
- Confirmation / invalidation: A break above 5.5300 with volume supports continuation; a close below 5.3500 raises deterioration risk
KGNAI evaluates assets using large cross-sectional datasets built from millions of structured data points. Inputs incorporate fundamental metrics, technical structures, and systematically processed news sentiment. Statistical models, machine learning, and AI frameworks are used to assess relative positioning, signal alignment, and probabilistic behavior across broad universes.
- Ranks are comparative across the tracked universe, not absolute price targets.
- Confluence reflects alignment among independent signal groups.
- Support/resistance levels are probabilistic decision zones, not guarantees.
- Sentiment provides contextual bias within the broader analytical framework.
1) KGNAI AI Analysis
Region: CHINA
Total universe size: 1292 ranked instruments
- Daily rank: #337 out of 1292 — Neutral
- Weekly rank: #274 out of 1292 — Neutral
- Monthly rank: #829 out of 1292 — Neutral
- 3-Monthly rank: #335 out of 1292 — Neutral
- 6-Monthly rank: #486 out of 1292 — Neutral
- Yearly rank: #410 out of 1292 — Neutral
The cross-horizon ranking profile for 601169 is best described as stable-neutral with a long-horizon soft spot. Daily (#337) and 3-month (#335) sit in a similar neighborhood, suggesting the shorter-term relative position has not materially drifted versus the broader 1292-name universe. Weekly strength improves modestly (#274), which is consistent with a near-term firming in comparative behavior rather than a full regime shift.
The monthly rank (#829) is the outlier: it falls into the lower third of the universe, implying that the stock’s longer-horizon characteristics (as captured by KGNAI’s composite tests) have been less favorable relative to peers. Importantly, the 6-month (#486) and yearly (#410) ranks pull back toward the mid-pack, which reduces the likelihood that the monthly weakness is a broad-based, persistent underperformance signal. Instead, it reads as a timeframe divergence—often seen when shorter-term market structure improves faster than longer-term factor positioning.
In practical positioning terms, this configuration typically warrants a focus on whether stronger technical conditions can translate into sustained relative improvement, particularly if the stock can hold key structural levels (support ~5.3500) while attempting to clear nearby overhead supply (resistance ~5.5300). The term view remains explicitly Neutral across short, mid, and long horizons in the provided data, reinforcing that ranks are not signaling an extreme condition despite notable technical strength elsewhere in the report.
KGNAI ranks each instrument across large universes using multiple proprietary AI tests and statistical models (millions of data points). Lower ranks generally indicate stronger probability of favorable performance behavior, while higher ranks indicate weaker probability and more bearish positioning.
Term view: Short-term: Neutral. Mid-term: Neutral. Long-term: Neutral.
Want the full universe and complete rank tables? Unlock full access on KGNAI: https://www.kgnai.com/pricing
2) Price & trend overview
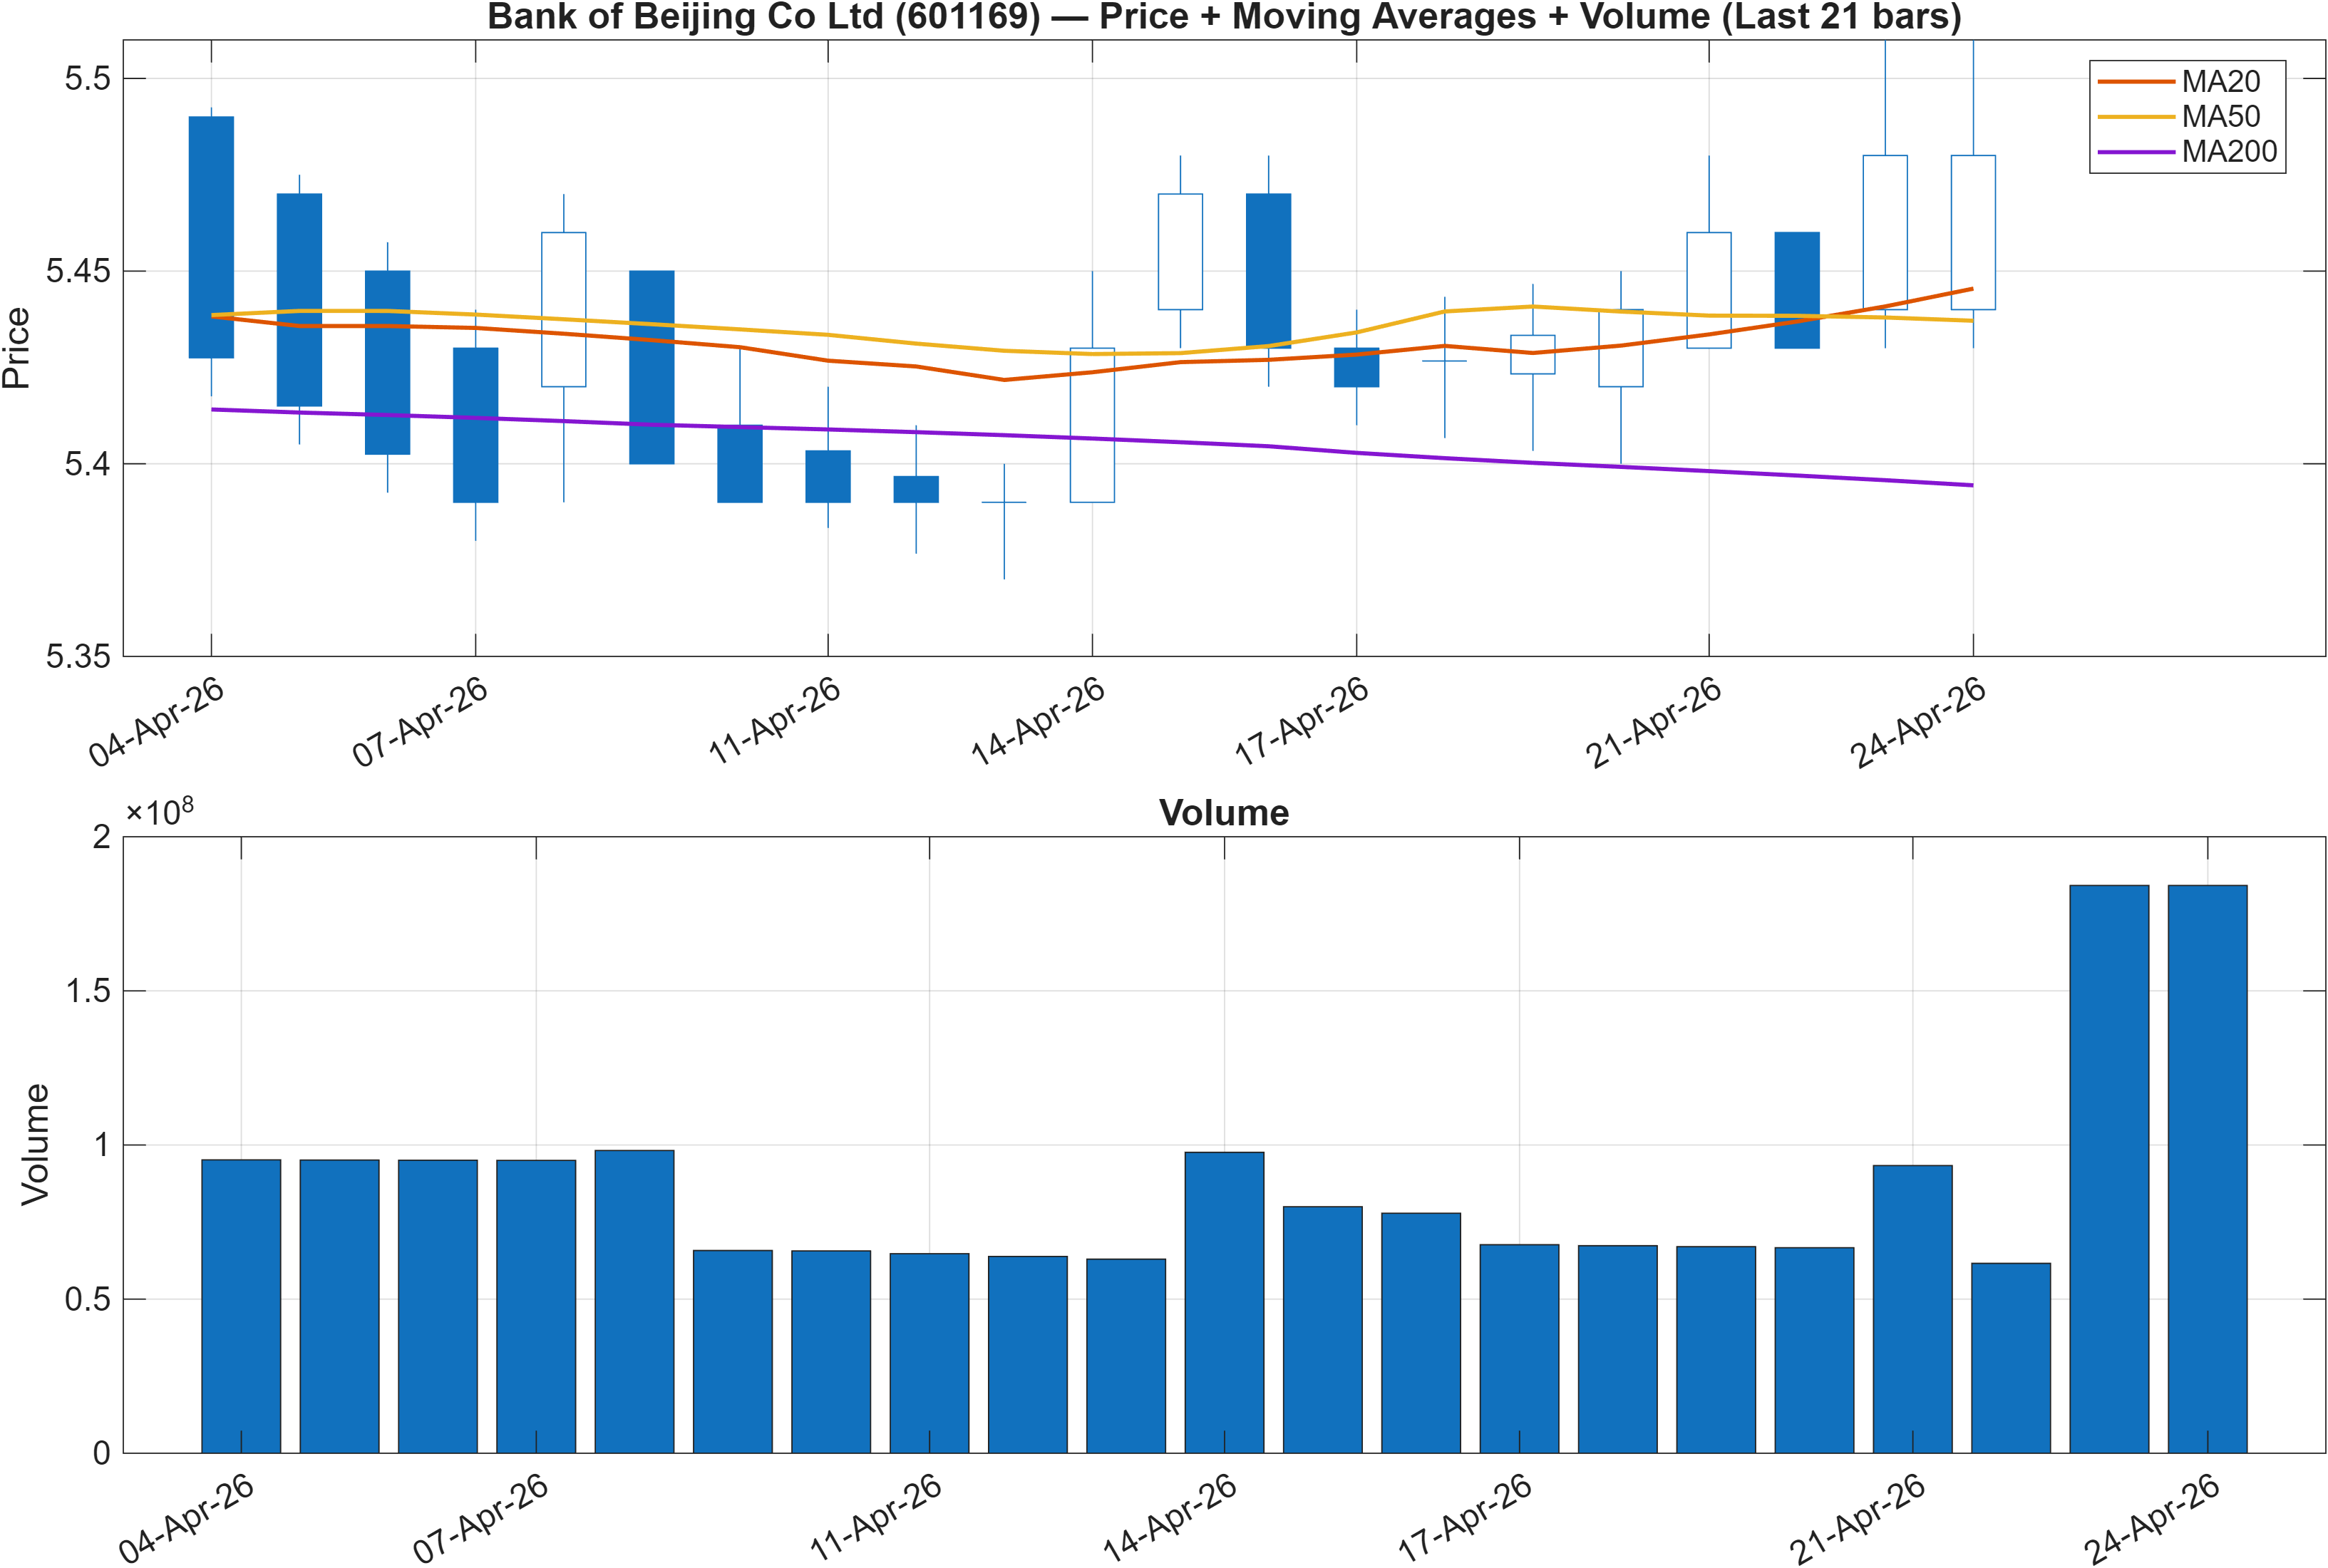
Trend structure is currently defined by a double confirmation from moving averages: the close is bullish versus the MA50, and the MA50 is bullish versus the MA200. This configuration typically indicates that the market is recognizing both a short-to-intermediate trend and a broader baseline trend in the same direction, reducing the probability that recent upside is purely mean-reversion noise.
Alignment vs. divergence: ranks lag a technically constructive tape
The most informative feature is the gap between trend structure and cross-sectional ranks. While price/MA alignment points to constructive trend conditions, the instrument’s universe ranks remain neutral (e.g., daily #337 and yearly #410). That combination often occurs when a name is improving technically but still not capturing broader factor leadership—an important distinction for investors who allocate comparatively across a basket of China-listed instruments.
Participation and follow-through: what the chart is implicitly testing
With resistance framed at 5.5300 and support at 5.3500, the prevailing trend is effectively being tested within a tight decision corridor. A market that is already above the MA50 and supported by a rising MA50/MA200 relationship often needs fresh participation to convert structure into continuation; otherwise, price can drift back toward support even without a full trend break. This is where the later volume-flow and momentum readings (including the positive MACD histogram and bullish RSI bias) matter: they function as “quality checks” on whether trend persistence remains credible.
Interpretation: Close vs MA50 = Bullish, MA50 vs MA200 = Bullish.
3) Momentum & volatility dashboard
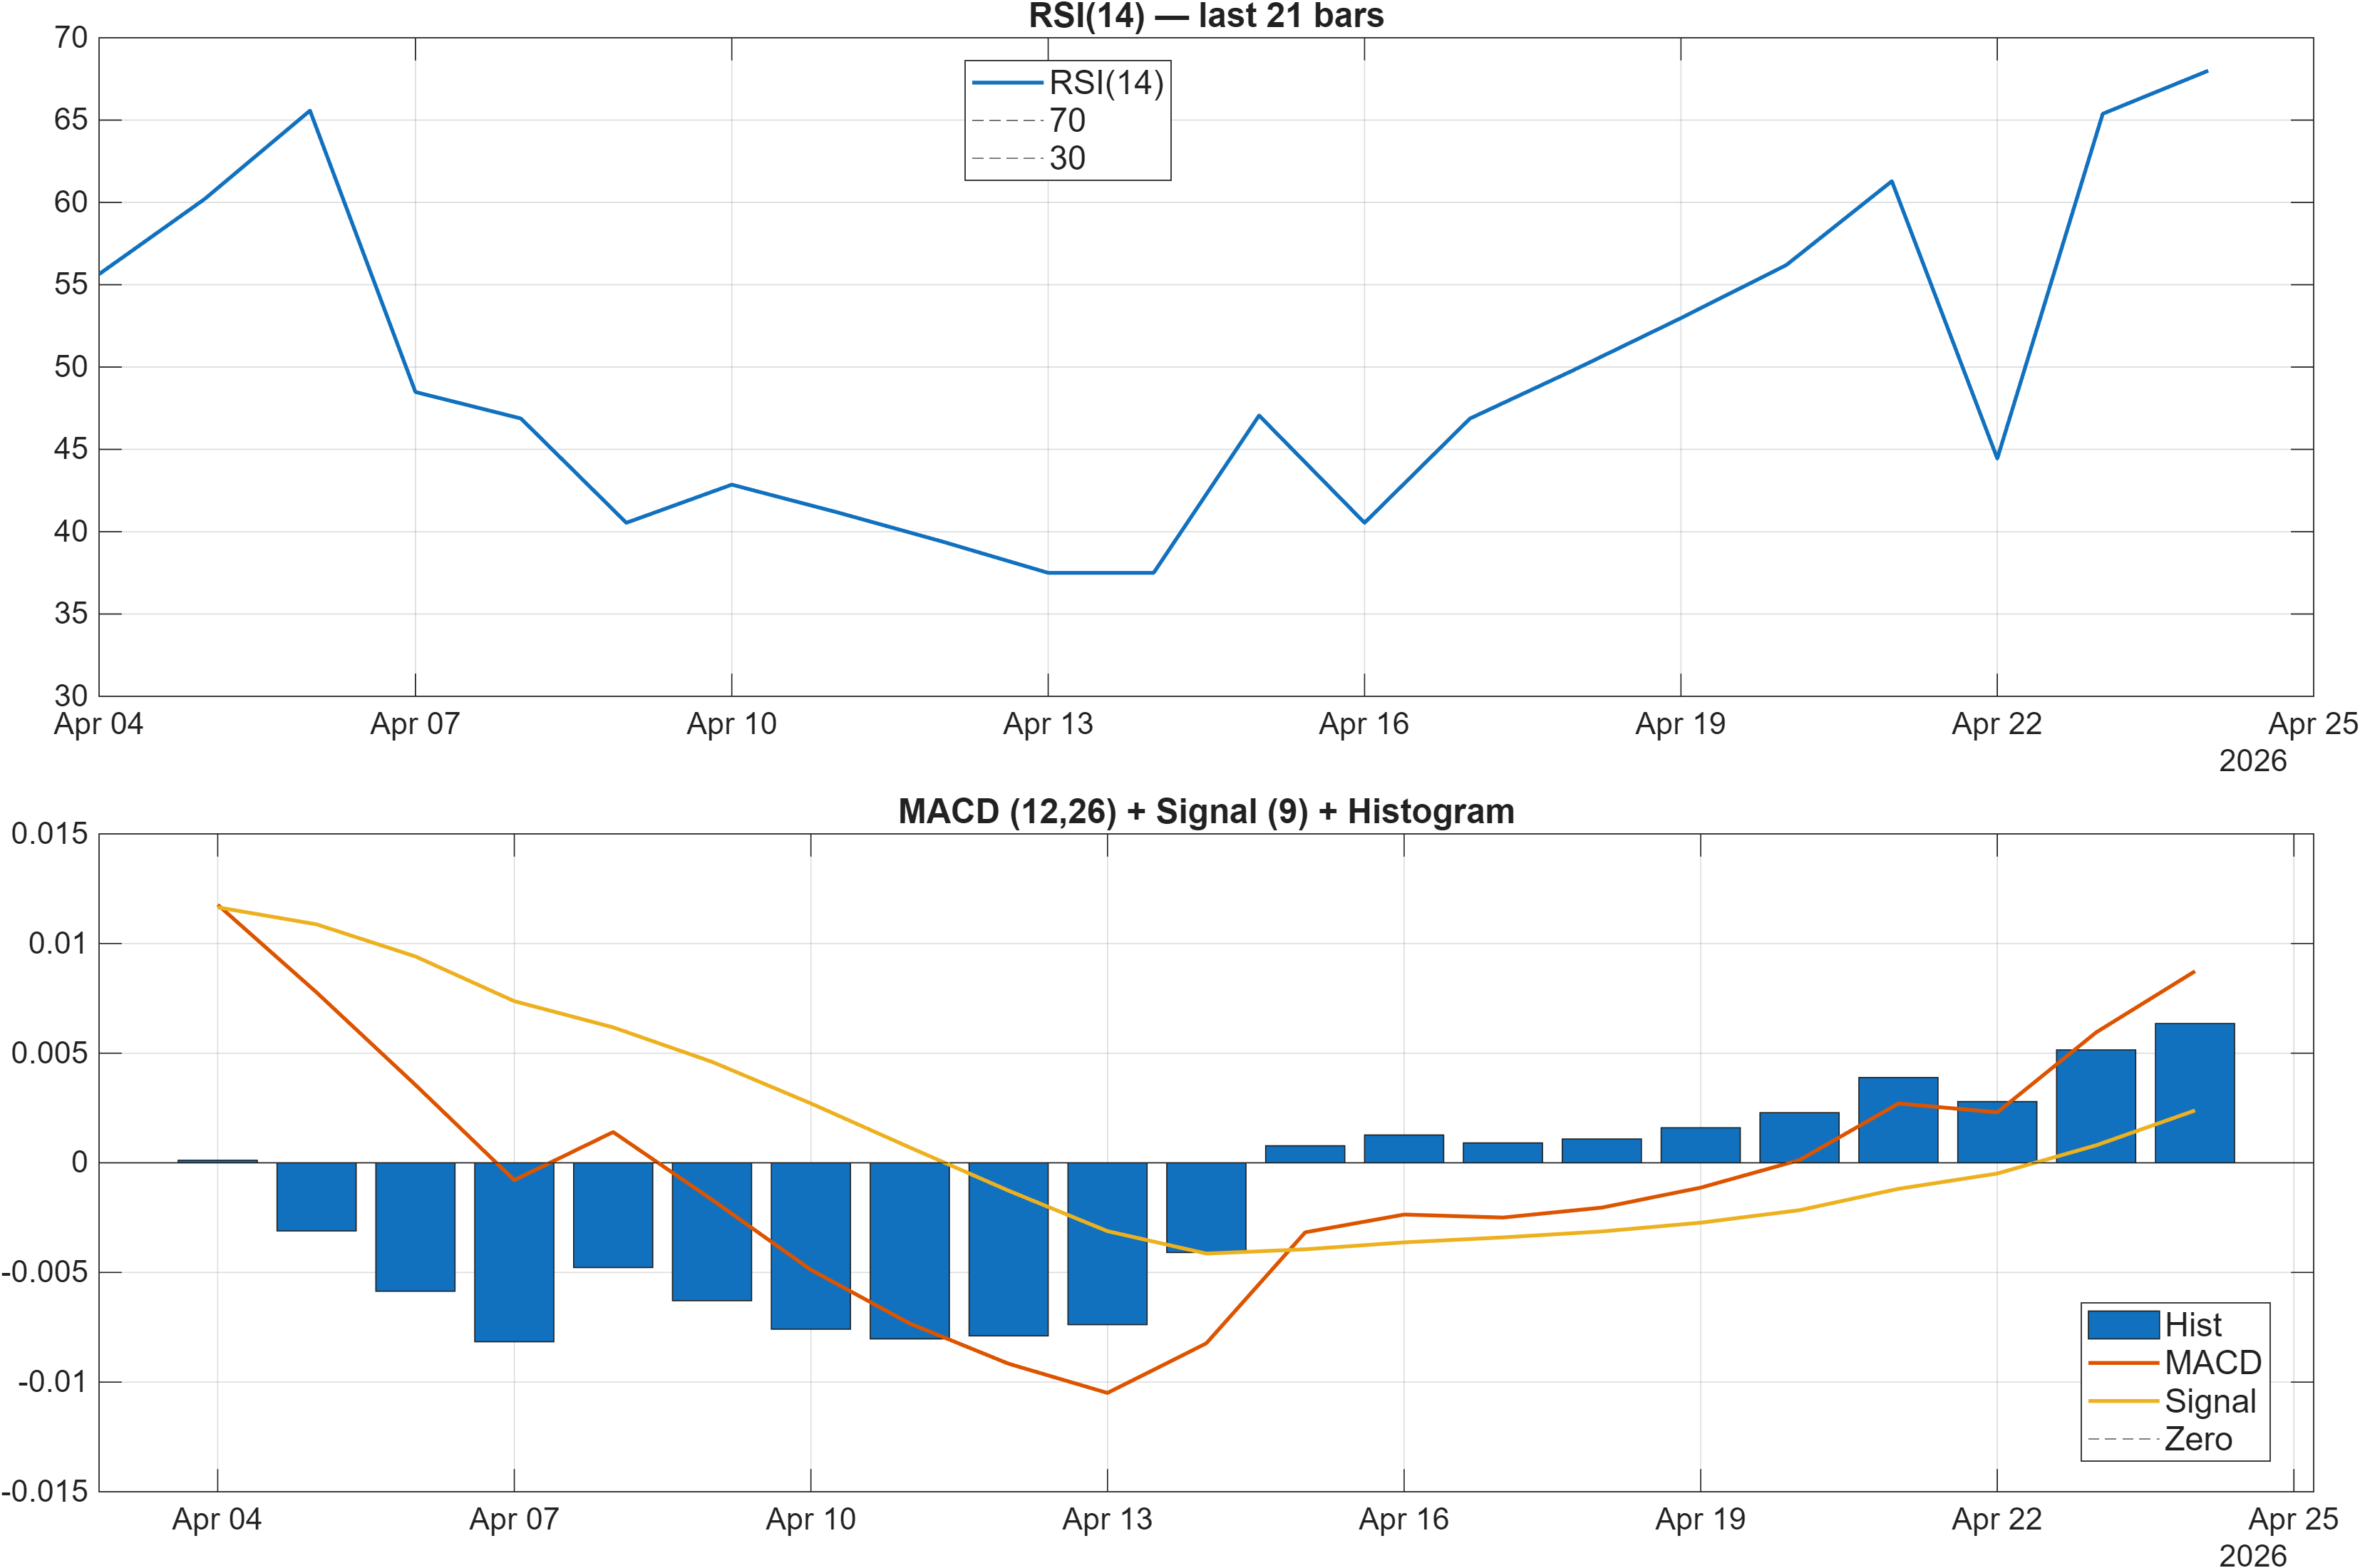
Momentum indicators are broadly consistent with a market that is firm but not conclusively euphoric. The report flags an RSI bias as bullish, and the signal table specifies RSI(14) = 68, a level that often coincides with strong directional control but can also be sensitive to consolidation if incremental demand fades. MACD adds a second layer: the histogram is positive (0.0064 in the dashboard; 0.006351 in the signal table), which supports the view that upside momentum remains present rather than purely residual from a prior push.
Trend persistence vs. exhaustion
The tension here is straightforward: RSI near 68 can be interpreted as “strong momentum,” yet it also leaves less room for error if price fails to break overhead supply at 5.5300. In that scenario, momentum can compress without turning outright bearish. The presence of additional bullish momentum readings—such as TS Mom(20) = 0.065 and ROC(20) = 1.2—leans toward persistence rather than immediate exhaustion, but confirmation still hinges on price behavior at the defined levels.
Signal compression vs. expansion (Bollinger Bands)
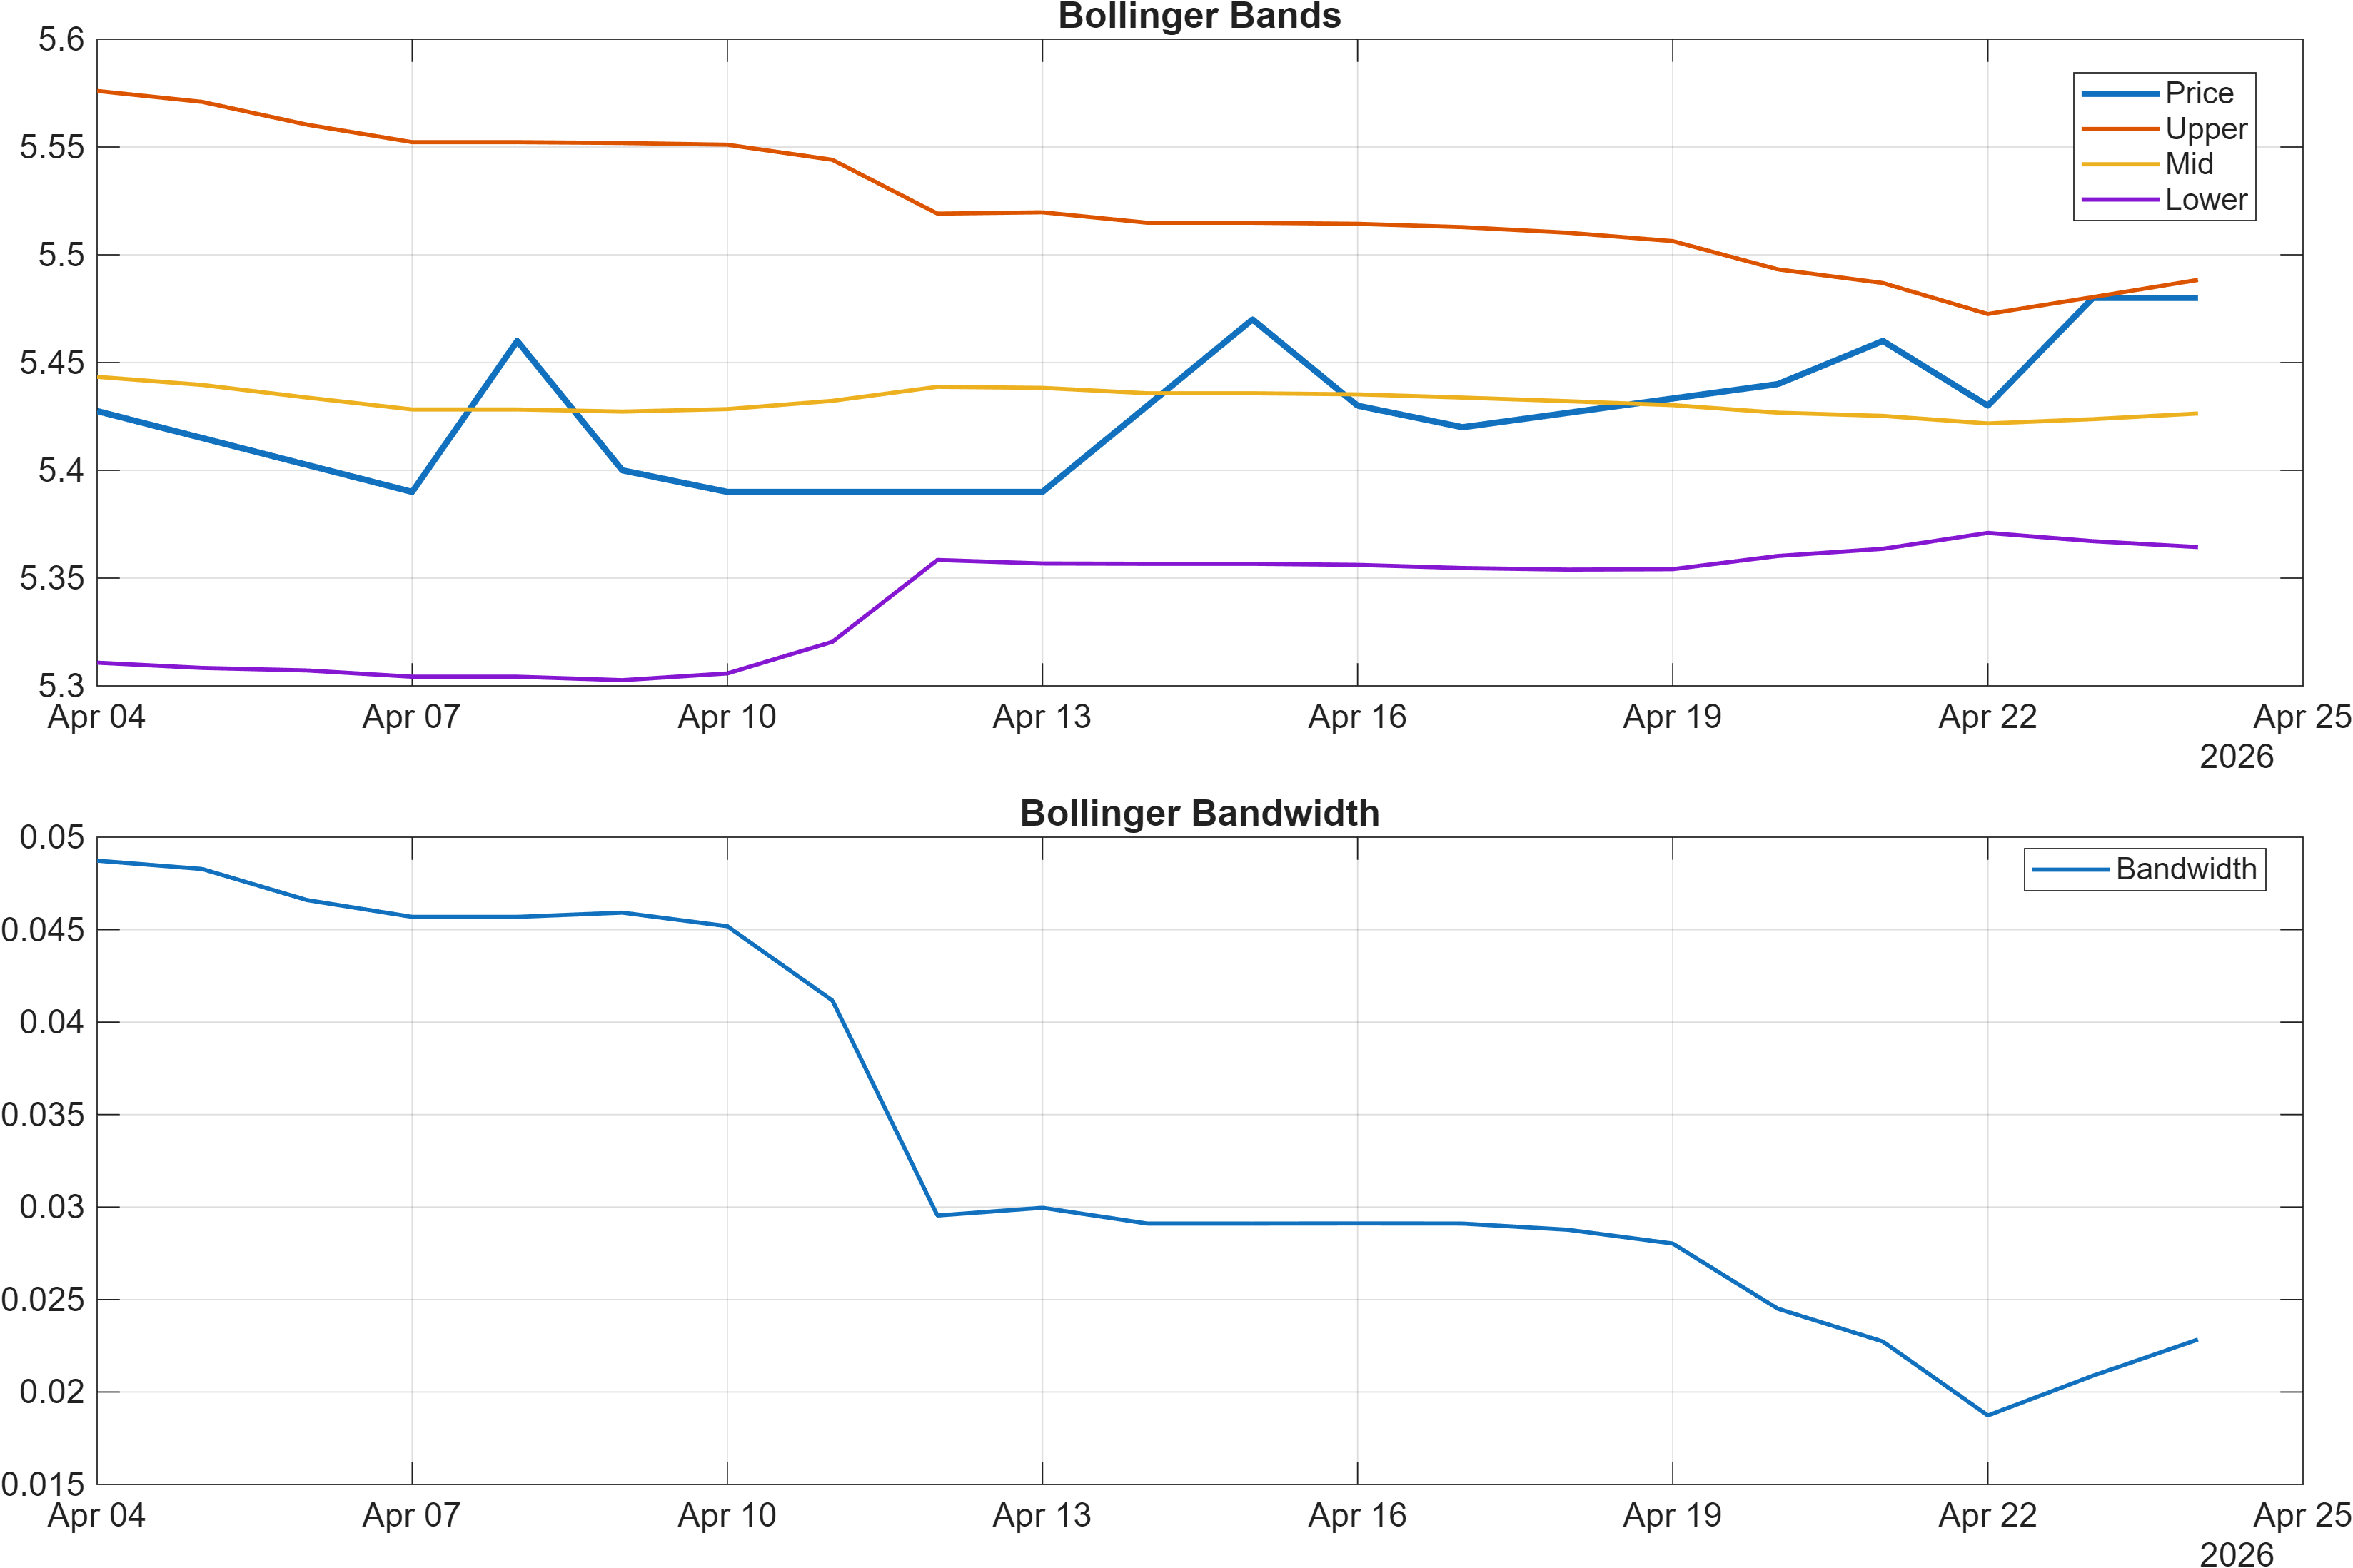
Volatility is currently constrained: the latest Bollinger bandwidth is 0.0228 (signal table BB Width = 0.02284, marked Neutral). Narrower bandwidth often coincides with range definition, where price can travel meaningfully on relatively small incremental flows once a boundary is taken out. This is analytically consistent with the tight structural corridor between 5.3500 and 5.5300: a contained volatility regime tends to make support/resistance levels more “decision-relevant” because breakouts or breakdowns can be sharper once expansion begins.
Interpretation: RSI bias = Bullish, MACD hist = 0.0064.
Interpretation: Bandwidth (volatility regime) latest = 0.0228.
4) Support / Resistance zones
Support ~ 5.3500 | Resistance ~ 5.5300
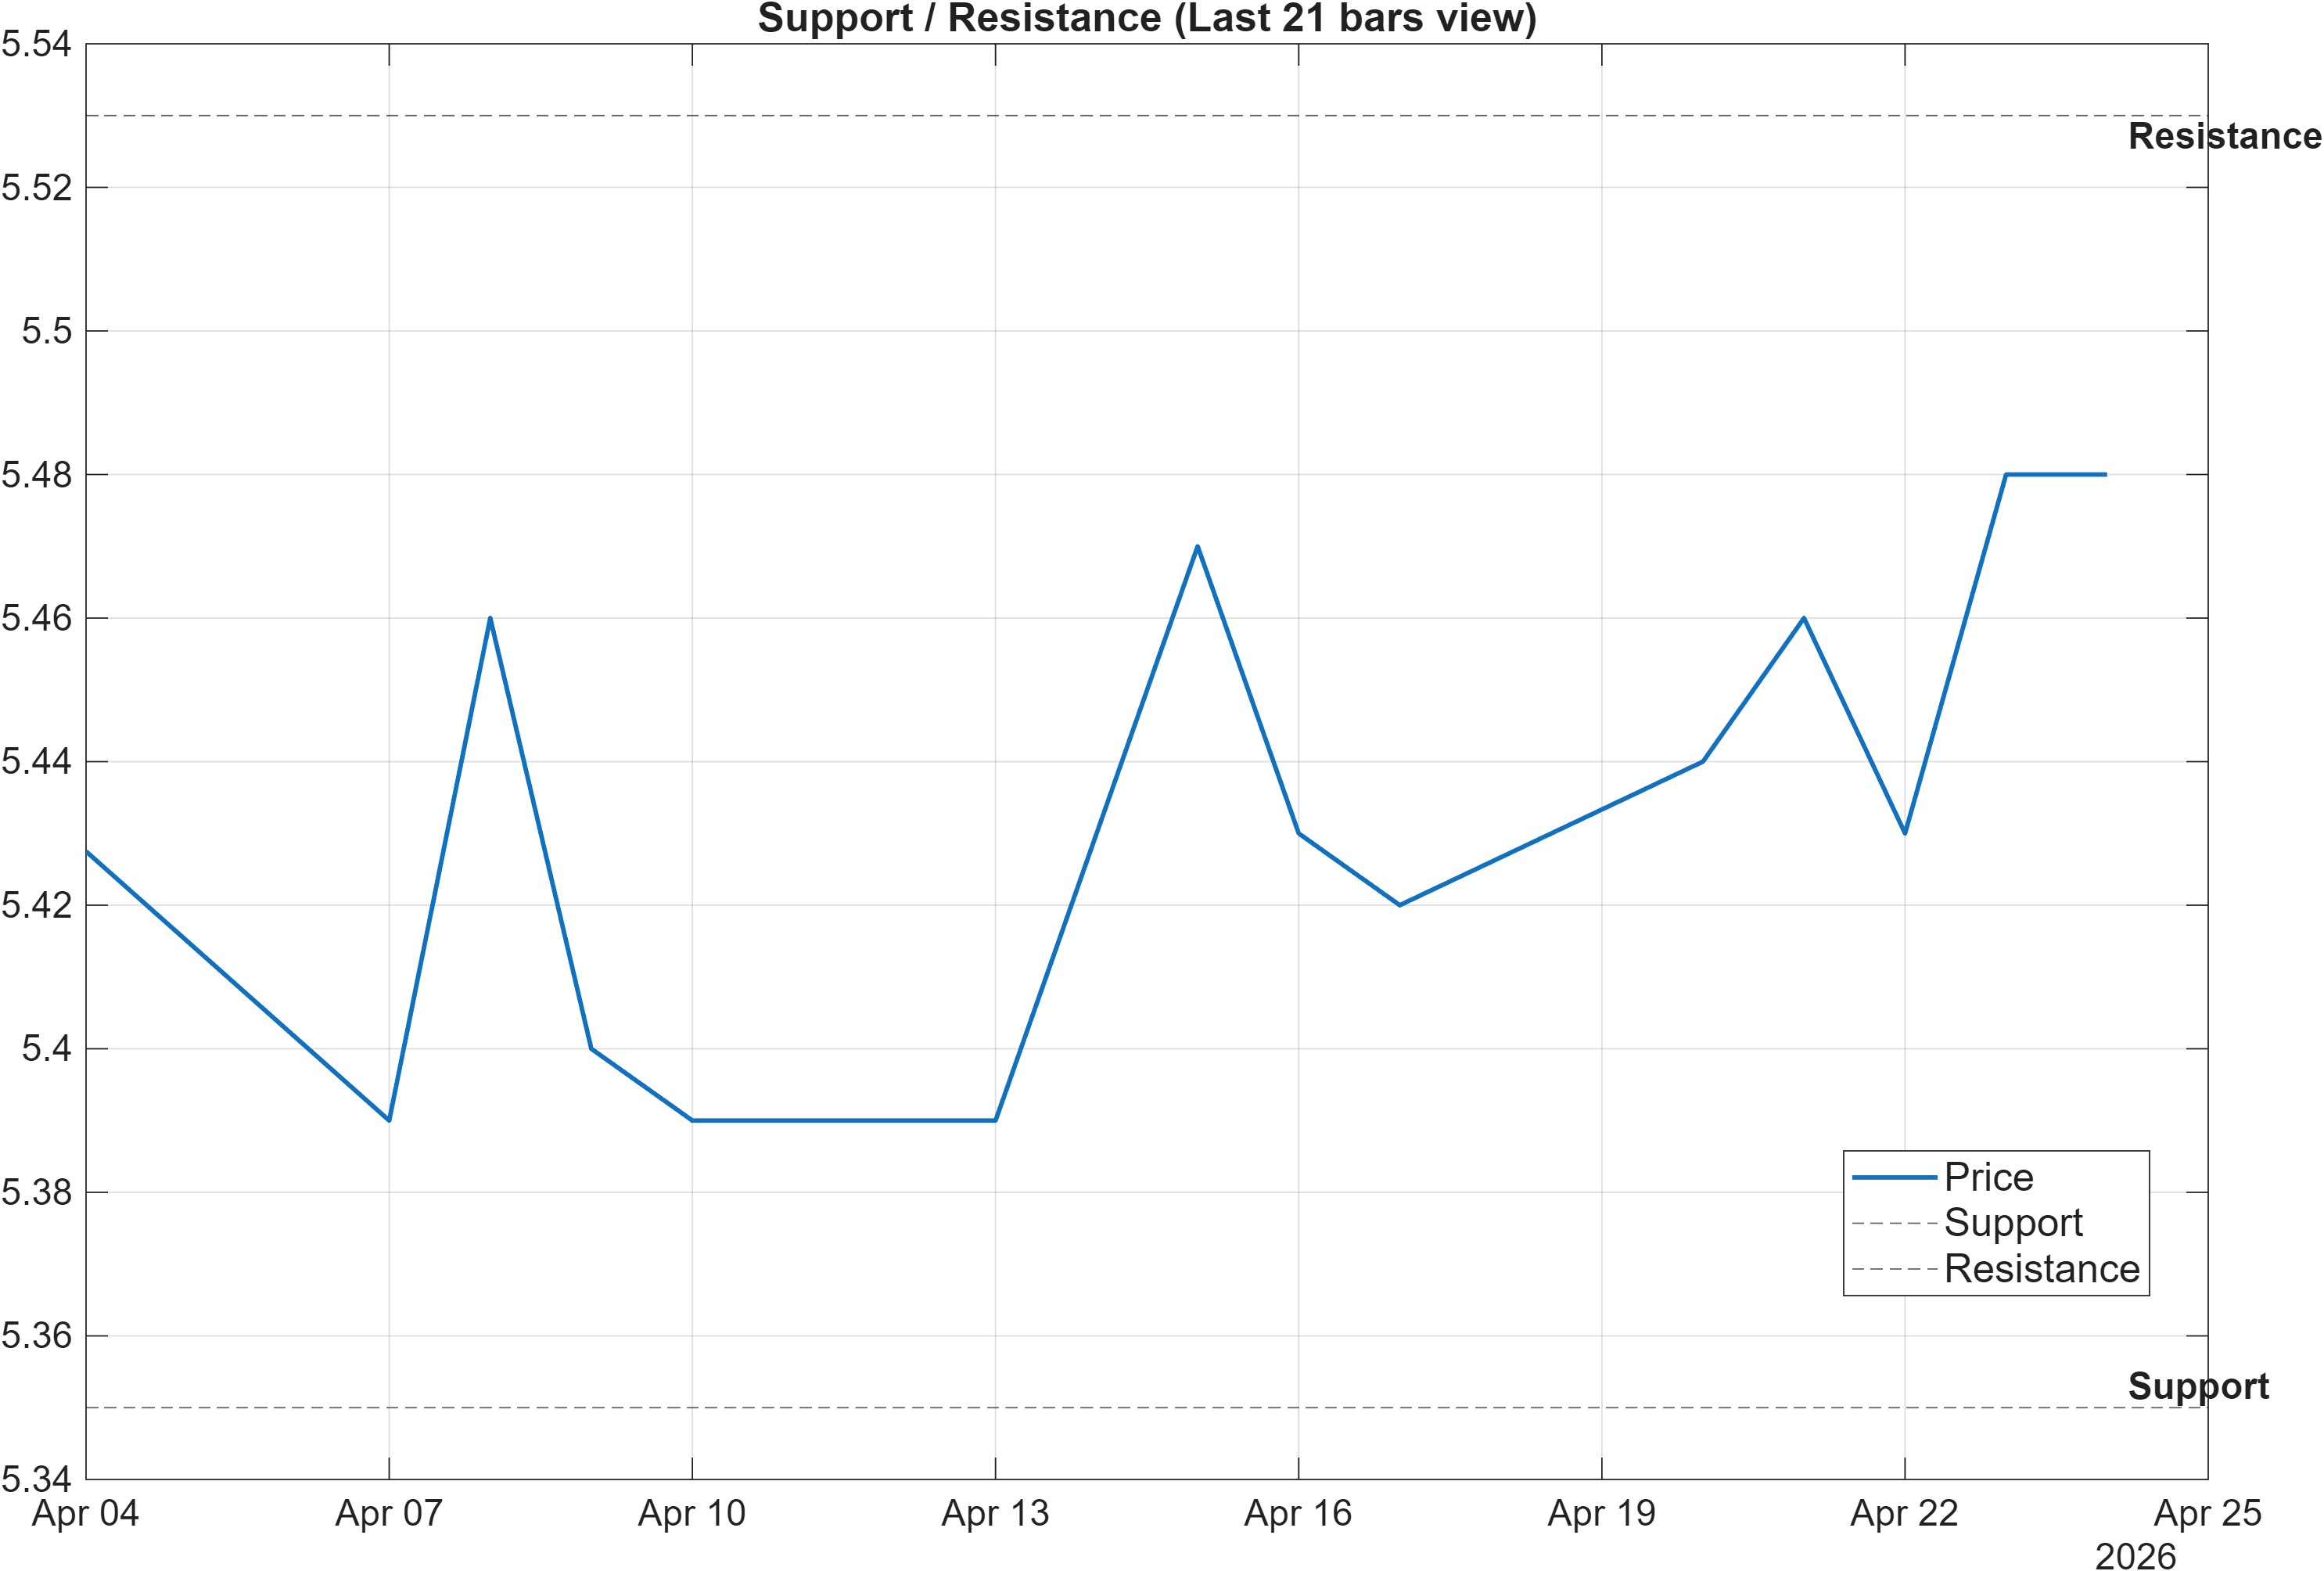
The current market structure is defined by a tight, well-specified range with support at 5.3500 and resistance at 5.5300. In a low-bandwidth environment (0.0228), these boundaries often function as higher-signal reference points because price has been spending enough time near equilibrium for market participants to “agree” on decision levels.
Probabilistic zones: how the levels map to signal quality
The technical layer adds texture to these zones. The signal table’s HHIGH(20) = 5.51 is bullish and sits just below the stated resistance area, implying the market has been pressing toward the upper boundary recently. Meanwhile, LLOW(20) = 5.37 (Neutral) is close to support 5.3500, reinforcing that downside tests have remained within a contained corridor rather than transitioning into a lower-low regime.
Continuation vs. deterioration: regime transition markers
The scenario language provided is appropriately conditional: a break above resistance “with volume” supports continuation, while a close below support increases deterioration risk. This is consistent with volume/flow readings that are broadly constructive (e.g., bullish OBV slope(10) and bullish Vol ROC(20) = 93.65), yet not uniformly so (Chaikin Vol = 10.39 is bearish). In other words, confirmation requires not only price taking 5.5300 but also evidence that participation remains durable. Conversely, slipping below 5.3500 would contradict the bullish moving-average posture and likely pressure the bullish confluence narrative.
Scenario view: Break above resistance with volume → continuation. Close below support → signal deterioration risk.
5) Quant Technical Dashboard (18 Signals)
KGNAI AI Technical Analysis Score (Deep Reinforcement Learning): Rank #53 out of 1292 (Rank 1 represents the strongest technical positioning and a higher probability of favorable price behavior. As ranks increase toward the maximum, the probability of favorable outcomes weakens and bearish positioning becomes more dominant.) | Label: Bullish | Score: 0.918
18-Signal Technical Confluence Score: 0.722 (Bullish)
Overall Technical Score (18-signal confluence + DRL rank blend): 0.781 (Bullish)
Note: The blended score reflects signal strength weighted against broader AI technical ranking, which may temporarily diverge.
Blended technical score breakdown: 0.781 (Bullish | Bull 14 / Bear 1 / Neutral 3)
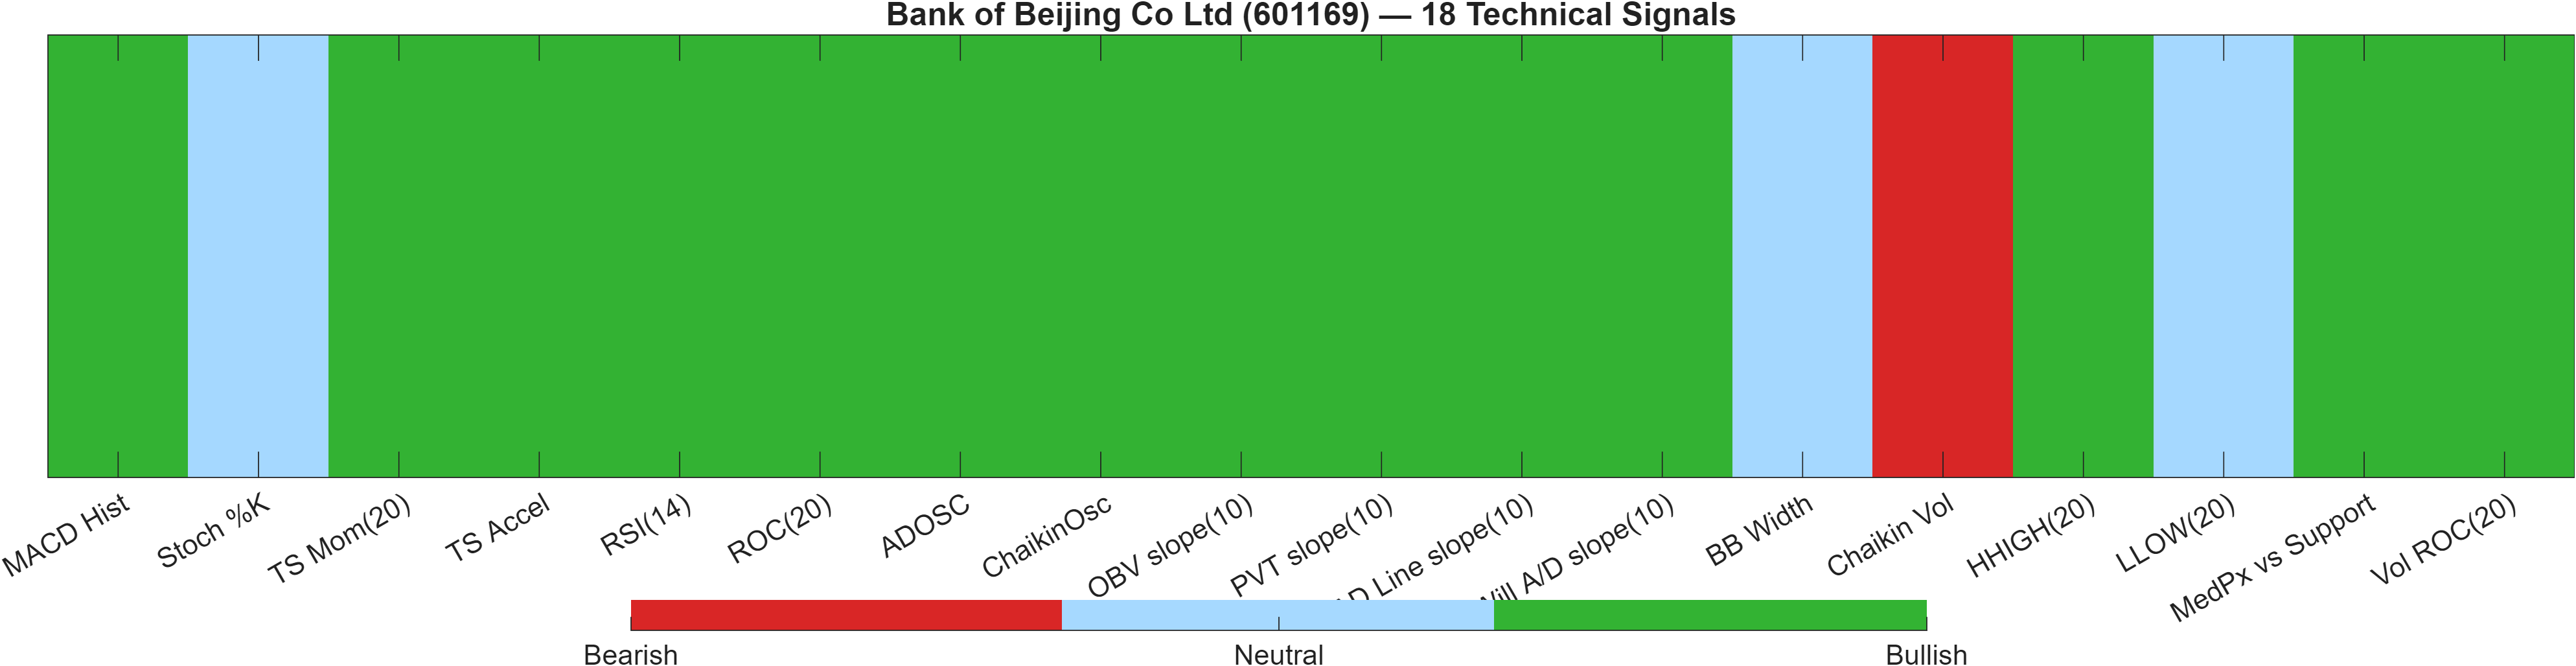
The technical dashboard is the clearest source of strength in this report. The DRL technical rank at #53 places 601169 in the upper tail of the 1292-name universe for technical positioning, and the DRL score of 0.918 is consistent with a regime where the model detects favorable structure more often than not. This is corroborated by the 18-signal confluence: 0.722 (Bullish), producing an overall blended technical score of 0.781 (Bullish) with 14 bullish signals versus 1 bearish and 3 neutral.
Alignment across momentum, trend, and participation
Several independent clusters align. Momentum is supported by MACD Hist = 0.006351 (bullish) and TS Accel = 0.17 (bullish), while RSI(14) remains bullish at 68. Participation/flow indicators are also broadly constructive, including ADOSC = 75 (bullish) and bullish slopes across OBV, PVT, and the A/D line—suggesting that price action is not occurring in isolation from accumulation-style signals.
Single-point contradiction: volatility measure vs. flow strength
The main internal contradiction is the presence of Chaikin Vol = 10.39 as the lone bearish signal, set against otherwise bullish flow and momentum. In a narrow-bandwidth regime (BB Width ~0.0228, neutral), that bearish volatility signal can be interpreted as a caution that the quality of expansion—should it arrive—needs monitoring. This fits the structural setup: a bullish technical posture can persist, but a clean breakout above 5.5300 is more persuasive when volatility/participation measures do not deteriorate simultaneously.
Signal table (Bull/Bear/Neutral)
| Indicator | Value | Signal |
|---|---|---|
| MACD Hist | 0.006351 | Bullish |
| Stoch %K | 72.73 | Neutral |
| TS Mom(20) | 0.065 | Bullish |
| TS Accel | 0.17 | Bullish |
| RSI(14) | 68 | Bullish |
| ROC(20) | 1.2 | Bullish |
| ADOSC | 75 | Bullish |
| ChaikinOsc | 2.328e+07 | Bullish |
| OBV slope(10) | 3.514e+08 | Bullish |
| PVT slope(10) | 1.843e+06 | Bullish |
| AD Line slope(10) | 9.458e+07 | Bullish |
| Will A/D slope(10) | 0.11 | Bullish |
| BB Width | 0.02284 | Neutral |
| Chaikin Vol | 10.39 | Bearish |
| HHIGH(20) | 5.51 | Bullish |
| LLOW(20) | 5.37 | Neutral |
| MedPx vs Support | 0.12 | Bullish |
| Vol ROC(20) | 93.65 | Bullish |
Interpretation: Indicator-level signals form the base confluence, which is then adjusted using a separate AI-driven technical ranking model. The final technical score summarizes this combined view.
6) News sentiment + extractive gist
Note: Instrument-specific news matches were not found, so the digest includes broader market/sector headlines. Links are provided for verification.
Sentiment score (avg): -0.013 | Positive: 0% | Neutral: 94% | Negative: 6%
KGNAI AI News Sentiment Score (normalized -1 to +1): Not available (as of —) | Label: Not available | Overall news score: -0.01
Positive Developments
Recent coverage across major financial outlets is largely non-company-specific in the provided dataset, leaning toward broad geopolitical and cross-market narratives rather than Bank of Beijing fundamentals. Within that constraint, the key constructive element is the absence of persistent negative clustering in the sentiment mix: the distribution is dominated by neutral items (94%), with 0% positive and only 6% negative, producing an average sentiment of -0.013. From a market-structure standpoint, this matters because a neutral news tape can allow technical drivers—such as the bullish blended technical score (0.781) and the strong DRL technical rank (#53)—to play a larger role without frequent exogenous shocks. In a low-volatility regime (bandwidth 0.0228), a quieter information environment can also coincide with tighter price discovery around key levels, increasing the informational value of a volume-backed break above 5.5300 should it occur.
Neutral / Mixed Developments
The dominant feature of the news dataset is its sector/market-level generality: the content does not map cleanly to issuer-specific catalysts for 601169, and the platform explicitly flags that instrument-specific matches were not found. As a result, the correct analytical read is to treat sentiment as contextual bias rather than a driver. The overall news score is -0.01, effectively close to flat, aligning with the neutral distribution and supporting the view that sentiment is not strongly reinforcing or contradicting the price/technical picture. Importantly, the KGNAI AI News Sentiment Score is Not available in the provided data, limiting the ability to compare the news layer directly with the stock’s neutral ranks (daily #337; monthly #829) in a normalized framework.
Negative / Risk Signals
The negative slice of the dataset is small (6%) but still relevant because risk narratives—especially macro/geopolitical—can affect liquidity and risk premia in China financials even when issuer-specific information is absent. With the average sentiment already slightly negative at -0.013, a shift toward a more negative distribution could become a headwind precisely because the technical setup is pressing into a defined resistance zone (5.5300) with RSI elevated (68). In other words, when momentum is firm, adverse risk headlines can accelerate a transition from “tight consolidation” to “failed breakout,” pushing attention back to 5.3500 support. Given that the news layer is not specific to the instrument in the provided data, the appropriate approach is not attribution, but monitoring for whether broader risk narratives intensify enough to conflict with the currently bullish technical confluence.
- Whether sentiment remains predominantly neutral (near -0.013) as price tests 5.5300.
- Whether momentum stays constructive (MACD histogram positive; RSI near 68) without volatility expanding sharply from bandwidth 0.0228.
- Any increase in negative share beyond 6% that coincides with a loss of 5.3500 support.
Sources referenced: Reuters, Bloomberg, Yahoo Finance, MarketWatch, Investing.com
Snapshot: AI Rank (Short–Mid–Long): Neutral (Neutral–Neutral–Neutral) · Technical Confluence: Bullish · Key Levels: Support ~5.35 | Resistance ~5.53 · News Sentiment: Neutral
7) Sources
Not available in the provided data.
You may also like: How KGNAI AI ranks instruments across global markets
Disclaimer: KGNAI provides AI-generated analytics and educational market commentary only. This is not financial advice. Markets involve risk. Always do your own research.