
Nanhua Futures Co Ltd (603093) Technical & Rank Review — Lack of Trend Confirmation (22-Apr-2026)
KGNAI’s latest read on Nanhua Futures Co Ltd (603093) highlights a market that is technically constructive in the near term while still lacking confirmation in broader relative-strength rankings. Across a 1292-instrument China universe, the short-horizon rank sits closer to the middle of the distribution, while weekly and monthly ranks reside in weaker territory, a profile often associated with rebounds that have not yet translated into durable leadership. On the indicator side, momentum metrics such as RSI(14) at 81.82 and MACD histogram at 0.2306 reflect upside pressure, but volatility context (Bollinger Bandwidth 0.2522) suggests the market may still be transitioning between regimes rather than trending cleanly. Key decision zones remain support ~17.6082 and resistance ~22.4567, with confirmation most credible when price action and participation (volume/flow) align around these levels. News sentiment in the provided data is neutral with limited instrument-specific matching.
Key Takeaways
- Rank stance: Short Bearish | Mid Bearish | Long Neutral
- Technical confluence: Bullish (18-signal confluence 0.778; blended technical score 0.526)
- Key levels: Support ~ 17.6082 | Resistance ~ 22.4567
- News sentiment bias: Neutral (avg 0.000; 75% neutral)
- Confirmation / invalidation: Strength is better confirmed on a break/hold above 22.4567 with participation; deterioration risk increases on closes below 17.6082.
What KGNAI Measures
KGNAI evaluates assets using large cross-sectional datasets built from millions of structured data points. Inputs incorporate fundamental metrics, technical structures, and systematically processed news sentiment. Statistical models, machine learning, and AI frameworks are used to assess relative positioning, signal alignment, and probabilistic behavior across broad universes.
How to Read This Report
- Ranks are comparative across the tracked universe, not absolute price targets.
- Confluence reflects alignment among independent signal groups.
- Support/resistance levels are probabilistic decision zones, not guarantees.
- Sentiment provides contextual bias within the broader analytical framework.
1) KGNAI AI Analysis
Region: CHINA
Total universe size: 1292 ranked instruments
- Daily rank: #418 out of 1292 — Neutral
- Weekly rank: #1040 out of 1292 — Bearish
- Monthly rank: #1201 out of 1292 — Bearish
- 3-Monthly rank: #1012 out of 1292 — Neutral
- 6-Monthly rank: #1007 out of 1292 — Neutral
- Yearly rank: #992 out of 1292 — Neutral
The rank stack for 603093 is best described as short-term stability without intermediate-term leadership. The daily rank (#418) places the name nearer the middle of the universe, consistent with a market that is not broadly weak on the day-to-day horizon. In contrast, the weekly (#1040) and monthly (#1201) ranks sit in the lower portion of the distribution, which is typically where assets cluster when relative behavior has lagged peers over those windows.
That time-scale split matters because it often signals a rebound attempt rather than a fully confirmed trend shift. When daily conditions improve while weekly/monthly remain bearish, price can advance tactically, but it may still be vulnerable to mean reversion if follow-through fails. The longer windows (e.g., yearly rank #992, labeled neutral) suggest the asset is not exhibiting persistent, dominant weakness across the full cycle, but neither is it screening as an upper-tier leader.
Within the KGNAI framework, the stated term view (Short-term: Bearish, Mid-term: Bearish, Long-term: Neutral) reflects this tension: tactical conditions can improve while the broader relative-strength picture remains challenged. For investors, the key analytical question is whether improving technical signals (covered later) can pull ranks upward across weekly/monthly horizons—an outcome that typically requires sustained participation and cleaner trend structure.
KGNAI ranks each instrument across large universes using multiple proprietary AI tests and statistical models (millions of data points). Lower ranks generally indicate stronger probability of favorable performance behavior, while higher ranks indicate weaker probability and more bearish positioning.
Term view: Short-term: Bearish. Mid-term: Bearish. Long-term: Neutral.
Want the full universe and complete rank tables? Unlock full access on KGNAI: https://www.kgnai.com/pricing
2) Price & trend overview
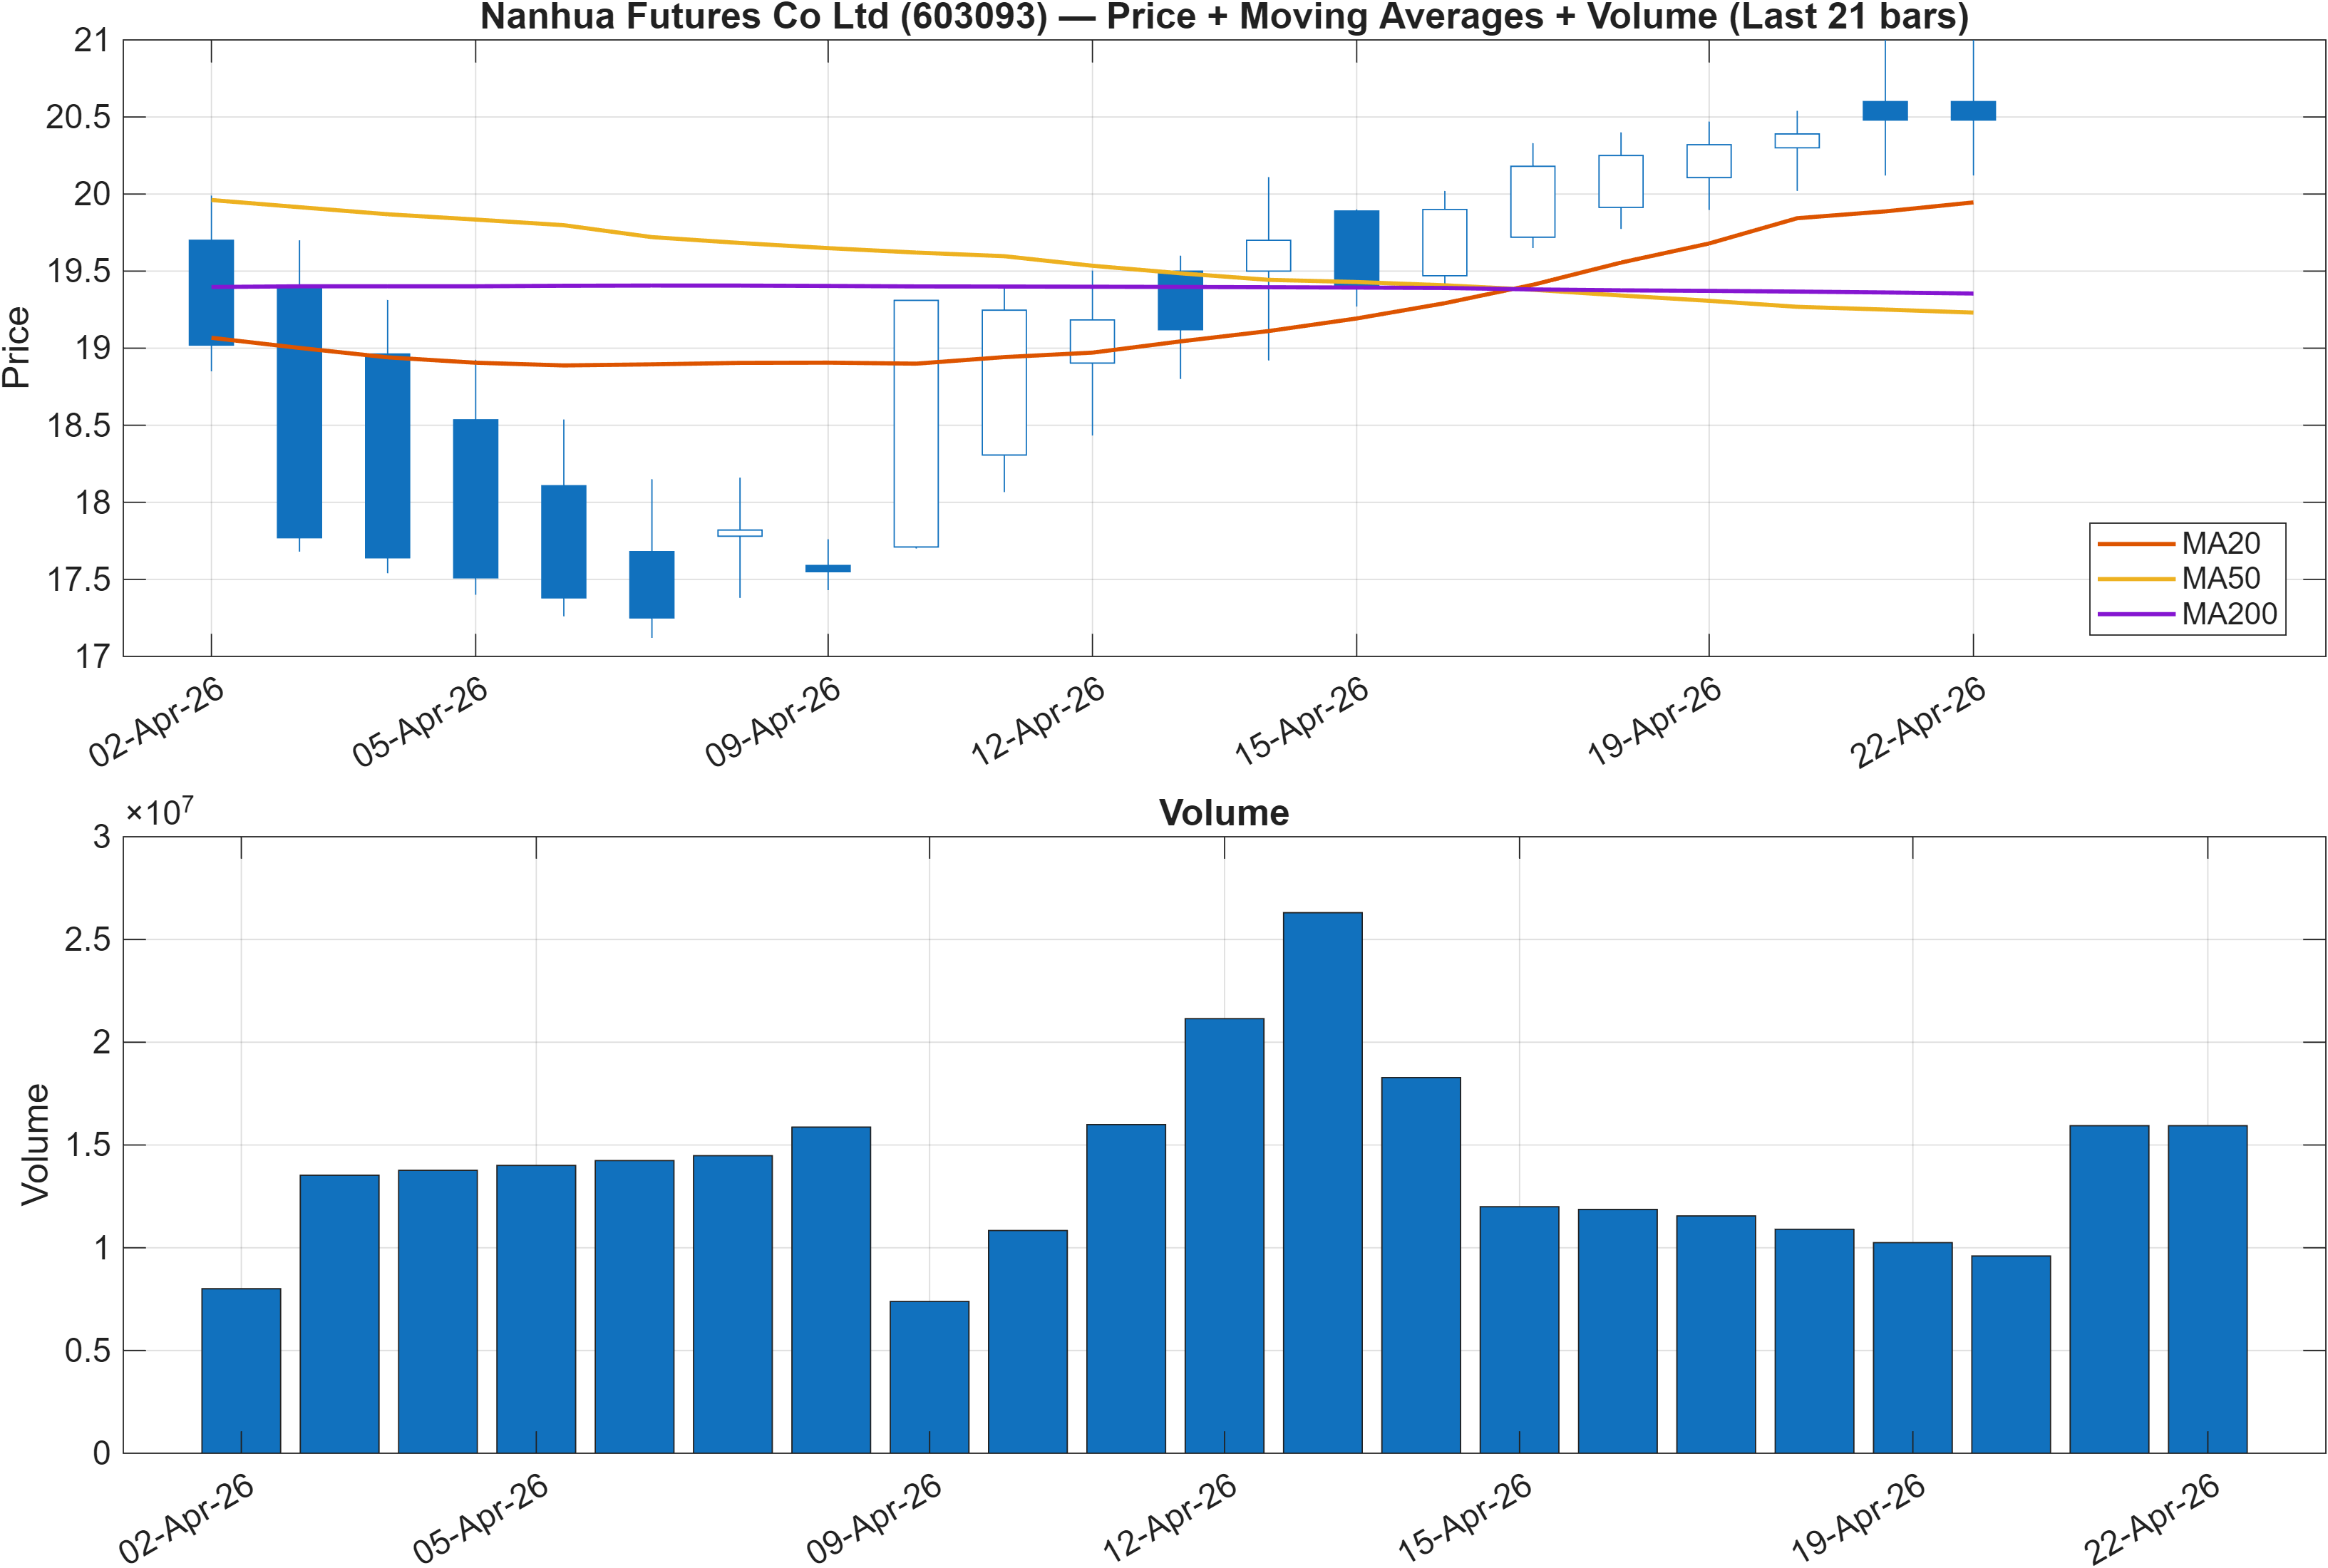
Trend interpretation is mixed by construction: close vs MA50 is Bullish, while MA50 vs MA200 is Bearish. This combination typically characterizes a market in a recovery phase—price has regained short-to-intermediate traction, but the longer-term trend filter has not flipped. In practice, this is where many false starts occur: price can look strong locally yet still be capped by legacy supply embedded in the longer moving-average structure.
The cross-sectional ranks reinforce that ambiguity. A mid-pack daily rank (#418) alongside a weaker monthly rank (#1201) often aligns with price attempting to base or rebound rather than exhibiting a mature, peer-leading uptrend. For a sustained transition, investors typically want to see not only price above the MA50, but also improving relative behavior that lifts the weekly/monthly ranks away from the lower tail.
Volume/participation is the gating variable for interpreting this phase, especially as the market approaches the defined resistance zone at 22.4567. Trend continuation signals tend to be more reliable when upward movement is supported by measurable participation and not only by price drift. Conversely, failure to maintain distance from the support zone (17.6082) can keep the structure in a broad, non-trending regime despite short bursts of strength.
Interpretation: Close vs MA50 = Bullish, MA50 vs MA200 = Bearish.
3) Momentum & volatility dashboard
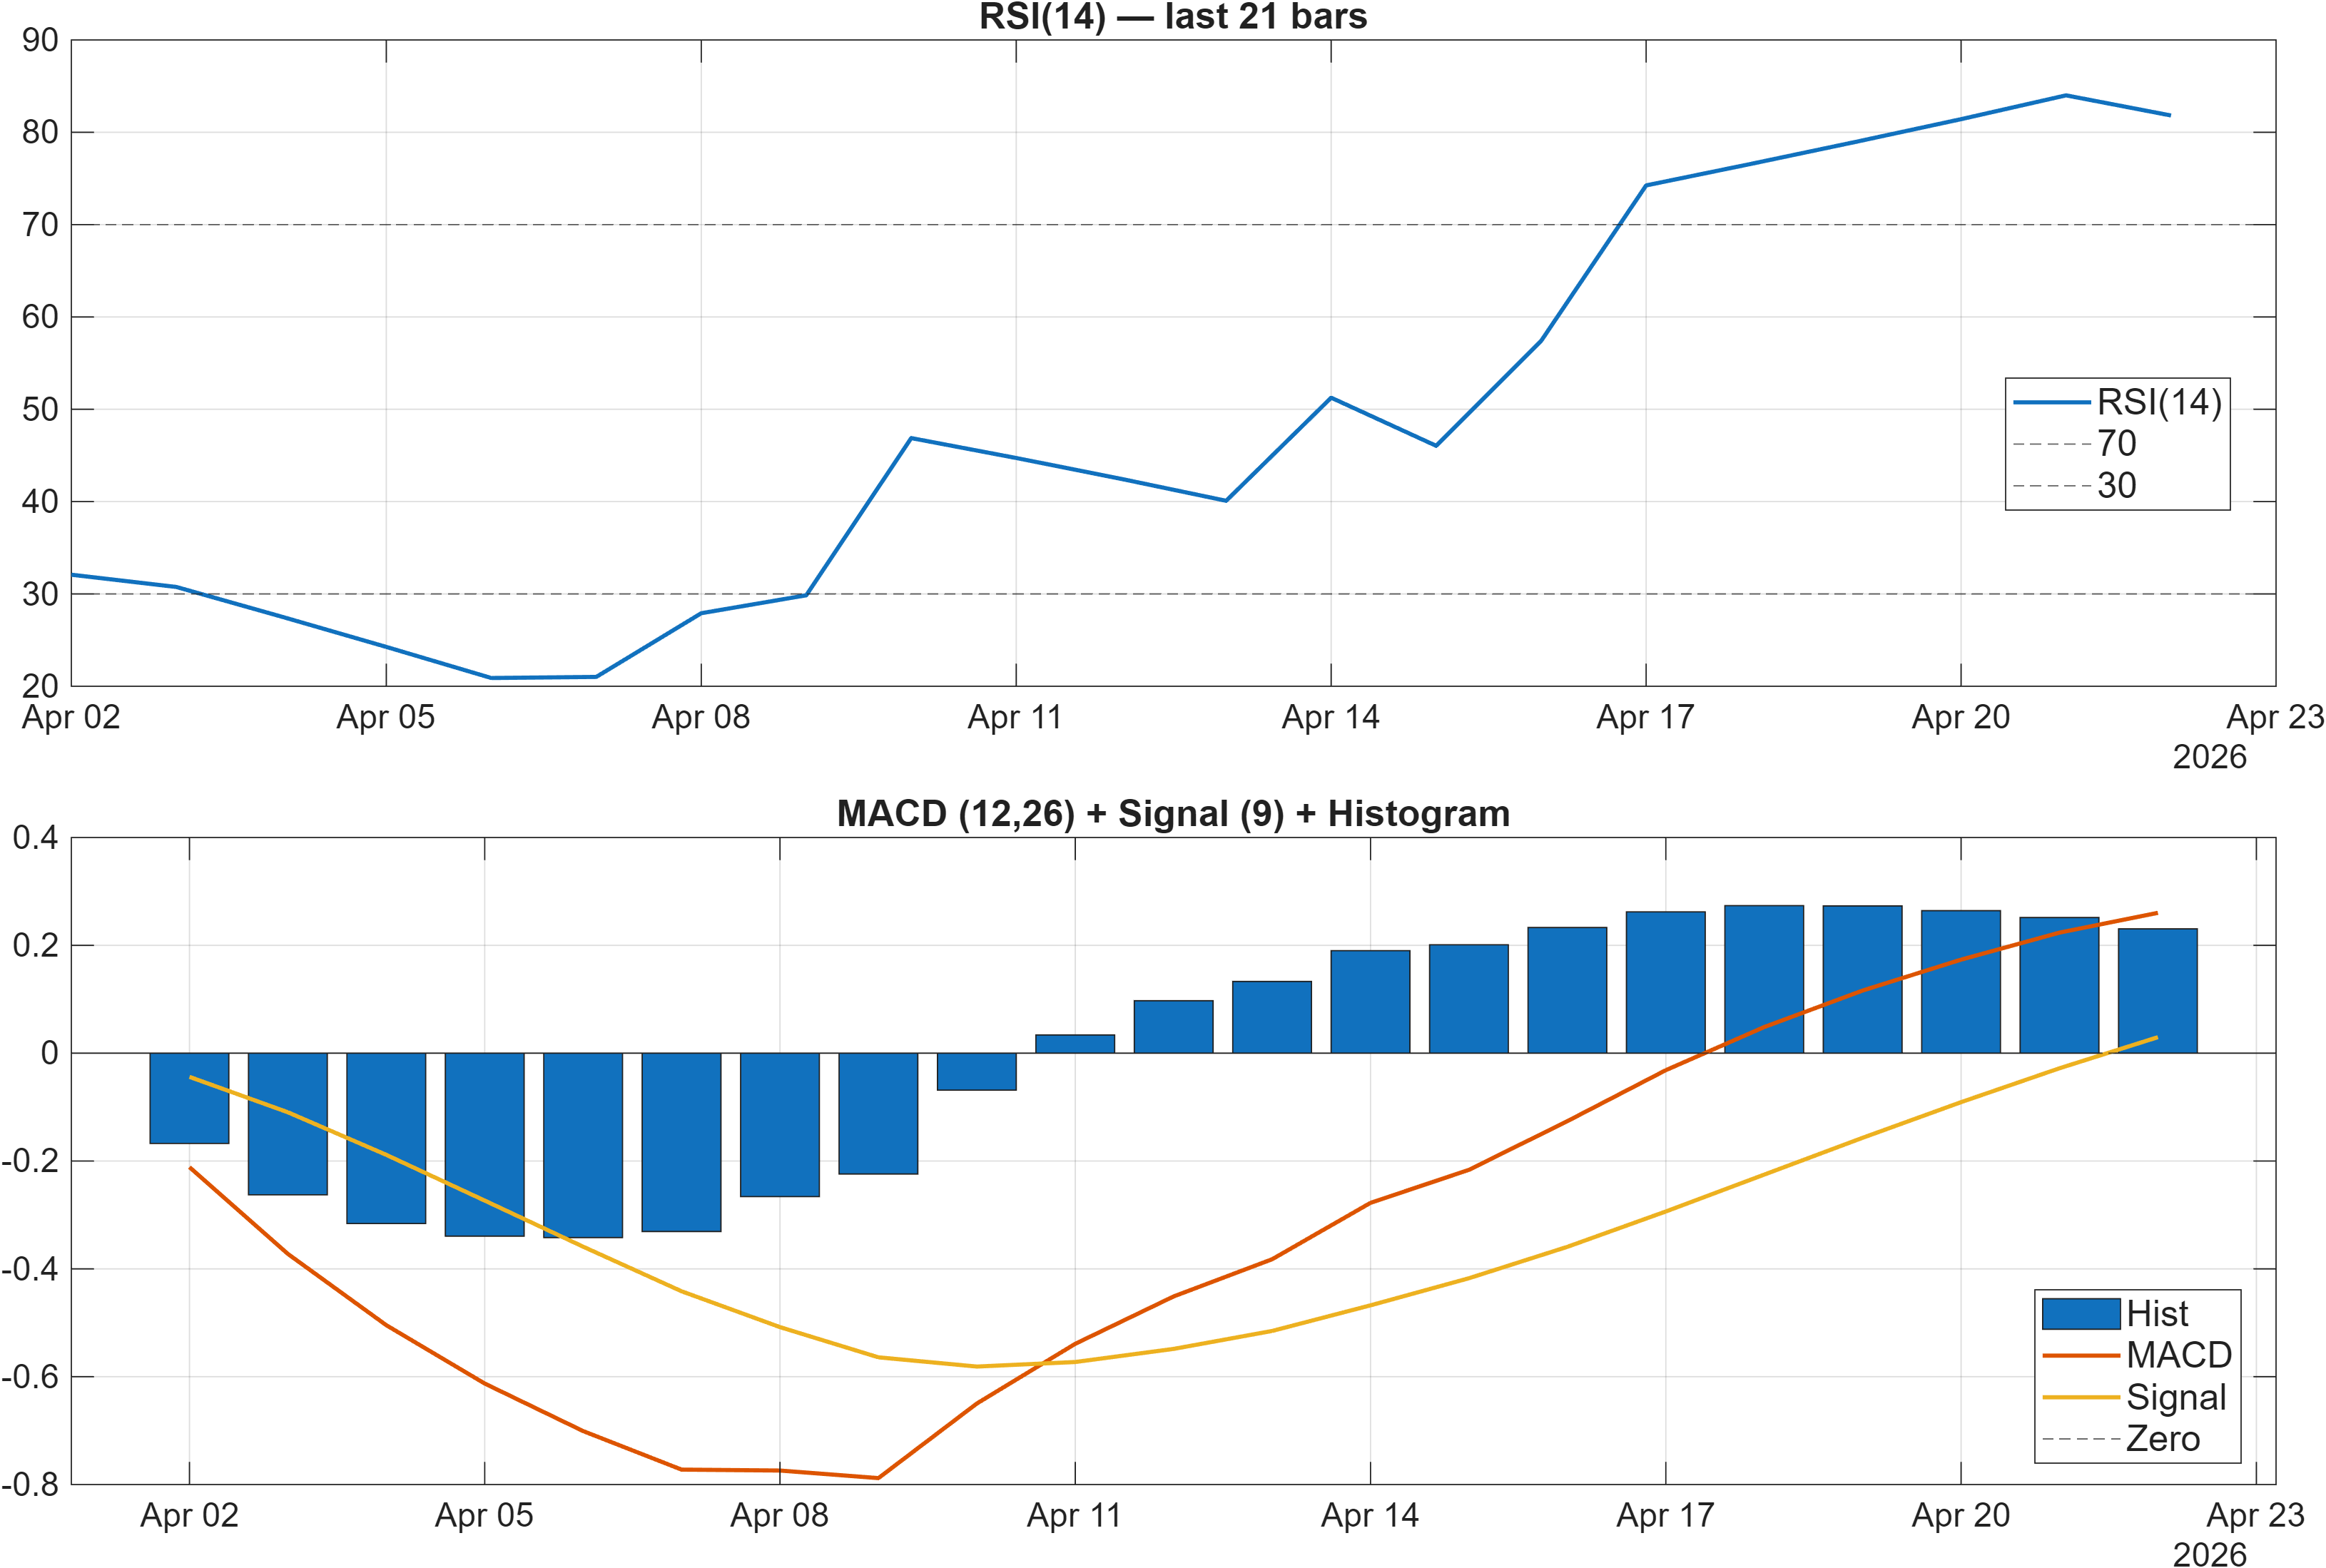
Momentum is the clearest area of strength in the provided data. The RSI bias is marked Bullish, with RSI(14) at 81.82 indicating a strongly extended momentum condition. Elevated RSI can persist during trend phases, but in transitional structures it can also represent late-stage acceleration that needs follow-through to avoid retracement.
MACD context is supportive: the MACD histogram at 0.2306 is positive, aligning with upside momentum rather than a fading impulse. In the 18-signal dashboard, additional momentum/velocity measures also lean constructive (e.g., ROC(20) at 15.25 and TS Mom(20) at 2.71 are labeled bullish). Taken together, the momentum cluster suggests buyers have controlled the recent impulse, which is consistent with price being above the MA50.
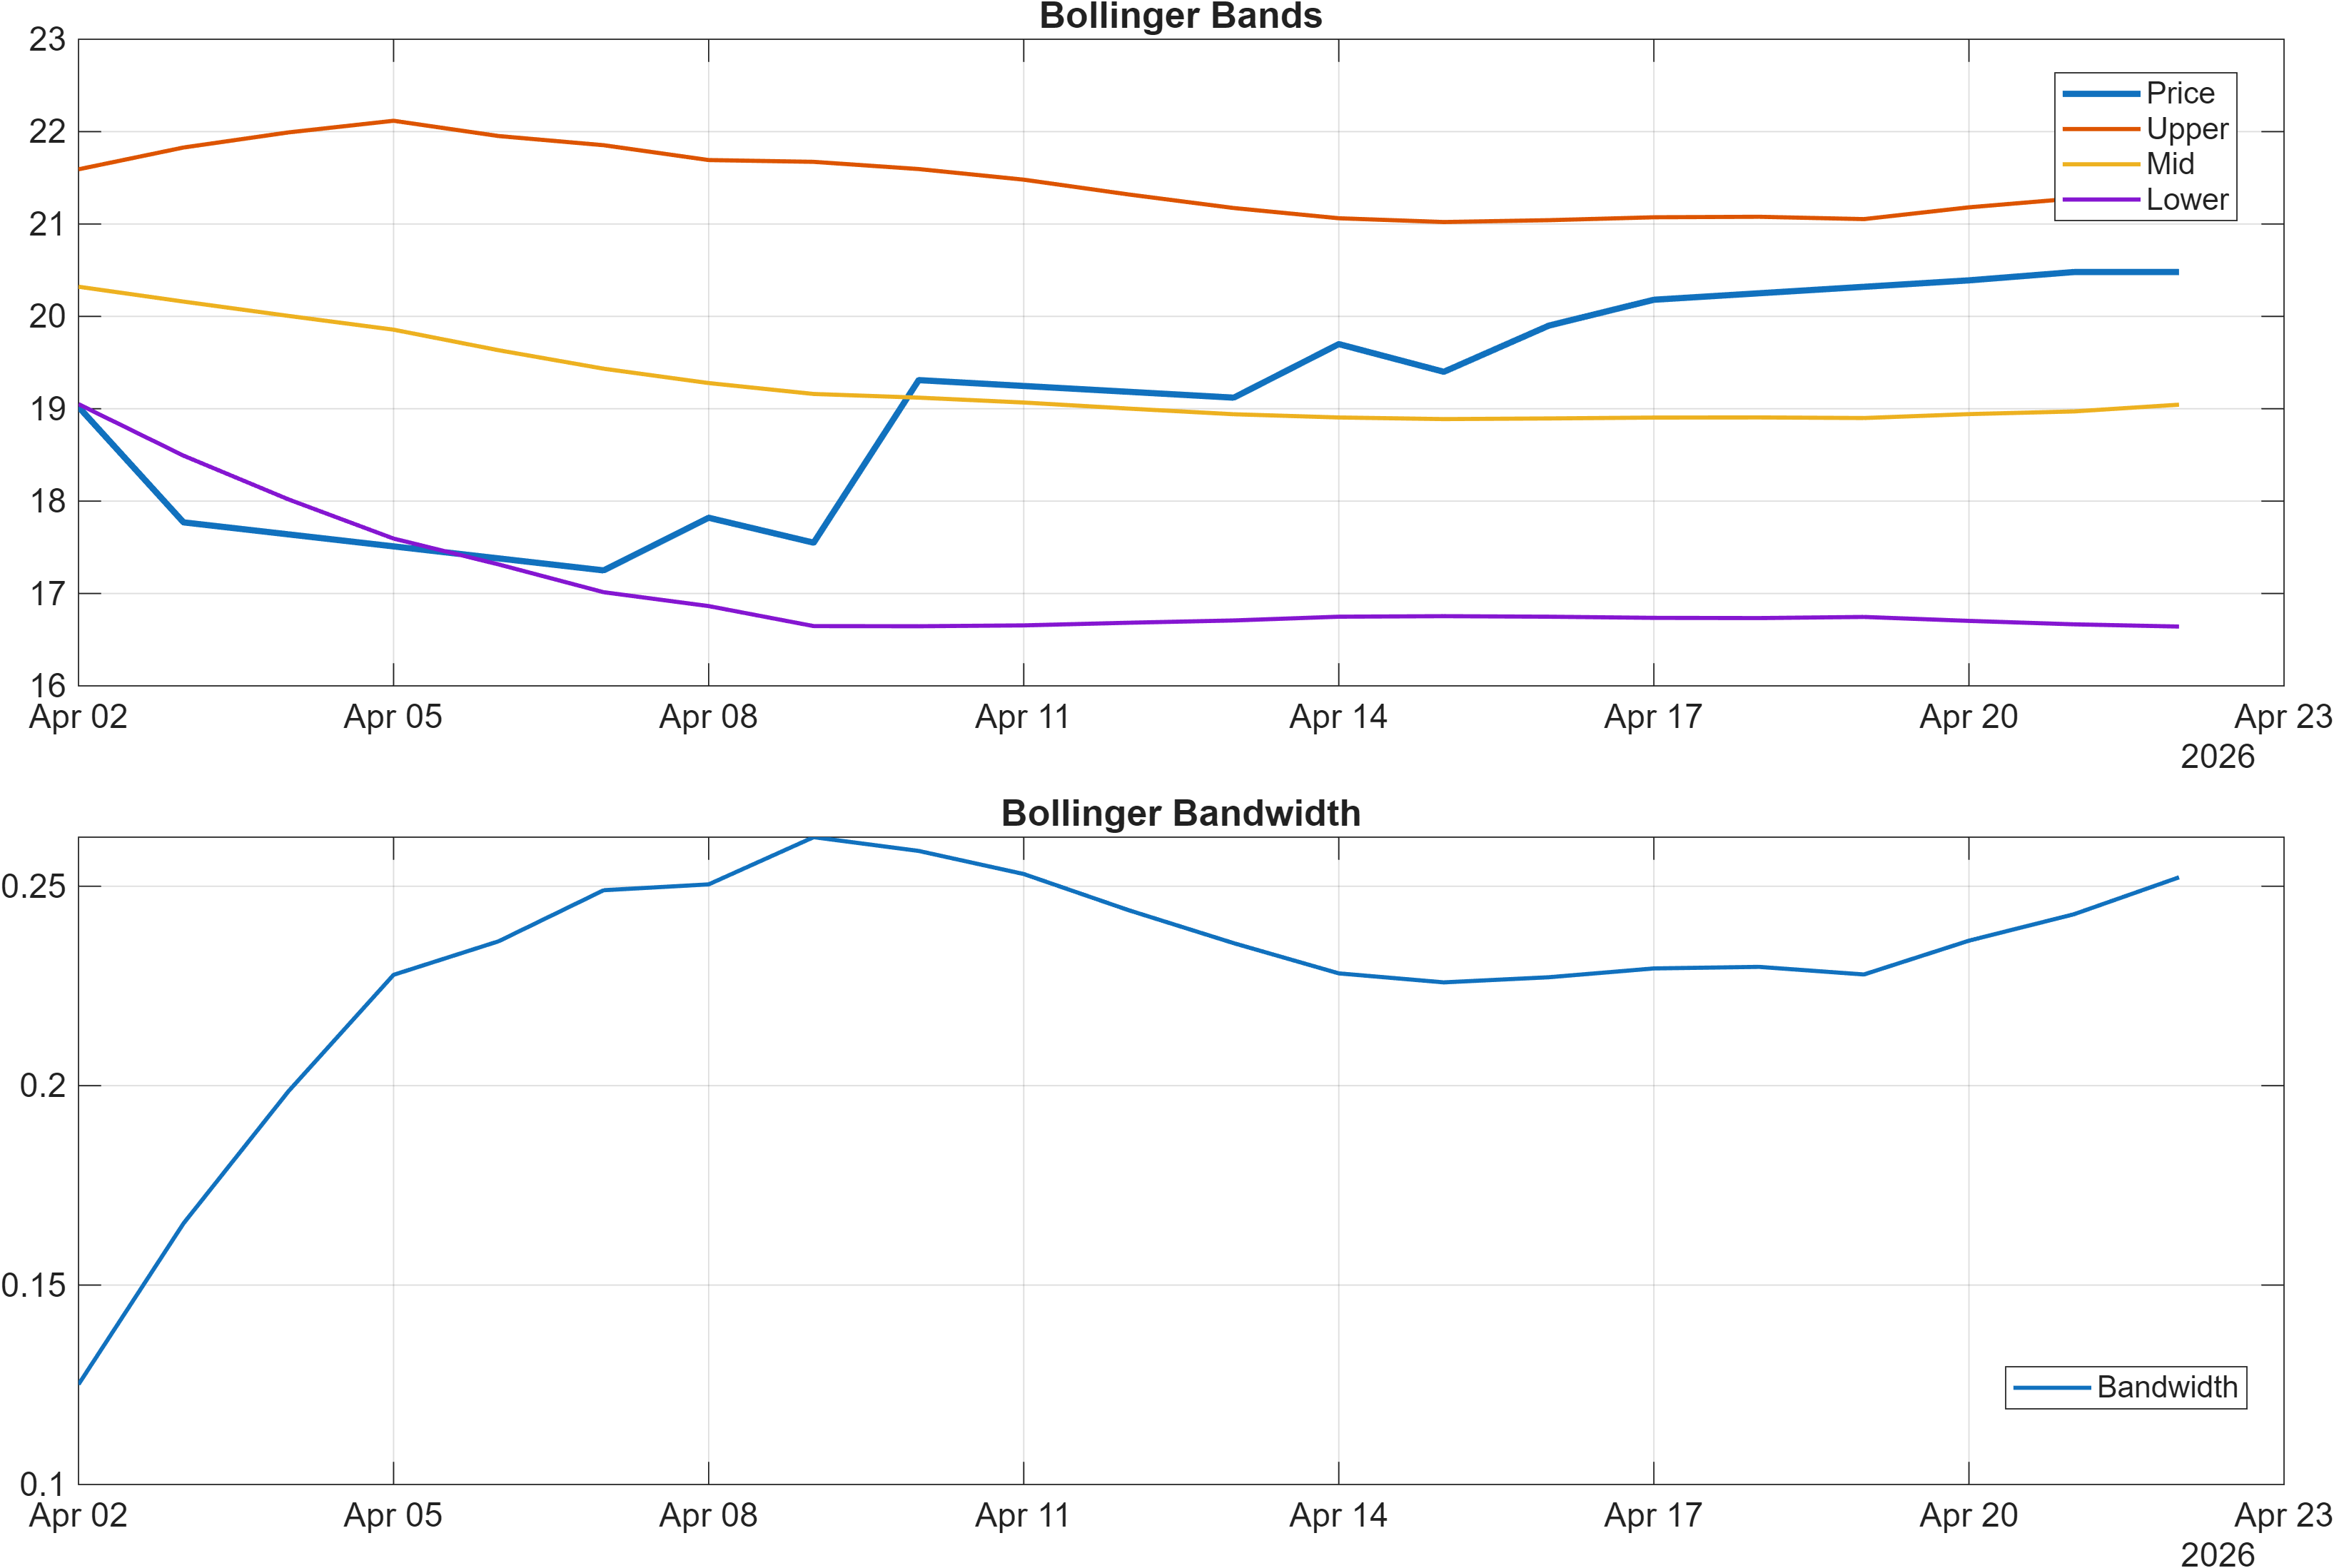
Volatility regime is less decisive. Bollinger Bandwidth is 0.2522 (and BB Width is flagged neutral), a reading that, on its own, does not confirm an aggressive volatility expansion. When momentum is strong while volatility measures are comparatively non-committal, the market can be vulnerable to sharp, event-driven swings—especially near key levels—because positioning may be crowded even if realized volatility has not yet repriced meaningfully.
Interpretation: RSI bias = Bullish, MACD hist = 0.2306.
Interpretation: Bandwidth (volatility regime) latest = 0.2522.
4) Support / Resistance zones
Support ~ 17.6082 | Resistance ~ 22.4567
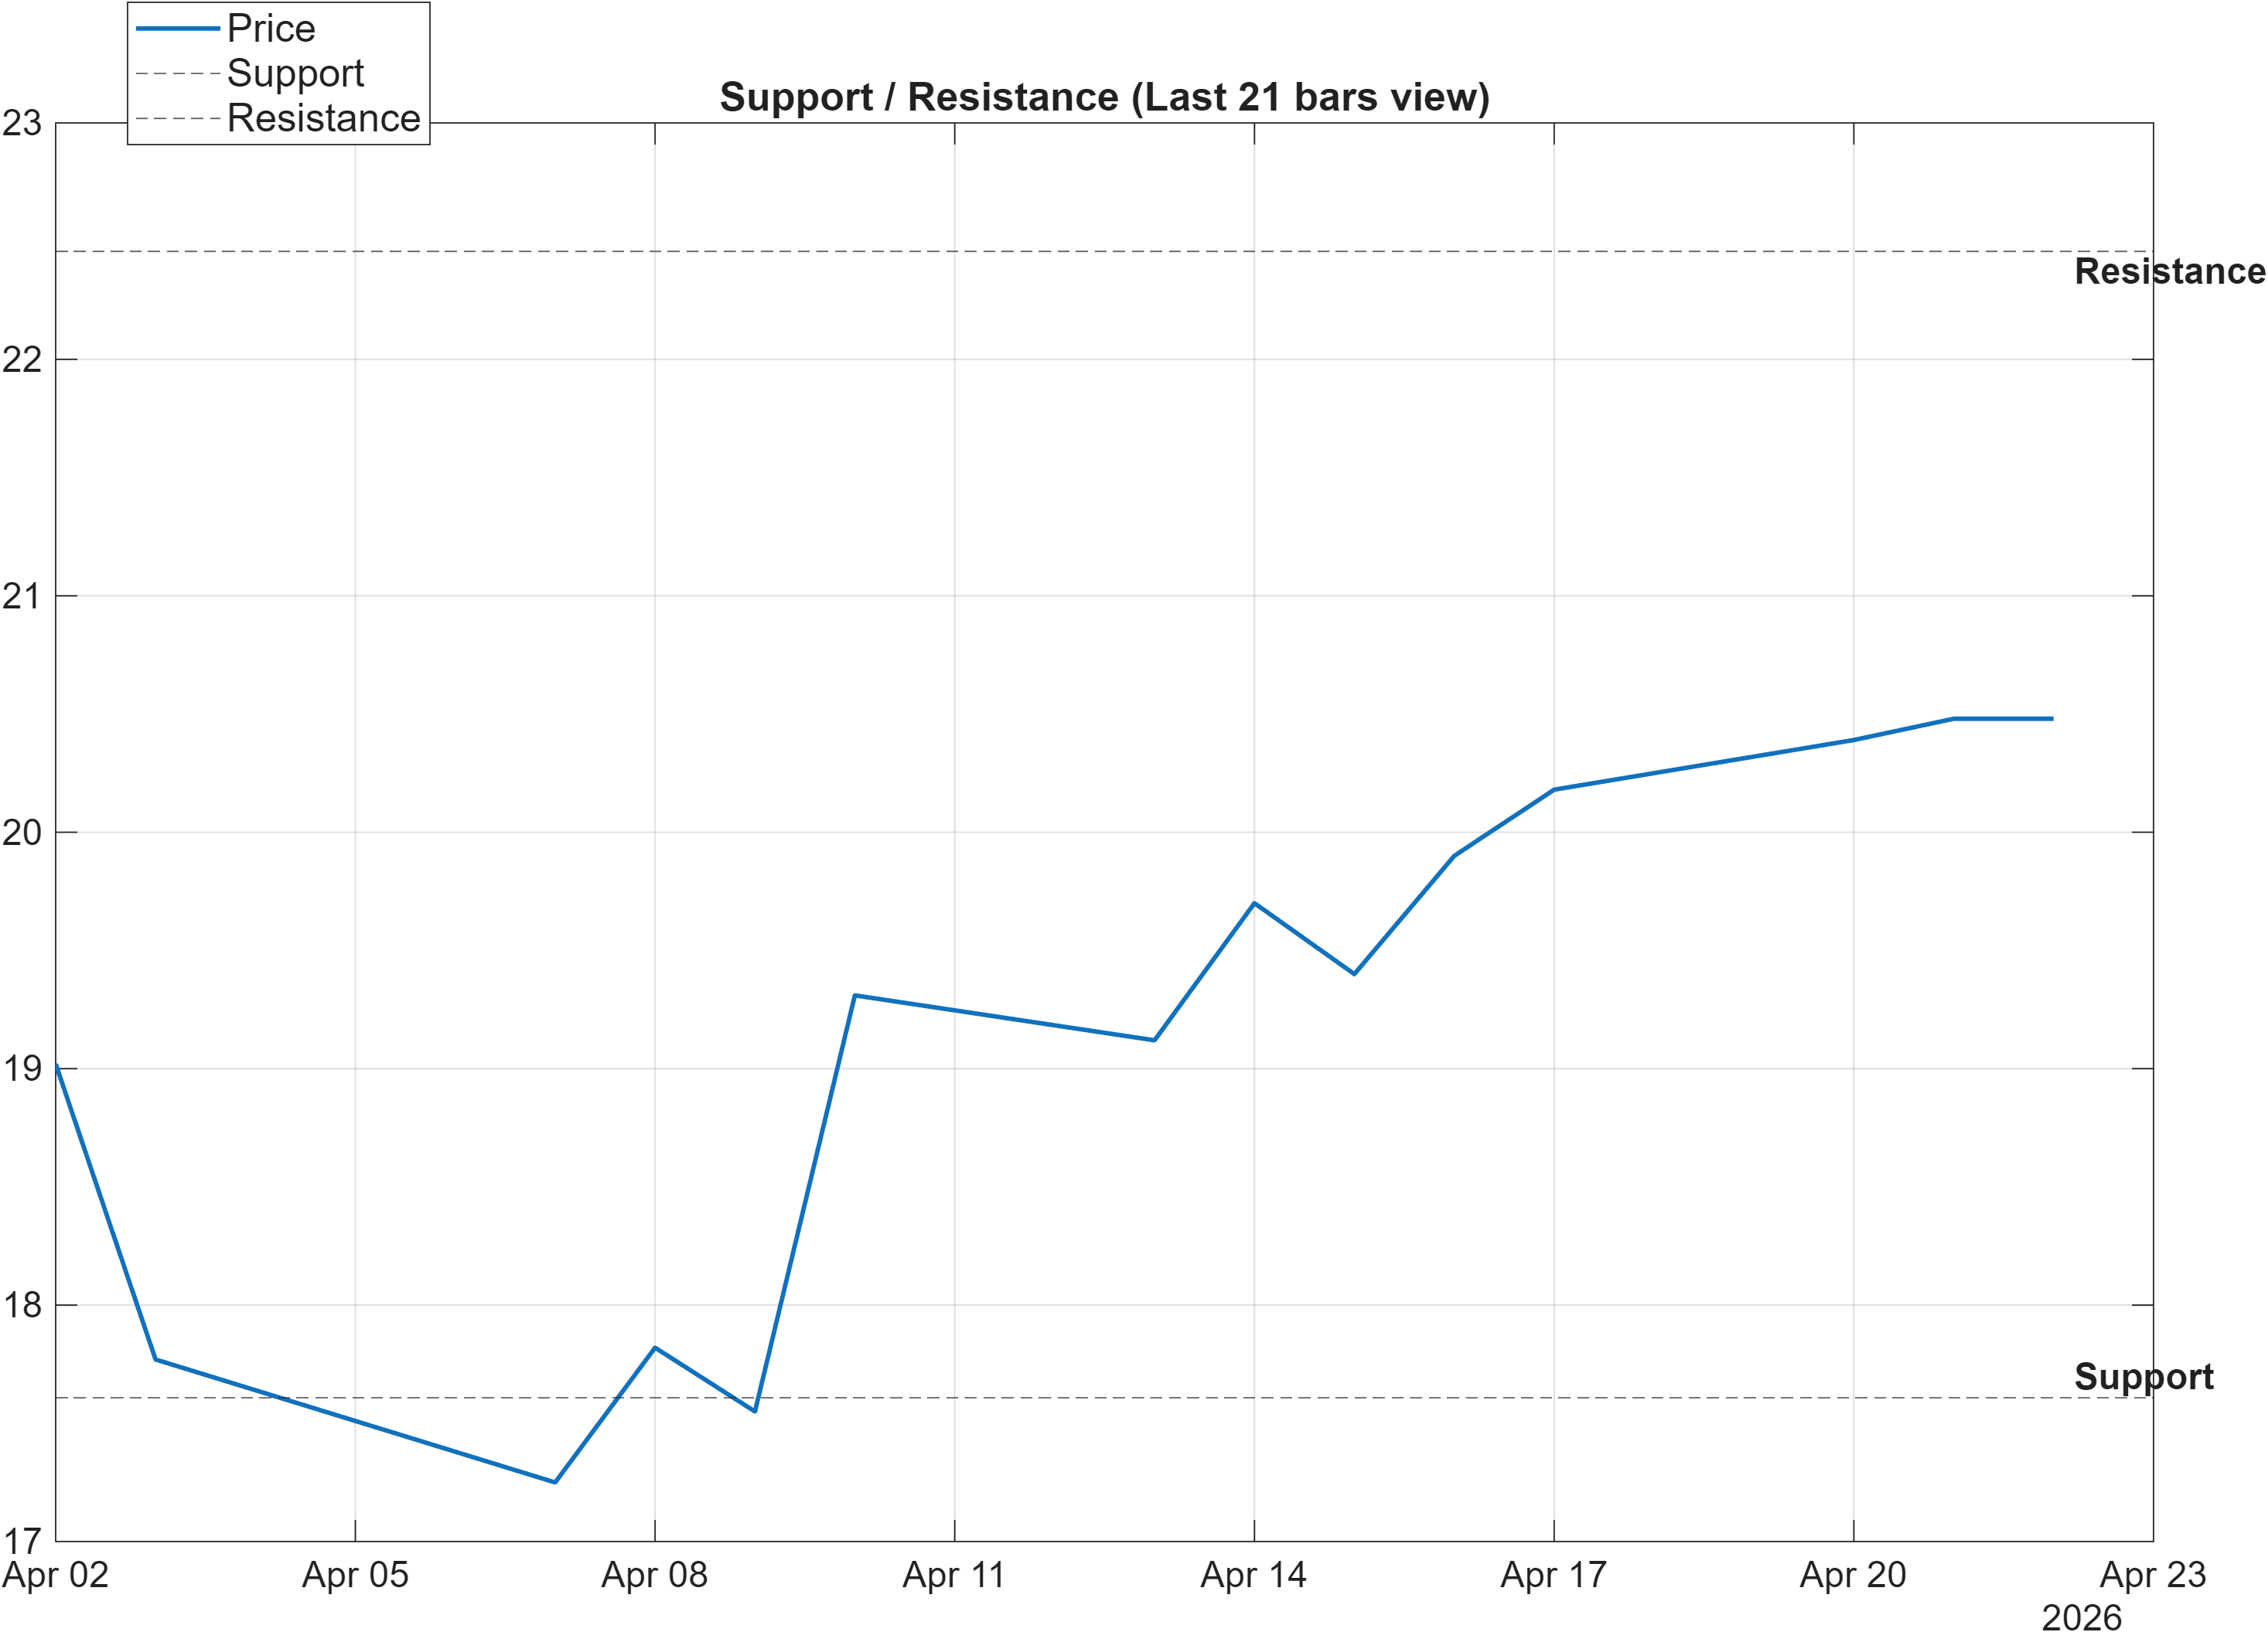
The current setup frames a clear decision corridor between 17.6082 and 22.4567. With momentum indicators already extended (e.g., RSI(14) 81.82), the resistance band becomes a primary test of whether upside strength is trend-forming or simply a high-momentum swing within a larger non-confirmed structure (consistent with MA50 vs MA200 = Bearish).
From a regime perspective, support is more than a line—it is the level most likely to reveal whether participation is supportive during pullbacks. Several participation/flow proxies in the signal table are bullish (e.g., ADOSC 43.18 and a positive OBV slope(10) of 5.008e+07), which can help stabilize price above support if the market digests gains. If that participation fades while price drifts lower, the market’s intermediate-term bearish ranks (weekly #1040, monthly #1201) become more relevant, as the asset may revert toward weaker peer behavior.
The risk management logic implied by these zones is straightforward: continuation quality improves if price can clear and hold above 22.4567 with confirming activity, while closes below 17.6082 would indicate that recent momentum failed to translate into durable structure. In between, tactical trades may work, but the probability of choppy mean-reversion increases relative to clean trend persistence.
Scenario view: Break above resistance with volume → continuation. Close below support → signal deterioration risk.
5) Quant Technical Dashboard (18 Signals)
KGNAI AI Technical Analysis Score (Deep Reinforcement Learning): Rank #685 out of 1292 (Rank 1 represents the strongest technical positioning and a higher probability of favorable price behavior. As ranks increase toward the maximum, the probability of favorable outcomes weakens and bearish positioning becomes more dominant.) | Label: Neutral | Score: -0.060
18-Signal Technical Confluence Score: 0.778 (Bullish)
Overall Technical Score (18-signal confluence + DRL rank blend): 0.526 (Bullish)
Note: The blended score reflects signal strength weighted against broader AI technical ranking, which may temporarily diverge.
Blended technical score breakdown: 0.526 (Bullish | Bull 14 / Bear 0 / Neutral 4)
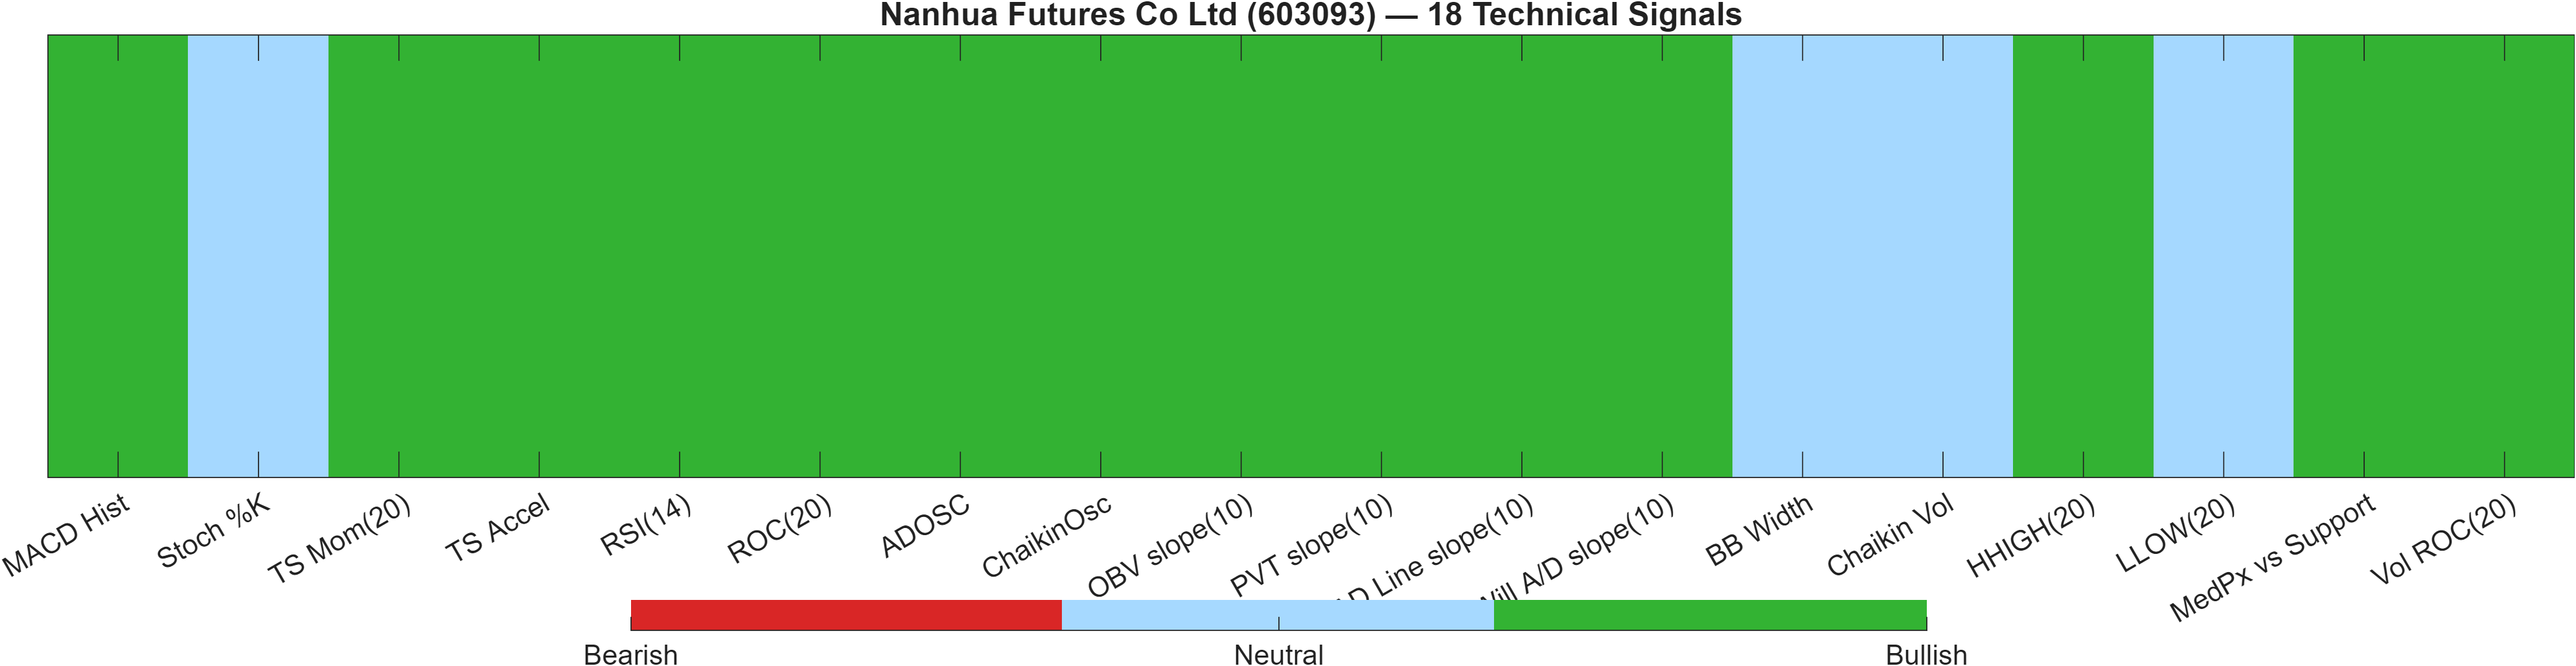
The technical dashboard is notable for a high confluence score alongside only a neutral DRL rank. The 18-signal confluence prints 0.778 (Bullish), and the blended technical score is 0.526 (Bullish) with Bull 14 / Bear 0 / Neutral 4. This is the type of profile that can occur when many classic indicators agree on direction, but the cross-sectional/AI ranking model remains cautious—often because broader trend persistence or regime context is not yet compelling.
The signal mix shows momentum and participation working together: MACD Hist 0.2306 is bullish, while volume/flow measures such as ADOSC 43.18 and PVT slope(10) 9.3e+05 are also bullish. That internal alignment reduces the probability that the move is purely “price-only.” However, the presence of neutral volatility and range components (e.g., BB Width 0.2522 marked neutral and Chaikin Vol -28.01 neutral) implies the market may still be in a phase where the shape of volatility has not fully adapted to the directional impulse.
The DRL technical rank at #685 out of 1292 (score -0.060) is consistent with “constructive but not exceptional” technical placement at the universe level. In other words, the indicator stack looks favorable today, yet the model blend suggests this strength may still be fragile unless price structure improves around the major level at 22.4567 and the longer trend filter (MA50 vs MA200) evolves.
Signal table (Bull/Bear/Neutral)
| Indicator | Value | Signal |
|---|---|---|
| MACD Hist | 0.2306 | Bullish |
| Stoch %K | 76.36 | Neutral |
| TS Mom(20) | 2.71 | Bullish |
| TS Accel | 5.68 | Bullish |
| RSI(14) | 81.82 | Bullish |
| ROC(20) | 15.25 | Bullish |
| ADOSC | 43.18 | Bullish |
| ChaikinOsc | 6.639e+06 | Bullish |
| OBV slope(10) | 5.008e+07 | Bullish |
| PVT slope(10) | 9.3e+05 | Bullish |
| AD Line slope(10) | 1.578e+07 | Bullish |
| Will A/D slope(10) | 2.46 | Bullish |
| BB Width | 0.2522 | Neutral |
| Chaikin Vol | -28.01 | Neutral |
| HHIGH(20) | 21 | Bullish |
| LLOW(20) | 17.12 | Neutral |
| MedPx vs Support | 2.952 | Bullish |
| Vol ROC(20) | 17.81 | Bullish |
Interpretation: Indicator-level signals form the base confluence, which is then adjusted using a separate AI-driven technical ranking model. The final technical score summarizes this combined view.
6) News sentiment + extractive gist
Note: Instrument-specific news matches were not found, so the digest includes broader market/sector headlines. Links are provided for verification.
Sentiment score (avg): 0.000 | Positive: 12% | Neutral: 75% | Negative: 12%
KGNAI AI News Sentiment Score (normalized -1 to +1): Not available (as of —) | Label: Not available | Overall news score: 0.00
Positive Developments
Recent coverage across major financial outlets indicates a modestly constructive set of themes, largely centered on structural investment cycles and policy-linked demand expectations rather than company-specific catalysts. Parts of the flow emphasize longer-run transitions in power generation and electrification, which can support broader risk appetite when framed as multi-year capex visibility. In parallel, some narratives highlight the need to balance security considerations with openness in advanced technology competition, a framing that can reduce tail-risk perceptions when it signals clearer policy debate rather than abrupt shifts. Given the lack of instrument-specific matches, this positivity should be read as context, not a driver; in the KGNAI framework, such a backdrop tends to matter most when the tape is testing key levels like 22.4567 and participation indicators are already supportive (e.g., bullish volume/flow signals).
Neutral / Mixed Developments
The dominant tone in the dataset is neutral, consistent with the 75% neutral share and the average score of 0.000. The neutral cluster appears to reflect macro- and sector-oriented reporting where implications can cut both ways: logistics, trade, and energy-market dynamics can support activity in some channels while raising input-cost or policy uncertainty in others. For 603093, the practical implication is that headlines in the provided set do not provide a clear directional impulse, leaving price structure and technical confirmation as the primary decision variables. In this environment, indicator alignment (confluence 0.778) may dominate short-horizon behavior, while ranks (weekly #1040, monthly #1201) remain the medium-horizon constraint.
Negative / Risk Signals
Risk-oriented coverage in the provided data leans toward competitiveness pressures and policy uncertainty themes, which can translate into episodic volatility even when headline sentiment averages out to neutral. When risk narratives pick up—especially around consumption support, taxes, or cross-border trade constraints—the market often expresses it through sharper rotation rather than a steady trend. That matters for a setup where momentum is extended (RSI(14) 81.82) and volatility measures are not emphatically expanding (Bandwidth 0.2522, neutral), because rapid sentiment shifts can produce abrupt mean-reversion. From a market-structure lens, the key is whether drawdowns remain contained above 17.6082; sustained weakness below that zone would align more closely with the weaker intermediate ranks and undermine the otherwise bullish technical stack.
- What to monitor next: Whether price acceptance develops above 22.4567 alongside confirming participation/flow signals.
- What to monitor next: Whether volatility regime shifts (BB Width/Bandwidth) accompany trend attempts rather than remaining neutral.
- What to monitor next: Whether pullbacks hold above 17.6082 as momentum cools from elevated readings.
Snapshot: AI Rank (Short–Mid–Long): Mixed (Bearish tilt) (Bearish–Bearish–Neutral) · Technical Confluence: Bullish · Key Levels: Support ~17.61 | Resistance ~22.46 · News Sentiment: Neutral
Sources referenced: Reuters, Bloomberg, Yahoo Finance, MarketWatch, Investing.com
7) Sources
Not available in the provided data.
You may also like: How KGNAI AI ranks instruments across global markets
Disclaimer: KGNAI provides AI-generated analytics and educational market commentary only. This is not financial advice. Markets involve risk. Always do your own research.