
603939 Yifeng Pharmacy — Mixed Momentum Signals (26-Apr-2026) | Neutral short-term, bullish mid-term bias
Yifeng Pharmacy (603939) enters 26-Apr-2026 with a split profile across time horizons: the Daily rank sits in the weaker portion of the tracked universe, while the Weekly (#95), Monthly (#187), and especially the 3-Monthly (#22) ranks indicate stronger relative positioning. Technically, the 18-signal framework leans constructive (confluence 0.500; blended technical score 0.394), supported by momentum readings such as RSI(14) 67.3 and a positive MACD histogram 0.2064. Volatility is moderate with Bollinger Bandwidth 0.1144, implying a market that may still be in a trend-following regime rather than a high-variance breakout state. Key tactical levels remain clearly defined: support ~22.3383 and resistance ~24.9400. News tone is neutral overall (sentiment avg 0.013, heavily neutral skew), so price/flow signals are likely to dominate near-term decision-making.
- Short / Mid / Long rank stance: Neutral (Daily #897) / Bullish (Weekly #95; Monthly #187; 3-Monthly #22) / Neutral (6-Monthly #282; Yearly #181 bullish tilt)
- Technical confluence: Bullish (18-signal confluence 0.500; blended 0.394)
- Key levels: Support ~22.3383; Resistance ~24.9400
- News sentiment bias: Neutral (avg 0.013; Neutral 81%)
- Confirmation / invalidation: Continuation improves on a break above ~24.9400 with volume; deterioration risk increases on a close below ~22.3383
KGNAI evaluates assets using large cross-sectional datasets built from millions of structured data points. Inputs incorporate fundamental metrics, technical structures, and systematically processed news sentiment. Statistical models, machine learning, and AI frameworks are used to assess relative positioning, signal alignment, and probabilistic behavior across broad universes.
- Ranks are comparative across the tracked universe, not absolute price targets.
- Confluence reflects alignment among independent signal groups.
- Support/resistance levels are probabilistic decision zones, not guarantees.
- Sentiment provides contextual bias within the broader analytical framework.
1) KGNAI AI Analysis
Region: CHINA
Total universe size: 1292 ranked instruments
- Daily rank: #897 out of 1292 — Neutral
- Weekly rank: #95 out of 1292 — Bullish
- Monthly rank: #187 out of 1292 — Bullish
- 3-Monthly rank: #22 out of 1292 — Bullish
- 6-Monthly rank: #282 out of 1292 — Neutral
- Yearly rank: #181 out of 1292 — Bullish
Cross-horizon ranks show a clear timing divergence. The Daily rank (#897) places 603939 in the weaker cohort near the lower third-to-lower quartile of the 1292-name universe, consistent with a near-term market that may be consolidating or digesting gains. In contrast, the Weekly rank (#95) sits in the upper tranche of the distribution, and the 3-Monthly rank (#22) is firmly in top-decile territory, a profile typically associated with persistent trend behavior over intermediate windows.
This mismatch is often observed when mid-term leadership persists but the short-term signal set becomes less decisive—either from mean reversion after a run or from a pause that has not yet degraded the broader structure. The Monthly rank (#187) supports the interpretation that strength is not purely a one-off weekly artifact, while the 6-Monthly rank (#282) returning to Neutral argues against treating the setup as a uniform, all-horizon “risk-on” condition.
Practically, the rank stack suggests two simultaneous truths: (1) the instrument has exhibited comparatively favorable behavior across several months (e.g., #22 at 3-month), and (2) the current daily window is not offering strong confirmation. That framing aligns with the stated term view—Short-term Neutral, Mid-term Bullish, Long-term Neutral—and places more weight on confirmation from price structure and support/resistance behavior than on short-horizon rank alone.
2) Price & trend overview
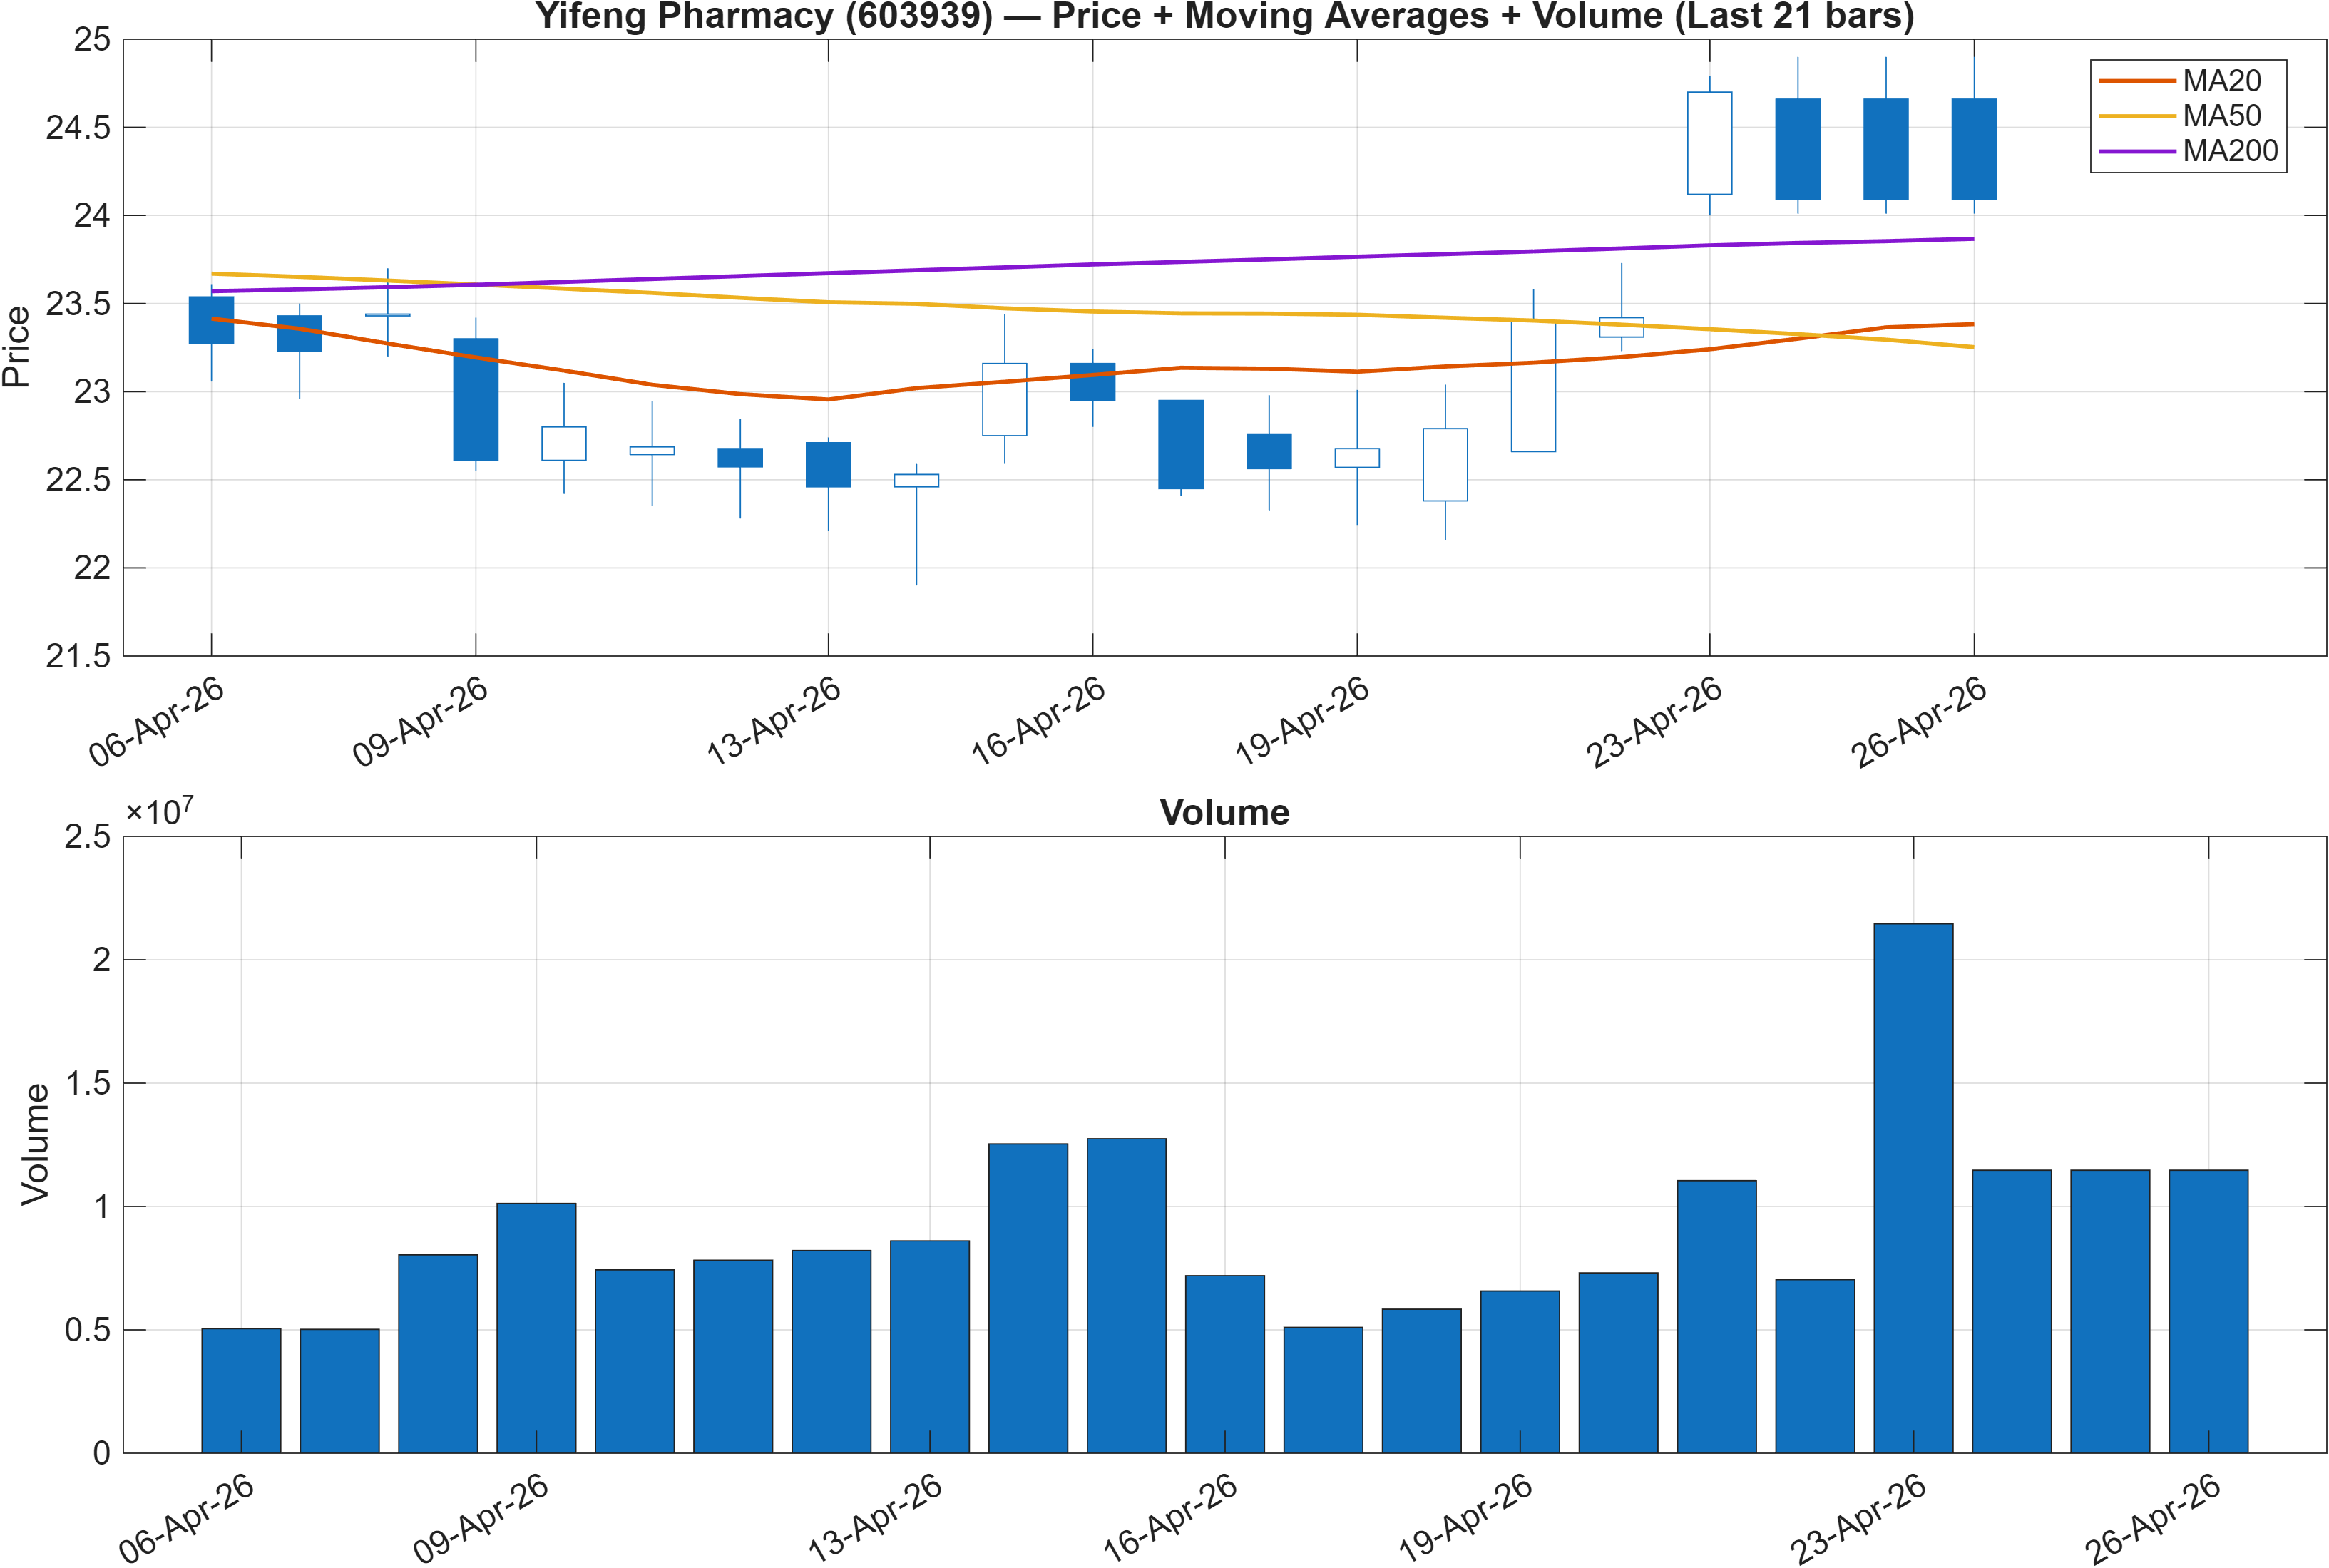
Interpretation: Close vs MA50 = Bullish, MA50 vs MA200 = Bearish.
Trend alignment: short-term strength vs longer-term drag
The moving-average read is a two-speed trend picture. With Close vs MA50 = Bullish, price action is currently holding above the intermediate trend reference—often consistent with an advancing swing structure or a recovery phase that has not yet broken down. However, MA50 vs MA200 = Bearish flags that the longer-cycle trend filter remains adverse, implying either a prior downtrend still in the process of being repaired or a regime where rallies face overhead supply before becoming structurally durable.
This combination tends to produce range-to-trend transitions where continuation requires repeated confirmation: persistent closes above the MA50 are constructive, but the bear stacking of MA50 below MA200 can amplify sensitivity to pullbacks. In such regimes, intermediate bullish signals can coexist with hesitant short-term rank behavior (consistent with the Daily rank #897 versus Weekly #95), because near-term price can be reactive while the broader slope dynamics lag.
The nearby structural levels frame the trend’s “stress test.” With resistance ~24.9400 and support ~22.3383, the market has defined boundaries where trend persistence is either validated (holding above support while probing higher) or challenged (loss of support). Taken together with the mid-term ranking strength (notably 3-Monthly #22), the trend assessment is less about declaring direction and more about whether price can convert intermediate strength into a longer-term uptrend despite the MA200 drag.
3) Momentum & volatility dashboard
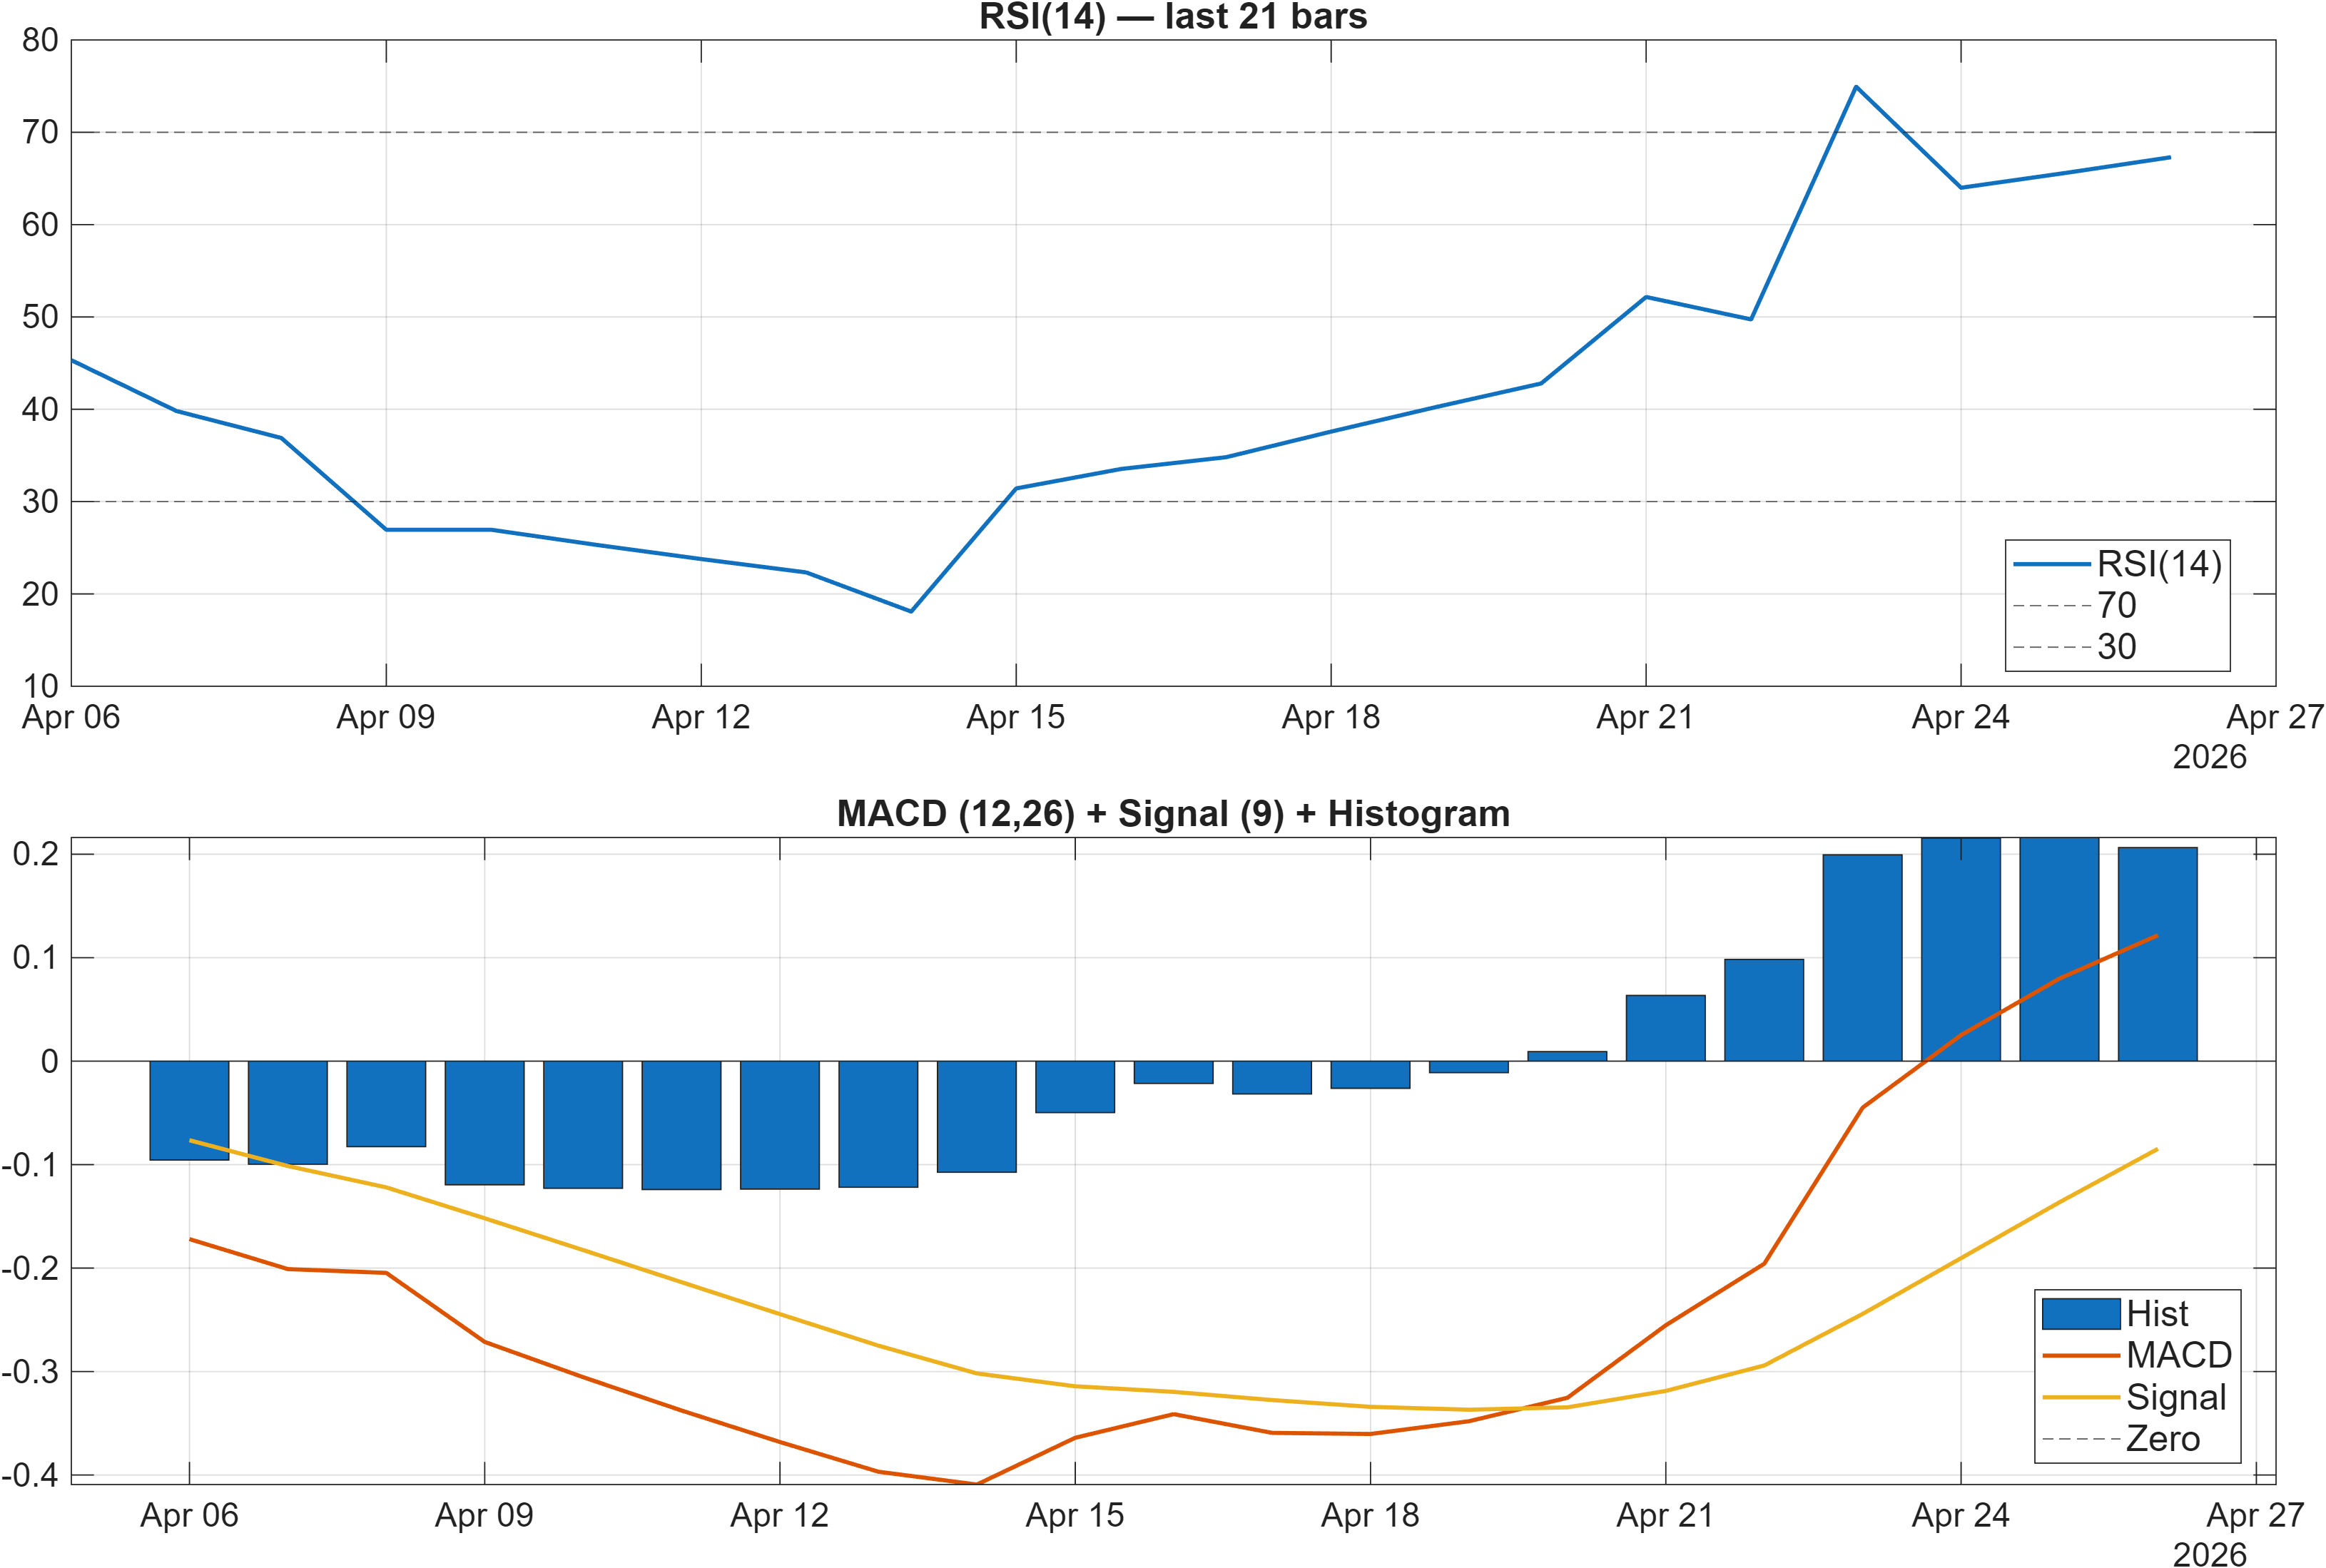
Interpretation: RSI bias = Bullish, MACD hist = 0.2064.
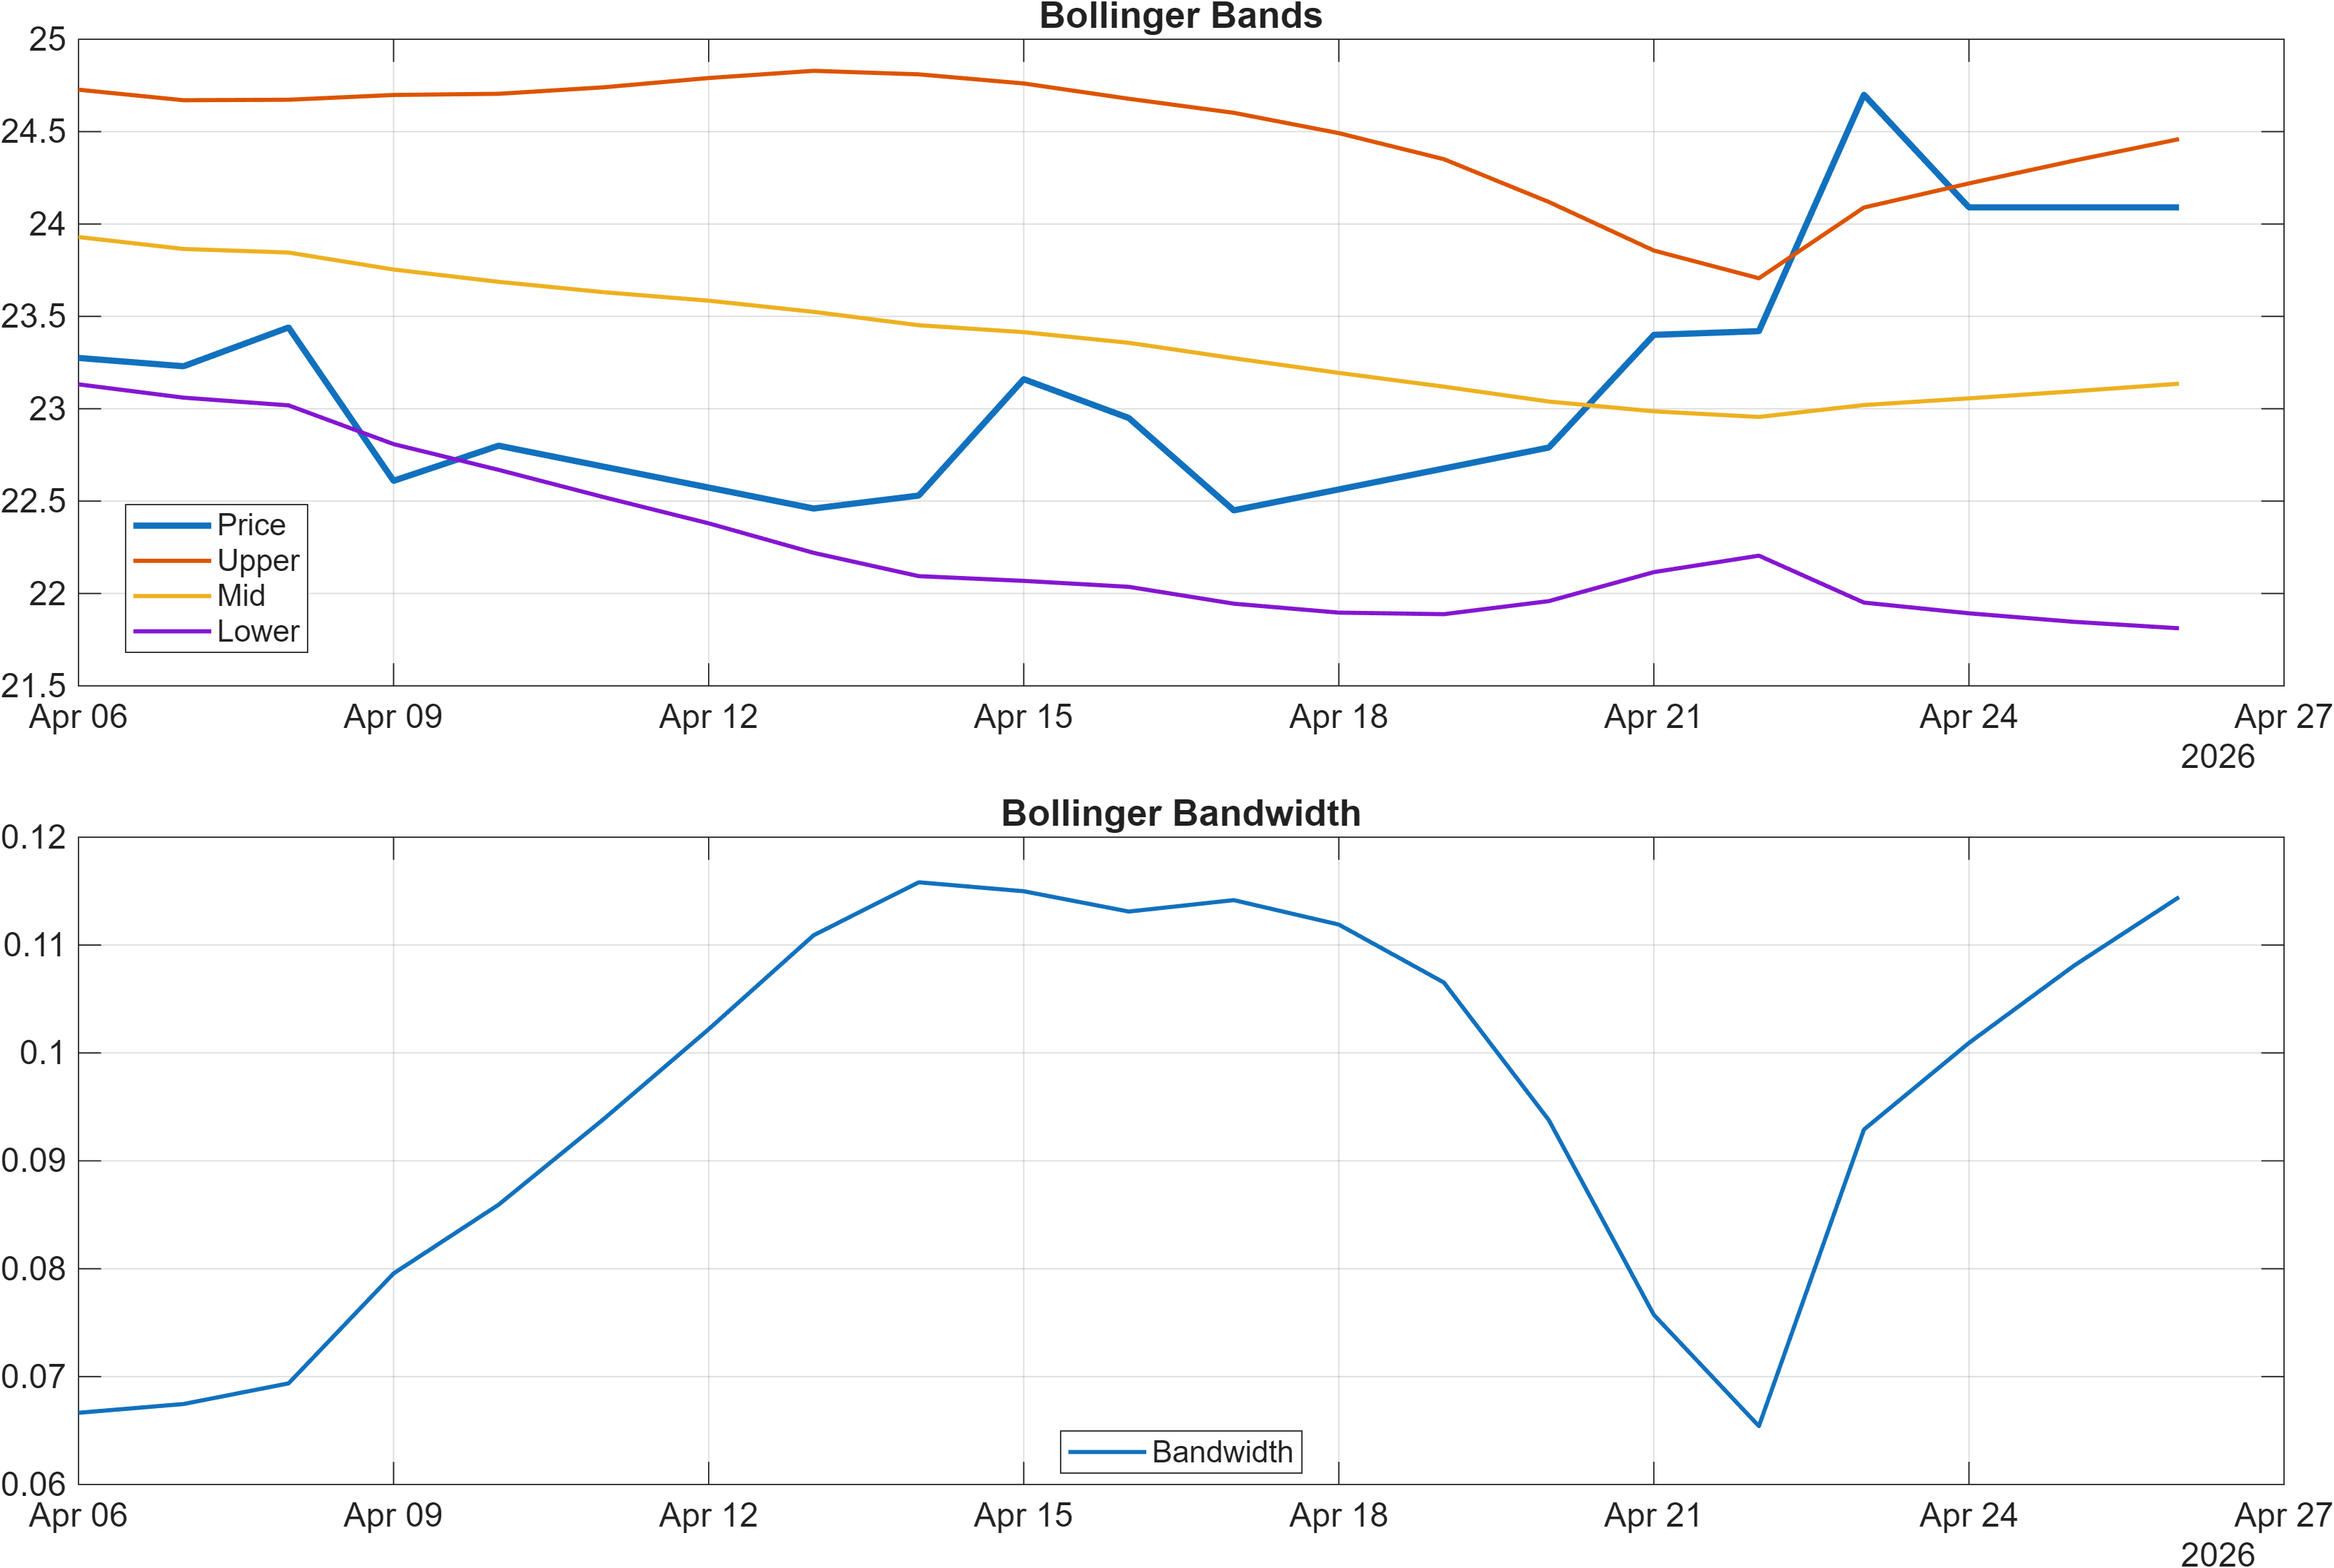
Interpretation: Bandwidth (volatility regime) latest = 0.1144.
Momentum persistence vs early saturation risk
Momentum is broadly constructive, but not without late-cycle considerations. The dashboard shows RSI(14) 67.3 with an explicitly Bullish RSI bias, a level typically consistent with sustained buying pressure rather than a weak rebound. The MACD histogram at 0.2064 is also positive, indicating that the faster trend component remains above the slower component, supporting continuation risk-on behavior at the indicator level.
At the same time, a higher RSI zone can become more sensitive to marginal disappointments, particularly when longer-term trend filters (e.g., MA50 vs MA200) are still bearish. This is where the near-term rank softness (Daily #897) becomes relevant: it can be an early sign that the market is less responsive to incremental positive impulses even while mid-term structure remains intact.
Volatility conditions appear moderate rather than explosive. With Bollinger Bandwidth 0.1144, the setup does not suggest a fully compressed “coiled spring” environment; instead, it points to a market already moving with a measured range. In practice, moderate bandwidth can support trends by reducing whipsaw risk, but it can also indicate that large directional moves may require an additional catalyst (volume/flow confirmation near key levels).
Overall, the momentum/volatility mix reads as trend-following with guardrails: positive MACD/RSI supports the mid-term bullish ranking, while bandwidth and rank divergence advise monitoring whether momentum holds through pullbacks toward the defined support zone.
4) Support / Resistance zones
Support ~ 22.3383 | Resistance ~ 24.9400
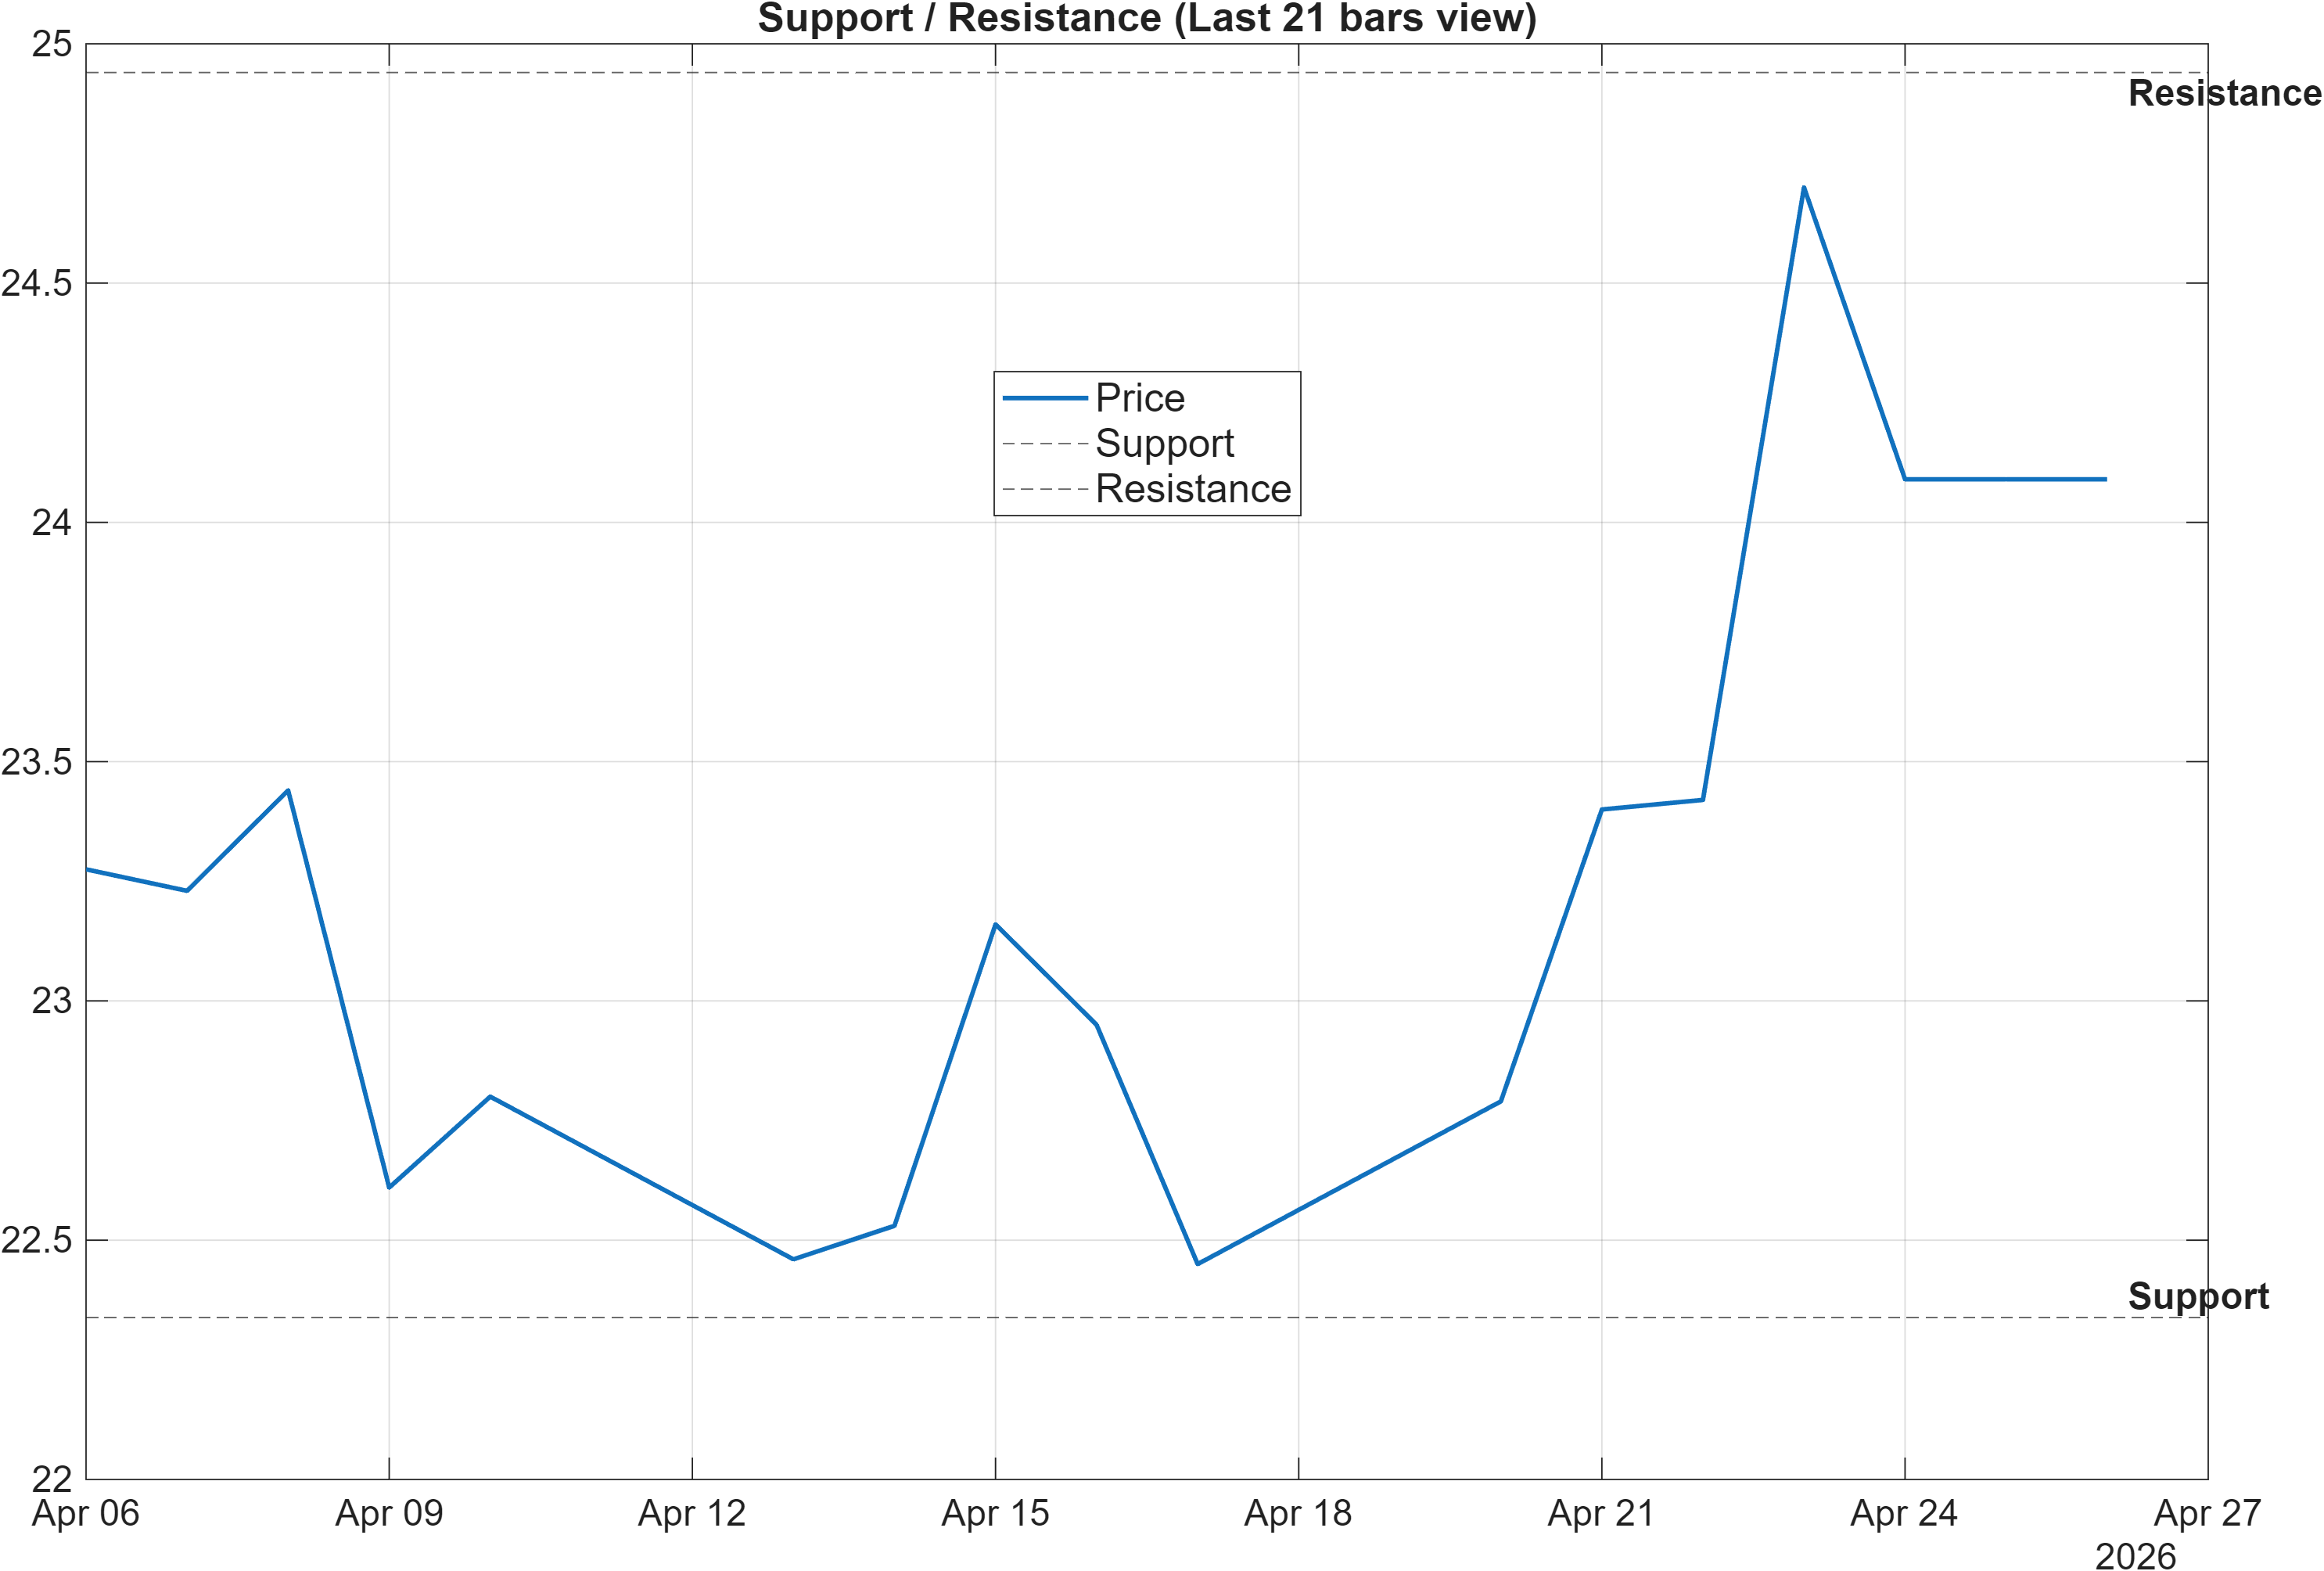
Scenario view: Break above resistance with volume → continuation. Close below support → signal deterioration risk.
Decision zones: validating continuation vs defining failure
The technical map is clean: support ~22.3383 and resistance ~24.9400 bracket the current decision range. In a profile where intermediate signals are constructive (e.g., 3-Monthly rank #22 and a Bullish 18-signal read), the support level becomes the key reference for determining whether strength is merely tactical or structurally maintained.
The provided scenario framing is asymmetrical in a useful way. A break above ~24.9400 with volume functions as confirmation that demand can absorb supply at the upper boundary—an outcome that tends to align the shorter-horizon rank with the mid-term ranks if sustained. Conversely, a close below ~22.3383 is explicitly described as deterioration risk; in the current context, that would likely pressure the “close above MA50” condition and increase the probability that the bullish momentum readings (e.g., MACD hist 0.2064) roll over.
Importantly, these levels should be treated as probabilistic control points rather than hard barriers. With moderate volatility (bandwidth 0.1144), overshoots can occur, but sustained acceptance above resistance or below support typically matters more than intraday probes. The rank divergence (Daily weak vs Weekly/3-Month strong) makes this level discipline particularly relevant: the market is already sending mixed timing signals, so level-based validation helps avoid over-weighting any single indicator cluster.
5) Quant Technical Dashboard (18 Signals)
KGNAI AI Technical Analysis Score (Deep Reinforcement Learning): Rank #551 out of 1292 (Rank 1 represents the strongest technical positioning and a higher probability of favorable price behavior. As ranks increase toward the maximum, the probability of favorable outcomes weakens and bearish positioning becomes more dominant.) | Label: Neutral | Score: 0.147
18-Signal Technical Confluence Score: 0.500 (Bullish)
Overall Technical Score (18-signal confluence + DRL rank blend): 0.394 (Bullish)
Note: The blended score reflects signal strength weighted against broader AI technical ranking, which may temporarily diverge.
Blended technical score breakdown: 0.394 (Bullish | Bull 12 / Bear 3 / Neutral 3)
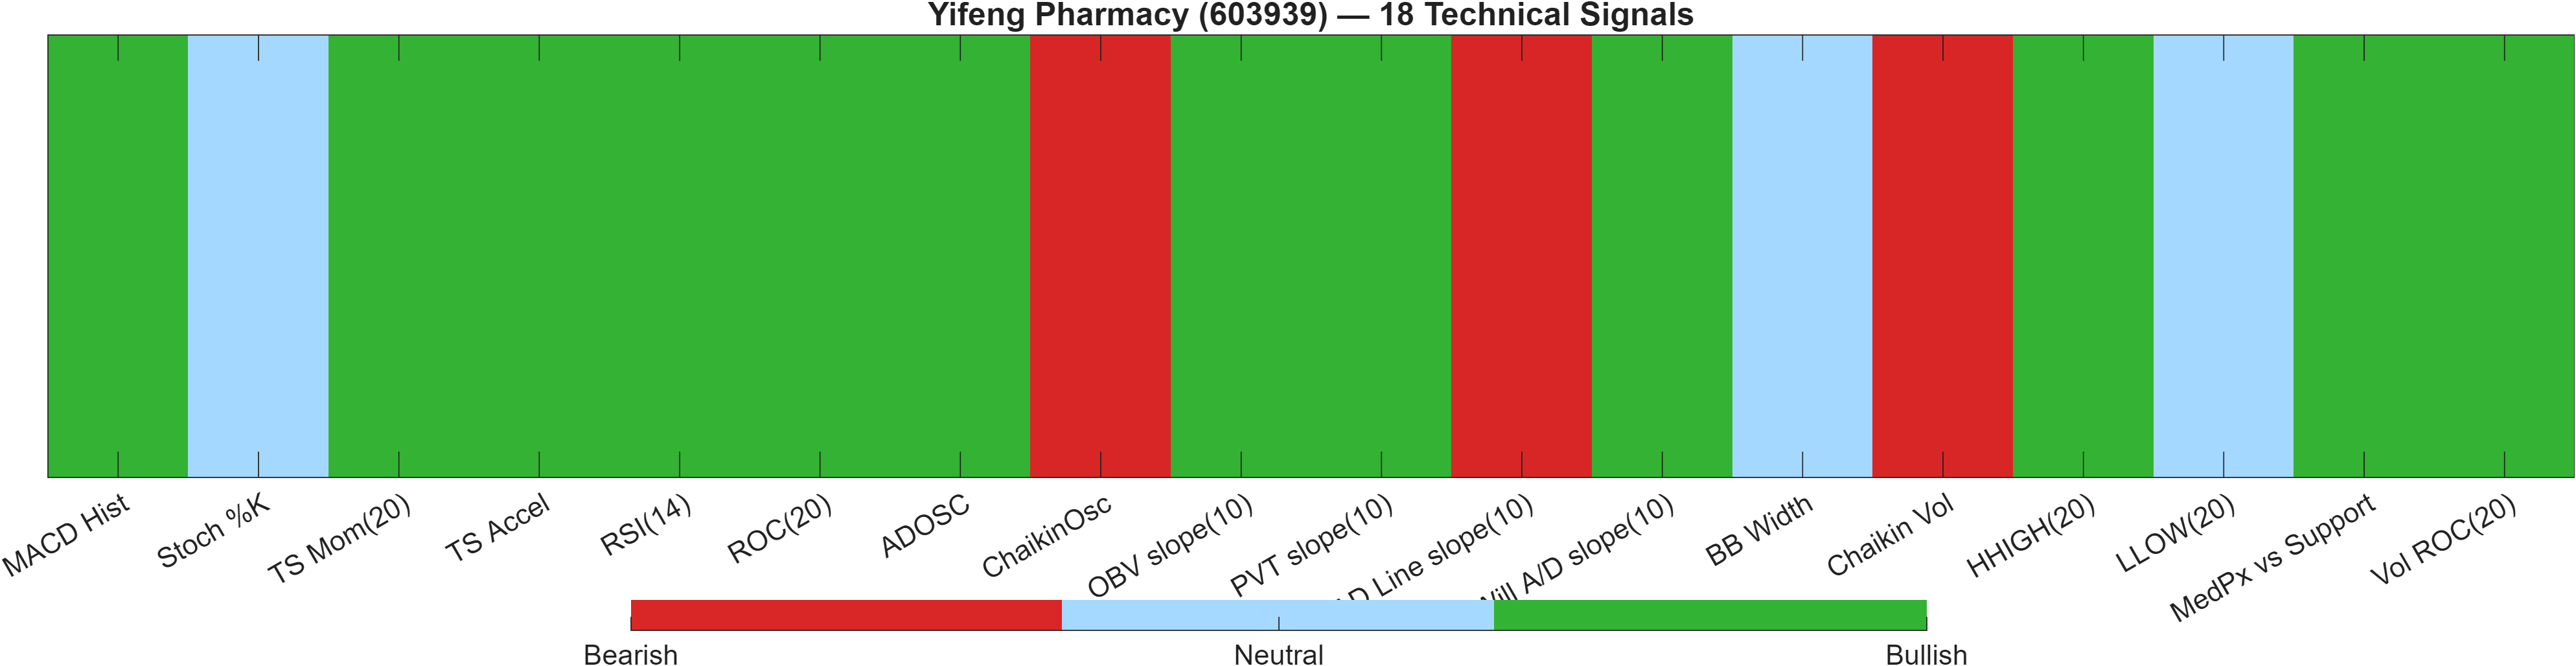
Confluence vs model rank: constructive breadth with a neutral overlay
The dashboard highlights a useful tension between signal breadth and model-ranked positioning. The 18-signal framework is bullish on balance with a confluence score of 0.500, and the blended technical score remains bullish at 0.394. The underlying mix—Bull 12 / Bear 3 / Neutral 3—implies that positive conditions are not narrowly dependent on one factor; instead, multiple independent indicators are aligned.
Yet the Deep Reinforcement Learning technical rank sits at #551 out of 1292 with a Neutral label and a score of 0.147. This is the classic pattern where micro-signals look healthy, but the broader pattern library (as learned across the universe) classifies the setup as less distinctive. In other words, the market may be “okay” rather than “exceptional” from a global technical-pattern standpoint.
Indicator examples show why confluence leans positive while still allowing for caution. Momentum and trend signals are supportive (e.g., MACD Hist 0.2064 bullish; RSI(14) 67.3 bullish; ROC(20) 3.702 bullish), while selected flow/volume measures show mixed internals (e.g., AD Line slope(10) -8.561e+06 bearish alongside a bullish OBV slope(10) 4.268e+07). Volatility is not flashing strong directionality (BB Width 0.1144 neutral), consistent with a market that may need level breaks (e.g., ~24.9400) to convert “constructive” into “decisive.”
Signal table (Bull/Bear/Neutral)
| Indicator | Value | Signal |
|---|---|---|
| MACD Hist | 0.2064 | Bullish |
| Stoch %K | 70.44 | Neutral |
| TS Mom(20) | 0.86 | Bullish |
| TS Accel | 1.46 | Bullish |
| RSI(14) | 67.3 | Bullish |
| ROC(20) | 3.702 | Bullish |
| ADOSC | 17.98 | Bullish |
| ChaikinOsc | -2.476e+06 | Bearish |
| OBV slope(10) | 4.268e+07 | Bullish |
| PVT slope(10) | 1.179e+06 | Bullish |
| AD Line slope(10) | -8.561e+06 | Bearish |
| Will A/D slope(10) | 2.2 | Bullish |
| BB Width | 0.1144 | Neutral |
| Chaikin Vol | 29.61 | Bearish |
| HHIGH(20) | 24.9 | Bullish |
| LLOW(20) | 21.9 | Neutral |
| MedPx vs Support | 2.117 | Bullish |
| Vol ROC(20) | 128.5 | Bullish |
Interpretation: Indicator-level signals form the base confluence, which is then adjusted using a separate AI-driven technical ranking model. The final technical score summarizes this combined view.
6) News sentiment + extractive gist
Note: Instrument-specific news matches were not found, so the digest includes broader market/sector headlines. Links are provided for verification.
Sentiment score (avg): 0.013 | Positive: 12% | Neutral: 81% | Negative: 6%
KGNAI AI News Sentiment Score (normalized -1 to +1): Not available (as of —) | Label: Not available | Overall news score: 0.01
Positive Developments
Recent coverage across major financial outlets indicates a mildly constructive tone, though the signal is more about macro and financing conditions than company-specific catalysts. The positive bucket reflects that some market narratives have leaned toward improved availability of funding and cross-border issuance activity, which can support broader risk appetite. However, given the absence of instrument-specific matches, these items should be treated as contextual rather than directly explanatory of 603939 price behavior. In that environment, the market’s technical posture (e.g., bullish confluence 0.500 and positive MACD histogram 0.2064) is likely to carry more weight than generalized headlines. The low positive share (12%) also suggests that “good news” is not a dominant driver; it is supportive at the margin rather than decisive. For positioning, this leans toward watching whether price can convert the constructive backdrop into acceptance above ~24.9400.
Neutral / Mixed Developments
The dominant feature of the news mix is neutrality: 81% of items fall into a non-directional bucket, consistent with a backdrop where information flow is not strongly skewed toward either optimism or concern for the broader market. This aligns with the sentiment average of 0.013 and an overall news score of 0.01. In practice, neutral-heavy regimes often coincide with technical-led trading where support/resistance and indicator alignment become the primary decision inputs. With volatility not signaling an extreme state (Bollinger Bandwidth 0.1144), neutral news can reinforce a steady, range-aware approach: strength is validated via price action rather than narrative, and weakness is identified via level failure.
Negative / Risk Signals
Risk items appear present but not dominant (6% negative), and they largely reflect broader geopolitical and non-market developments rather than instrument-specific deterioration. Even so, negative news—especially when it amplifies uncertainty—can function as a catalyst for volatility spikes that test technical levels. For 603939, that translates into heightened sensitivity around support ~22.3383: in mixed rank conditions (e.g., Daily #897 versus 3-Monthly #22), downside excursions can quickly change the character of the setup by forcing momentum indicators to mean-revert from elevated readings such as RSI(14) 67.3. The key is not the headline count but whether risk-off impulses show up as sustained closes below support or as transient noise that the trend can absorb.
- Whether price acceptance improves above ~24.9400 alongside volume confirmation.
- Whether pullbacks remain orderly above ~22.3383 in a neutral-news backdrop.
- Whether sentiment mix shifts materially away from the current 81% neutral share.
Sources referenced: Reuters, Bloomberg, Yahoo Finance, MarketWatch, Investing.com
Snapshot: AI Rank (Short–Mid–Long): Mixed (Neutral–Bullish–Neutral) · Technical Confluence: Bullish · Key Levels: Support ~22.34 | Resistance ~24.94 · News Sentiment: Neutral
7) Sources
The original source link list is provided below exactly as supplied in the draft.
- Hungary’s Orban won’t take up parliament seat after landslide loss, wants to lead renewal — https://www.scmp.com/news/world/europe/article/3351444/hungarys-orban-wont-take-parliament-seat-after-landslide-loss-wants-lead-renewal?utm_source=rss_feed
- Roommate charged with murder of 2 Bangladeshi PhD students in US — https://www.scmp.com/news/world/united-states-canada/article/3351443/roommate-charged-murder-2-bangladeshi-phd-students-us?utm_source=rss_feed
- Trump cancels envoys’ trip to Pakistan for peace talks — https://www.scmp.com/news/china/diplomacy/article/3351442/trump-cancels-envoys-trip-pakistan-peace-talks?utm_source=rss_feed
- Pope Leo urges worldwide abolition of death penalty — https://www.scmp.com/news/world/europe/article/3351441/pope-leo-urges-worldwide-abolition-death-penalty?utm_source=rss_feed
- Photo of labourer smoking on scaffolding triggers anger after Tai Po blaze — https://www.scmp.com/news/hong-kong/society/article/3351440/photo-labourer-smoking-scaffolding-triggers-anger-after-tai-po-blaze?utm_source=rss_feed
- Palestinians bury pregnant woman and 2 of her children killed in Israeli attacks on Gaza — https://www.scmp.com/news/world/middle-east/article/3351438/palestinians-bury-pregnant-woman-and-2-her-children-killed-israeli-attacks-gaza?utm_source=rss_feed
- Taliban says Afghans stuck in Qatar who helped US in war can safely return home — https://www.scmp.com/news/world/united-states-canada/article/3351436/taliban-says-afghans-stuck-qatar-who-helped-us-war-can-safely-return-home?utm_source=rss_feed
- Will the future world order be determined by who controls low Earth orbit? — https://www.scmp.com/news/china/military/article/3351345/will-future-world-order-be-determined-who-controls-low-earth-orbit?utm_source=rss_feed
You may also like: How KGNAI AI ranks instruments across global markets
Disclaimer: KGNAI provides AI-generated analytics and educational market commentary only. This is not financial advice. Markets involve risk. Always do your own research.