
688039 Hangzhou Arcvideo Technology Co Ltd — 20-May-2026 Technical Strength vs Rank Dispersion (Neutral-to-Bearish Bias Mid-Term)
Hangzhou Arcvideo Technology Co Ltd (688039) shows a notable split between near-term technical posture and slower-moving rank horizons as of 20-May-2026. The short window is comparatively constructive—Daily rank #220 out of 1292 sits in the upper portion of the universe—while Weekly rank #919 and Monthly rank #1262 point to weaker cross-sectional positioning at broader horizons. Technically, the dashboard is tilted positive with a Bullish 18-signal confluence score of 0.722 and a Bullish overall technical score of 0.751, supported by momentum readings including RSI(14) at 73.01 and a positive MACD histogram of 0.5571. However, price action still needs to prove persistence around the key decision levels: support near 39.6150 and resistance near 45.9400. News sentiment remains close to flat (avg -0.012), limiting the informational edge from headlines and keeping focus on confirmation via price/volume behavior.
Key Takeaways
- Rank stance: Short-term Bullish (Daily #220/1292); mid-term Bearish (Monthly #1262/1292); longer horizons Neutral (3M #1028, 6M #1014).
- Technical confluence: Bullish (Overall technical score 0.751; DRL technical rank #118/1292).
- Key levels: Support ~ 39.6150; Resistance ~ 45.9400.
- News sentiment bias: Neutral (avg -0.012; 12% positive / 75% neutral / 12% negative).
- Confirmation / invalidation: Strength is better supported on a break above 45.9400 with volume; a close below 39.6150 increases deterioration risk.
What KGNAI Measures
KGNAI evaluates assets using large cross-sectional datasets built from millions of structured data points. Inputs incorporate fundamental metrics, technical structures, and systematically processed news sentiment. Statistical models, machine learning, and AI frameworks are used to assess relative positioning, signal alignment, and probabilistic behavior across broad universes.
How to Read This Report
- Ranks are comparative across the tracked universe, not absolute price targets.
- Confluence reflects alignment among independent signal groups.
- Support/resistance levels are probabilistic decision zones, not guarantees.
- Sentiment provides contextual bias within the broader analytical framework.
1) KGNAI AI Analysis
Region: CHINA
Total universe size: 1292 ranked instruments
- Daily rank: #220 out of 1292 — Bullish
- Weekly rank: #919 out of 1292 — Neutral
- Monthly rank: #1262 out of 1292 — Bearish
- 3-Monthly rank: #1028 out of 1292 — Neutral
- 6-Monthly rank: #1014 out of 1292 — Neutral
- Yearly rank: Not available for this horizon — Not available
The rank stack for 688039 is best read as time-horizon dispersion rather than a single-direction message. The Daily rank (#220) places the name in the stronger slice of the 1292-instrument universe, consistent with short-horizon momentum and participation signals appearing supportive. In contrast, the Monthly rank (#1262) is near the tail of the distribution, implying that longer-window behavior has not yet re-priced into a consistently favorable regime relative to peers.
Weekly (#919), 3-Monthly (#1028), and 6-Monthly (#1014) remain Neutral, which often corresponds to a market still deciding whether recent strength is a durable transition or a counter-trend stretch. This matters because technical readings can improve quickly while cross-sectional rank—by design—can lag if the broader universe is also improving or if prior drawdown/volatility is still being “remembered” in the longer windows.
The stated term view formalizes this split: Short-term Neutral, Mid-term Bearish, Long-term Neutral. With the Yearly rank not available in the provided data, the analysis is anchored to the available horizons. Practically, the setup argues for discipline around confirmation conditions rather than extrapolating the daily improvement into a multi-month conclusion.
2) Price & trend overview
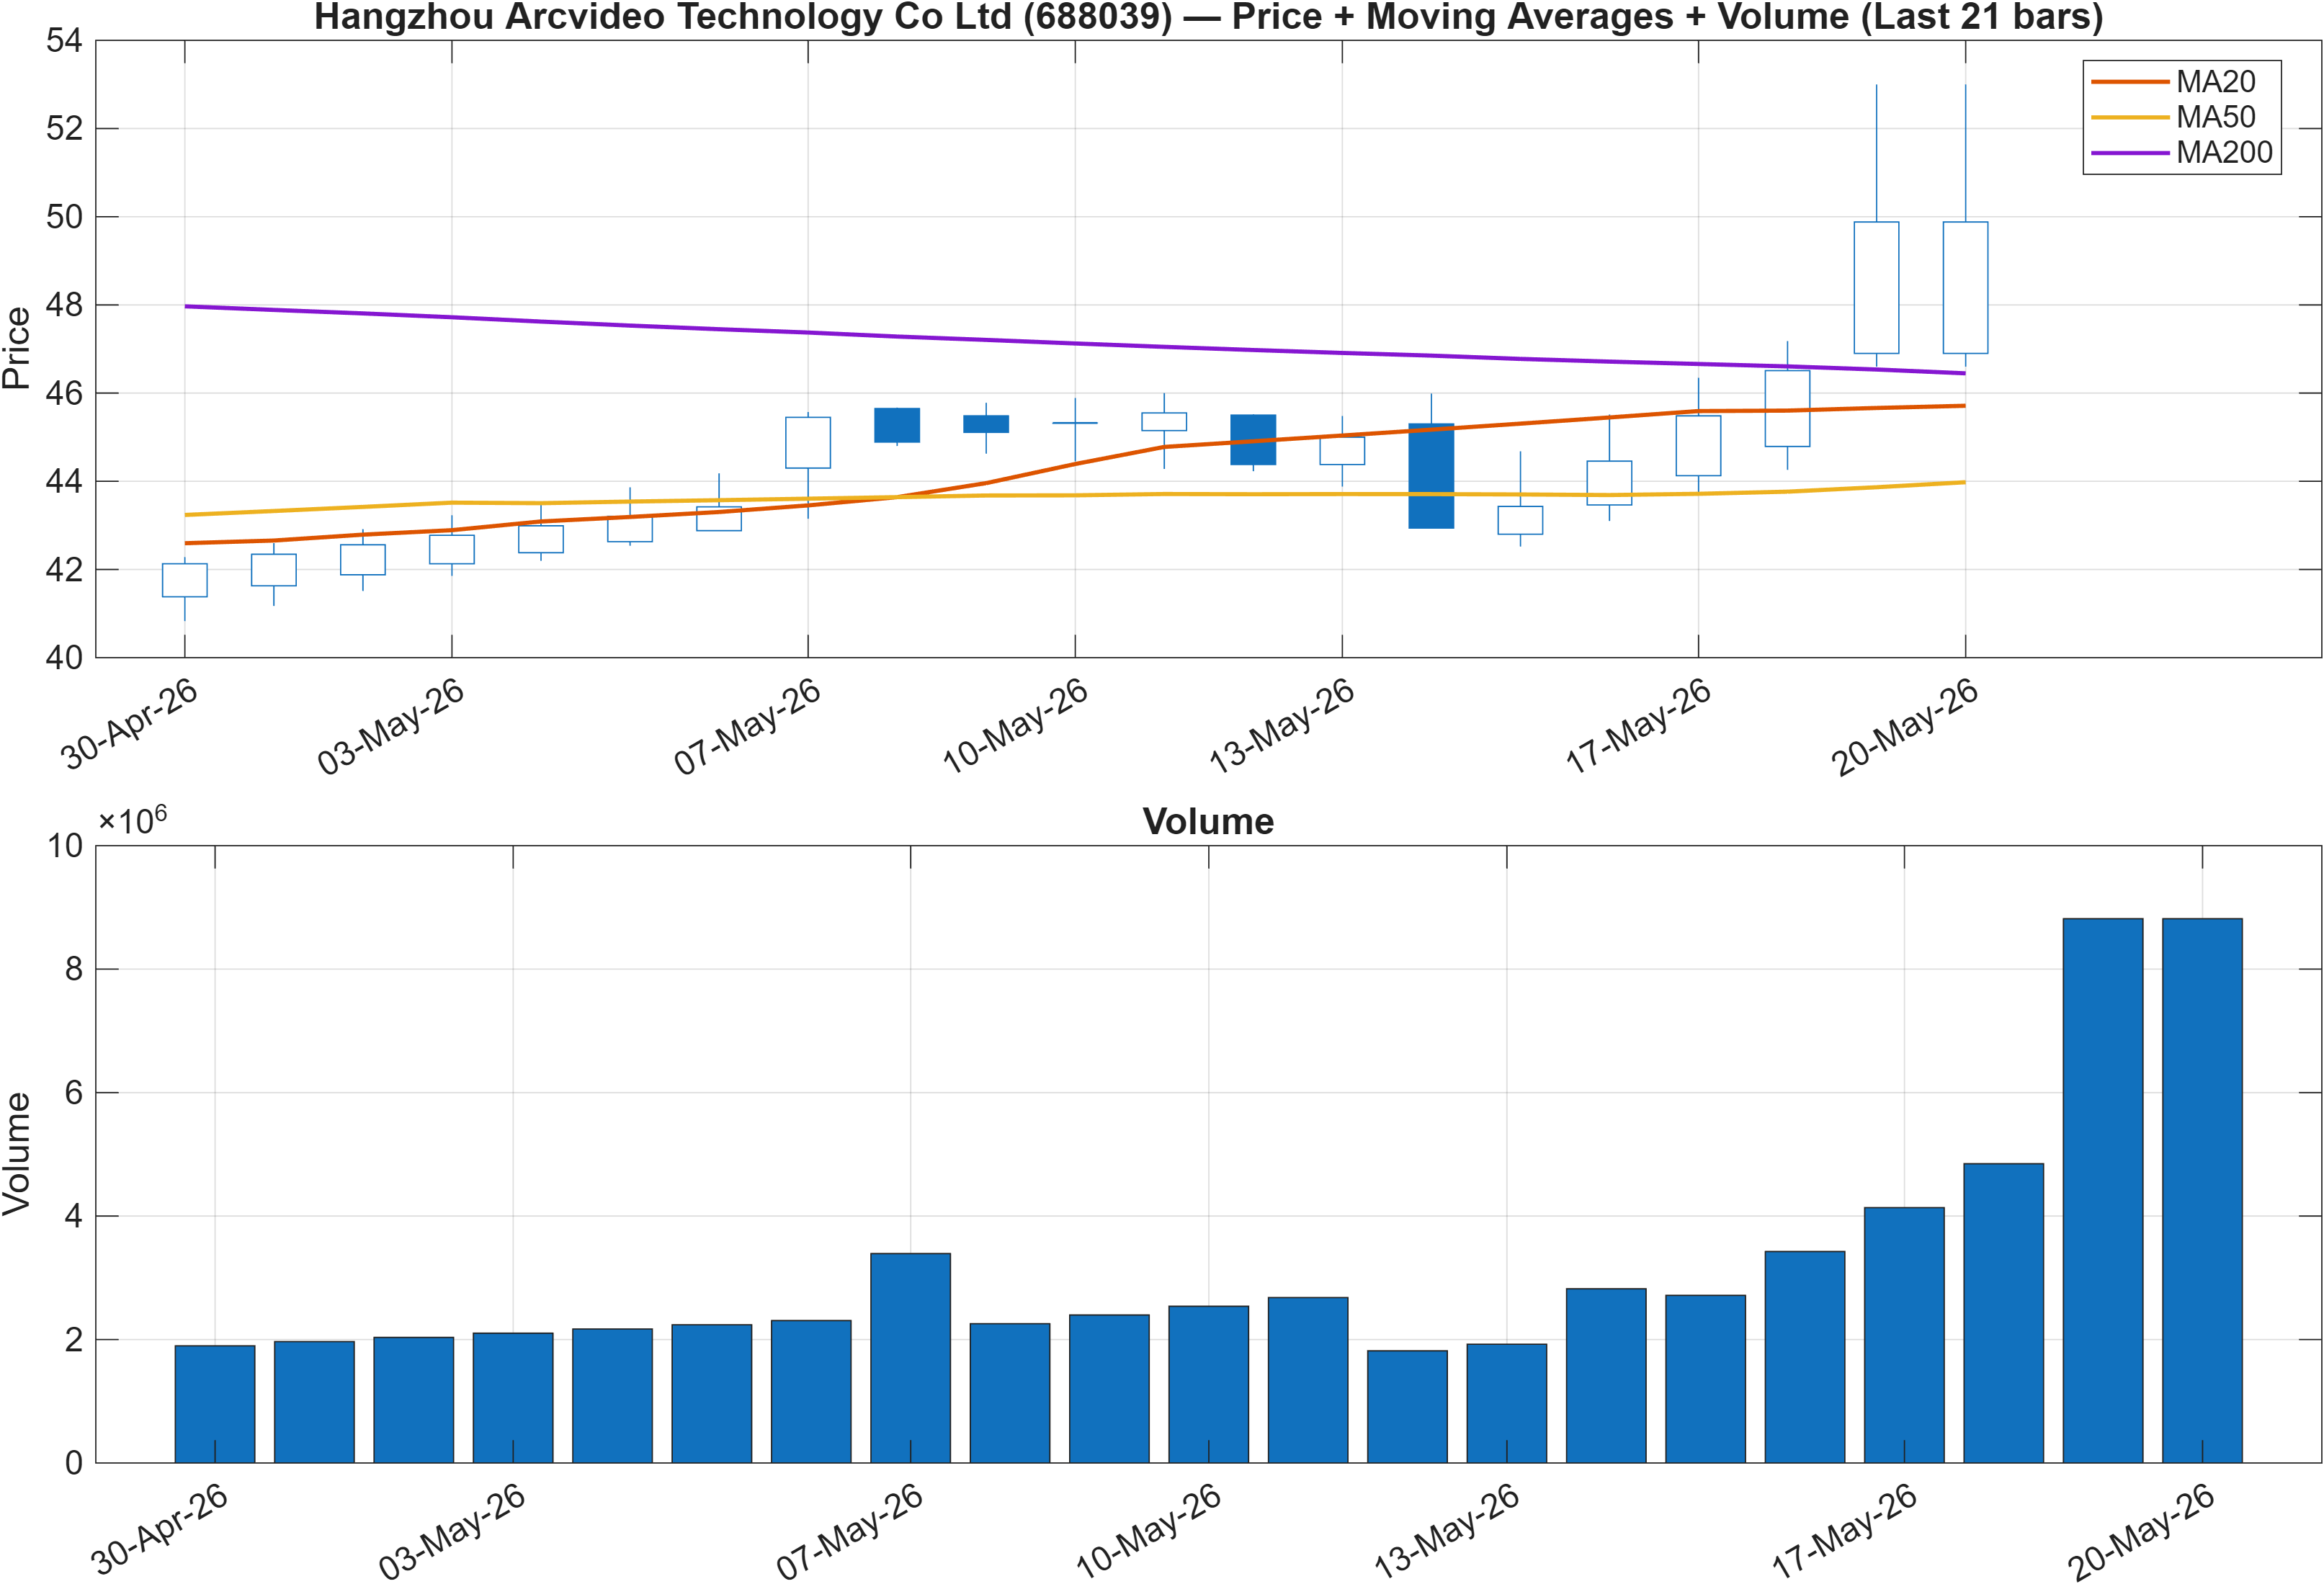
Interpretation: Close vs MA50 = Bullish, MA50 vs MA200 = Bearish.
Trend structure: strength in the front window, friction in the backdrop
The moving-average configuration highlights a mixed trend regime. The close sitting above the MA50 is categorized as Bullish, which typically aligns with positive short-horizon drift and supports the comparatively strong Daily rank (#220). At the same time, MA50 vs MA200 remains Bearish—often associated with a longer-window trend that has not fully repaired—consistent with the weaker Monthly rank (#1262).
This combination can be interpreted as a market in transition rather than resolution: the shorter trend layer is improving, but the longer layer still constrains how aggressively the broader universe (and systematic allocators) might reclassify the asset. When this occurs, the highest-quality confirmations tend to come from: (1) continued ability to hold above near-term trend measures, and (2) a push toward key upside zones such as resistance at 45.9400 without immediate mean reversion.
Volume behavior is referenced as a cross-validation input in the KGNAI framework, and later signals reinforce that participation has recently been supportive (e.g., Vol ROC(20) at 348.4 and OBV slope(10) at 2.391e+07 in the technical dashboard). Taken together, the trend read is constructive tactically but still dependent on follow-through to reduce the longer-horizon bearish overhang indicated by MA50 vs MA200 and the mid-term rank profile.
3) Momentum & volatility dashboard
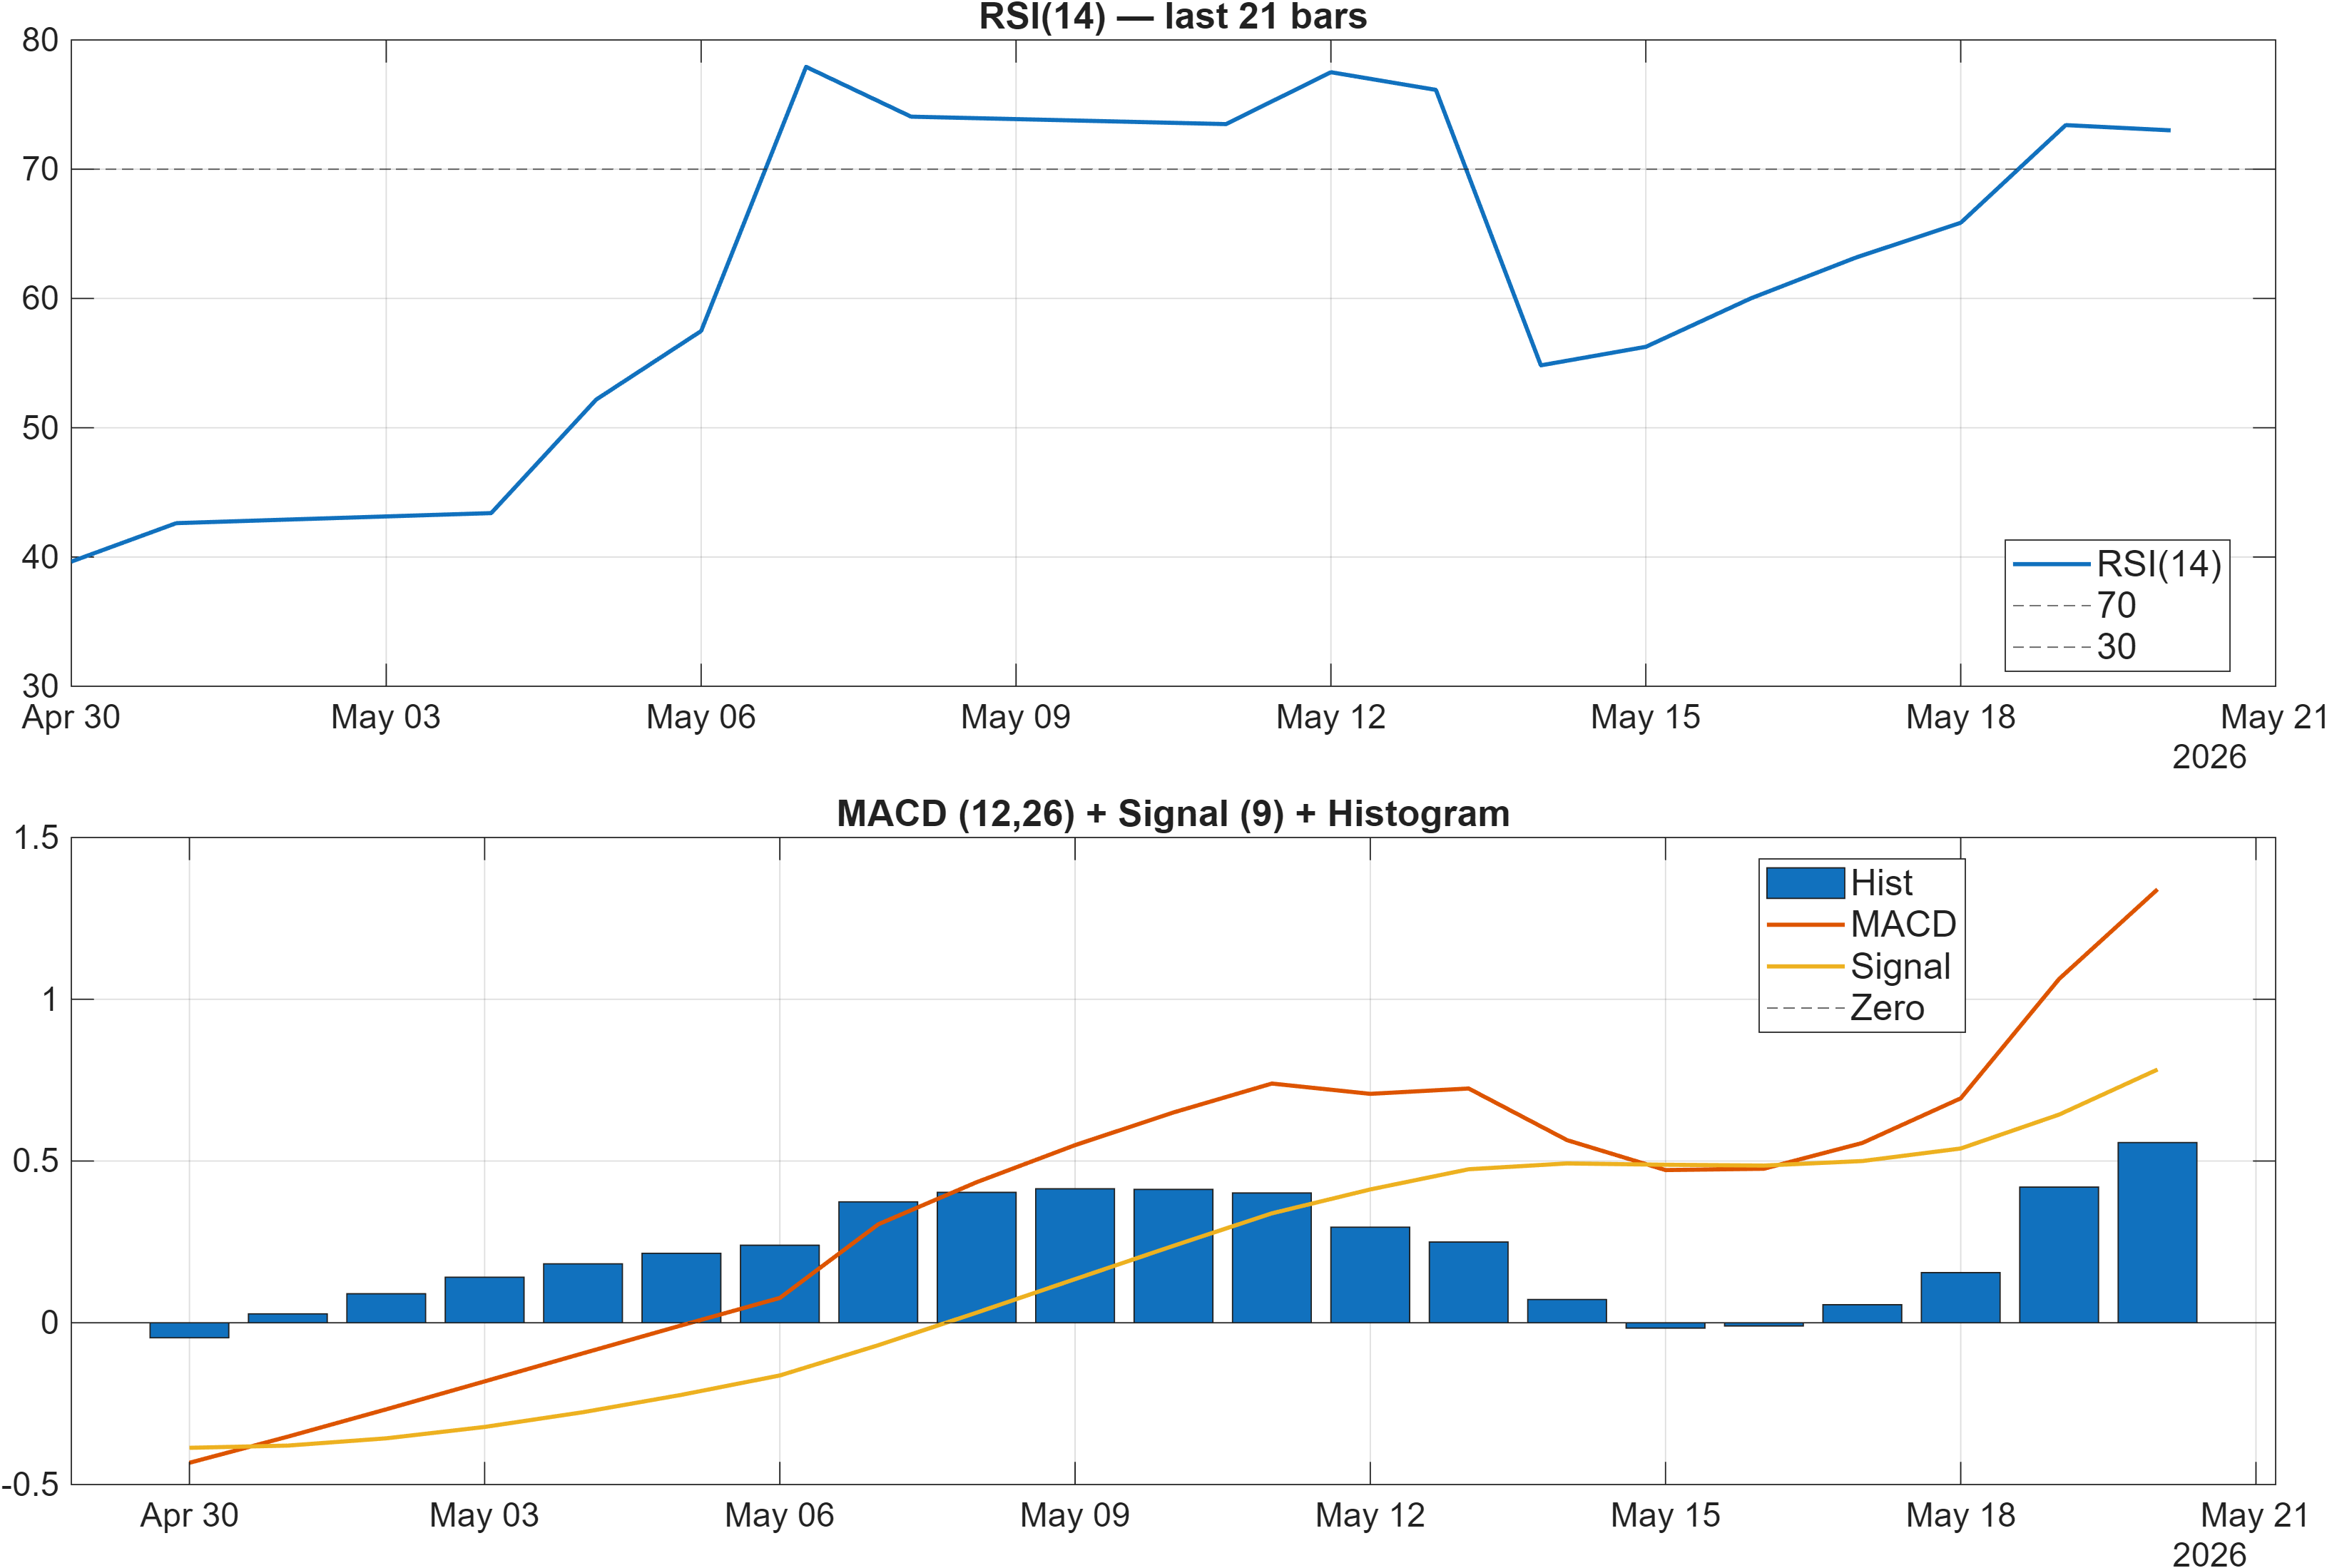
Interpretation: RSI bias = Bullish, MACD hist = 0.5571.
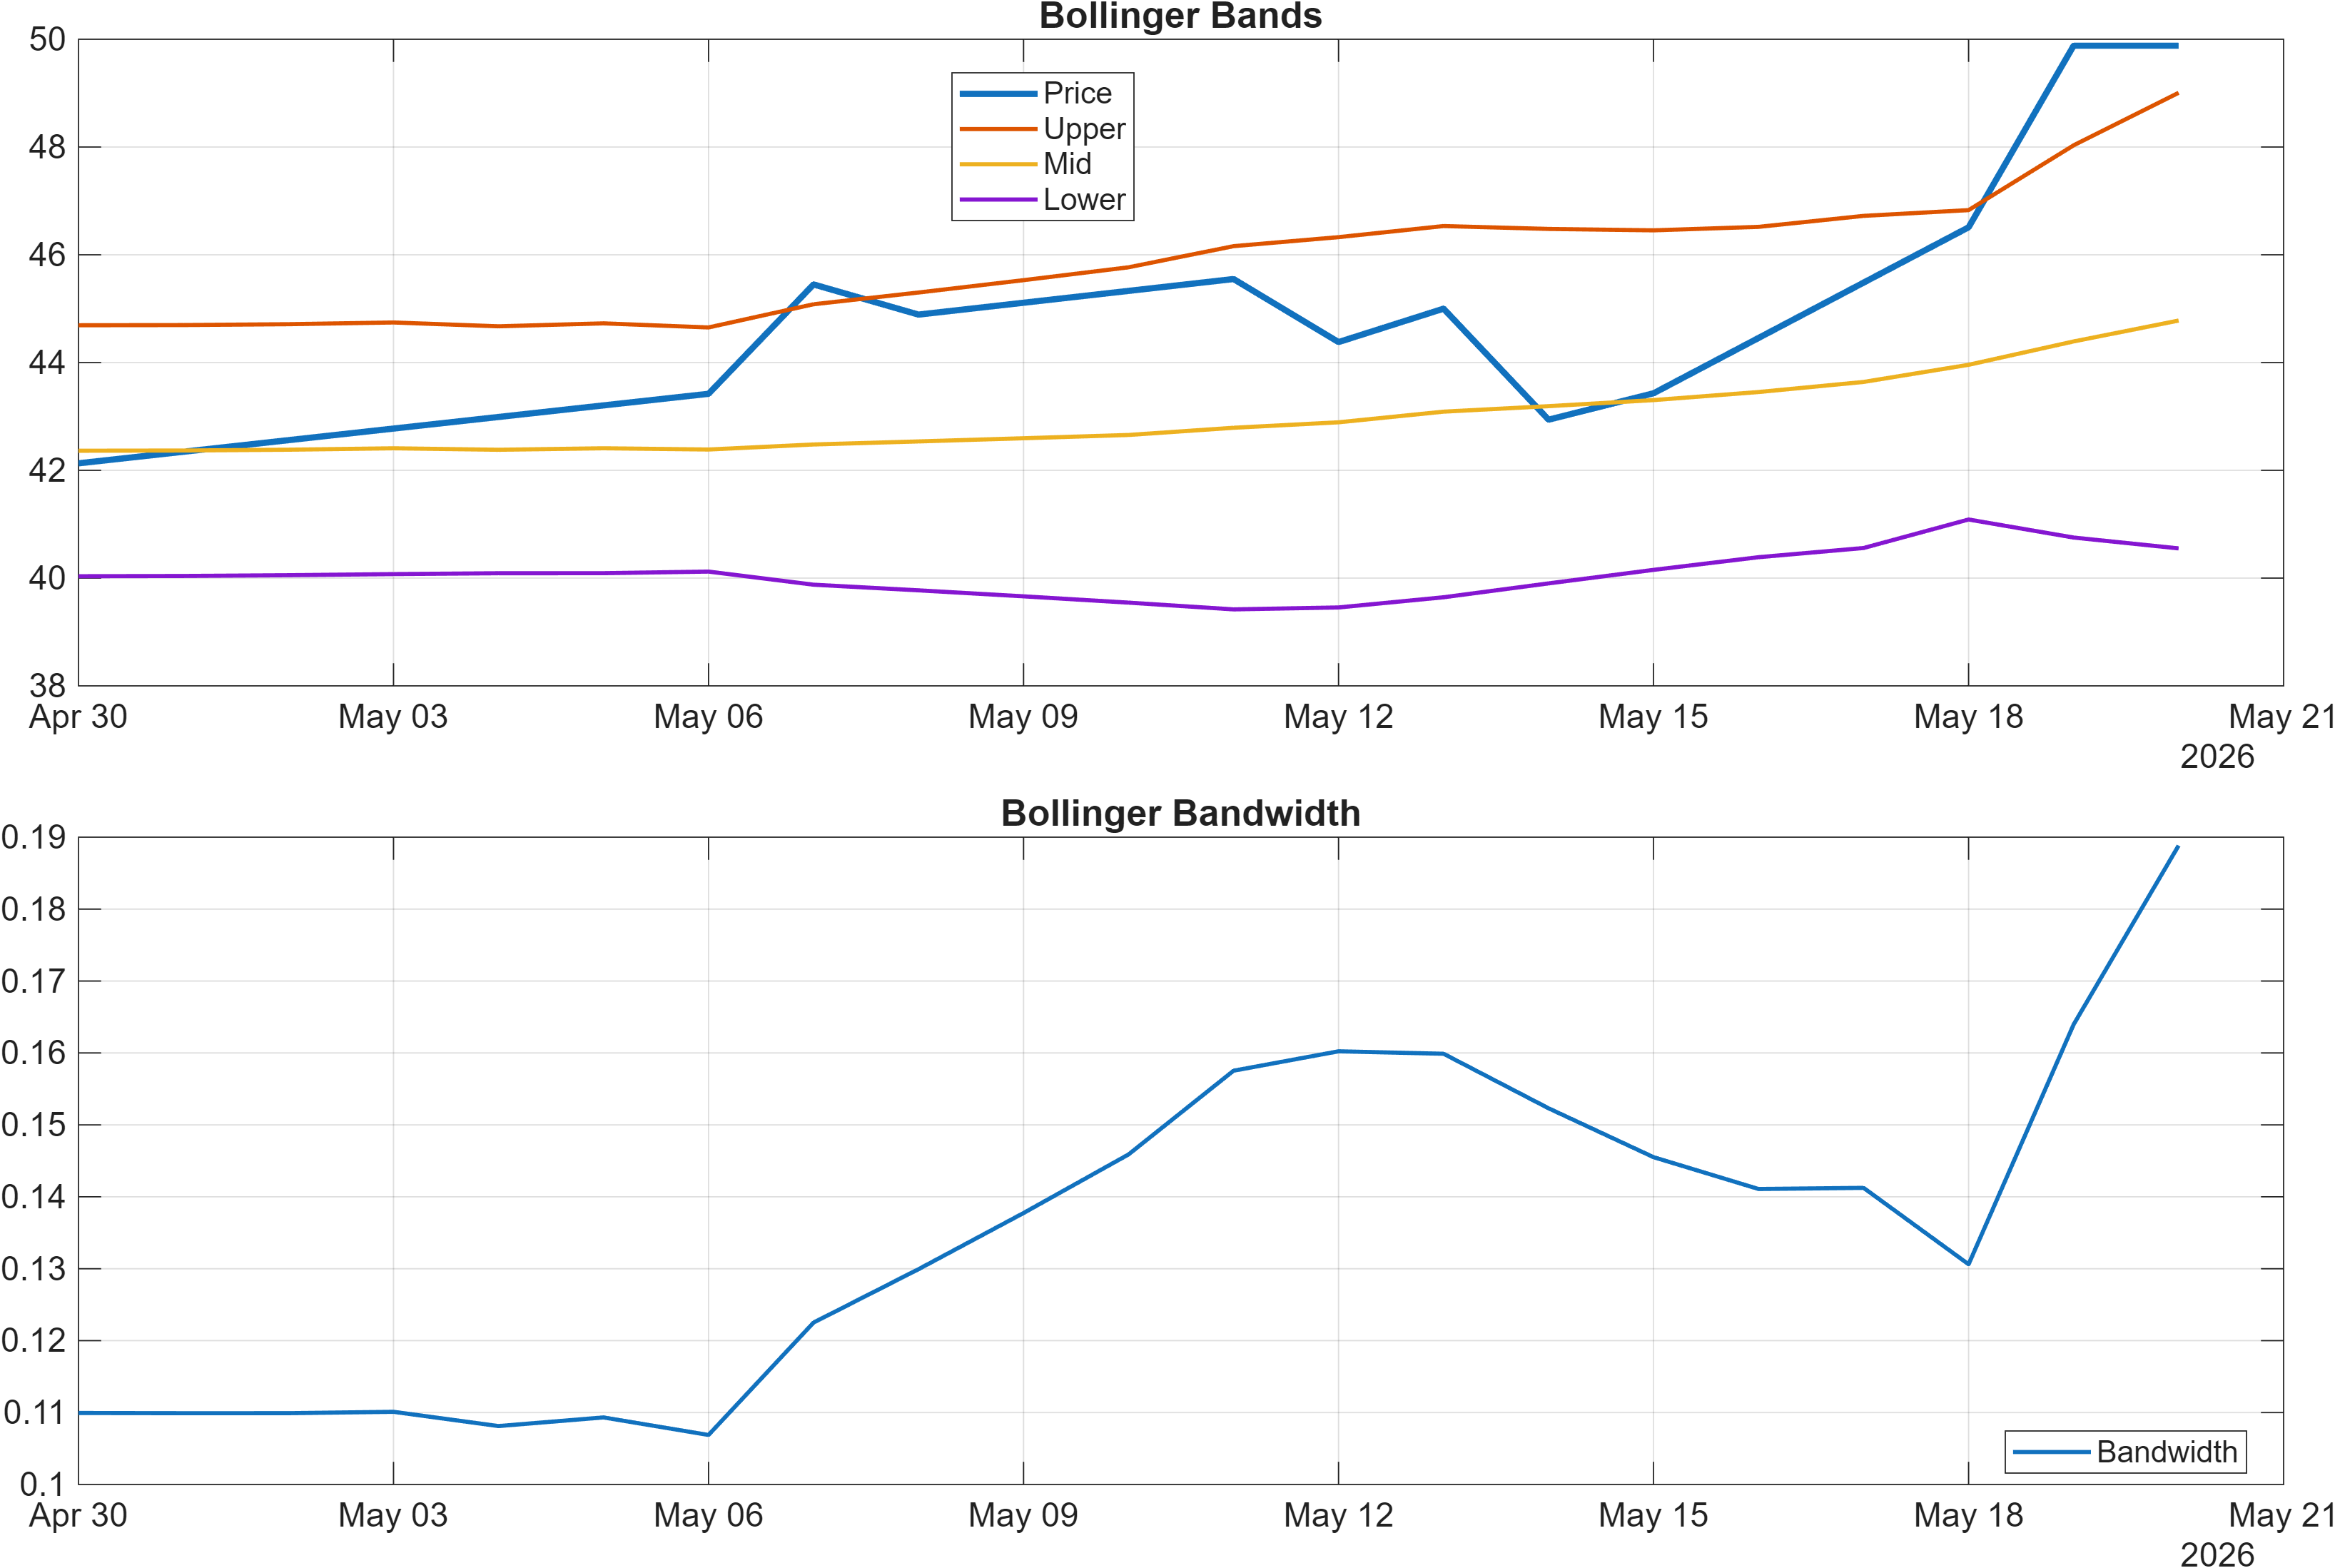
Interpretation: Bandwidth (volatility regime) latest = 0.1888.
Momentum: supportive impulse, but watch for compression-to-expansion behavior
Momentum readings lean constructive. RSI(14) is 73.01 (Bullish), which signals strong upside pressure, while the MACD histogram is positive at 0.5571. In combination, these readings usually correspond to a market that has recently accelerated and is still carrying positive impulse—matching the strong short-term relative rank (#220) and the Bullish technical scoring later in the report.
The main analytical risk in this configuration is not that momentum is absent, but that it may become over-extended without translating into sustained trend repair at the longer horizon. This is where volatility regime helps frame expectations: Bollinger Bandwidth at 0.1888 suggests a defined volatility state that can either remain orderly (supporting grinding continuation) or begin expanding (raising the likelihood of wider swings around key levels).
A second check comes from oscillator balance: Stoch %K at 70.23 is Neutral, indicating that while RSI is elevated, not all short-cycle oscillators are simultaneously “maxed.” That blend often points to a market that still has room to oscillate without immediately forcing a reversal, but it also emphasizes the importance of price acceptance above nearby resistance rather than relying purely on indicator strength.
4) Support / Resistance zones
Support ~ 39.6150 | Resistance ~ 45.9400
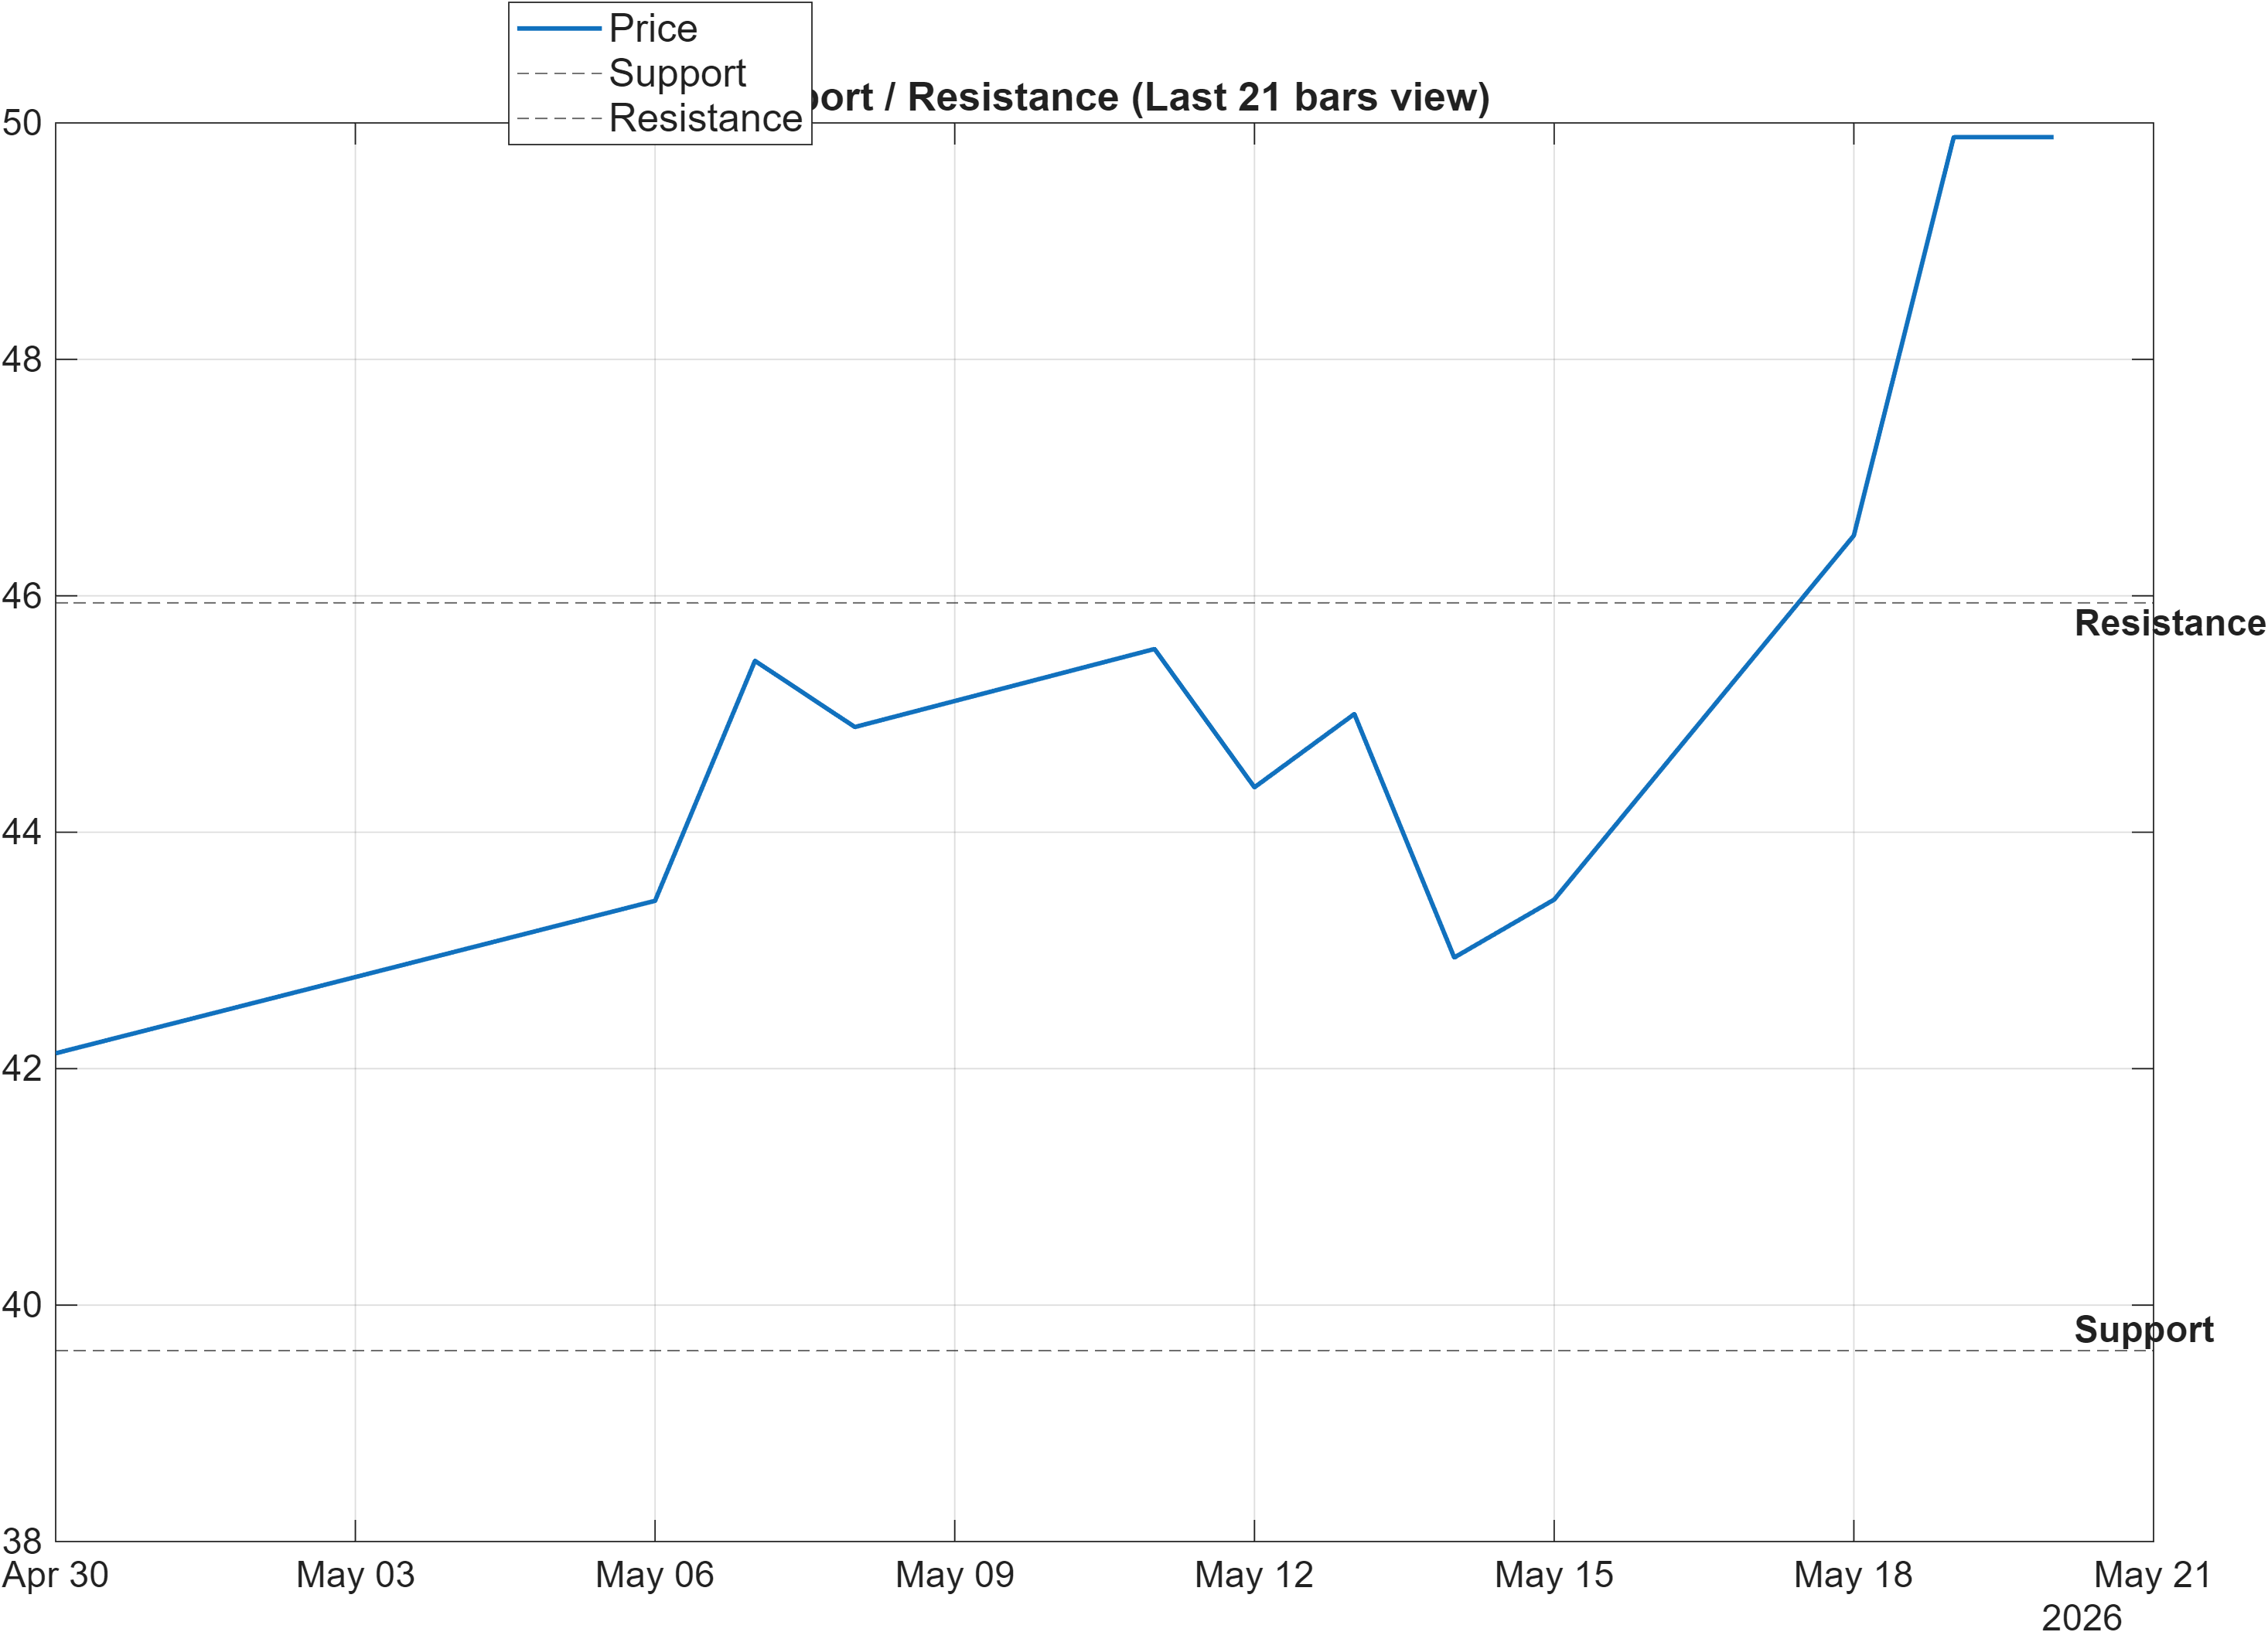
Scenario view: Break above resistance with volume → continuation. Close below support → signal deterioration risk.
Decision zones: where the rank-vs-technical conflict gets resolved
The current setup concentrates around two probabilistic decision zones: 39.6150 as support and 45.9400 as resistance. With technical indicators broadly positive (e.g., MACD histogram 0.5571, RSI(14) 73.01), the critical question becomes whether price can convert strength into acceptance above resistance, which would better align the short-horizon technical tone with the weaker mid-term rank posture (Monthly #1262).
From a market-structure perspective, resistance at 45.9400 is the level that often attracts both profit-taking and systematic supply. A clean break is typically defined not just by an intraday move but by follow-through consistent with the scenario guidance: break above resistance with volume. Participation gauges in the signal set (e.g., Vol ROC(20) 348.4 and ADOSC 73.28) provide supportive context, but price still needs to hold the level to reduce false-break risk.
On the downside, a close below 39.6150 would degrade the constructive momentum narrative and would likely reinforce the mid-term bearish rank message. Given BB Width at 0.1888, a volatility pickup around these boundaries is plausible; treating the zones as decision points—rather than precise turning points—matches how KGNAI frames confirmation and invalidation.
5) Quant Technical Dashboard (18 Signals)
KGNAI AI Technical Analysis Score (Deep Reinforcement Learning): Rank #118 out of 1292 (Rank 1 represents the strongest technical positioning and a higher probability of favorable price behavior. As ranks increase toward the maximum, the probability of favorable outcomes weakens and bearish positioning becomes more dominant.) | Label: Bullish | Score: 0.817
18-Signal Technical Confluence Score: 0.722 (Bullish)
Overall Technical Score (18-signal confluence + DRL rank blend): 0.751 (Bullish)
Note: The blended score reflects signal strength weighted against broader AI technical ranking, which may temporarily diverge.
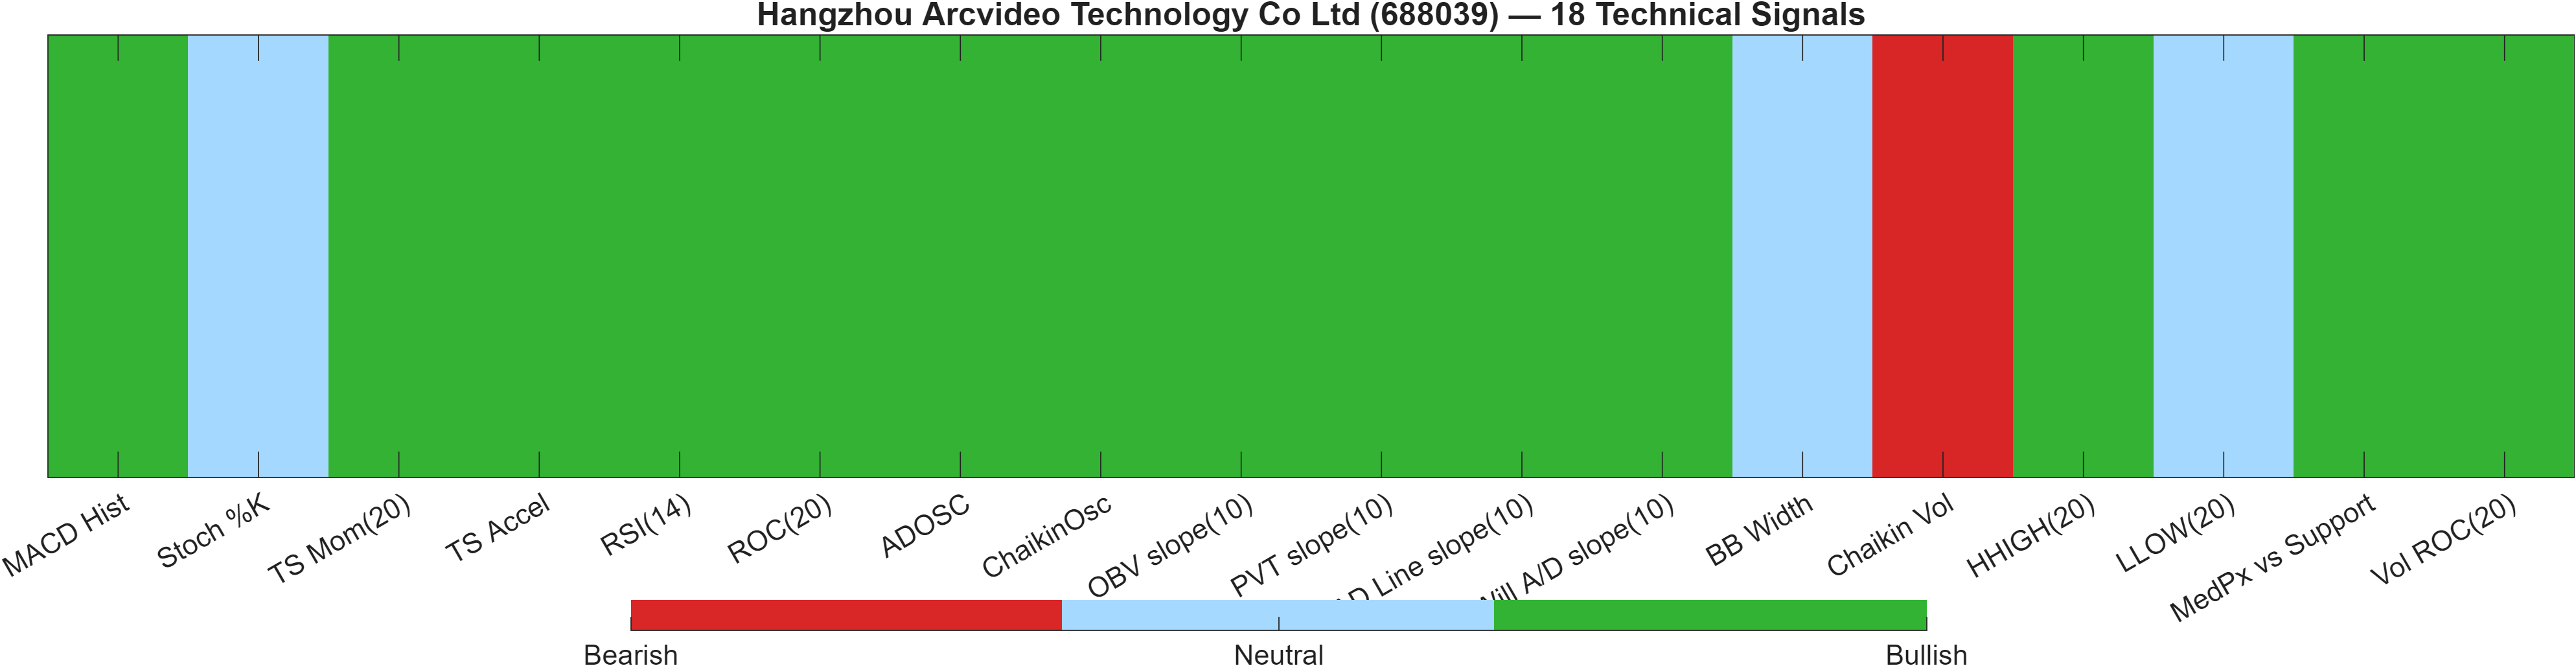
Blended technical score breakdown: 0.751 (Bullish | Bull 14 / Bear 1 / Neutral 3)
Confluence read: broad participation with a single volatility caution
The technical layer is internally consistent: DRL technical rank #118 out of 1292 is firmly strong relative positioning, and the blended framework remains Bullish with an overall technical score of 0.751. Importantly, the confluence breadth is high—Bull 14 / Bear 1 / Neutral 3—which reduces the likelihood that the signal is being driven by a single factor.
Several components describe momentum plus confirmation from participation. Beyond RSI(14) at 73.01 and ROC(20) at 17.79, volume/flow proxies tilt supportive (e.g., OBV slope(10) 2.391e+07 and AD Line slope(10) 2.351e+06). That alignment typically strengthens the credibility of trend continuation attempts toward resistance at 45.9400.
The primary caution inside the 18-signal set is that the only Bearish reading is Chaikin Vol at 144.2, while BB Width at 0.1888 is Neutral. Together, this can be interpreted as a potential shift in how volatility is being expressed: price may be advancing, but the volatility/volume relationship merits monitoring for instability. In this context, the technical stack is constructive, but the rank dispersion (Daily #220 vs Monthly #1262) argues for treating follow-through above resistance as the higher-quality validation.
Signal table (Bull/Bear/Neutral)
| Indicator | Value | Signal |
|---|---|---|
| MACD Hist | 0.5571 | Bullish |
| Stoch %K | 70.23 | Neutral |
| TS Mom(20) | 7.535 | Bullish |
| TS Accel | 7.447 | Bullish |
| RSI(14) | 73.01 | Bullish |
| ROC(20) | 17.79 | Bullish |
| ADOSC | 73.28 | Bullish |
| ChaikinOsc | 1.472e+06 | Bullish |
| OBV slope(10) | 2.391e+07 | Bullish |
| PVT slope(10) | 8.198e+05 | Bullish |
| AD Line slope(10) | 2.351e+06 | Bullish |
| Will A/D slope(10) | 7.86 | Bullish |
| BB Width | 0.1888 | Neutral |
| Chaikin Vol | 144.2 | Bearish |
| HHIGH(20) | 53 | Bullish |
| LLOW(20) | 41.17 | Neutral |
| MedPx vs Support | 10.19 | Bullish |
| Vol ROC(20) | 348.4 | Bullish |
Interpretation: Indicator-level signals form the base confluence, which is then adjusted using a separate AI-driven technical ranking model. The final technical score summarizes this combined view.
6) News sentiment + extractive gist
Note: Instrument-specific news matches were not found, so the digest includes broader market/sector headlines. Links are provided for verification.
Sentiment score (avg): -0.012 | Positive: 12% | Neutral: 75% | Negative: 12%
KGNAI AI News Sentiment Score (normalized -1 to +1): Not available (as of —) | Label: Not available | Overall news score: -0.01
Positive Developments
Recent coverage across major financial outlets indicates a modestly constructive tone in pockets of consumer and policy-related narratives, but with limited direct linkage to 688039 in the provided data. The aggregate mix shows 12% positive items alongside a much larger neutral share, suggesting upbeat stories are present yet not dominant drivers of incremental positioning. In that environment, market participants typically treat supportive headlines as context rather than a primary catalyst, placing more weight on whether price can validate the technically constructive posture (overall technical score 0.751) through acceptance above 45.9400. With sentiment close to flat (avg -0.012), any constructive narrative tailwind is more likely to act as a secondary reinforcement when aligned with price/volume continuation rather than acting independently.
Neutral / Mixed Developments
The dominant signal is neutrality: 75% of the sentiment classification is neutral, and the overall news score sits near zero (-0.01). This profile tends to coincide with headline saturation without direction, where information flow is active but not clearly market-moving for the instrument. Because instrument-specific matches were not found, the digest functions primarily as a macro/sector backdrop; as a result, the analytical emphasis re-centers on internal market data—particularly the split between a strong Daily rank (#220) and weak Monthly rank (#1262). When news is mixed and non-specific, technical decision points (support 39.6150, resistance 45.9400) often become the practical anchors for managing confirmation versus invalidation.
Negative / Risk Signals
The negative share is also 12%, matching the positive bucket and reinforcing the interpretation of a largely balanced headline environment. In practice, a flat-to-slightly-negative average (-0.012) can still matter if price action becomes vulnerable—particularly if the market fails to hold above support at 39.6150, where the report flags deterioration risk. With the KGNAI AI News Sentiment Score not available, the framework cannot apply a normalized news factor to strengthen conviction; that absence increases reliance on technical and rank alignment. The key risk is a scenario where momentum indicators (e.g., RSI(14) 73.01) fade while broader ranks remain weak, creating a sentiment-neutral environment that does not counterbalance technical mean reversion.
What to monitor next:
- Whether price can sustain acceptance above 45.9400 alongside supportive participation signals.
- Any shift in the sentiment mix away from 75% neutral toward a more directional skew.
- Behavior around 39.6150 if volatility expands from the current BB Width reading (0.1888).
Sources referenced: Reuters, Bloomberg, Yahoo Finance, MarketWatch, Investing.com
7) Sources
The source list in the draft contained multiple external links. Per publication formatting, URLs are omitted here, and the article relies on aggregated themes rather than outlet-specific attribution.
You may also like: How KGNAI AI ranks instruments across global markets
Disclaimer: KGNAI provides AI-generated analytics and educational market commentary only. This is not financial advice. Markets involve risk. Always do your own research.