
601512 — China-Singapore Suzhou Industrial Park Development Group Co Ltd (13-May-2026) | Bearish ranks persist with neutral technical confluence
China-Singapore Suzhou Industrial Park Development Group Co Ltd (601512) screens as structurally weak on KGNAI’s cross-sectional ranks as of 13-May-2026, with short- and mid-horizon standings clustered deep in the lower tail of the 1292-instrument China universe. That said, the technical layer is not uniformly bearish: the blended technical read is Neutral, reflecting a mix of downside momentum (e.g., RSI(14) at 37.06 and MACD histogram -0.0658) alongside pockets of stabilization signals (e.g., Stoch %K 6.25 and several volume/flow slopes flagged bullish in the 18-signal set). Volatility conditions appear contained rather than expanding, with Bollinger Bandwidth 0.0882, which can delay trend resolution until price tests key structural levels. From a decision-zone perspective, support ~8.5533 and resistance ~11.0217 frame the near-term risk boundaries, while news sentiment reads neutral (instrument-specific matches not found in the provided data).
- Rank stance: Short Bearish | Mid Bearish | Long Neutral
- Technical confluence: Neutral (18-signal score -0.167; blended overall -0.077)
- Key levels: Support 8.5533 | Resistance 11.0217
- News sentiment bias: Neutral (avg 0.000; 100% neutral in the provided sample)
- Confirmation / invalidation: A close below 8.5533 would increase deterioration risk; a break above 11.0217 with volume would improve the continuation case.
KGNAI evaluates assets using large cross-sectional datasets built from millions of structured data points. Inputs incorporate fundamental metrics, technical structures, and systematically processed news sentiment. Statistical models, machine learning, and AI frameworks are used to assess relative positioning, signal alignment, and probabilistic behavior across broad universes.
- Ranks are comparative across the tracked universe, not absolute price targets.
- Confluence reflects alignment among independent signal groups.
- Support/resistance levels are probabilistic decision zones, not guarantees.
- Sentiment provides contextual bias within the broader analytical framework.
1) KGNAI AI Analysis
Region: CHINA | Total universe size: 1292 ranked instruments
- Daily rank: #1271 out of 1292 — Bearish
- Weekly rank: #1055 out of 1292 — Bearish
- Monthly rank: #1226 out of 1292 — Bearish
- 3-Monthly rank: #1021 out of 1292 — Neutral
- 6-Monthly rank: #1011 out of 1292 — Neutral
- Yearly rank: Not available for this horizon — Not available
The cross-sectional profile is the dominant feature: daily #1271 and monthly #1226 (out of 1292) both sit in the extreme weak tail of the tracked universe, while weekly #1055 remains firmly below median. This distribution suggests that the recent weakness is not confined to a single window; rather, it is reflected across multiple short-to-mid horizons, which typically reduces the probability that the signal is a one-off anomaly.
Longer horizons soften from outright bearish to Neutral at 3-month #1021 and 6-month #1011. That step-up (from bearish to neutral) can be read as early stabilization in longer-window behavior, but not yet a broad reversal: both ranks are still in the lower portion of the 1292-name distribution, implying the asset has not re-entered stronger relative leadership.
The key analytical tension is therefore persistence vs. transition: short-term ranks remain heavily bearish, while longer-window ranks are neutral but still weak. A durable regime change would normally be accompanied by continued improvement across adjacent horizons (e.g., weekly and monthly) rather than isolated neutrality at 3–6 months. Yearly rank: Not available in the provided data.
Term view: Short-term: Bearish. Mid-term: Bearish. Long-term: Neutral.
Want the full universe and complete rank tables? Unlock full access on KGNAI: https://www.kgnai.com/pricing
2) Price & trend overview
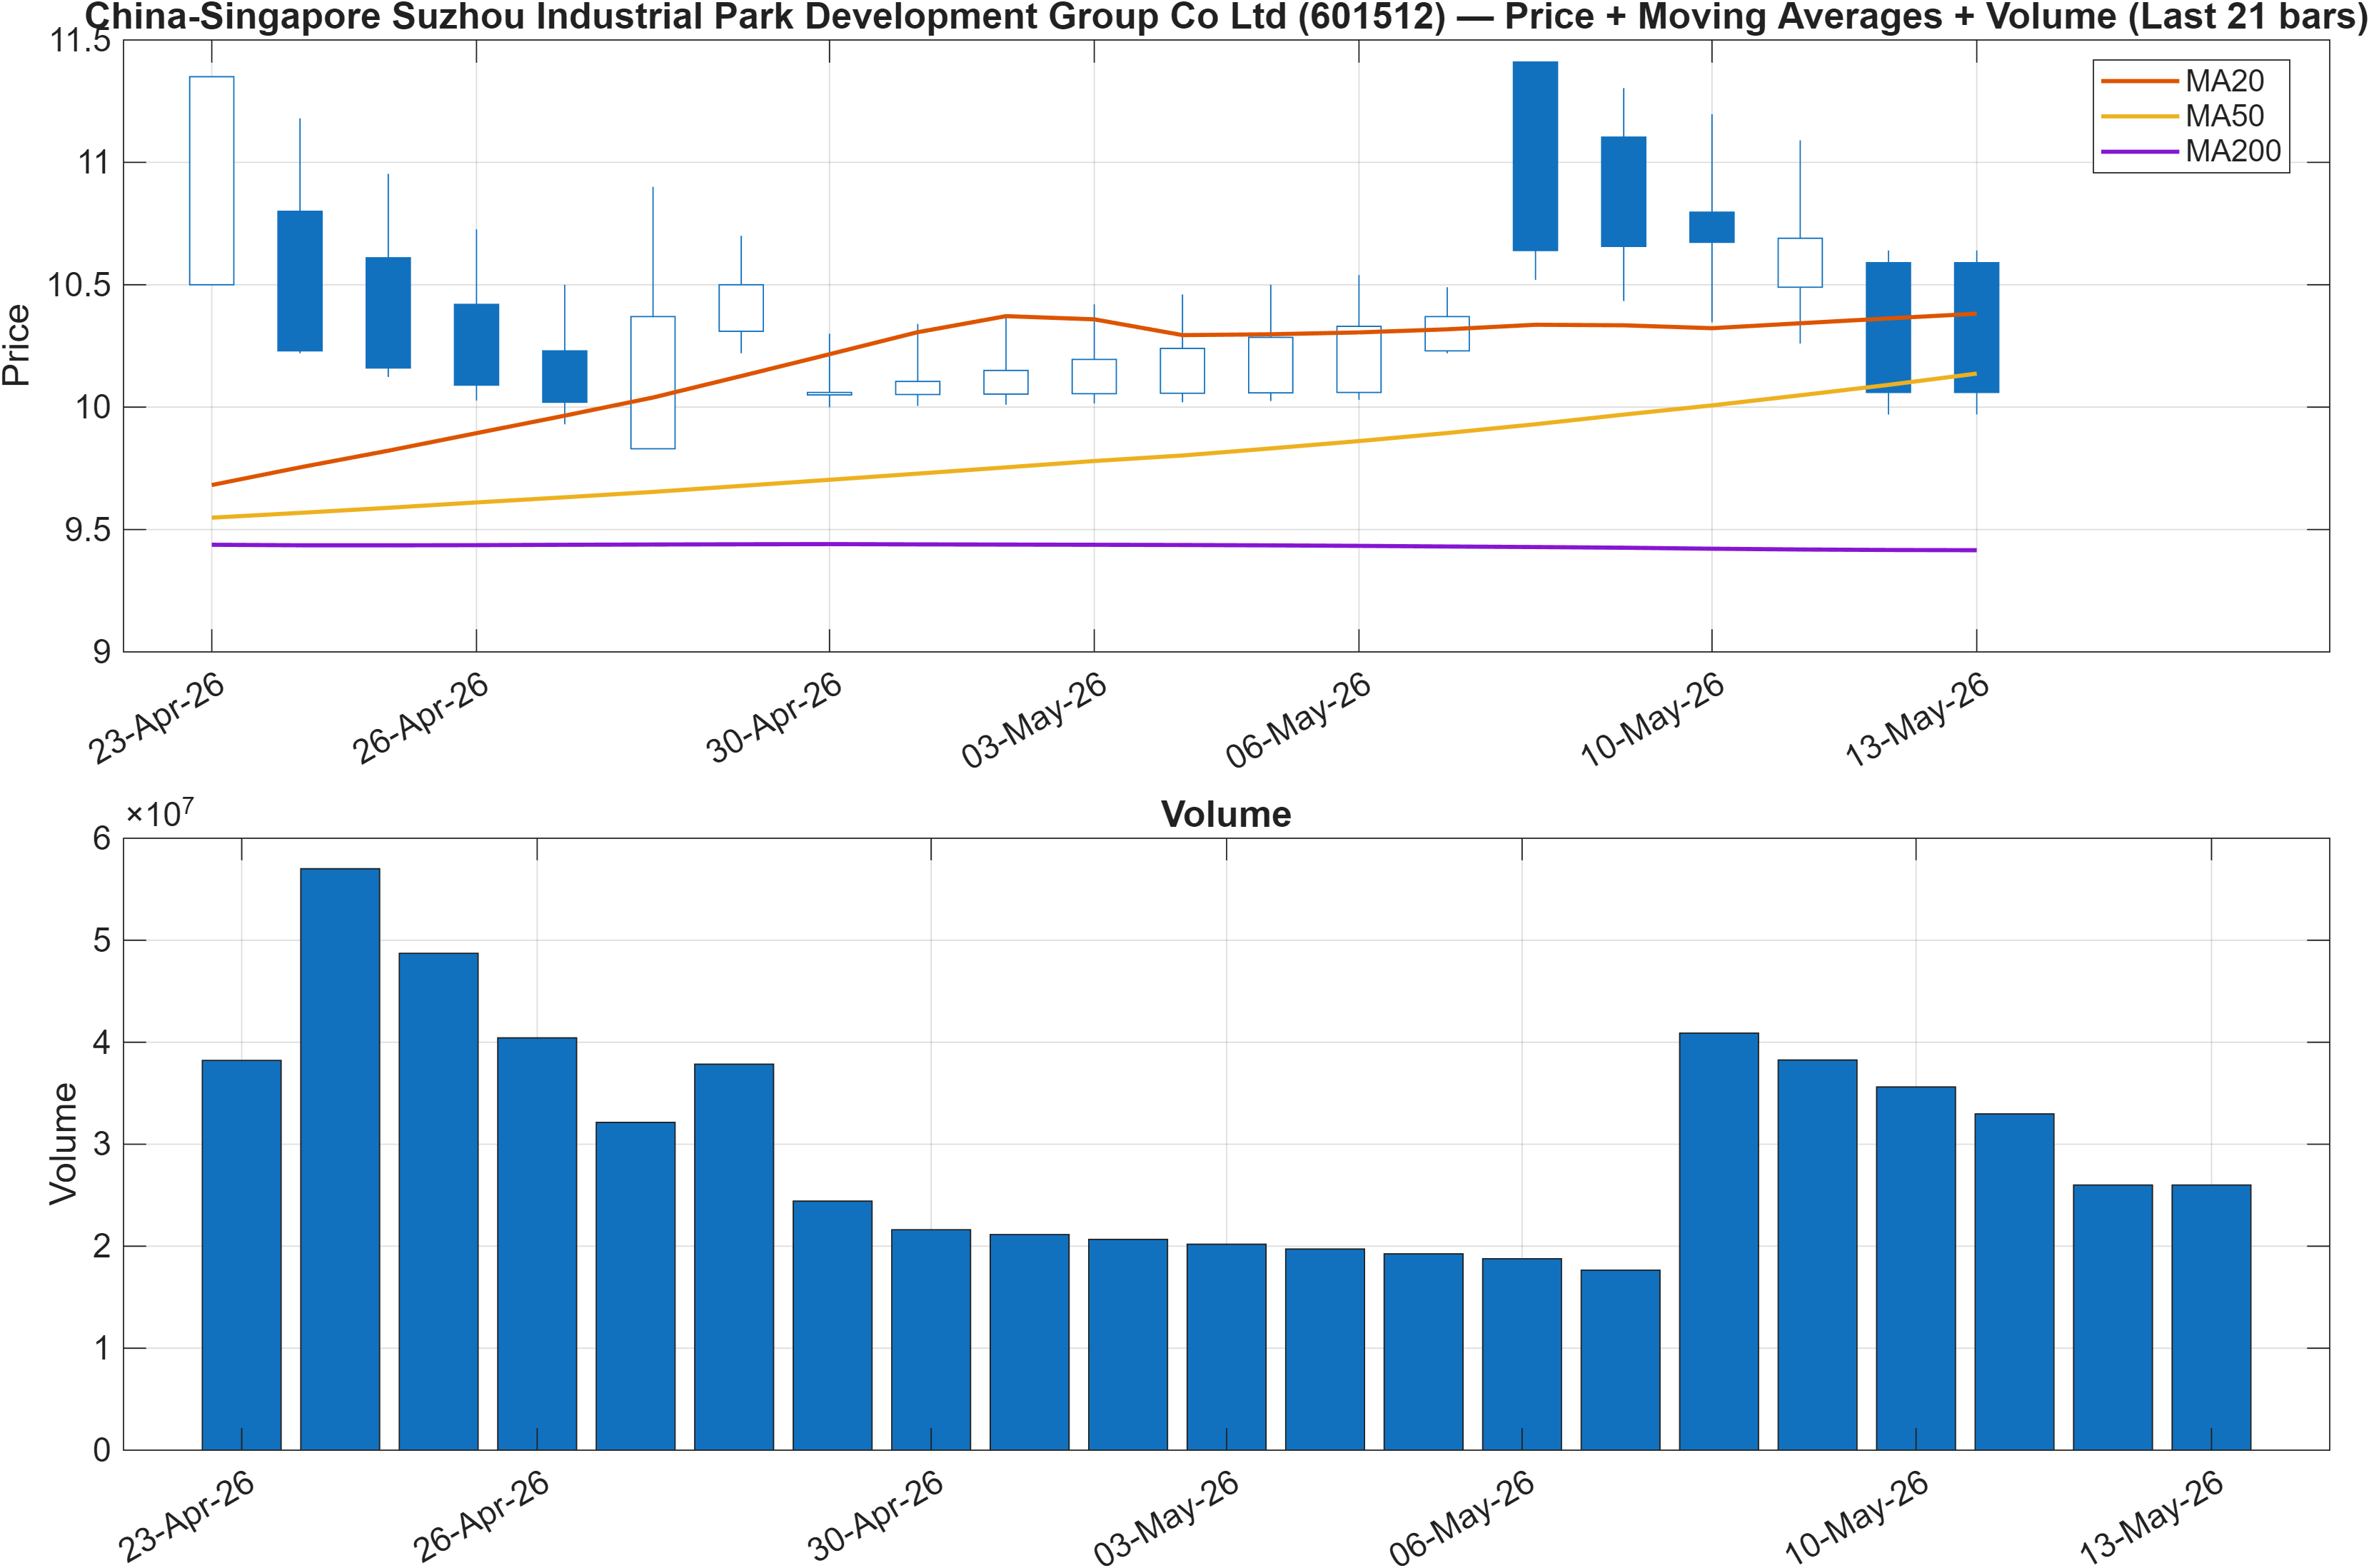
Interpretation: Close vs MA50 = Bearish, MA50 vs MA200 = Bullish.
Regime split: weak near-term tape inside a still-positive longer MA stack
Trend diagnostics show a split regime. On the one hand, the close sitting below the MA50 is a classic marker of near-term pressure and often coincides with weaker short-horizon ranks (consistent with the daily #1271 and monthly #1226). On the other hand, MA50 above MA200 remains a constructive longer-trend characteristic, indicating that the broader moving-average structure has not fully rolled over.
When this configuration appears, the main question is whether the pullback is a mean-reversion drawdown within an older uptrend or the early stage of a more persistent downshift. The neutral longer-horizon ranks (3-month #1021, 6-month #1011) align with the idea that the longer structure is not conclusively bearish, but the short-term weakness remains the dominant observable.
In practical market-structure terms, the MA50 is frequently treated as an intermediate reference line for institutional positioning. Persistent closes below it tend to keep rallies “sold into” unless accompanied by improving momentum/volume conditions. That makes the nearby structural zones—support ~8.5533 and resistance ~11.0217—more consequential than a single moving-average touch: price typically needs to demonstrate acceptance back above the MA50 and hold above it to shift the balance of evidence.
The present setup is therefore best described as trend continuation risk in the short run while the longer moving-average stack still argues against assuming a fully broken regime without additional confirmation from momentum and participation.
3) Momentum & volatility dashboard
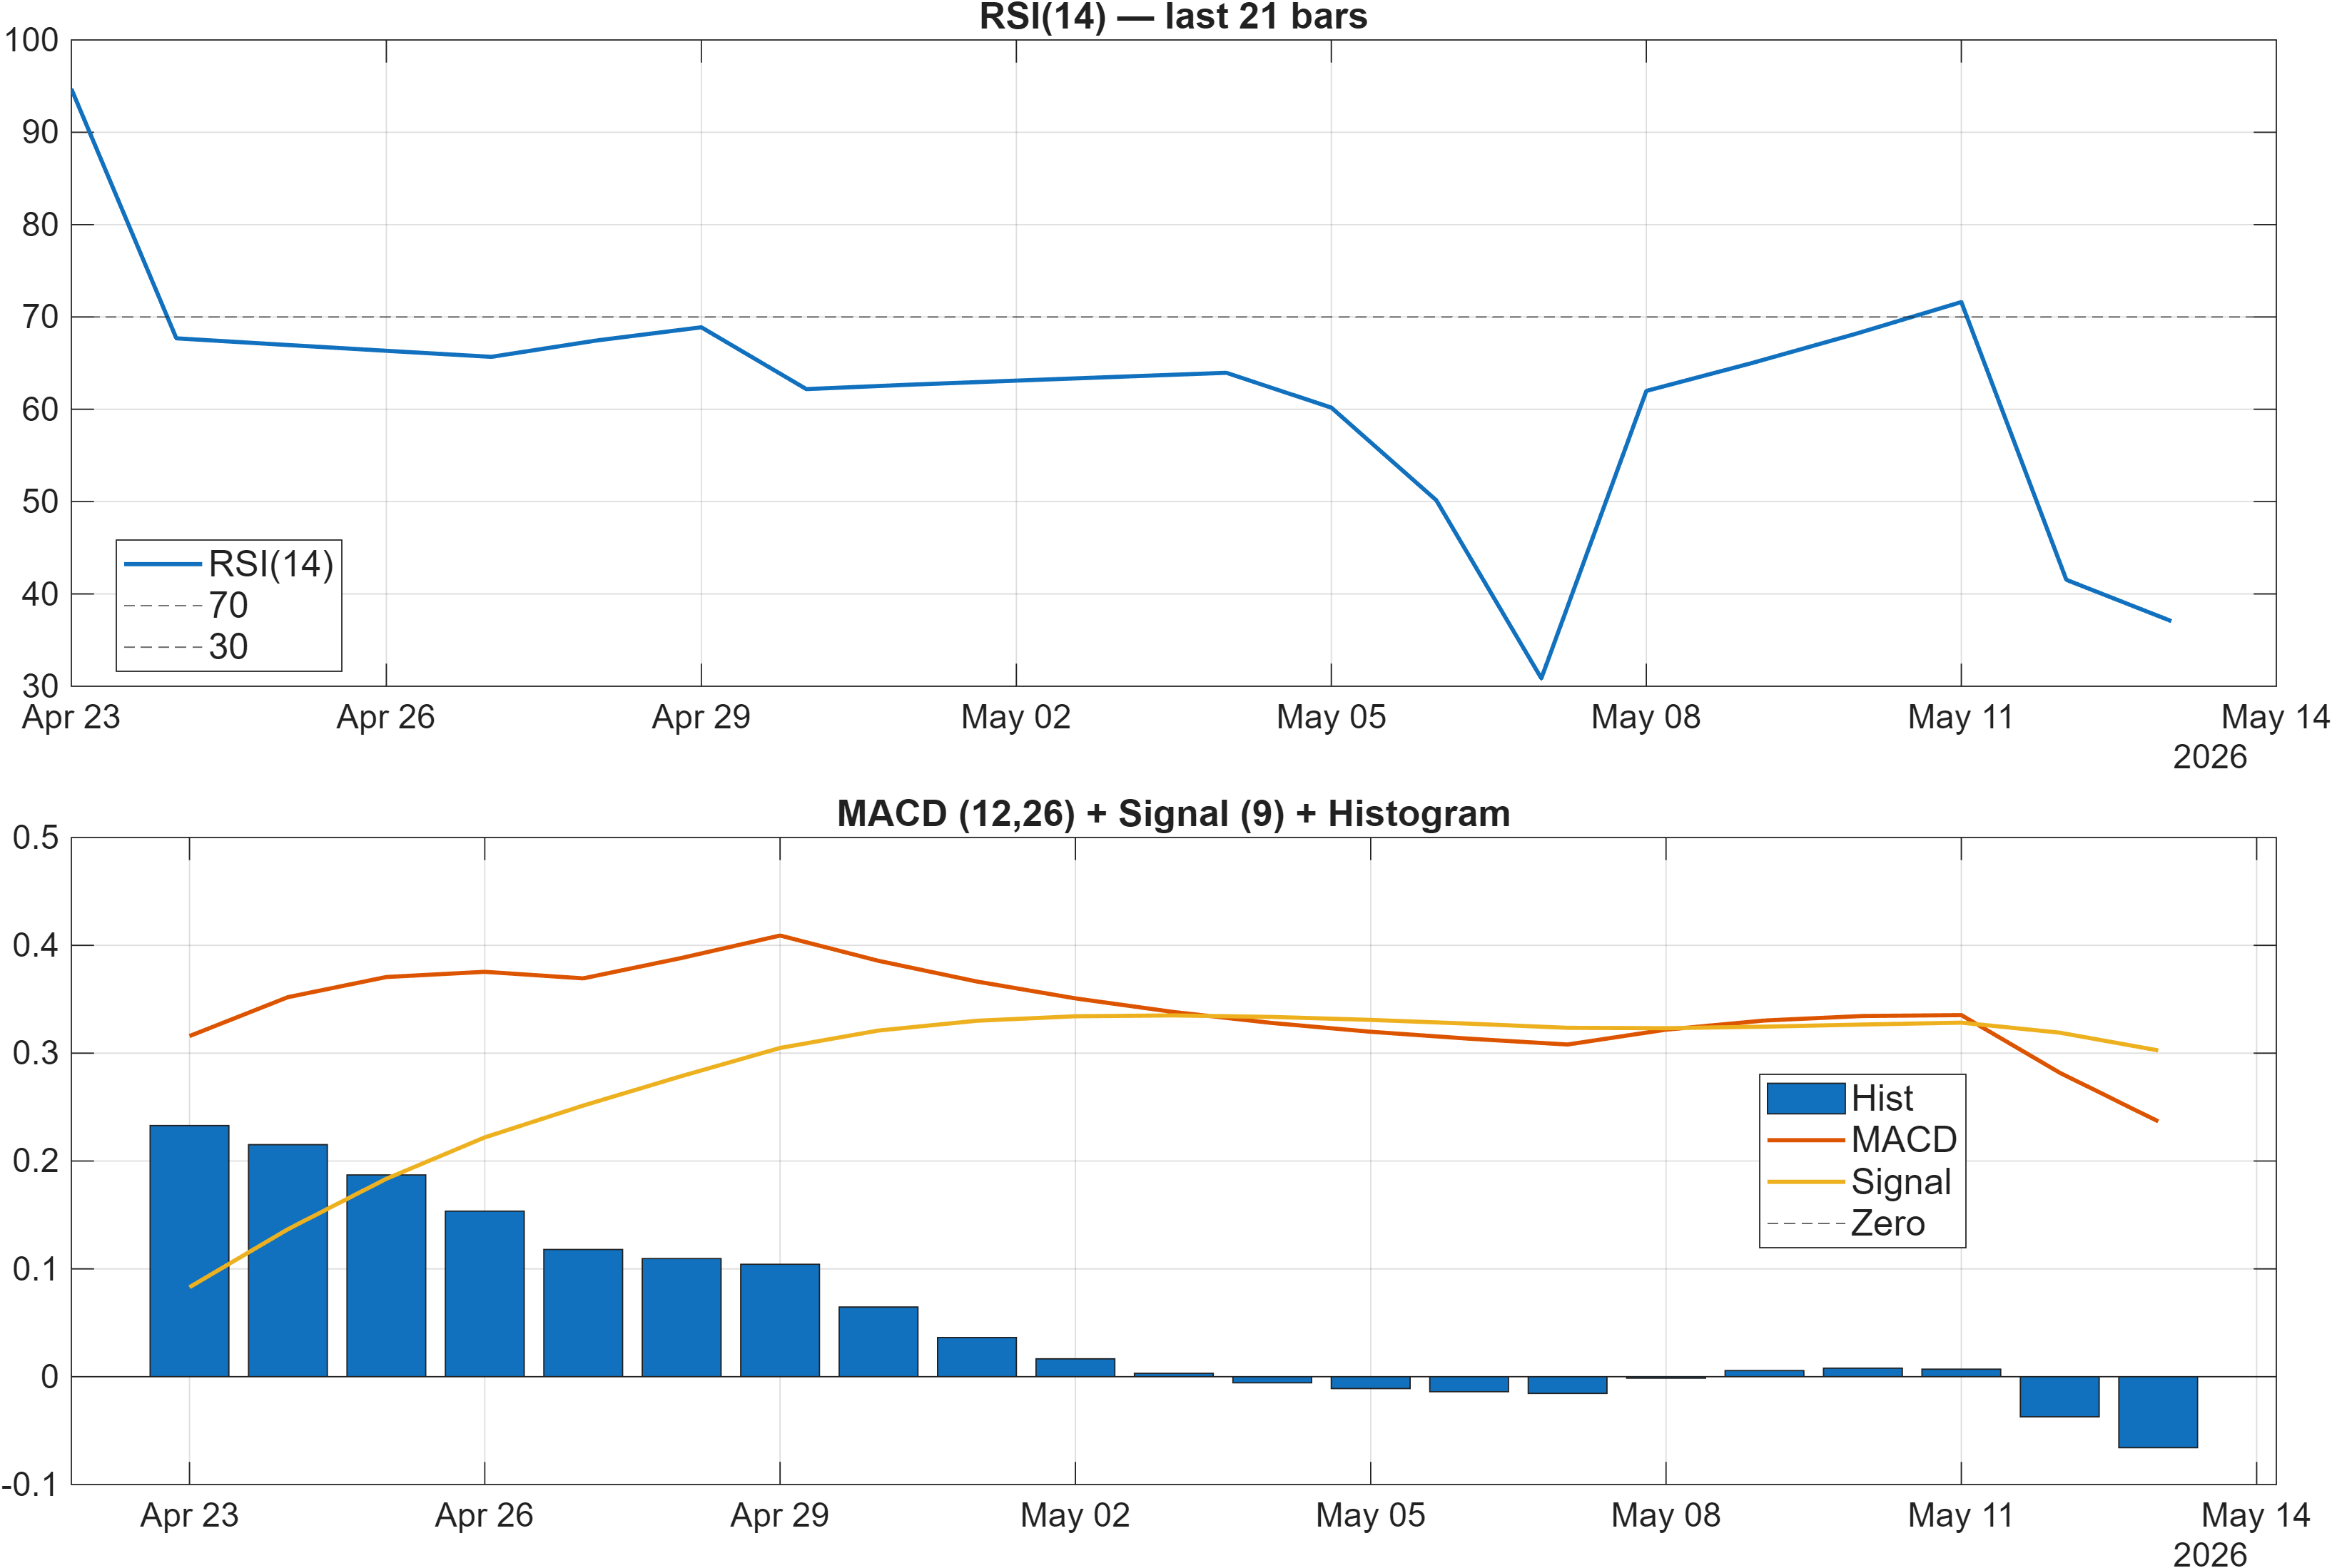
Interpretation: RSI bias = Bearish, MACD hist = -0.0658.
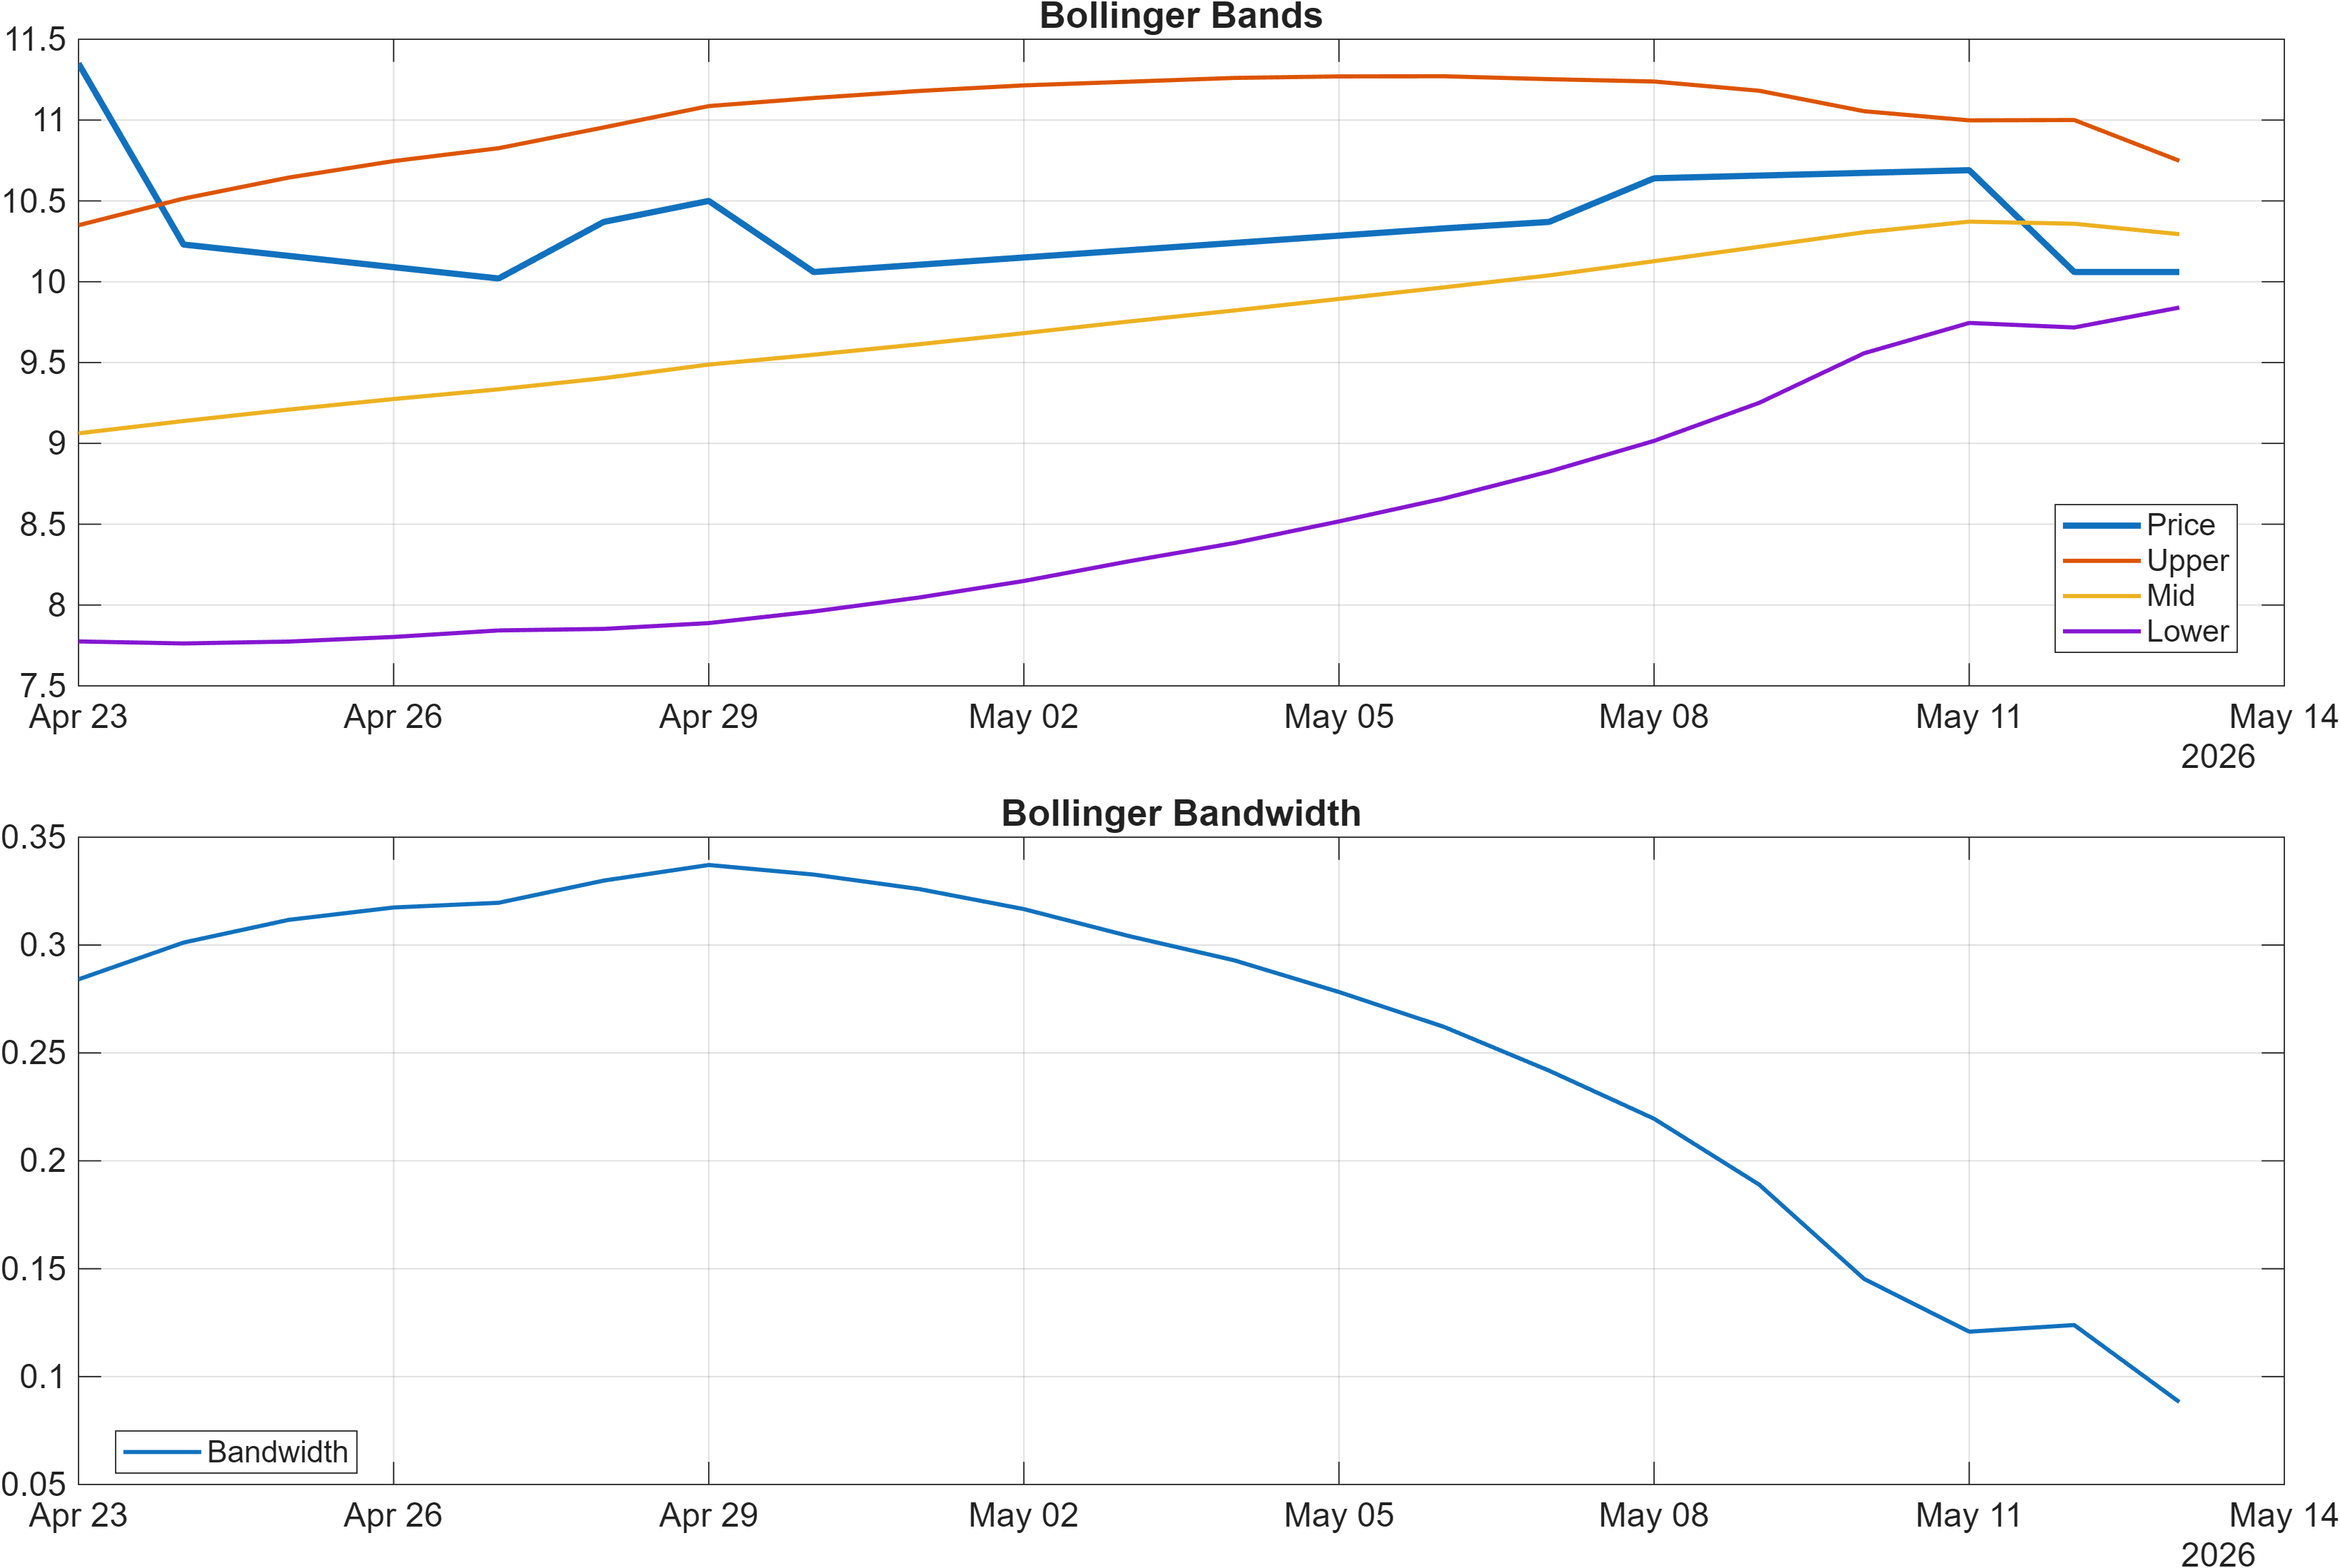
Interpretation: Bandwidth (volatility regime) latest = 0.0882.
Downside momentum remains evident, but volatility is not accelerating
The momentum complex is biased to the downside. RSI(14) at 37.06 sits below the typical midline and is explicitly flagged bearish, indicating that recent price action has maintained downward pressure rather than rotating into a balanced range. The MACD histogram at -0.0658 reinforces that message: negative histogram readings are generally associated with bearish momentum persistence rather than trend repair.
At the same time, the volatility regime is not signaling a panic-type expansion. Bollinger Bandwidth at 0.0882 is presented as the latest regime read, and in combination with a neutral label in the 18-signal dashboard for BB Width 0.08822, it suggests that volatility is relatively contained. This matters because sharp reversals often coincide with volatility expansion; a contained bandwidth environment can instead produce slower, grinding moves where levels and moving averages act as repeated decision points.
A secondary nuance appears in the broader signal set: Stoch %K at 6.25 is bullish in the table, which often occurs when markets are deeply stretched on an oscillator basis. However, oscillator “bounce potential” is not the same as a confirmed trend shift; in bearish tapes, oversold oscillators can stay oversold while MACD and RSI remain negative. The more robust read is therefore the alignment (or lack of it): RSI and MACD point bearish, while volatility is neutral and at least one oscillator indicates stretch.
Net: the dashboard argues for momentum weakness without volatility capitulation, which tends to keep the burden of proof on price to reclaim key levels before the short-term regime is considered repaired.
4) Support / Resistance zones
Support ~ 8.5533 | Resistance ~ 11.0217
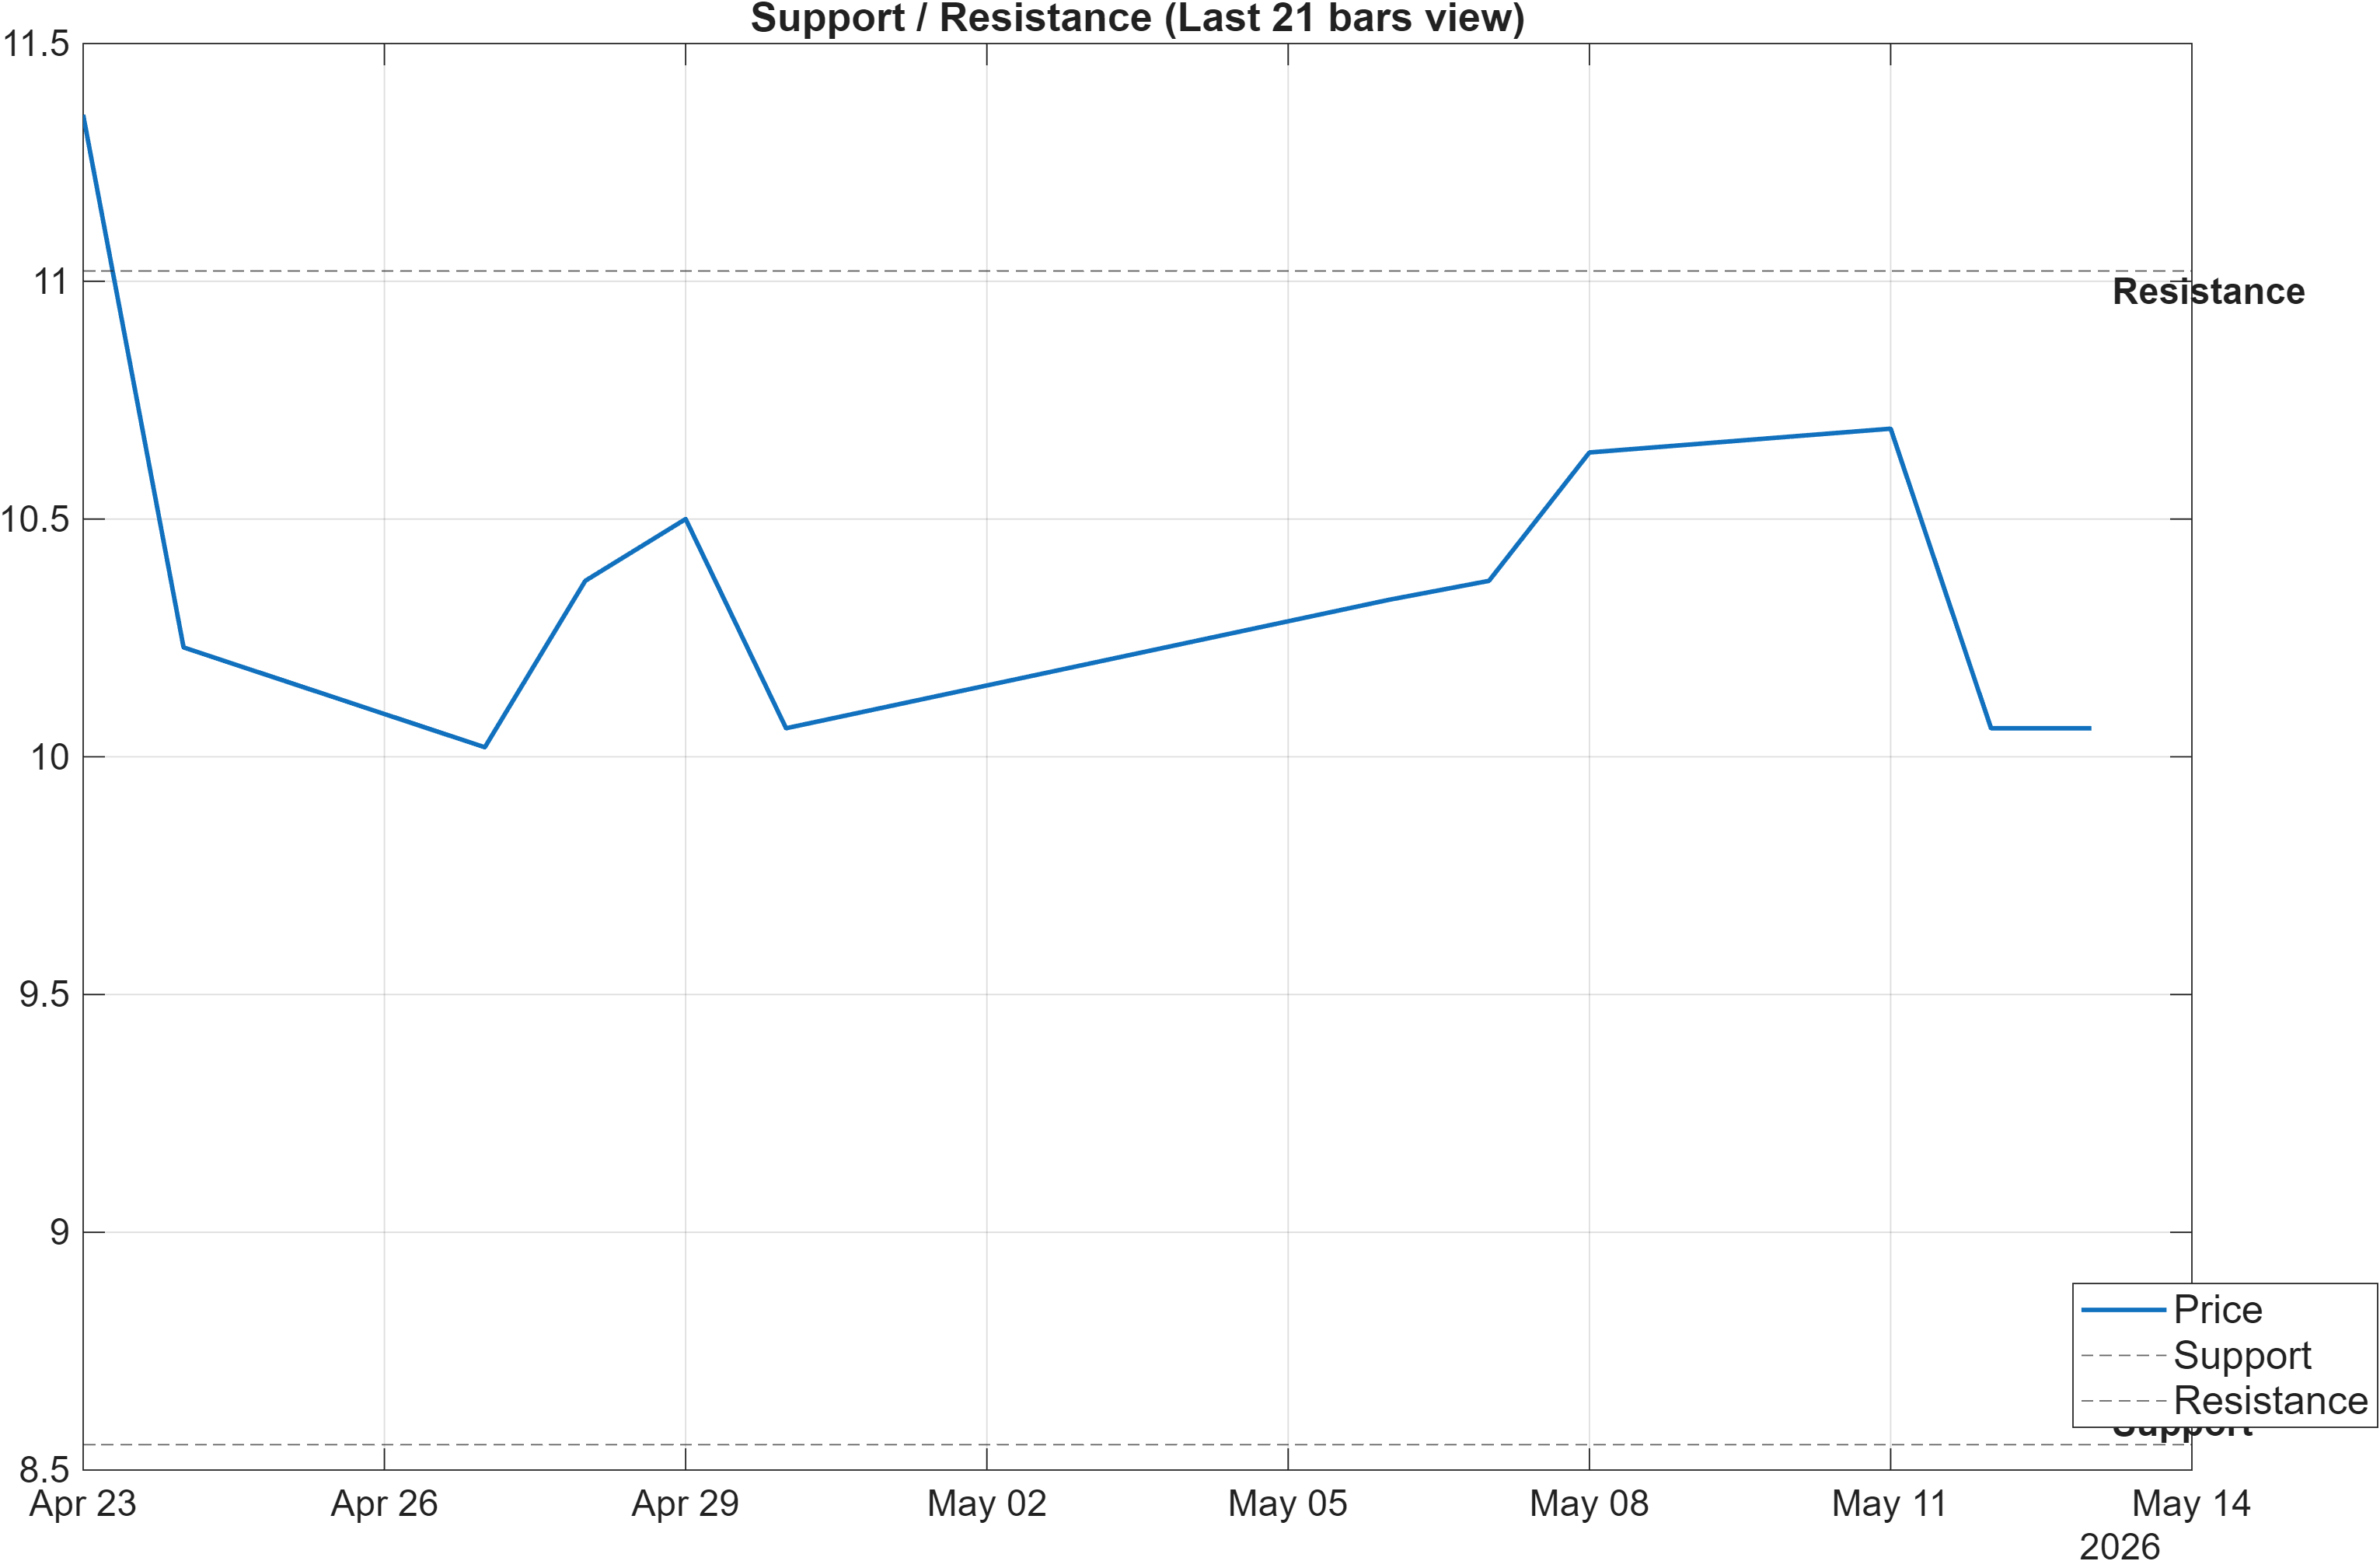
Scenario view: Break above resistance with volume → continuation. Close below support → signal deterioration risk.
Decision zones: mapping rank weakness to structural thresholds
With short-horizon ranks in the extreme weak tail (daily #1271; monthly #1226), the most actionable framework is typically level-driven risk control rather than expecting momentum signals alone to resolve quickly. Here, 8.5533 defines the primary support decision zone. A close below support is explicitly framed as deterioration risk, and in a tape where RSI is already bearish (37.06), a support failure would often coincide with continued negative momentum conditions.
On the upside, 11.0217 is the resistance reference. The scenario guidance requires a break above resistance with volume to support continuation. This is consistent with the signal table, where participation is mixed: despite some bullish volume/flow slopes, Vol ROC(20) at -54.39 is bearish, implying that volume dynamics have not been uniformly supportive. In other words, “price-only” rallies that approach resistance without confirming volume are less likely to change the regime implied by the rankings.
The distance between these zones also interacts with the volatility backdrop. With bandwidth 0.0882 indicating a contained regime, price may spend time rotating between intermediate references before decisively resolving above 11.0217 or below 8.5533. That can produce repeated tests—an environment where false breaks are possible, making closing acceptance (not intraday spikes) more informative.
Framed probabilistically, support is the key “risk boundary” given the bearish rank posture, while resistance is the primary “evidence threshold” needed to argue that the market is transitioning away from the current weak state.
5) Quant Technical Dashboard (18 Signals)
KGNAI AI Technical Analysis Score (Deep Reinforcement Learning): Rank #561 out of 1292 (Rank 1 represents the strongest technical positioning and a higher probability of favorable price behavior. As ranks increase toward the maximum, the probability of favorable outcomes weakens and bearish positioning becomes more dominant.) | Label: Neutral | Score: 0.132
18-Signal Technical Confluence Score: -0.167 (Neutral)
Overall Technical Score (18-signal confluence + DRL rank blend): -0.077 (Neutral)
Note: The blended score reflects signal strength weighted against broader AI technical ranking, which may temporarily diverge.
Blended technical score breakdown: -0.077 (Neutral | Bull 6 / Bear 9 / Neutral 3)
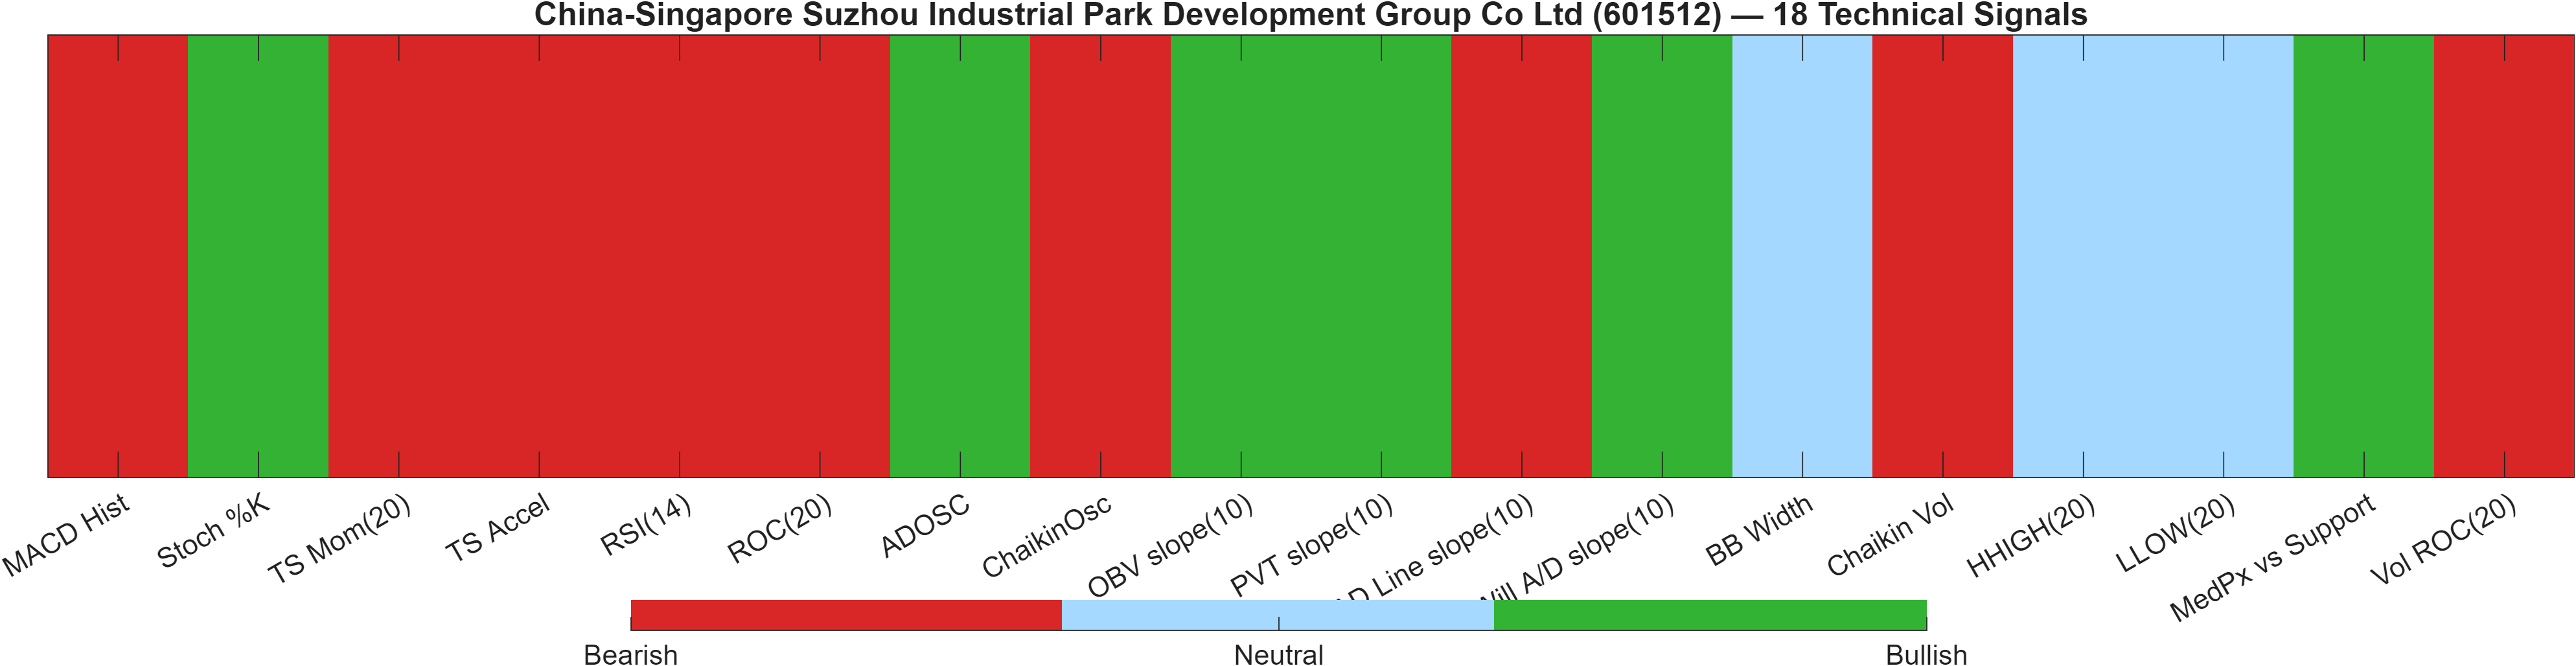
Signal balance: neutral aggregate with bearish momentum dominating the mix
The dashboard is best interpreted as neutral confluence under internal disagreement. The 18-signal confluence score is -0.167 (Neutral) and the blended overall technical score is -0.077 (Neutral), despite the mix leaning bearish on count (Bear 9 vs Bull 6, with Neutral 3). This is a common outcome when bearish momentum signals are partially offset by mean-reversion/flow indicators that suggest selling pressure may be moderating.
The Deep Reinforcement Learning technical rank is #561 out of 1292 with a 0.132 score, labeled Neutral. Relative to the universe, that places the AI technical model nearer the middle than the KGNAI performance ranks (which are much weaker at the daily/monthly horizons). The divergence—very weak cross-sectional ranks vs a more middling technical AI rank—often indicates a market that is weak on a relative-performance basis, yet not exhibiting the kind of universally negative technical structure that accompanies accelerated breakdowns.
Within the signal table, momentum remains the heaviest drag: MACD Hist -0.06581, TS Mom(20) -0.17, and RSI(14) 37.06 all flag bearish. Offsetting signals cluster more around participation/accumulation measures (e.g., some bullish slopes) and oversold-type oscillators (Stoch %K 6.25 bullish). This mix argues for fragile stabilization attempts rather than a confirmed reversal.
Signal table (Bull/Bear/Neutral)
| Indicator | Value | Signal |
|---|---|---|
| MACD Hist | -0.06581 | Bearish |
| Stoch %K | 6.25 | Bullish |
| TS Mom(20) | -0.17 | Bearish |
| TS Accel | -1.655 | Bearish |
| RSI(14) | 37.06 | Bearish |
| ROC(20) | -1.662 | Bearish |
| ADOSC | 10.45 | Bullish |
| ChaikinOsc | -3.447e+07 | Bearish |
| OBV slope(10) | 1.971e+08 | Bullish |
| PVT slope(10) | 2.165e+04 | Bullish |
| AD Line slope(10) | -8.647e+07 | Bearish |
| Will A/D slope(10) | 1.55 | Bullish |
| BB Width | 0.08822 | Neutral |
| Chaikin Vol | 37.87 | Bearish |
| HHIGH(20) | 11.41 | Neutral |
| LLOW(20) | 9.83 | Neutral |
| MedPx vs Support | 1.752 | Bullish |
| Vol ROC(20) | -54.39 | Bearish |
Interpretation: Indicator-level signals form the base confluence, which is then adjusted using a separate AI-driven technical ranking model. The final technical score summarizes this combined view.
6) News sentiment + extractive gist
Note: Instrument-specific news matches were not found, so the digest includes broader market/sector headlines. Links are provided for verification.
Sentiment score (avg): 0.000 | Positive: 0% | Neutral: 100% | Negative: 0%
KGNAI AI News Sentiment Score (normalized -1 to +1): Not available (as of —) | Label: Not available | Overall news score: 0.00
Positive Developments
Recent coverage across major financial outlets indicates a generally information-driven news flow rather than a catalyst set specific to 601512, which aligns with the provided sentiment mix of 100% neutral and an average score of 0.000. Where the tone is constructive, it is mostly framed through risk-management and diplomacy narratives that can reduce uncertainty at the margin when escalation risk is contained. For market participants, that kind of backdrop can support periodic stabilization attempts—particularly when technicals show signs of stretch, such as Stoch %K at 6.25 (bullish) even while broader momentum remains weak. However, because the content is not instrument-specific in the provided data, the constructive angle should be treated as context rather than a direct driver. In this setup, confirmation is more likely to come from price behavior around 8.5533 and 11.0217 than from incremental shifts in general headlines.
Neutral / Mixed Developments
The dominant theme in the provided digest is macro and geopolitical information that can be interpreted in multiple ways depending on positioning and time horizon. This tends to keep news sentiment mechanically neutral (as reflected by 0% positive / 0% negative in the sample), even as risk premiums fluctuate intraday. For 601512, the analytical implication is that headline drift may modulate volatility without necessarily resolving the stock’s internal technical debate—bearish momentum (e.g., RSI(14) 37.06, MACD histogram -0.0658) versus a still-neutral blended technical score (-0.077). In neutral/mixed tapes, markets often revert to technical reference points—moving averages, Bollinger Bands, and support/resistance—because those are the clearest anchors for incremental decision-making.
Negative / Risk Signals
The risk-sensitive portion of the broader news flow centers on geopolitical tension and defense-related uncertainty, which can raise the probability of abrupt shifts in risk appetite even when directionality is unclear. For an instrument already scoring poorly on cross-sectional ranks—such as daily #1271 and monthly #1226 out of 1292—risk-off bursts can matter because they may compress liquidity and increase the odds of support tests. Even though the volatility regime in the technical layer is not currently expansionary (bandwidth 0.0882), headline shocks are the type of input that can change that quickly. In this context, a close below 8.5533 would be a key technical risk signal, because it would align weak ranks, bearish momentum, and negative macro tone into a more coherent downside regime.
- What to monitor next: Whether sentiment remains neutral while price holds above 8.5533.
- What to monitor next: Any volatility pickup alongside repeated failures below the MA50 (trend pressure persistence).
- What to monitor next: A volume-confirmed push through 11.0217 versus rejection near resistance.
Sources referenced: Reuters, Bloomberg, Yahoo Finance, MarketWatch, Investing.com
Snapshot: AI Rank (Short–Mid–Long): Mixed (Bearish tilt) (Bearish–Bearish–Neutral) · Technical Confluence: Neutral · Key Levels: Support ~8.55 | Resistance ~11.02 · News Sentiment: Neutral
7) Sources
Instrument-specific source attribution is not available in the provided data. The BASE_HTML contained a list of links; per publication format, headline lists are not reproduced here.
You may also like: How KGNAI AI ranks instruments across global markets
Disclaimer: KGNAI provides AI-generated analytics and educational market commentary only. This is not financial advice. Markets involve risk. Always do your own research.