
601995 — China International Capital Corp Ltd (15-May-2026) | Ranks Skew Bearish as Technical Signals Stabilize
China International Capital Corp Ltd (601995) enters 15-May-2026 with a bearish tilt in cross-sectional KGNAI ranks despite a more balanced signal mix inside the technical dashboard. The daily rank (#805 of 1248) sits closer to the middle of the universe, but the weekly (#1132) and monthly (#1171) ranks are anchored in the weaker part of the distribution, suggesting that recent stabilization has not yet translated into improved relative positioning. On the technical side, the 18-signal confluence score is 0.333 (Bullish), while the overall blended technical score is 0.094 (Neutral), consistent with a market that is attempting to base without clear trend confirmation. Key decision levels remain well-defined at support ~32.0100 and resistance ~34.8217, with volatility conditions relatively contained via Bollinger bandwidth 0.0259.
Key Takeaways
- Rank stance: Short-term Bearish | Mid-term Bearish | Long-term Not available
- Technical confluence: 18-signal score 0.333 Bullish, but blended technical score 0.094 Neutral
- Key levels: Support ~32.0100 | Resistance ~34.8217
- News sentiment bias: Distribution is mostly neutral (Neutral 94%, Negative 6%), with sentiment score (avg) -0.031
- Confirmation / invalidation: A close below 32.0100 increases deterioration risk; a break above 34.8217 with volume supports continuation conditions
What KGNAI Measures
KGNAI evaluates assets using large cross-sectional datasets built from millions of structured data points. Inputs incorporate fundamental metrics, technical structures, and systematically processed news sentiment. Statistical models, machine learning, and AI frameworks are used to assess relative positioning, signal alignment, and probabilistic behavior across broad universes.
How to Read This Report
- Ranks are comparative across the tracked universe, not absolute price targets.
- Confluence reflects alignment among independent signal groups.
- Support/resistance levels are probabilistic decision zones, not guarantees.
- Sentiment provides contextual bias within the broader analytical framework.
1) KGNAI AI Analysis
Region: CHINA
Total universe size: 1248 ranked instruments
- Daily rank: #805 out of 1248 — Neutral
- Weekly rank: #1132 out of 1248 — Bearish
- Monthly rank: #1171 out of 1248 — Bearish
- 3-Monthly rank: Not available for this horizon — Not available
- 6-Monthly rank: Not available for this horizon — Not available
- Yearly rank: Not available for this horizon — Not available
The rank profile is characterized by short-horizon stabilization without follow-through at intermediate horizons. A daily rank of #805 places 601995 closer to the mid-pack than the weekly and monthly readings, which sit in the lower-end cohort of the 1248-instrument universe. This cross-horizon gap often matters more than the day-to-day label: it can indicate either an early attempt at mean reversion or simply noise that has not altered the broader regime.
The weekly (#1132) and monthly (#1171) ranks remain firmly bearish, implying that, relative to peers, the instrument’s recent price behavior and factor footprint have not improved enough to change its probability-weighted positioning. This is consistent with a market that may experience counter-trend bounces while still being evaluated as structurally weak by the broader model set.
Horizon availability is also a practical constraint: 3-monthly, 6-monthly, and yearly ranks are Not available for this horizon, so long-cycle regime assessment cannot be validated directly from the provided rank panel. Within the available data, the term view remains Bearish (Short-term) and Bearish (Mid-term), with long-term Not available. In this configuration, the cleaner analytical approach is to treat rallies as requiring incremental confirmation (improving ranks and breakouts) rather than assuming persistence from a single daily improvement.
2) Price & trend overview
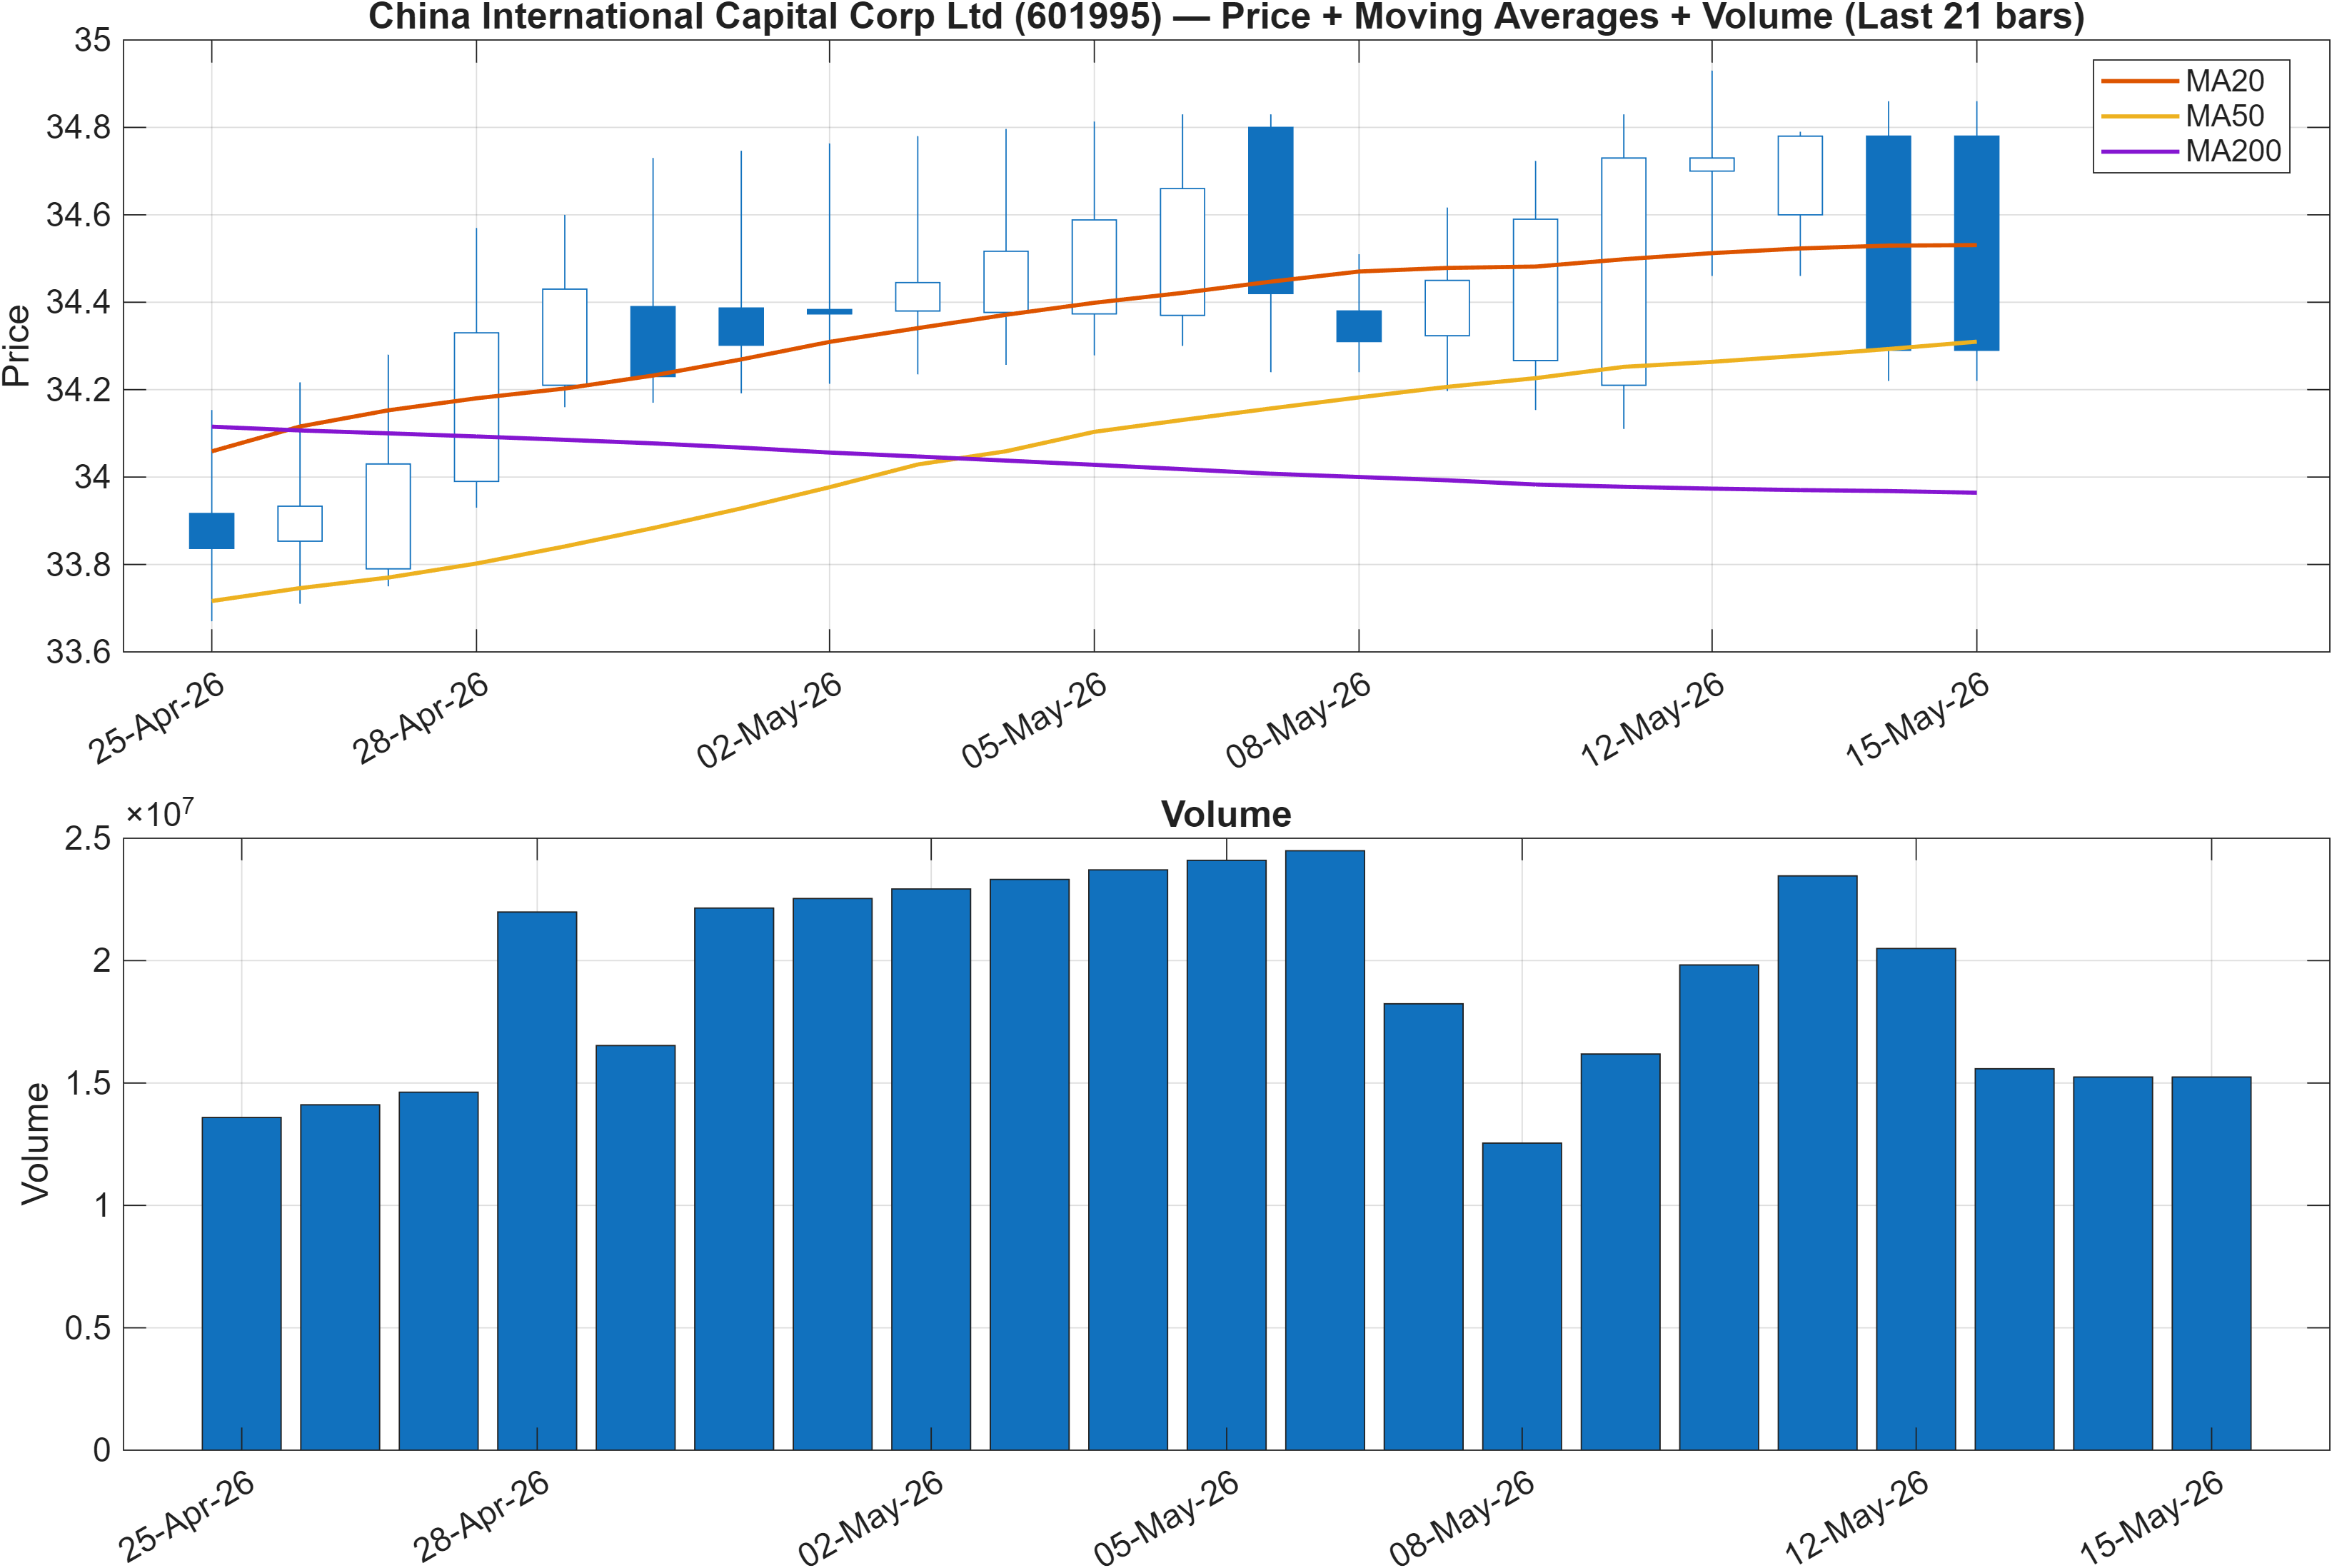
Interpretation: Close vs MA50 = Bearish, MA50 vs MA200 = Bullish.
Trend structure shows a timeframe split. The bearish relationship of price vs MA50 suggests near-term pressure remains active, while the bullish MA50 vs MA200 condition points to a longer moving-average configuration that has not fully rolled over. In practice, this combination often produces choppy tape: rebounds can occur, but they may struggle to persist unless the close reclaims and holds above the medium-term average.
This split is directionally consistent with the rank term structure: the daily rank (#805) is less bearish than the weekly (#1132) and monthly (#1171) readings, implying that the very near-term may be attempting to stabilize even while the multi-week profile remains weak. From a market-structure perspective, the cleaner test is whether buying interest can persist long enough to shift the medium-horizon assessment, rather than merely lift price for a few sessions.
The most actionable way to anchor the trend read-through is to connect it to the defined decision zones: support ~32.0100 and resistance ~34.8217. When price is below the MA50 but longer averages remain constructive, support integrity typically becomes the first condition for avoiding further deterioration, while a resistance break with volume becomes the necessary validation for a more durable continuation phase. Without those confirmations, the prevailing interpretation remains a fragile stabilization rather than a trend reset.
3) Momentum & volatility dashboard
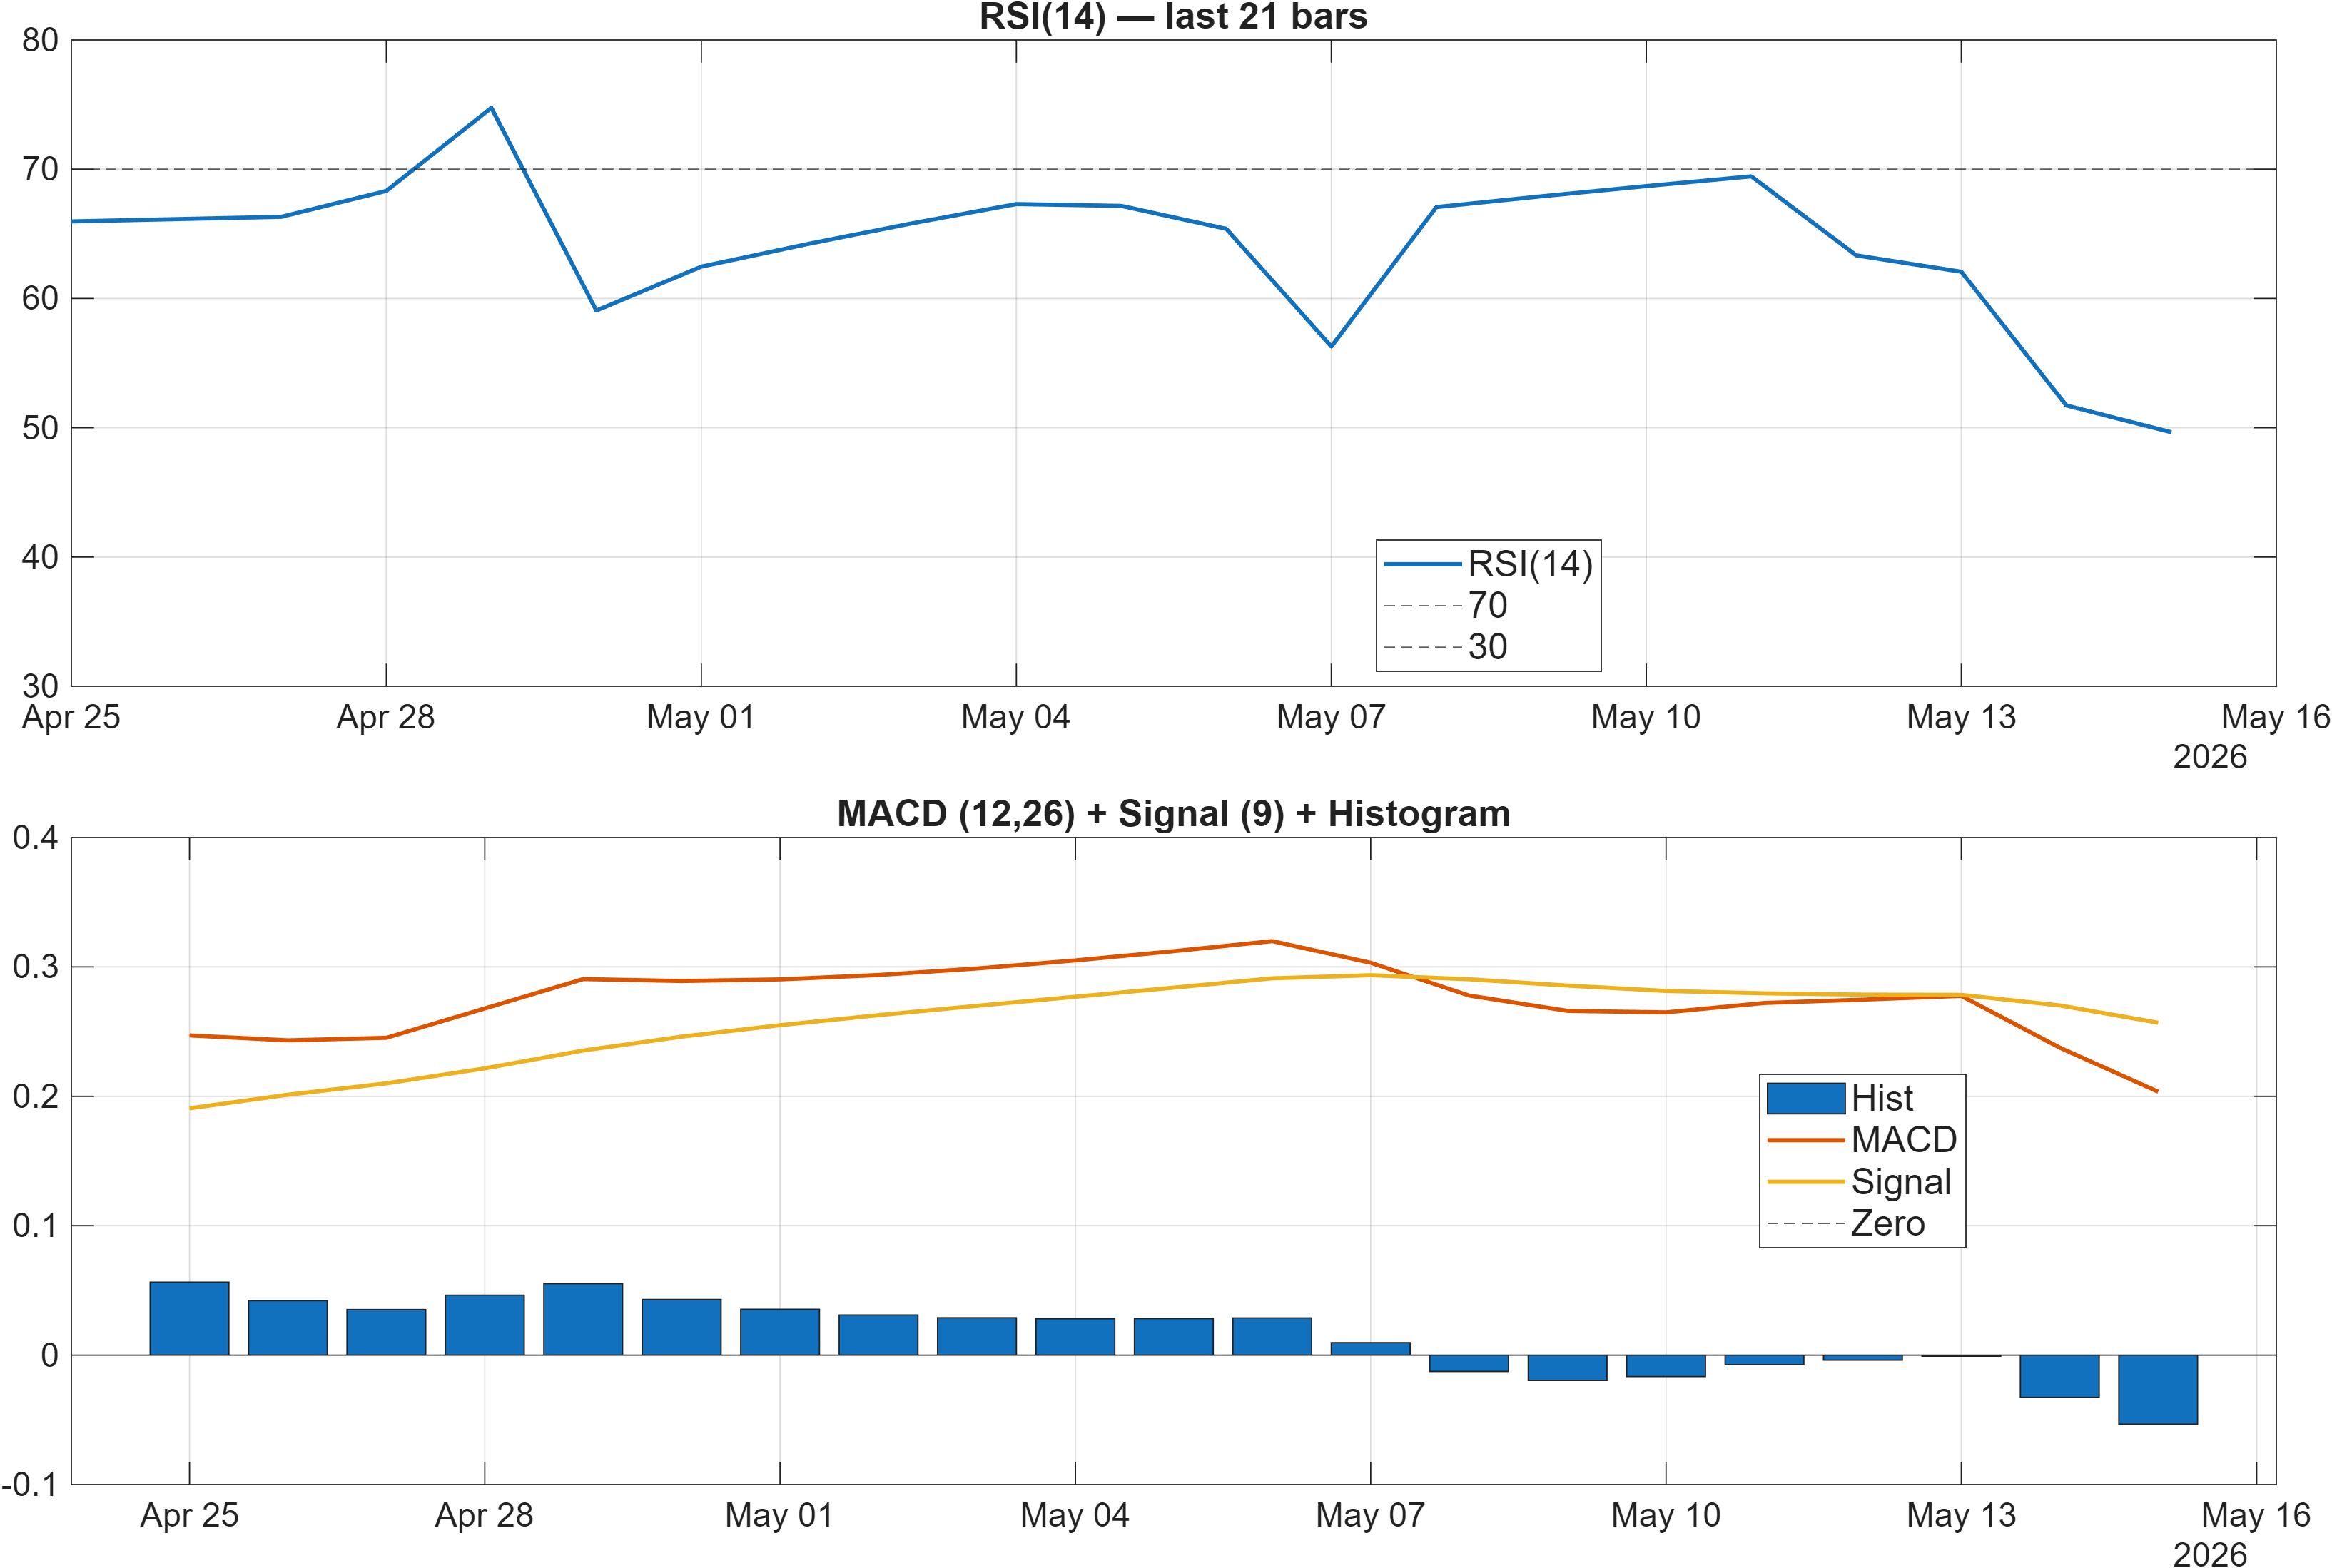
Interpretation: RSI bias = Neutral, MACD hist = -0.0533.
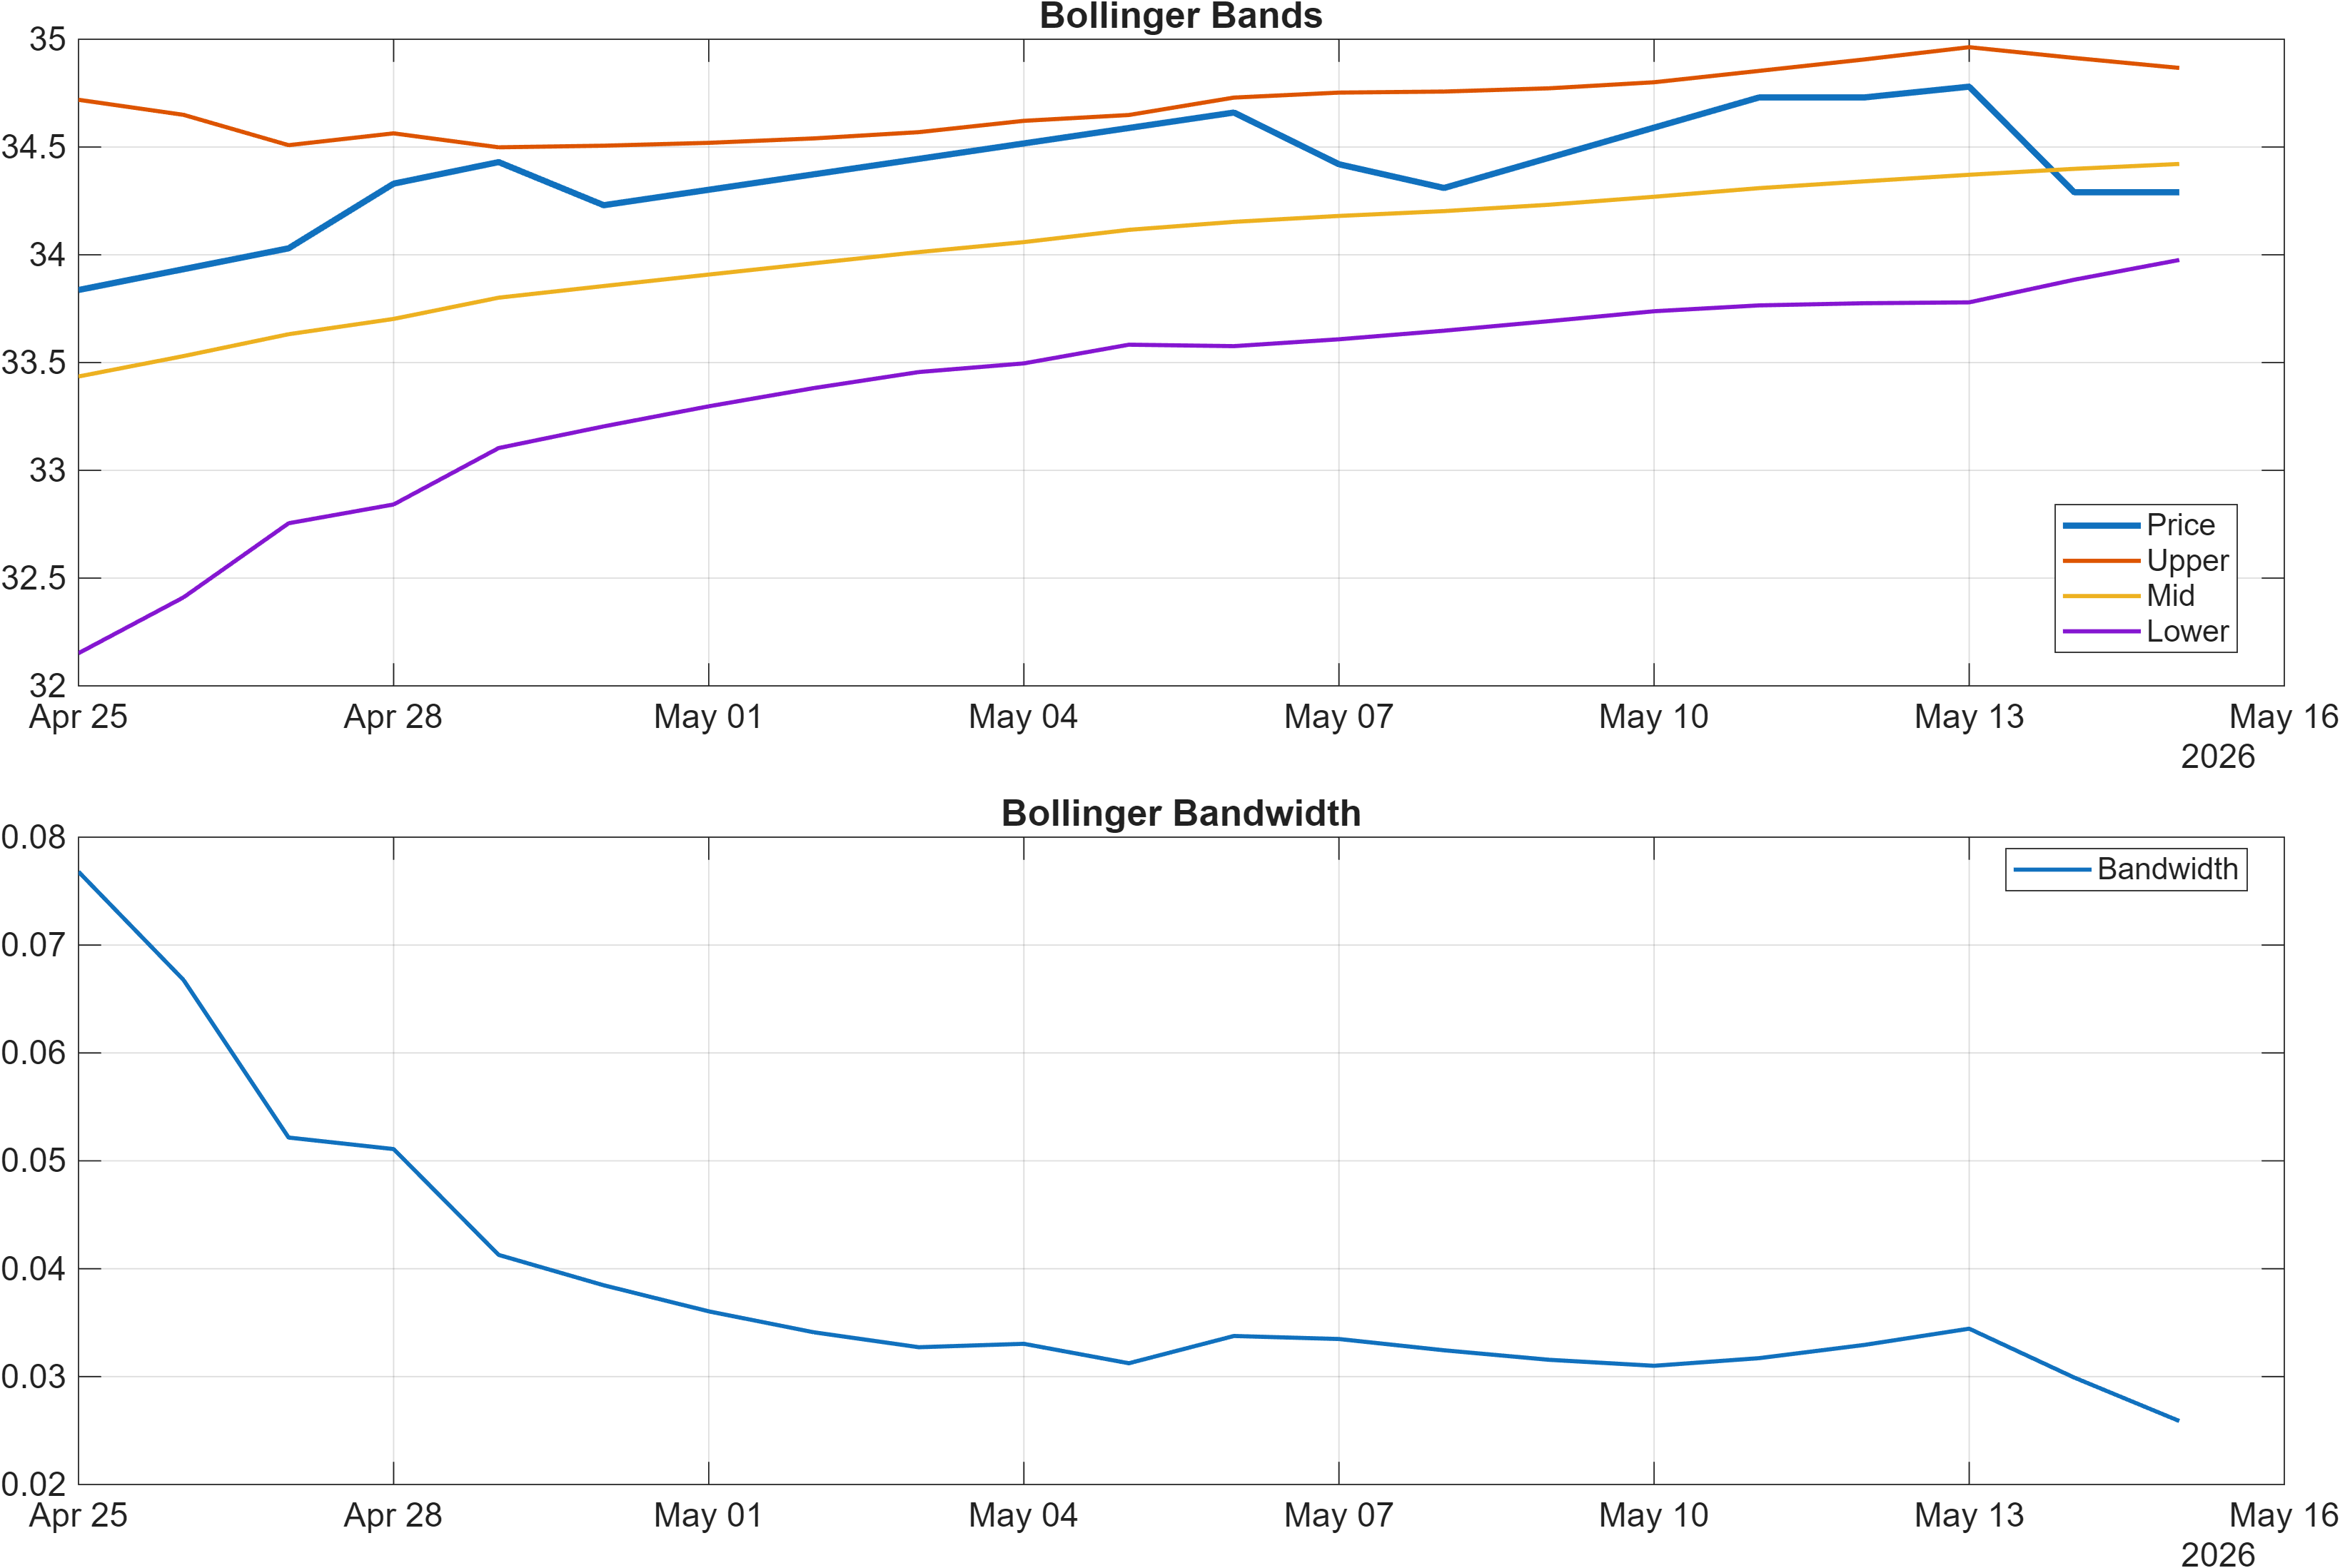
Interpretation: Bandwidth (volatility regime) latest = 0.0259.
Momentum diagnostics are best described as non-committal. The RSI bias is Neutral, aligning with the signal table’s RSI(14) value of 49.65, which is consistent with neither a stretched oversold condition nor a strong momentum run. In that setting, RSI becomes less useful for timing extremes and more useful for monitoring whether follow-through pushes RSI into a more directional regime.
MACD is less forgiving: the MACD histogram at -0.0533 (and -0.05334 in the signal table) keeps the incremental impulse tilted to the downside, even if not dramatically. That matters because a neutral RSI alongside a negative MACD histogram can reflect bearish drift—a market that is not capitulating, but is also failing to generate sustained upside momentum.
Volatility conditions appear relatively contained, with Bollinger bandwidth 0.0259 (0.02589 in the signal table). Narrower bandwidth often coincides with compression phases where subsequent direction is determined by break behavior rather than oscillator levels alone. This links back to the support/resistance map: with volatility restrained, the informational content of a break above 34.8217 or a close below 32.0100 typically increases, because moves out of compression can carry more signal weight than oscillations inside the range.
4) Support / Resistance zones
Support ~ 32.0100 | Resistance ~ 34.8217
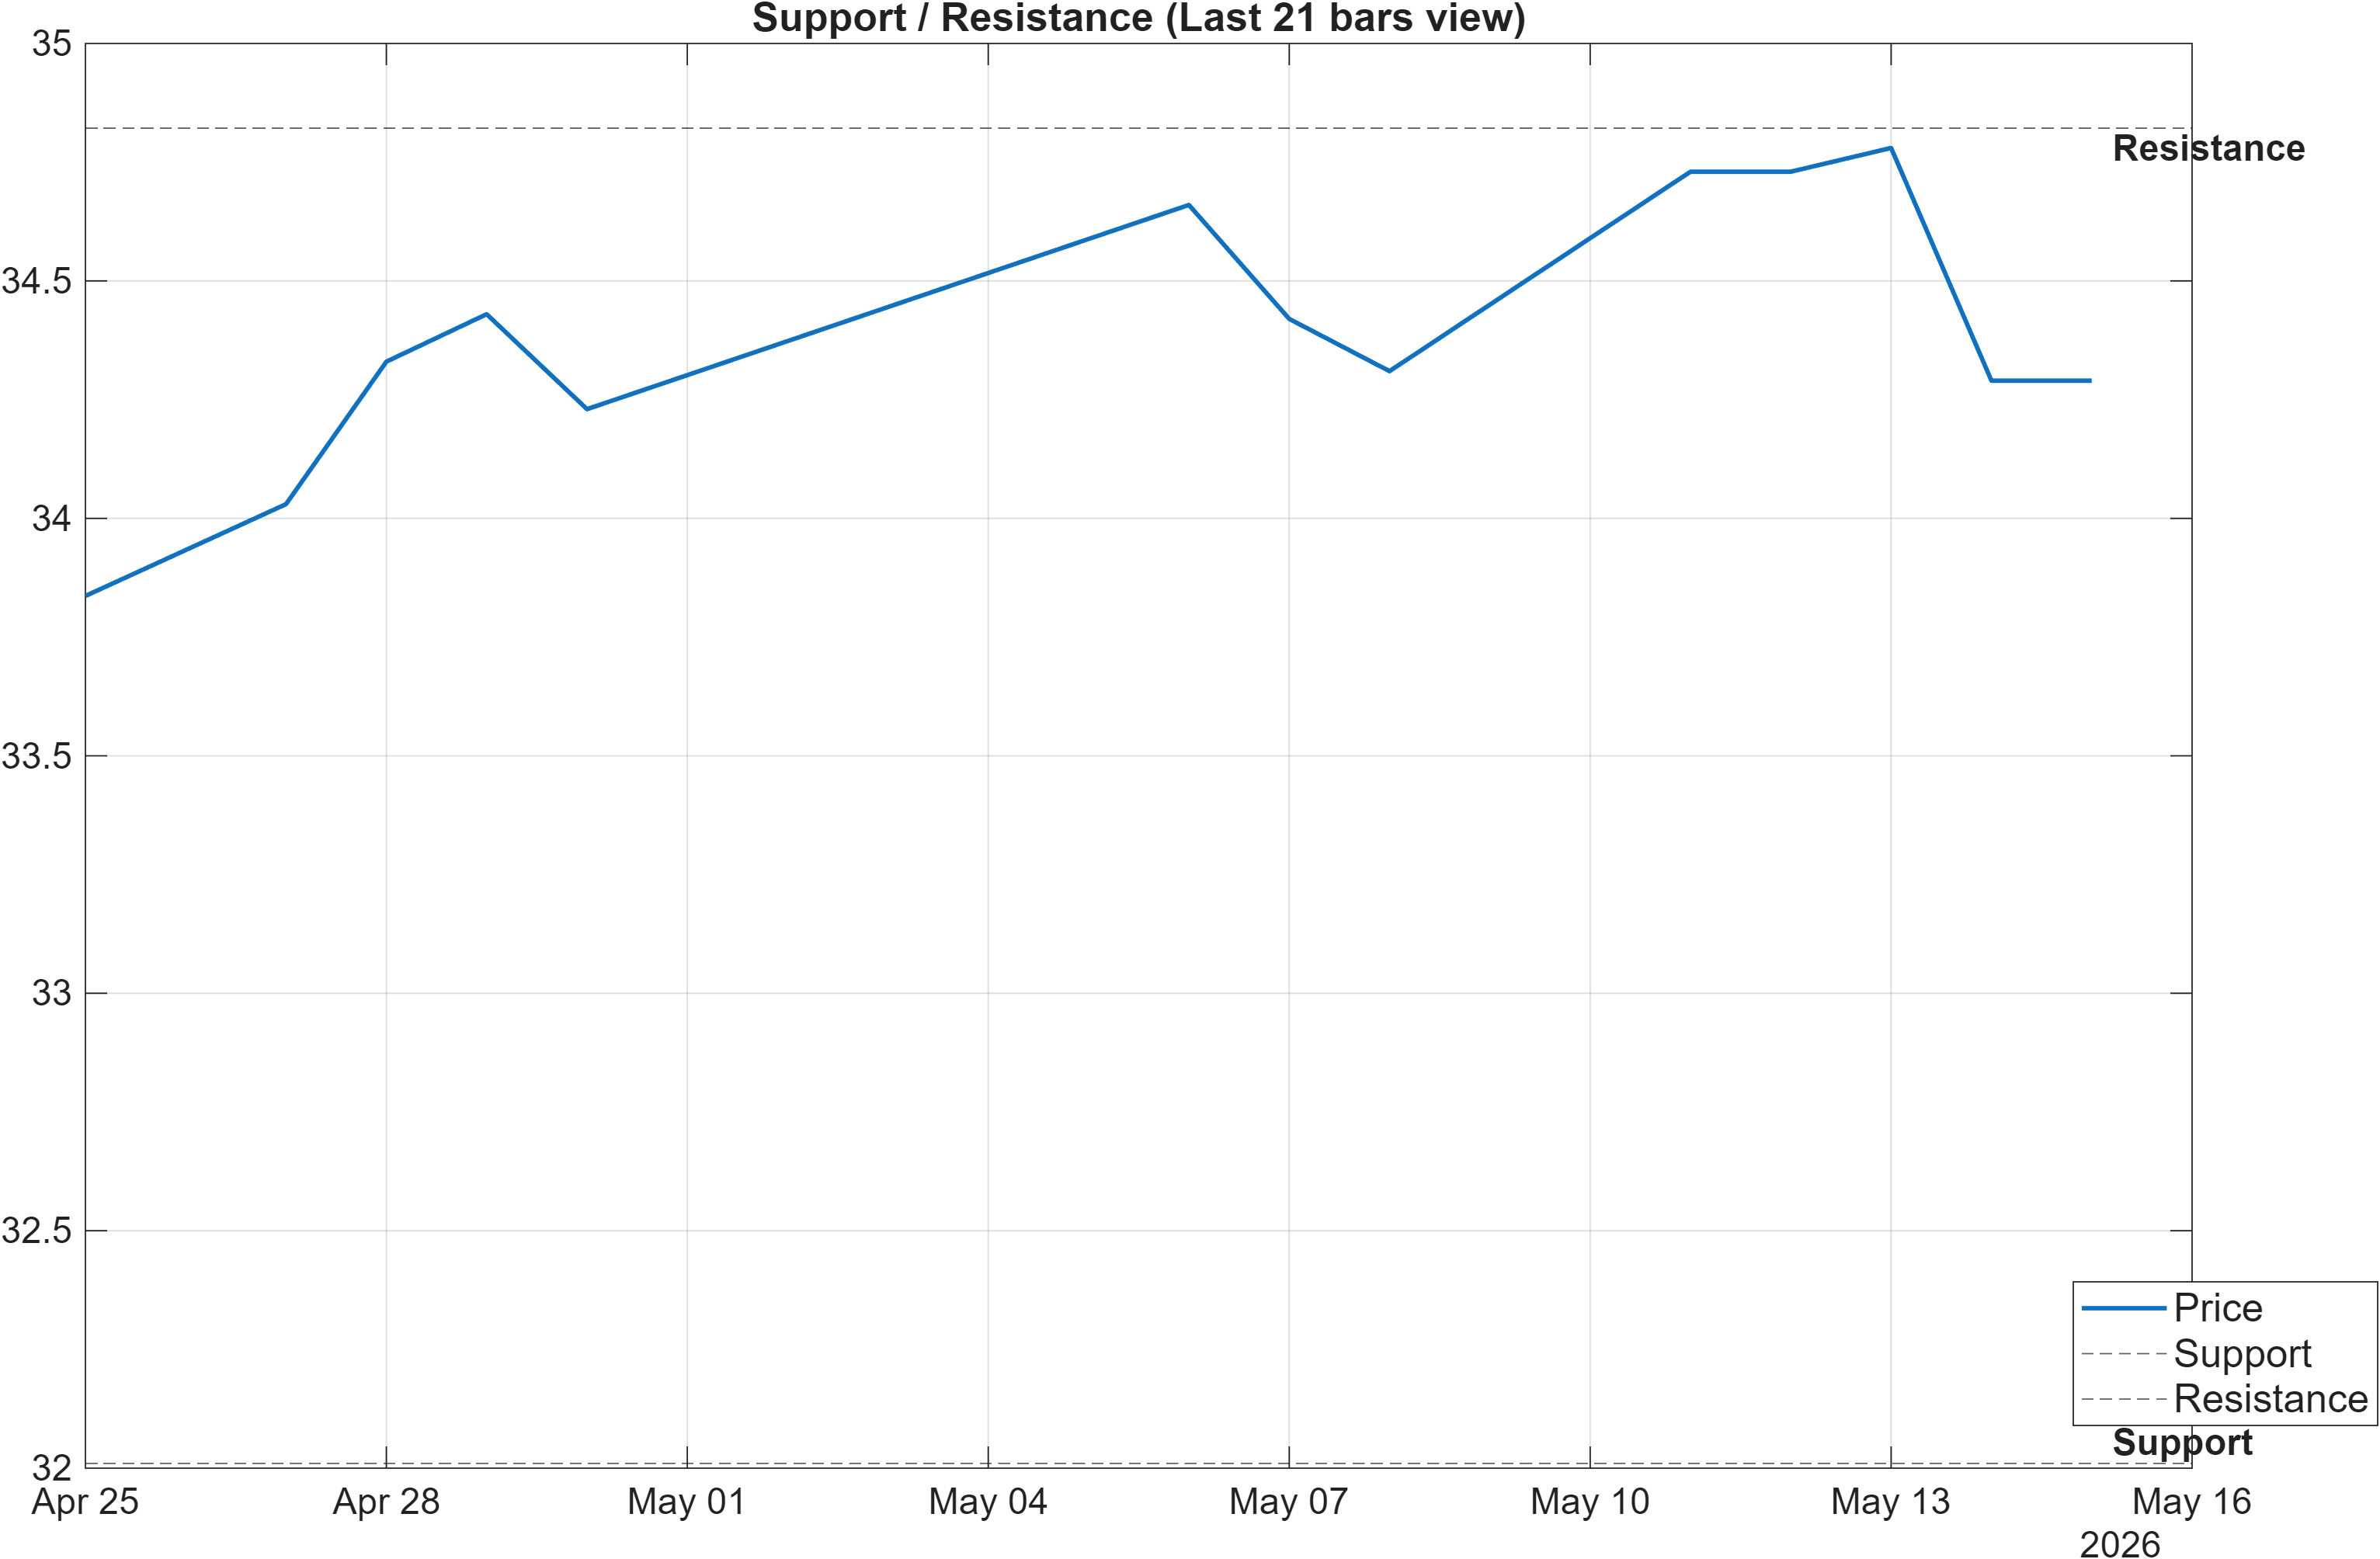
Scenario view: Break above resistance with volume → continuation. Close below support → signal deterioration risk.
The level structure is clean and, combined with the current volatility regime, makes this chart more about decision zones than forecasting. With support ~32.0100, the primary question is whether price can continue to defend that area while the broader, weaker ranks (weekly #1132, monthly #1171) remain a headwind. When mid-horizon ranks are in the weaker cohort, support tests tend to carry higher informational value because breaks can coincide with renewed relative underperformance.
On the upside, resistance ~34.8217 is the key confirmation threshold in the provided scenario framing. Importantly, this is not only a price statement: it is aligned with the broader signal mix that is currently Neutral-to-mixed on momentum (RSI Neutral; MACD histogram -0.0533) while still showing several bullish micro-signals inside the 18-signal dashboard. A resistance break that occurs alongside improving momentum characteristics would be more consistent with a regime transition than a single-session spike.
The compression implied by Bollinger bandwidth 0.0259 increases the probability that outcomes cluster around these boundaries. If price remains inside the band, the more realistic interpretation is range negotiation. If price leaves the range, the next evaluation step becomes whether the move is supported by confirming behavior in the technical dashboard and, ideally, a subsequent improvement in the relative ranks (especially weekly).
5) Quant Technical Dashboard (18 Signals)
KGNAI AI Technical Analysis Score (Deep Reinforcement Learning): Rank #914 out of 1248 (Rank 1 represents the strongest technical positioning and a higher probability of favorable price behavior. As ranks increase toward the maximum, the probability of favorable outcomes weakens and bearish positioning becomes more dominant.) | Label: Neutral | Score: -0.465
18-Signal Technical Confluence Score: 0.333 (Bullish)
Overall Technical Score (18-signal confluence + DRL rank blend): 0.094 (Neutral)
Note: The blended score reflects signal strength weighted against broader AI technical ranking, which may temporarily diverge.
Blended technical score breakdown: 0.094 (Neutral | Bull 10 / Bear 4 / Neutral 4)
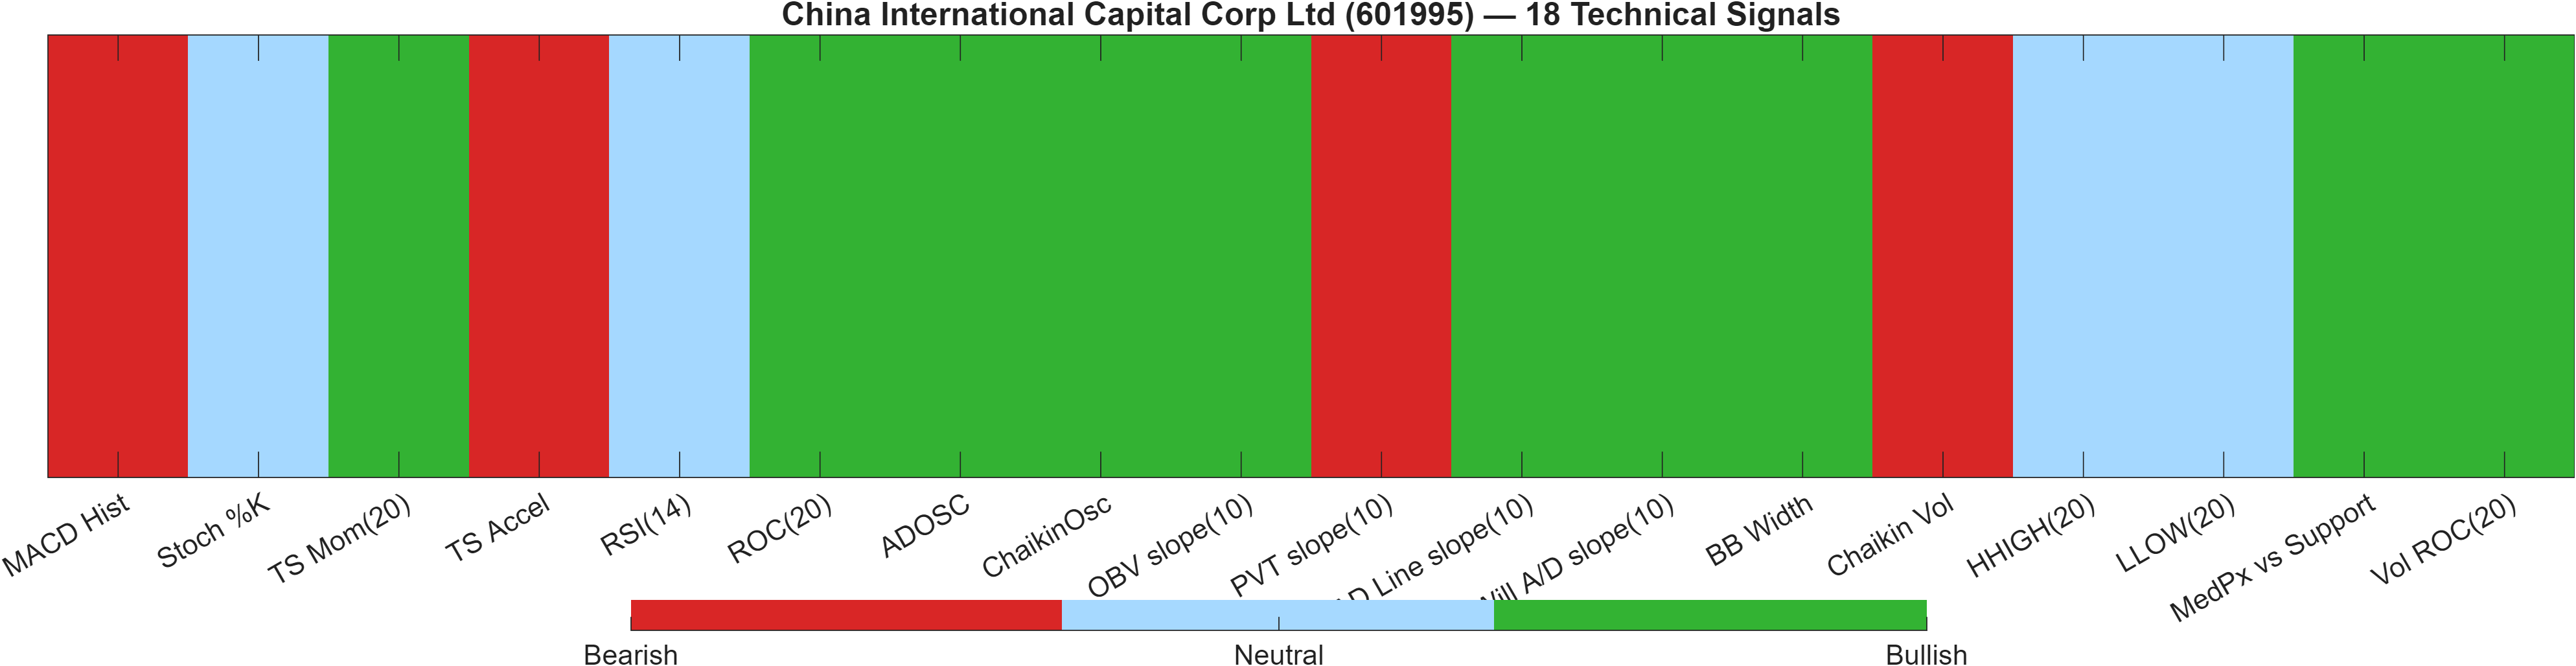
The technical dashboard highlights a confluence-versus-ranking divergence. On one hand, the 18-signal confluence score is 0.333 (Bullish), supported by a signal balance of Bull 10 / Bear 4 / Neutral 4. On the other hand, the DRL technical rank is #914 out of 1248 with a Neutral label and a score of -0.465. When the confluence reads bullish but the AI rank remains weaker, the typical interpretation is that micro-signals have improved, yet the broader pattern characteristics the model prefers (trend structure, persistence, or stability) have not fully aligned.
A few indicator specifics help explain the blend without turning the section into a table readout. Momentum is mixed: RSI(14) at 49.65 is neutral, while MACD Hist -0.05334 is bearish, a combination that often corresponds to slow downside impulse rather than an aggressive selloff. Meanwhile, some rate/flow features lean constructive, including ROC(20) at 1.051 (bullish) and ADOSC at 11.72 (bullish), indicating that not all internal measures are deteriorating simultaneously.
Volatility and range framing also matters: BB Width 0.02589 is flagged bullish in the table and aligns with the standalone bandwidth reading (0.0259), suggesting a contained regime where breakouts can be more informative than oscillations. In that context, the overall blended technical score of 0.094 (Neutral) is coherent: the dashboard is not signaling broad capitulation, but it is also not delivering a decisive trend-alignment profile. The nearest validation remains the level map: 34.8217 on the upside and 32.0100 on the downside.
Signal table (Bull/Bear/Neutral)
| Indicator | Value | Signal |
|---|---|---|
| MACD Hist | -0.05334 | Bearish |
| Stoch %K | 21.95 | Neutral |
| TS Mom(20) | 0.3567 | Bullish |
| TS Accel | -1.577 | Bearish |
| RSI(14) | 49.65 | Neutral |
| ROC(20) | 1.051 | Bullish |
| ADOSC | 11.72 | Bullish |
| ChaikinOsc | 4.98e+06 | Bullish |
| OBV slope(10) | 5.352e+07 | Bullish |
| PVT slope(10) | -6.642e+04 | Bearish |
| AD Line slope(10) | 2.033e+07 | Bullish |
| Will A/D slope(10) | 0.81 | Bullish |
| BB Width | 0.02589 | Bullish |
| Chaikin Vol | 1.562 | Bearish |
| HHIGH(20) | 34.93 | Neutral |
| LLOW(20) | 33.71 | Neutral |
| MedPx vs Support | 2.53 | Bullish |
| Vol ROC(20) | 8.06 | Bullish |
Interpretation: Indicator-level signals form the base confluence, which is then adjusted using a separate AI-driven technical ranking model. The final technical score summarizes this combined view.
6) News sentiment + extractive gist
Note: Instrument-specific news matches were not found, so the digest includes broader market/sector headlines. Links are provided for verification.
Sentiment score (avg): -0.031 | Positive: 0% | Neutral: 94% | Negative: 6%
KGNAI AI News Sentiment Score (normalized -1 to +1): 1.00 (as of 2026-04-18) | Label: Bullish | Overall news score: 0.94
Positive Developments
Recent coverage across major financial outlets indicates a constructive sentiment overlay in the aggregated KGNAI scoring even though the underlying distribution is dominated by neutral items. The normalized sentiment score of 1.00 alongside an overall news score of 0.94 suggests that, when sentiment is detected as positive, it is being classified as strongly positive rather than marginally so. This matters most when paired with the technical backdrop: with Bollinger bandwidth 0.0259 indicating a relatively compressed volatility regime, shifts in narrative tone can sometimes coincide with breakout attempts or short-term stabilization in price action. However, the absence of instrument-specific matches limits the confidence of direct causal linkage to 601995; the more defensible use of this component is as a contextual bias layered on top of the rank and indicator evidence rather than a standalone driver.
Neutral / Mixed Developments
The news mix is overwhelmingly neutral by the provided classification, with Neutral at 94% and Positive at 0%, which points to an information flow that is largely informational rather than catalyst-driven. In that setting, price tends to be governed more by internal market mechanics—trend structure versus moving averages and momentum signals—than by discrete headline shocks. This neutral dominance also explains why the average sentiment score is only slightly negative at -0.031 even as the normalized model output reads bullish: the average is pulled toward zero by the volume of neutral items. For interpretation, this is a “low temperature” tape from a narrative perspective, leaving 32.0100 and 34.8217 as the more practical near-term reference points.
Negative / Risk Signals
The negative component is present but limited in share, with Negative at 6%. Even a small negative allocation can matter when other parts of the dashboard show fragility—namely MACD histogram at -0.0533 and a rank structure where weekly (#1132) and monthly (#1171) remain in the weaker cohort. In other words, modest risk tone can become more influential when technical conditions are not yet decisively supportive. With volatility relatively compressed (0.0259 bandwidth), risk items can act less as long-duration fundamentals and more as triggers that test nearby supports. Within the constraints of the provided data (no instrument-specific matches), the appropriate stance is to treat negative items as potential accelerants if price approaches 32.0100, rather than as a confirmed driver of a new trend.
- Whether price action and volume confirm a break above 34.8217 versus repeated rejection.
- Whether momentum improves from MACD hist -0.0533 toward non-negative readings while RSI remains constructive.
- Whether the weekly rank (#1132) begins to improve toward the mid-universe, reducing the cross-horizon divergence.
Sources referenced: Reuters, Bloomberg, Yahoo Finance, MarketWatch, Investing.com
Snapshot: AI Rank (Short–Mid–Long): Bearish (Bearish–Bearish–Not available) · Technical Confluence: Bullish · Key Levels: Support ~32.01 | Resistance ~34.82 · News Sentiment: Neutral
7) Sources
Not available in the provided data.
You may also like: How KGNAI AI ranks instruments across global markets
Disclaimer: KGNAI provides AI-generated analytics and educational market commentary only. This is not financial advice. Markets involve risk. Always do your own research.