
601838 — Bank of Chengdu Co Ltd | 22-Feb-2026 — Long-term strength, short-term signals still require confirmation
Bank of Chengdu Co Ltd (601838) currently shows a split profile across horizons: longer-term KGNAI ranks remain strong while shorter-term positioning is more neutral, and the blended technical score stays bearish. Within a 1294-instrument China universe, the 6‑Monthly rank (#7) and Yearly rank (#13) point to upper-decile relative strength, but the Daily rank (#537) and Weekly rank (#940) suggest near-term behavior is less aligned. On classical technical structure, the snapshot explicitly flags close vs MA50 as Bullish while MA50 vs MA200 is Bearish, a common transition state where trend direction is still being negotiated across timeframes. Momentum reads mixed—RSI(14) at 29.09 is labeled bearish while MACD histogram at -0.0177 remains negative—alongside a relatively tight volatility regime (Bollinger bandwidth 0.0386). Key decision levels are well-defined at support ~15.6067 and resistance ~16.5050, with news tone broadly neutral (0.010 average sentiment).
- Rank stance: Short-term Neutral (Daily #537; Weekly #940) | Mid-term Bullish (Monthly #151; 3‑Monthly #69) | Long-term Bullish (6‑Monthly #7; Yearly #13)
- Technical confluence label: 18-signal score Neutral (-0.111) while blended score Bearish (-0.319) is pressured by AI technical rank (#1168/1294)
- Key levels: Support ~15.6067 | Resistance ~16.5050
- News sentiment bias: Neutral (avg 0.010; 12% positive / 75% neutral / 12% negative)
- Confirmation / invalidation: A constructive setup would be more credible on a break above 16.5050 with volume; a close below 15.6067 increases deterioration risk per the scenario guide.
KGNAI evaluates assets using large cross-sectional datasets built from millions of structured data points. Inputs incorporate fundamental metrics, technical structures, and systematically processed news sentiment. Statistical models, machine learning, and AI frameworks are used to assess relative positioning, signal alignment, and probabilistic behavior across broad universes.
- Ranks are comparative across the tracked universe, not absolute price targets.
- Confluence reflects alignment among independent signal groups.
- Support/resistance levels are probabilistic decision zones, not guarantees.
- Sentiment provides contextual bias within the broader analytical framework.
1) KGNAI AI Analysis
Region: CHINA
Total universe size: 1294 ranked instruments
- Daily rank: #537 out of 1294 — Neutral
- Weekly rank: #940 out of 1294 — Neutral
- Monthly rank: #151 out of 1294 — Bullish
- 3-Monthly rank: #69 out of 1294 — Bullish
- 6-Monthly rank: #7 out of 1294 — Bullish
- Yearly rank: #13 out of 1294 — Bullish
Cross-horizon alignment: strong long-term placement vs near-term neutrality
The rank stack is notably time-fractured. Longer windows place 601838 in the upper decile of the tracked universe (#7 over 6 months and #13 over a year), which typically corresponds to more persistent relative strength characteristics. Mid-horizon ranks remain constructive as well—#69 (3‑Monthly) and #151 (Monthly)—suggesting the multi-month context still leans favorable versus peers.
The short end is less committed. A Daily rank of #537 sits closer to the middle of the 1294-name universe, while the Weekly rank of #940 drops into a weaker relative bucket. This kind of dispersion often appears when a longer-term uptrend (or long-term relative leadership) is undergoing a near-term consolidation or drawdown, leaving short-term tests inconclusive without a clear follow-through.
The term view stated in the dataset—Short-term: Neutral; Mid-term: Bullish; Long-term: Bullish—captures the same structure: longer-horizon behavior remains the dominant positive feature, but short-horizon ranking has not yet re-synchronized. For process discipline, this is a “wait-for-confirmation” regime where incremental evidence (price structure, momentum, and volume) matters more than any single rank snapshot.
2) Price & trend overview
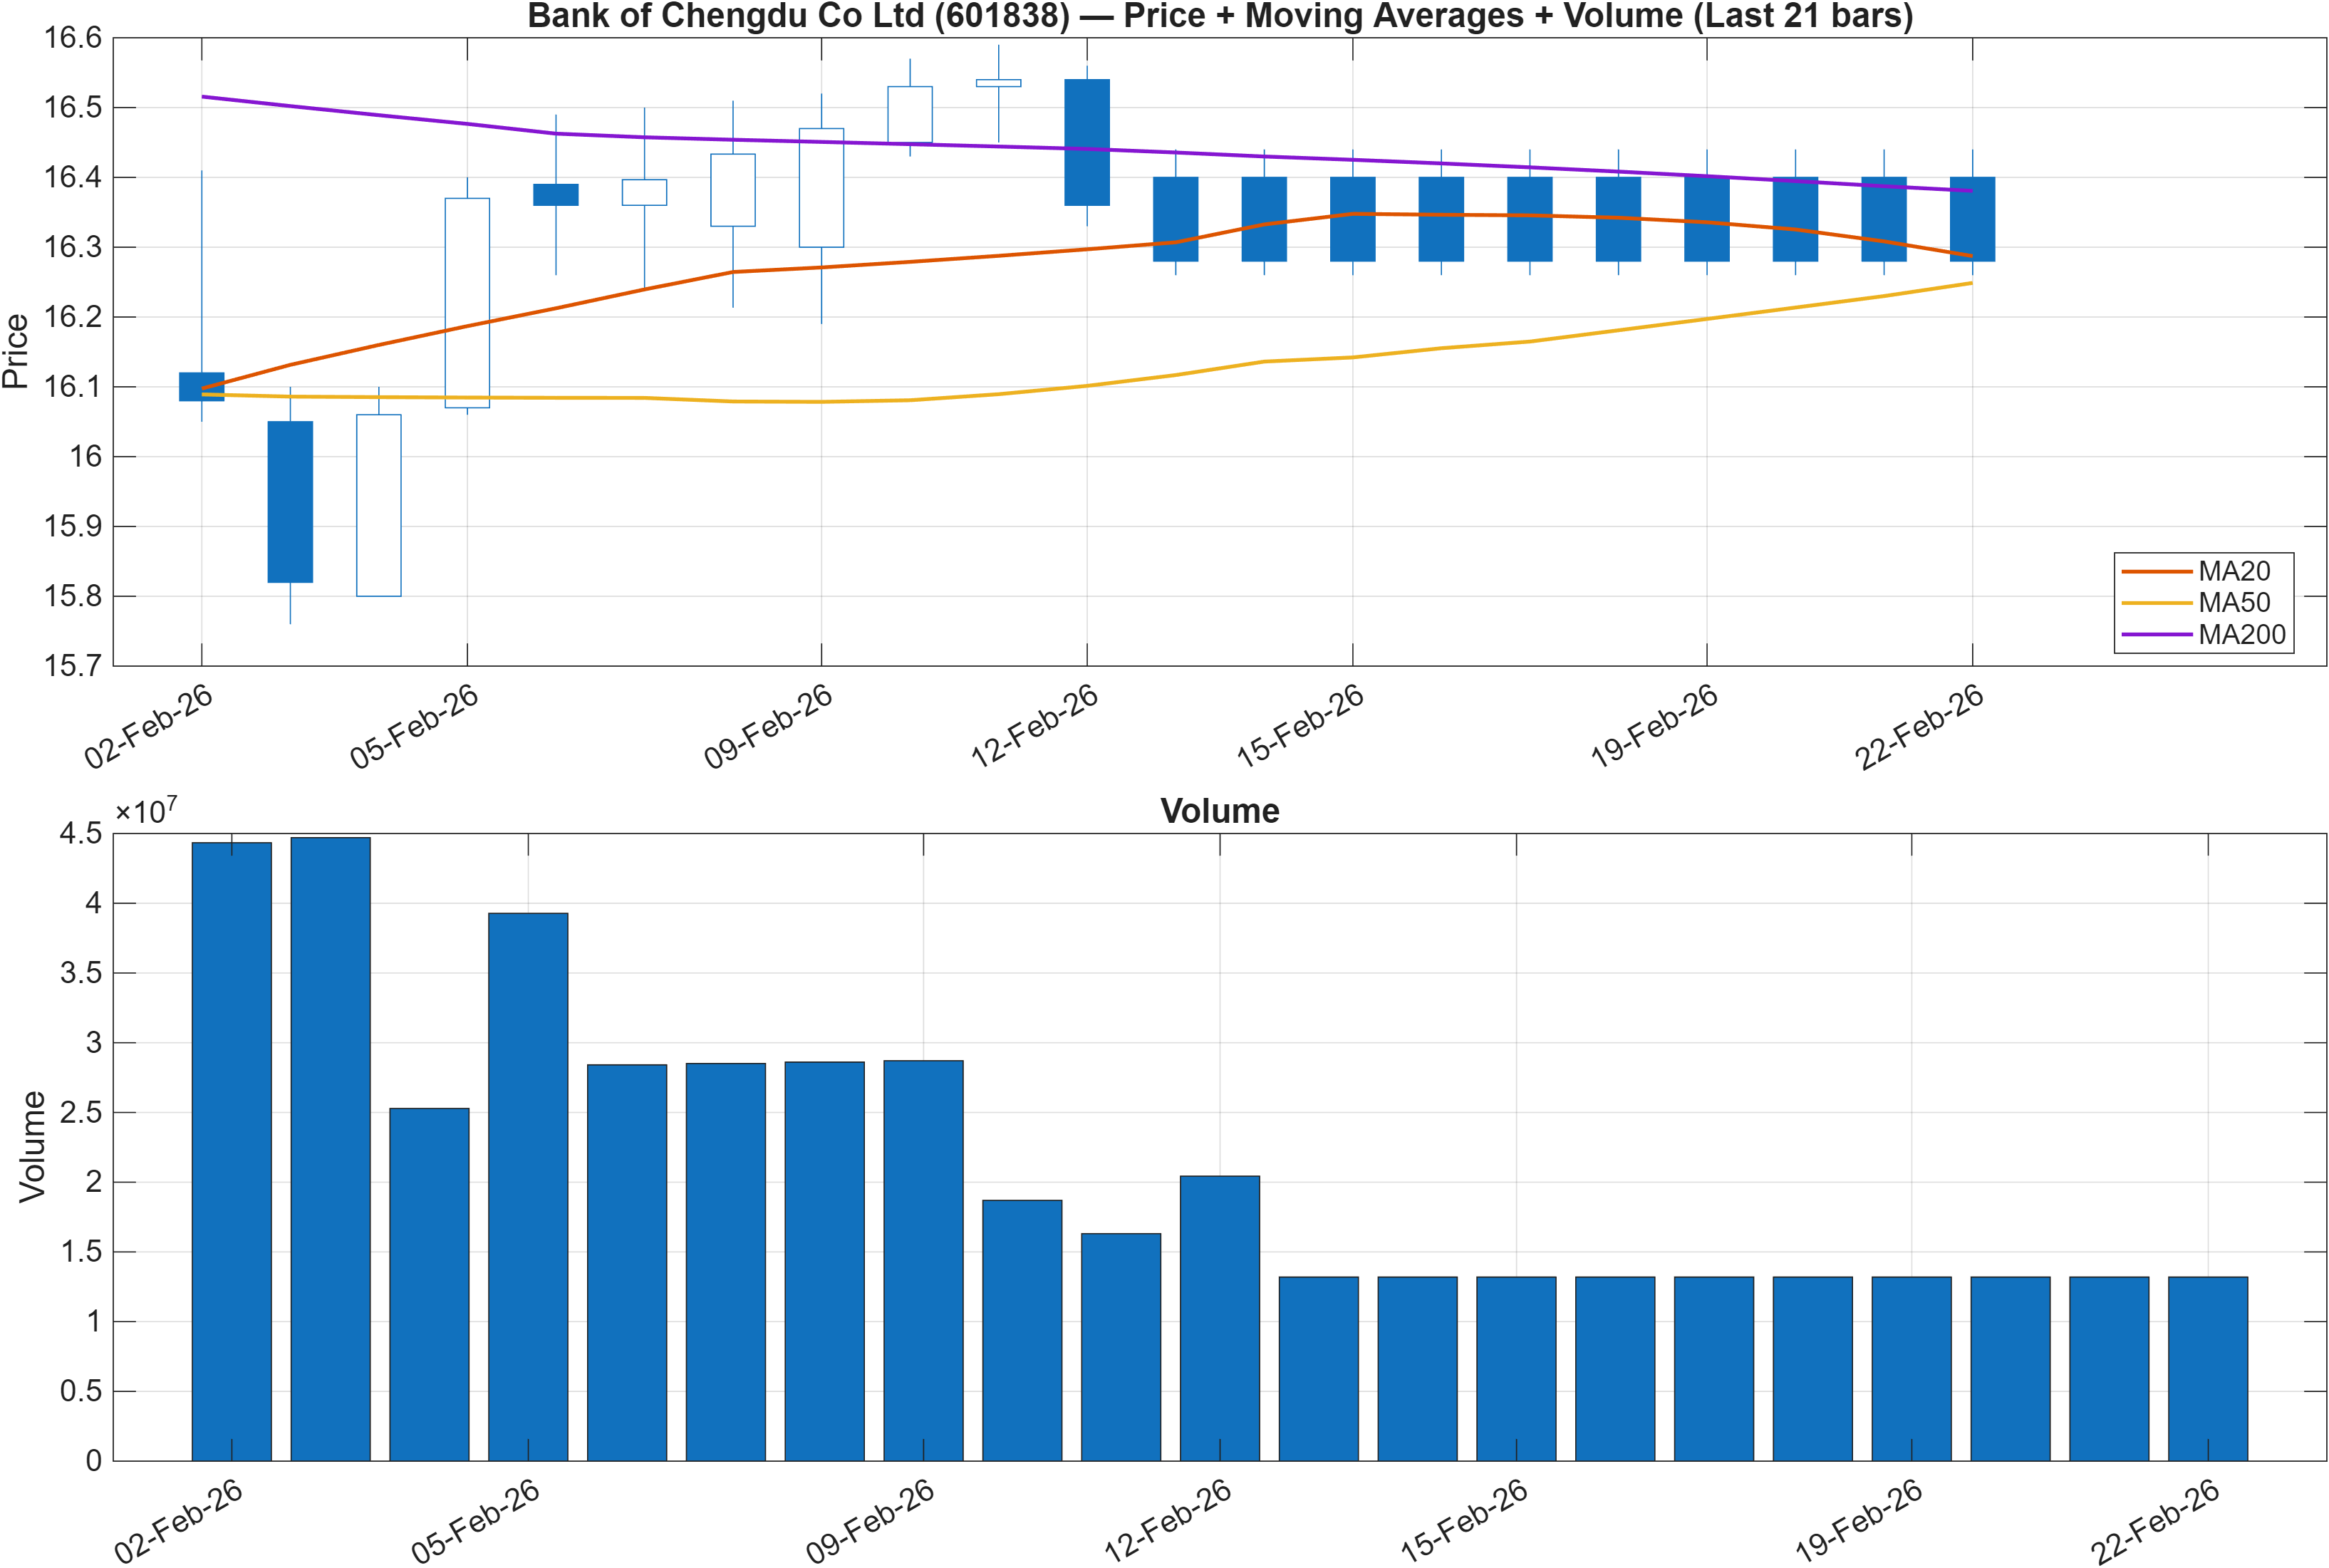
Regime tension: bullish near-term positioning vs bearish long moving-average slope
The interpretation provided is explicitly mixed: close vs MA50 = Bullish, yet MA50 vs MA200 = Bearish. That combination tends to occur when price is stabilizing or recovering enough to regain a medium-term average, while the longer-term trend filter (MA50 relative to MA200) has not rotated positive. In practice, it places more weight on whether the recovery can persist long enough to improve the long moving-average relationship, rather than treating a single bounce as a structural trend change.
The rank profile reinforces this “two-speed” setup. Long-horizon ranks (#7 6‑Monthly; #13 Yearly) indicate the instrument has scored well on broader probability-of-favorable-behavior tests over extended windows, but near-term ranks (#940 Weekly) show that recent tape behavior has not been uniformly supportive. When price is above MA50 but the MA50/MA200 trend stack remains bearish, short-horizon outcomes can be more sensitive to positioning shifts and marginal volume changes.
With nearby reference levels at support ~15.6067 and resistance ~16.5050, trend interpretation becomes more conditional than directional: holding above support while working toward resistance would be consistent with stabilization; repeated rejection below resistance would be consistent with range-bound digestion; and any failure below support would align with the weaker weekly rank and the still-bearish longer trend filter. This framework keeps the analysis anchored to observable structure rather than narrative.
3) Momentum & volatility dashboard
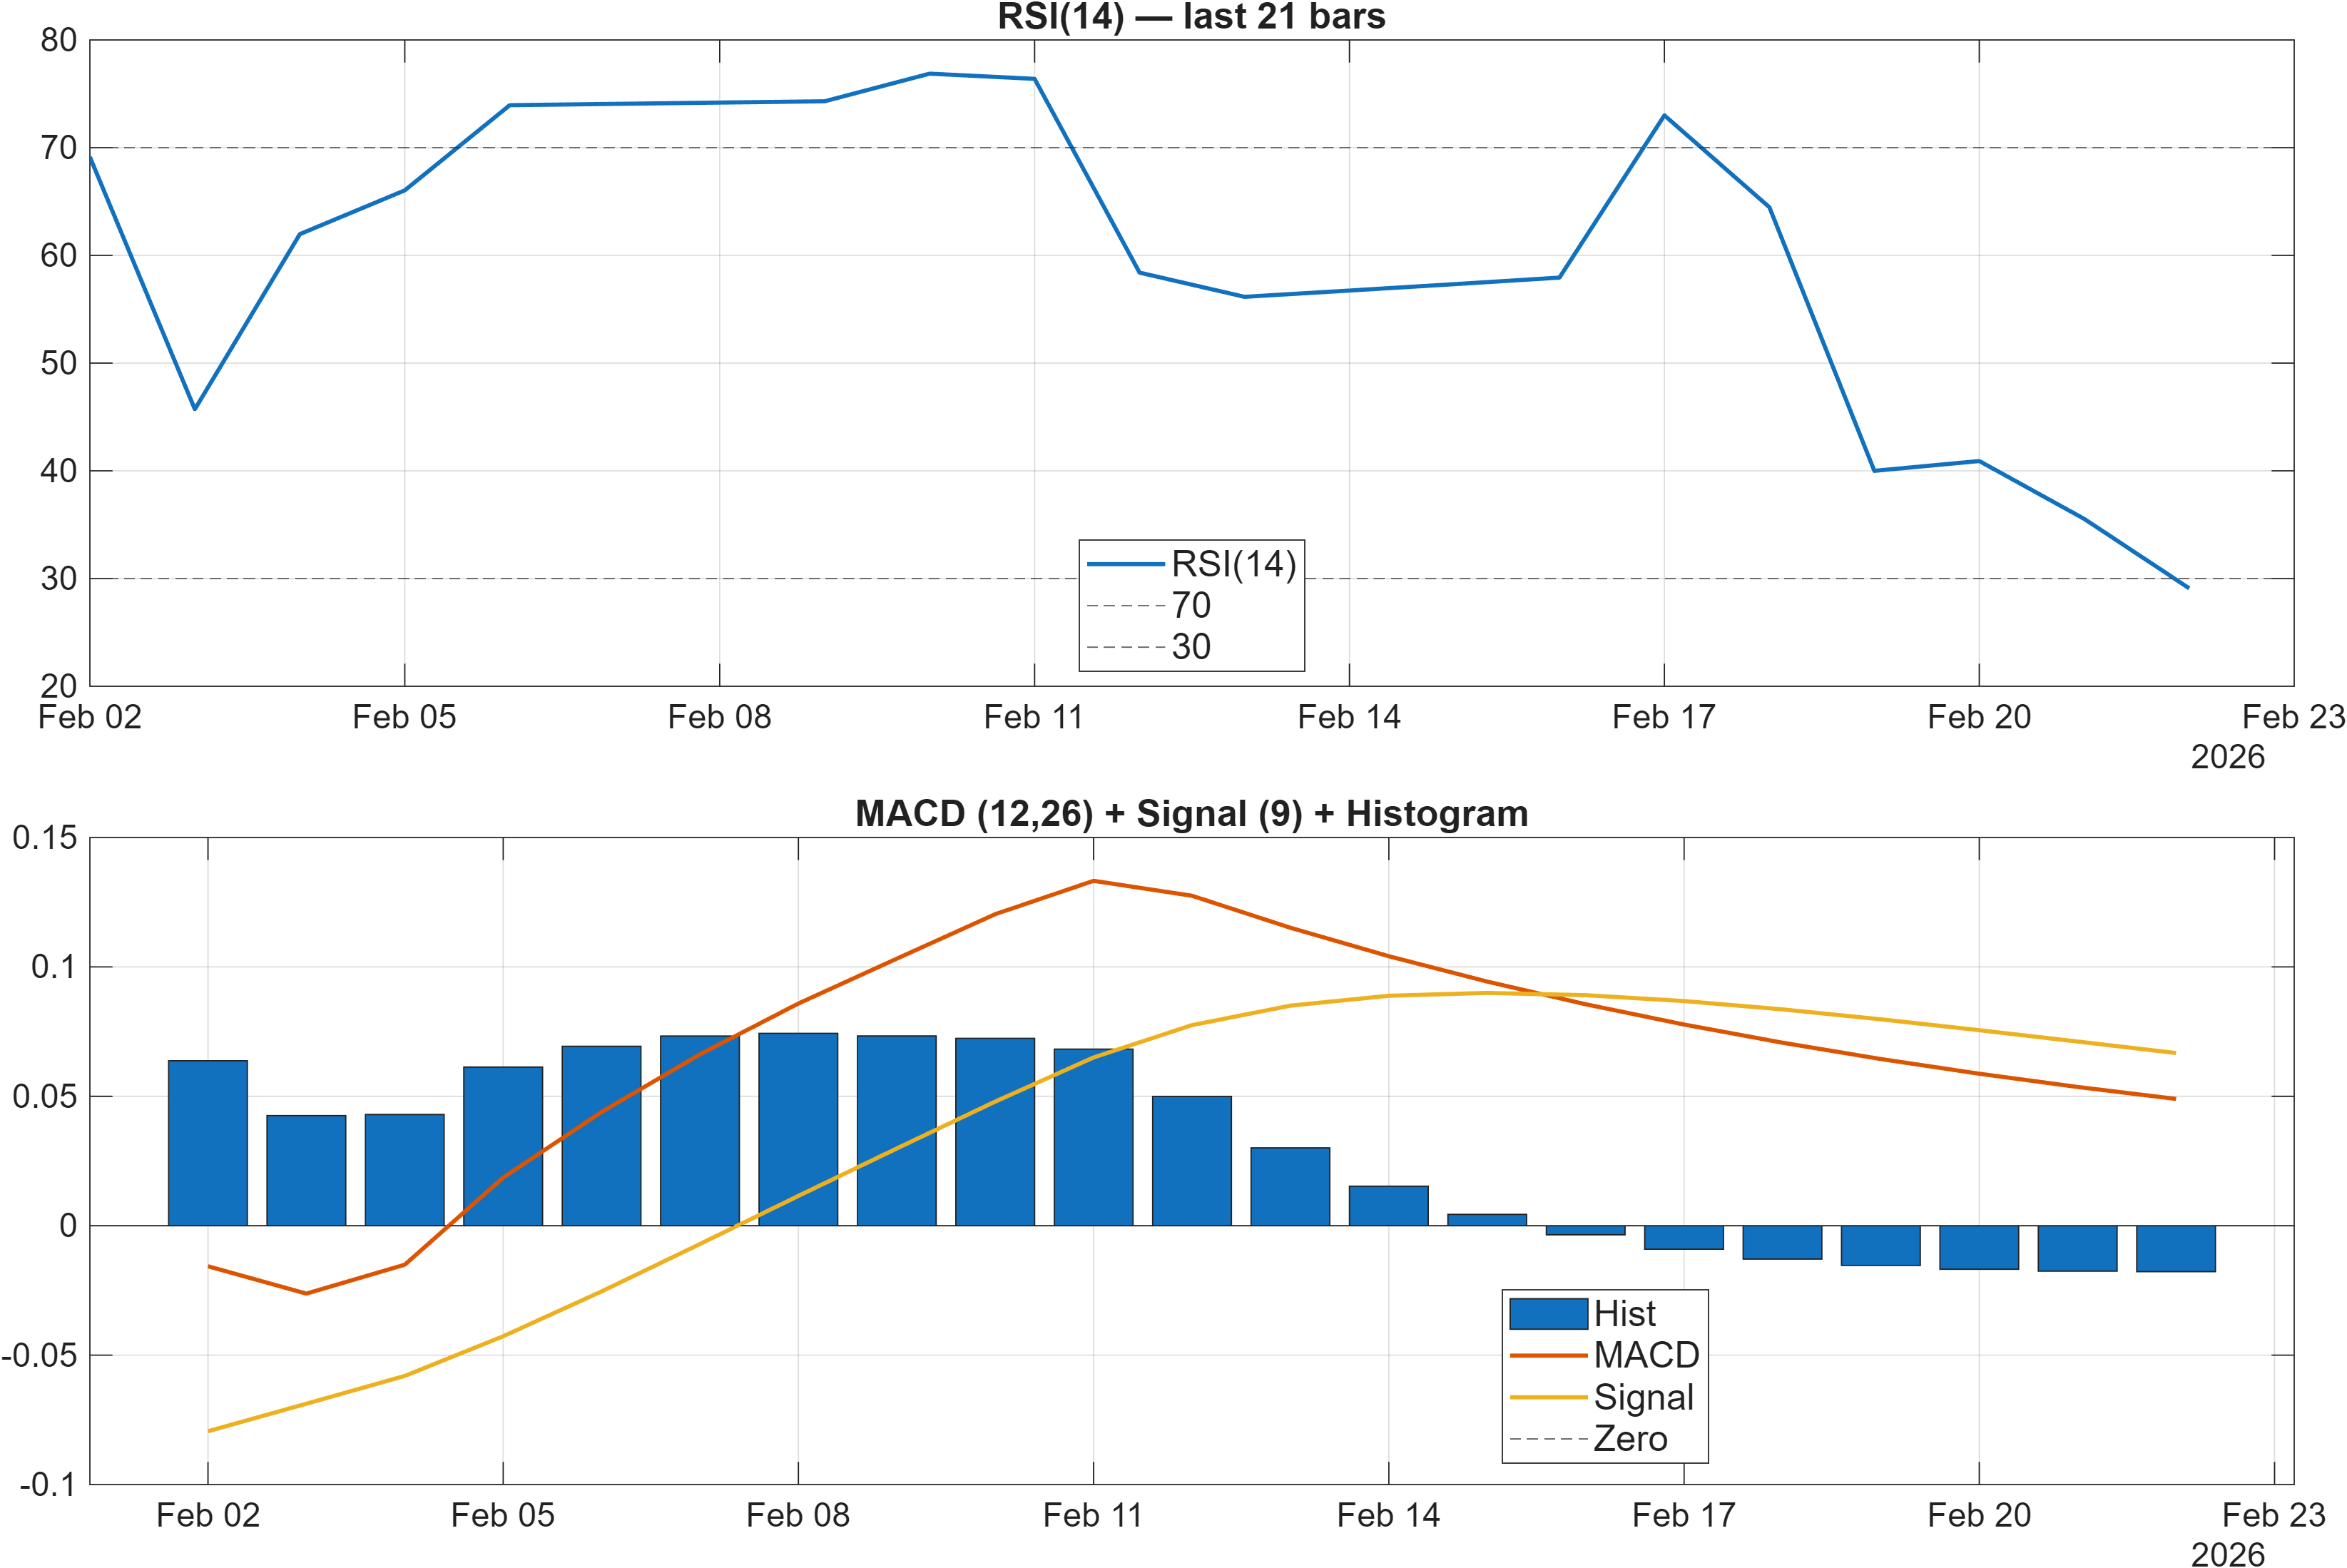
Interpretation: RSI bias = Bearish, MACD hist = -0.0177.
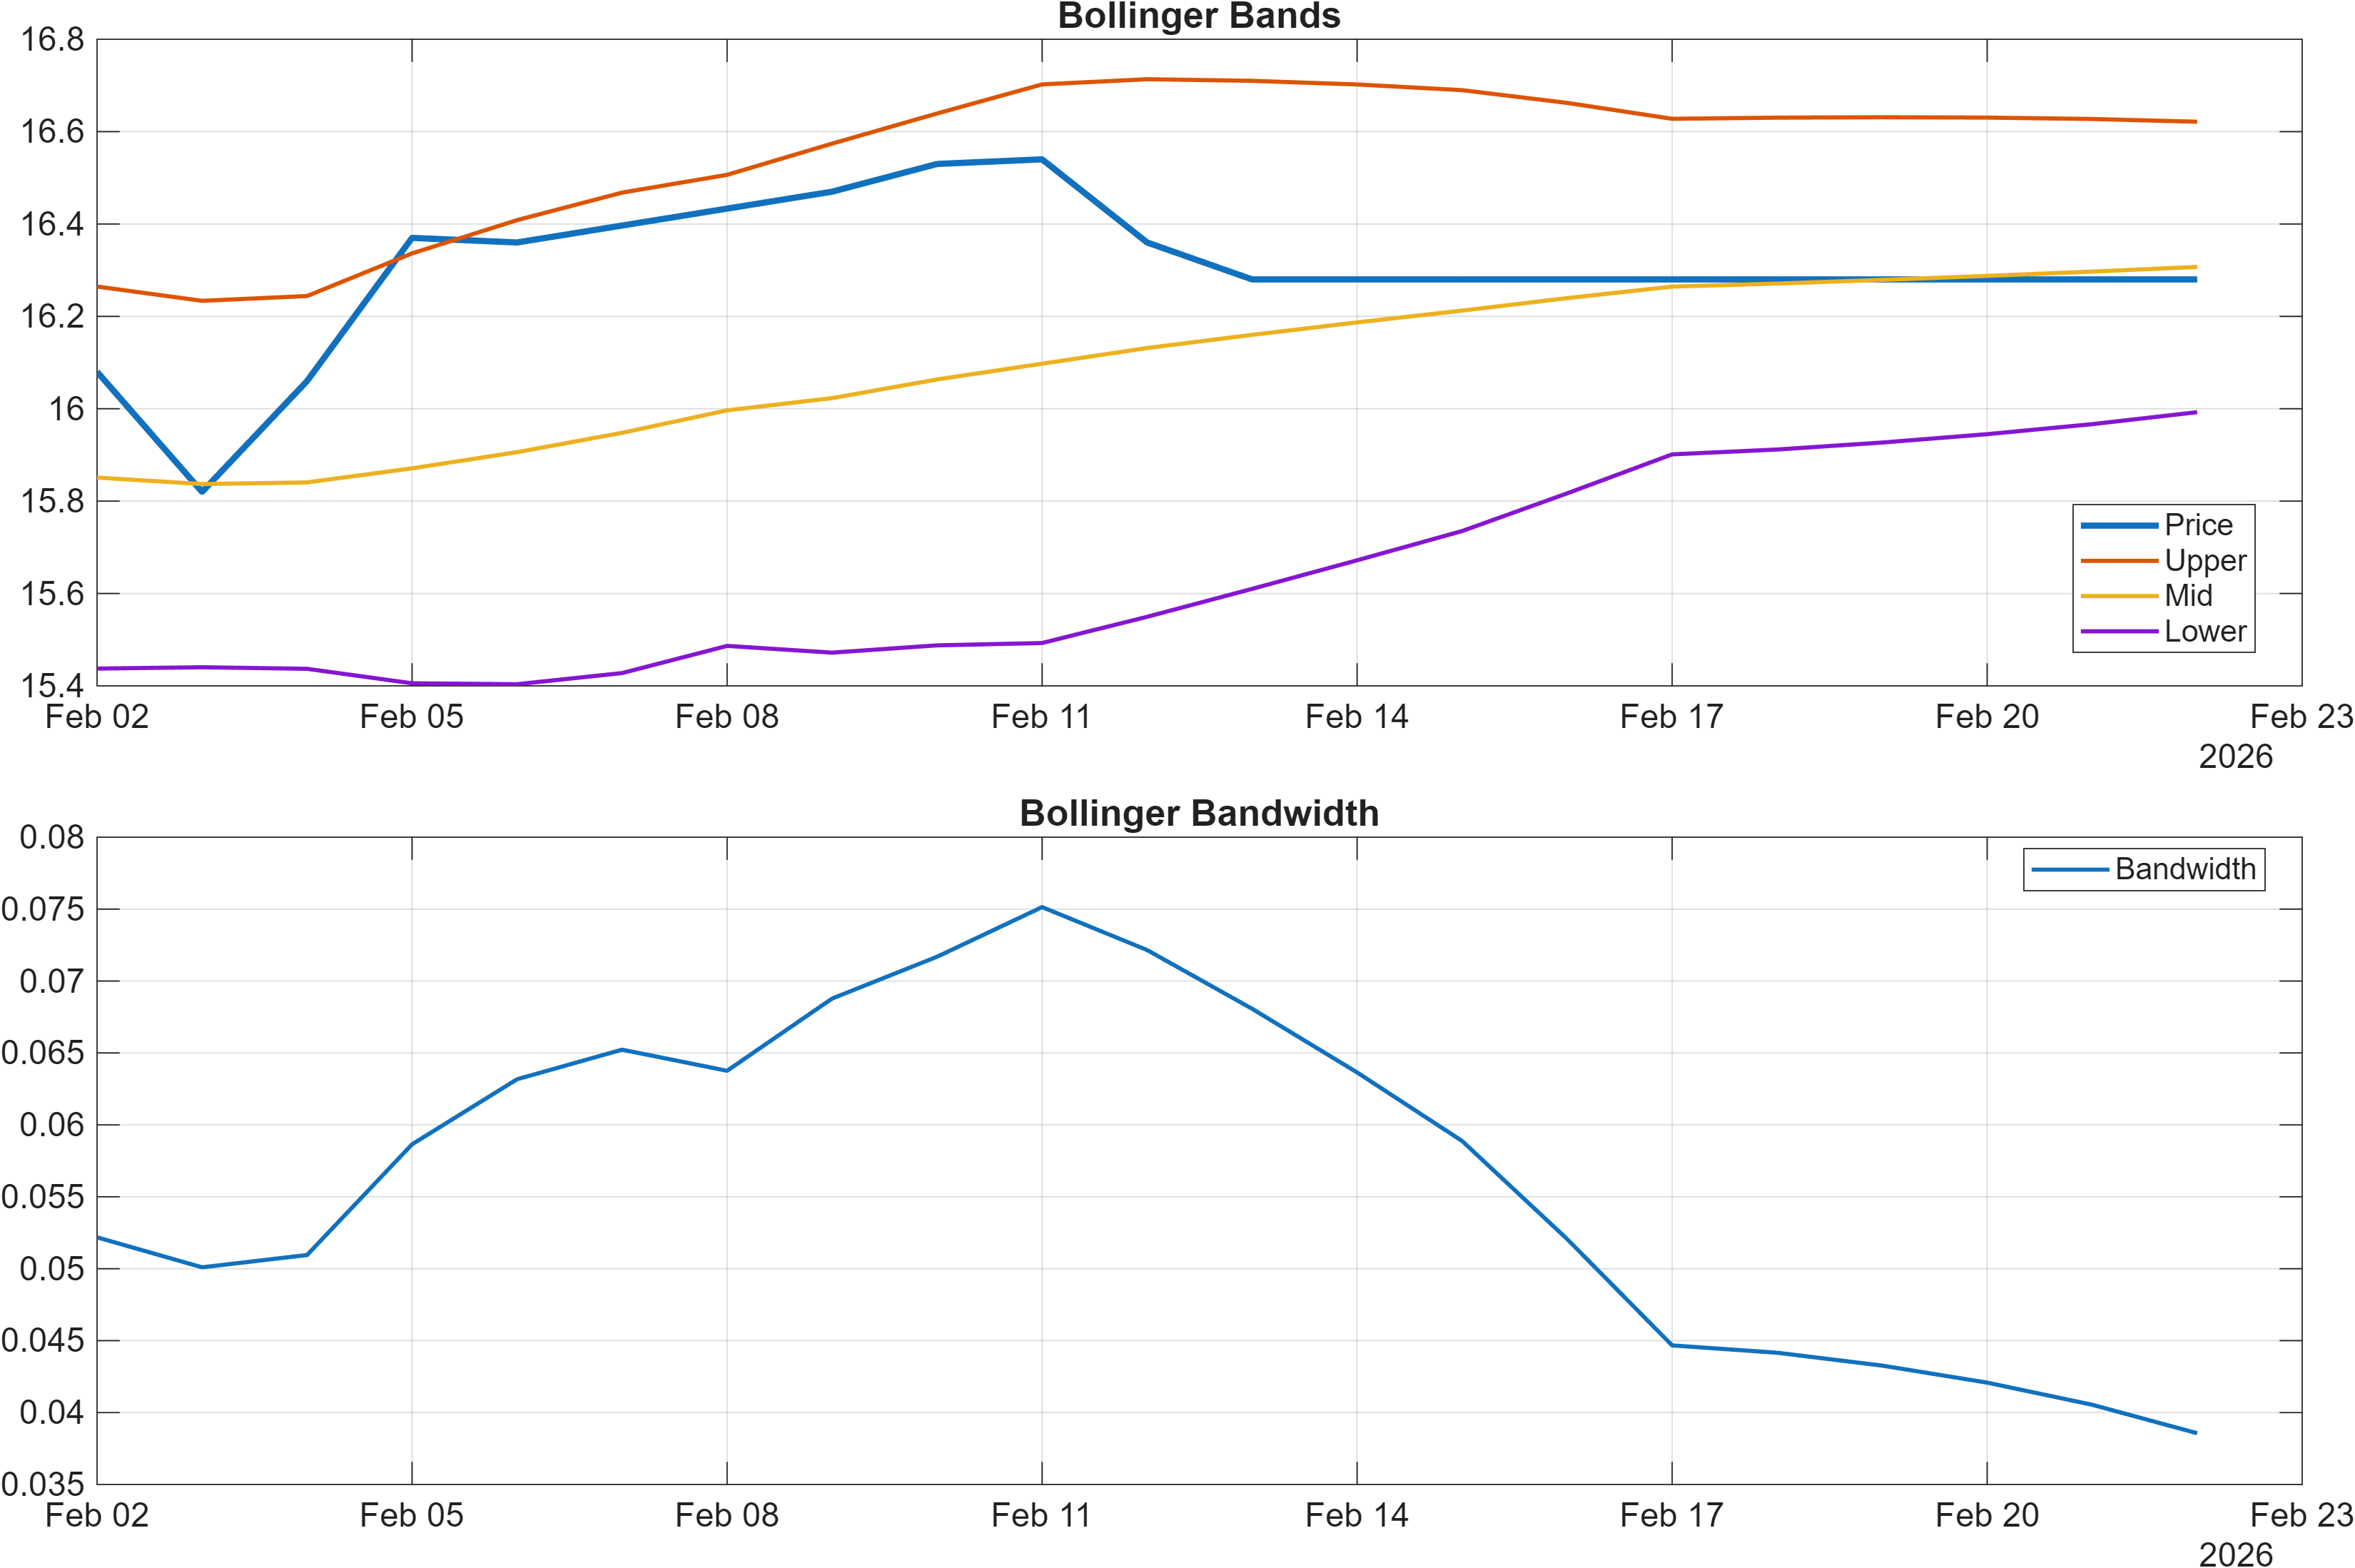
Interpretation: Bandwidth (volatility regime) latest = 0.0386.
Signal compression vs follow-through: oversold RSI with still-negative MACD
Momentum reads defensive despite longer-term rank strength. RSI(14) at 29.09 is labeled bearish, indicating weak recent momentum and an oversold-leaning condition by common RSI conventions. At the same time, the MACD histogram at -0.0177 remains negative, which is consistent with the idea that downside momentum has not fully resolved into a positive trend impulse. This pairing often describes a market that may be stabilizing, but is not yet confirming a durable upswing in medium-term momentum.
Volatility is relatively compressed: Bollinger bandwidth at 0.0386 suggests a tighter regime compared with expansionary phases. Compression can set the stage for larger moves, but direction typically becomes clearer only when momentum indicators begin to align—e.g., RSI recovering out of the weak zone while MACD improves (histogram rising toward zero). Without that, short-horizon ranks such as the Weekly #940 can remain vulnerable to abrupt reversals.
The dashboard’s mixed state is also consistent with the broader structure: medium-to-long ranks are strong (#69 3‑Monthly; #7 6‑Monthly), yet near-term conditions are still heavy. In this configuration, traders and allocators often differentiate between “mean-reversion risk management” (given low RSI) and “trend validation” (given negative MACD and bearish MA50 vs MA200). The data argues for treating momentum confirmation—rather than volatility compression alone—as the deciding evidence.
4) Support / Resistance zones
Support ~ 15.6067 | Resistance ~ 16.5050
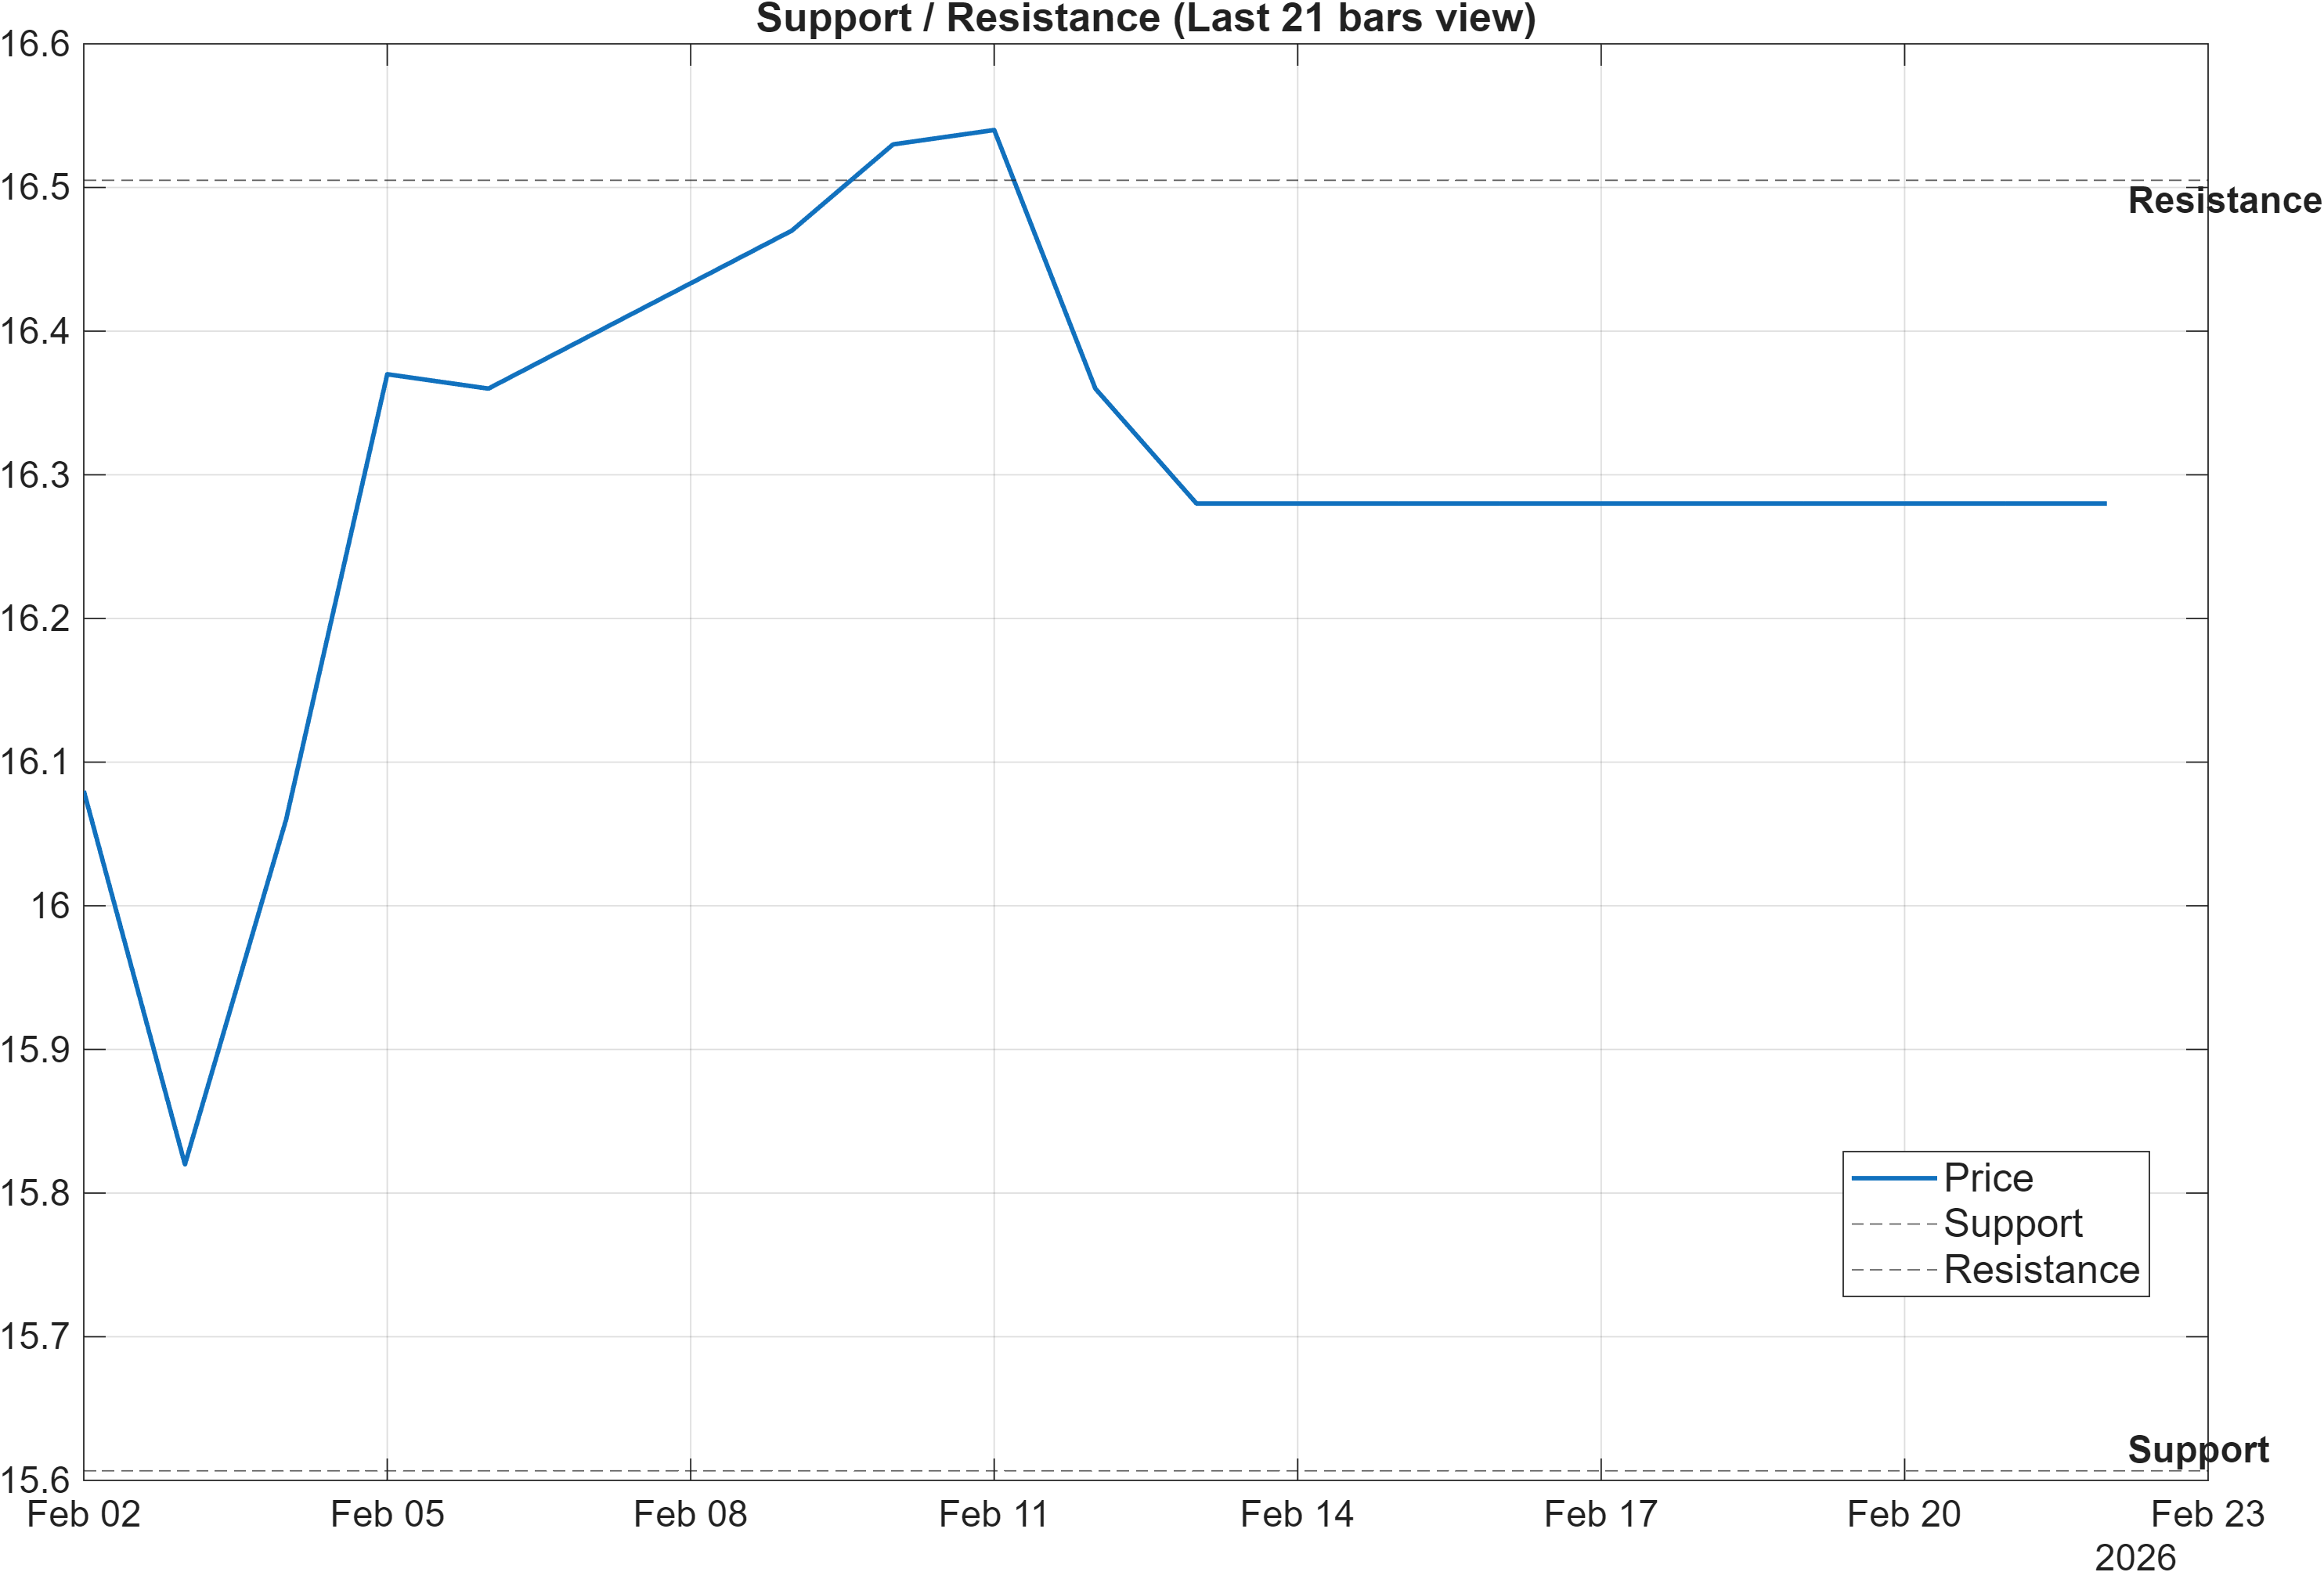
Probabilistic decision zones: defining risk around a tight operating range
The current technical map provides clean decision points: 15.6067 as support and 16.5050 as resistance. With volatility compressed (bandwidth 0.0386), these levels become more influential because price can oscillate in narrower bands until a catalyst (technical or flow-driven) triggers expansion. In such regimes, the quality of the break—especially participation/volume—is often more informative than the first touch of a level.
The scenario guidance is explicit: a break above resistance with volume supports continuation, while a close below support increases deterioration risk. This framing is particularly relevant given the conflicting trend signals—bullish close vs MA50 but bearish MA50 vs MA200—because it avoids over-interpreting an intermediate moving-average reclaim without structural follow-through. It also contextualizes the weaker short-horizon rank (#940 Weekly), which can coincide with failed break attempts or range breakdowns.
Momentum context adds nuance. With RSI(14) at 29.09 labeled bearish and MACD histogram at -0.0177, an upside test of 16.5050 that occurs without improving momentum would be more prone to rejection than one accompanied by RSI recovery and a rising MACD histogram. Conversely, a decisive move below 15.6067 would align with the bearish momentum read and would likely place greater weight on the bearish components of the technical dashboard (including the blended score discussed later). The levels therefore act as a practical bridge between indicator interpretation and actionable risk definition.
5) Quant Technical Dashboard (18 Signals)
KGNAI AI Technical Analysis Score (Deep Reinforcement Learning): Rank #1168 out of 1294 (Rank 1 represents the strongest technical positioning and a higher probability of favorable price behavior. As ranks increase toward the maximum, the probability of favorable outcomes weakens and bearish positioning becomes more dominant.) | Label: Bearish | Score: -0.805
18-Signal Technical Confluence Score: -0.111 (Neutral)
Overall Technical Score (18-signal confluence + DRL rank blend): -0.319 (Bearish)
Note: The blended score reflects signal strength weighted against broader AI technical ranking, which may temporarily diverge.
Blended technical score breakdown: -0.319 (Bearish | Bull 6 / Bear 8 / Neutral 4)
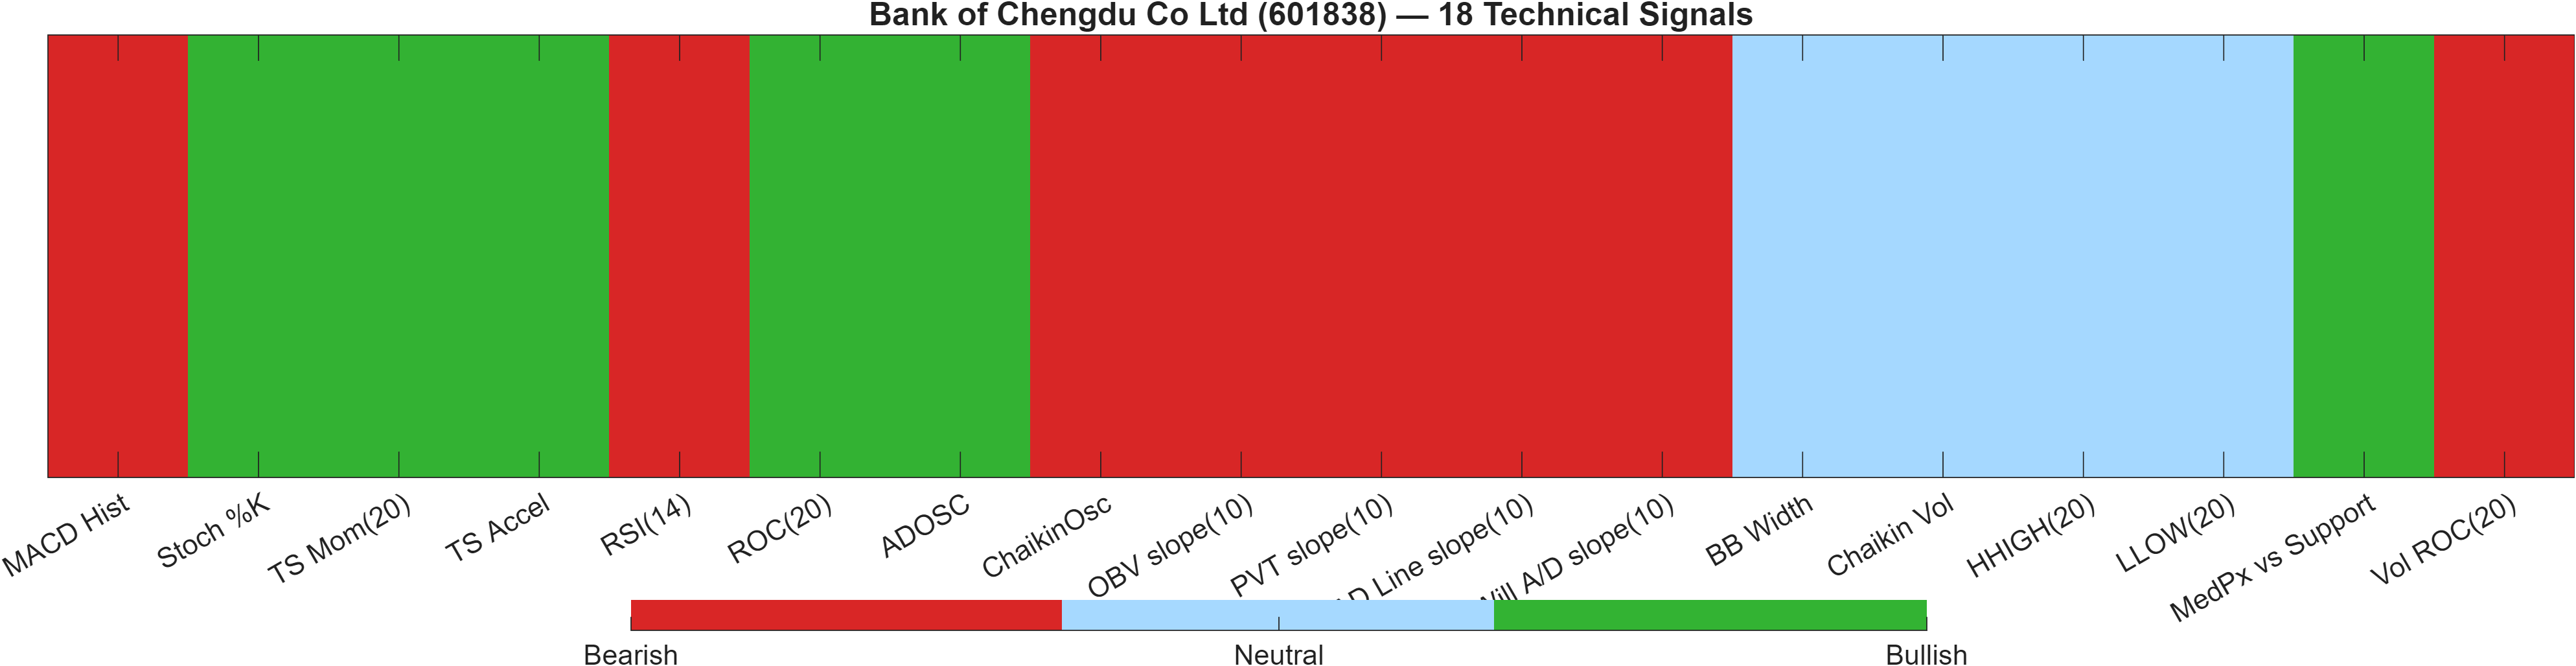
Confluence vs AI technical rank: mild neutrality overridden by weak model positioning
This section is where the internal disagreement becomes quantifiable. The 18-signal confluence score is -0.111 (Neutral), implying the classic indicator set is only slightly tilted negative. However, the separate Deep Reinforcement Learning technical model places the instrument at #1168 out of 1294 with a -0.805 score and a bearish label—deep into the weaker tail of the universe. When blended, the overall technical score becomes -0.319 (Bearish), explicitly indicating that broader AI-ranked technical context is acting as a headwind even though the indicator set alone is closer to flat.
Indicator composition: momentum weakness and volume/flow drag vs selective bullish pockets
The signal breakdown (Bull 6 / Bear 8 / Neutral 4) suggests bears have a narrow edge. Several momentum components are soft—RSI(14) 29.09 and MACD histogram -0.01773 are both bearish—while some measures still print constructive (e.g., Stoch %K 11.11 labeled bullish and ROC(20) 2.908 bullish). That mix can occur when a market is deeply stretched on certain oscillators yet still lacks trend confirmation.
Importantly, multiple volume/accumulation proxies skew negative, including OBV slope(10) -1.32e+07 and Vol ROC(20) -70.48 (bearish). In tight bandwidth regimes (BB Width 0.03856 neutral), deteriorating volume signatures can reduce the reliability of upside attempts. Net, the dashboard argues for treating any bullish resolution as needing evidence beyond a single oscillator rebound—specifically, improvement in participation and trend-following measures to counterbalance the bearish blended score.
Signal table (Bull/Bear/Neutral)
| Indicator | Value | Signal |
|---|---|---|
| MACD Hist | -0.01773 | Bearish |
| Stoch %K | 11.11 | Bullish |
| TS Mom(20) | 0.46 | Bullish |
| TS Accel | 0.63 | Bullish |
| RSI(14) | 29.09 | Bearish |
| ROC(20) | 2.908 | Bullish |
| ADOSC | 16.67 | Bullish |
| ChaikinOsc | -2.939e+07 | Bearish |
| OBV slope(10) | -1.32e+07 | Bearish |
| PVT slope(10) | -6.454e+04 | Bearish |
| AD Line slope(10) | -1.026e+08 | Bearish |
| Will A/D slope(10) | -0.16 | Bearish |
| BB Width | 0.03856 | Neutral |
| Chaikin Vol | -19.09 | Neutral |
| HHIGH(20) | 16.59 | Neutral |
| LLOW(20) | 15.76 | Neutral |
| MedPx vs Support | 0.7433 | Bullish |
| Vol ROC(20) | -70.48 | Bearish |
Interpretation: Indicator-level signals form the base confluence, which is then adjusted using a separate AI-driven technical ranking model. The final technical score summarizes this combined view.
6) News sentiment + extractive gist
Note: Instrument-specific news matches were not found, so the digest includes broader market/sector headlines. Links are provided for verification.
Sentiment score (avg): 0.010 | Positive: 12% | Neutral: 75% | Negative: 12%
KGNAI AI News Sentiment Score (normalized -1 to +1): Not available (as of —) | Label: Not available | Overall news score: 0.01
Positive Developments
Recent coverage across major financial outlets is largely contextual rather than company-specific, but the tone includes some constructive themes for risk appetite. Several items point to policy or administrative decisions framed as stabilizing (even when debated), which can reduce uncertainty at the margin. Broader Asia-Pacific and regional developments also appear as informational coverage that markets often absorb without persistent price impact unless it changes expectations for trade, liquidity, or regulatory conditions. With the average news sentiment at 0.010 and positives at 12%, the data suggests a slight constructive skew without a strong directional impulse. For 601838 specifically, the implication is indirect: in the absence of instrument-matched headlines, incremental positivity is better treated as a background condition that can help a technical recovery hold—particularly if price challenges 16.5050 and participation improves.
Neutral / Mixed Developments
The dominant category is neutral: 75% of items are classified as informational, consistent with a market tape that may be driven more by technical positioning than by new fundamental catalysts. Mixed headlines often function as “noise” unless they translate into measurable changes in volatility, cross-asset correlations, or sector flows. This aligns with the technical backdrop of compressed bandwidth (0.0386), where markets can remain range-bound while awaiting a clearer trigger. For readers, the key is not the narrative density but whether neutrality persists alongside a momentum turn—e.g., RSI recovering from 29.09 while MACD histogram (currently -0.0177) improves. Until then, neutral news flow mostly serves as a low-conviction overlay rather than a driver.
Negative / Risk Signals
Negative items are present but not dominant (12%), and appear to be broader risk signals rather than 601838-specific deterioration. Macro- or geopolitically-angled developments can matter through second-order effects: they may shift expectations for trade conditions, policy stance, or general risk premia, which in turn can pressure financials and cyclicals even without direct exposure. In the current setup, the main analytical risk is confirmation failure: if external risk tone worsens while technical conditions are already mixed—bearish MA50 vs MA200 and a bearish blended technical score (-0.319)—the market may be less tolerant of failed rallies near 16.5050. A close below 15.6067 would represent a cleaner technical validation of that risk channel than sentiment alone.
- What to monitor next: Price behavior around 16.5050 and whether upside attempts coincide with improving volume signals (e.g., stabilization in Vol ROC(20) -70.48).
- What to monitor next: Whether volatility remains compressed (0.0386) or begins to expand, and if expansion aligns with RSI/MACD improvement.
- What to monitor next: Any shift in the positive/neutral/negative mix away from the current 12% / 75% / 12% balance.
Sources referenced: Reuters, Bloomberg, Yahoo Finance, MarketWatch, Investing.com
Snapshot: AI Rank (Short–Mid–Long): Mixed (Bullish tilt) (Neutral–Bullish–Bullish) · Technical Confluence: Neutral · Key Levels: Support ~15.61 | Resistance ~16.50 · News Sentiment: Neutral
7) Sources
- Bus with Chinese tourists crashes through ice on Russia’s Lake Baikal, killing 8 — https://www.scmp.com/news/world/russia-central-asia/article/3344231/bus-chinese-tourists-crashes-through-ice-russias-lake-baikal-killing-8?utm_source=rss_feed
- Nasa moon rocket hit by new problem, pushing launch with astronauts into April — https://www.scmp.com/news/world/united-states-canada/article/3344230/nasa-moon-rocket-hit-new-problem-putting-march-launch-astronauts-jeopardy?utm_source=rss_feed
- Trump says raising US global tariff rate from 10 per cent to 15 per cent — https://www.scmp.com/news/us/economy-trade-business/article/3344229/trump-says-raising-us-global-tariff-rate-10-15-cent?utm_source=rss_feed
- Wang Fuk Court buyback plan disappoints some residents despite ‘generous’ offer — https://www.scmp.com/news/hong-kong/society/article/3344228/wang-fuk-court-buyback-plan-disappoints-some-residents-despite-generous-offer?utm_source=rss_feed
- Germany’s ruling party seeks social media ban for children aged below 14 — https://www.scmp.com/news/world/europe/article/3344227/germanys-ruling-party-seeks-social-media-ban-children-aged-below-14?utm_source=rss_feed
- Calls for better supervision of Hong Kong’s campsites after areas inundated — https://www.scmp.com/news/hong-kong/health-environment/article/3344225/calls-better-supervision-hong-kongs-campsites-after-areas-inundated?utm_source=rss_feed
- Can China find a market for its fifth-generation J-35 warplanes? — https://www.scmp.com/news/china/military/article/3344208/can-china-find-market-its-fifth-generation-j-35-warplanes?utm_source=rss_feed
- Hong Kong police probe death of man, 66, in fall from bamboo scaffolding — https://www.scmp.com/news/hong-kong/law-and-crime/article/3344223/hong-kong-police-probe-death-man-60-fall-bamboo-scaffolding?utm_source=rss_feed
You may also like: How KGNAI AI ranks instruments across global markets
Disclaimer: KGNAI provides AI-generated analytics and educational market commentary only. This is not financial advice. Markets involve risk. Always do your own research.