
Dawning Information Industry Co Ltd (603019) — 20-Feb-2026 Technical Confluence Leans Bullish While Multi-Horizon Ranks Stay Neutral
KGNAI Signal + Technical Snapshot + News Sentiment Digest
As of: 20-Feb-2026
Ticker: 603019
Dawning Information Industry Co Ltd (603019) is showing a notable split between near-term technical strength and a more measured, comparative rank profile across horizons. In the KGNAI universe of 1294 China-listed instruments, the Daily rank (#38) and 3-Monthly rank (#81) sit in strong relative territory, while the Weekly (#545) and Monthly (#584) ranks remain neutral, implying momentum may be leading broader confirmation rather than reflecting a fully synchronized regime. Technically, the blended read is constructive: the 18-signal confluence is 0.500 (Bullish), the Overall Technical Score is 0.641 (Bullish), and the DRL technical model places the setup at Rank #19. Key decision zones remain clearly defined at Support ~85.0600 and Resistance ~96.9100, with market context shaped by a broadly neutral news sentiment profile (avg -0.013).
- Rank stance (Short / Mid / Long): Neutral / Neutral / Neutral (with Daily #38 and 3-Monthly #81 as near-term positives)
- Technical confluence label: Bullish (Overall Technical Score 0.641; DRL Rank #19)
- Key levels: Support ~85.0600 | Resistance ~96.9100
- News sentiment bias: Neutral (avg -0.013; Positive 6% / Neutral 81% / Negative 12%)
- Confirmation / invalidation: Strength improves on a break above 96.9100 with volume; deterioration risk increases on a close below 85.0600
KGNAI ranks instruments by relative positioning across large universes, using multiple independent tests designed to reduce single-indicator bias. Technical and sentiment components are evaluated for signal alignment and the consistency of historical behavior under similar conditions. Outputs are probabilistic descriptors intended for comparison across thousands of instruments.
- Ranks are comparative within the 1294-instrument universe, not absolute forecasts
- Confluence reflects agreement across indicators (and may lead or lag rank shifts)
- Support/resistance levels are decision zones where behavior often changes
- Sentiment provides contextual bias, not a standalone trading signal
1) KGNAI AI Analysis
Region: CHINA
Total universe size: 1294 ranked instruments
- Daily rank: #38 out of 1294 — Bullish
- Weekly rank: #545 out of 1294 — Neutral
- Monthly rank: #584 out of 1294 — Neutral
- 3-Monthly rank: #81 out of 1294 — Bullish
- 6-Monthly rank: #370 out of 1294 — Neutral
- Yearly rank: #243 out of 1294 — Bullish
The rank stack suggests strength is concentrated at the edges—very short term and longer term—while the middle horizons remain more reserved. A Daily rank of #38 places 603019 in the top decile of the universe, consistent with recent price pressure skewing constructive. The 3-Monthly rank of #81 supports that the move is not purely an intraday artifact, yet the Weekly (#545) and Monthly (#584) readings sit closer to the universe median, indicating the market has not fully repriced the name into broad, persistent leadership.
The Yearly rank (#243) remains in the upper tier, aligning more with a longer-horizon constructive backdrop than with a deteriorating structure. In practice, this type of profile often occurs when momentum improves faster than medium-term trend models update, or when recent strength is counterbalanced by prior drawdown history captured by weekly/monthly tests. The key analytical point is asymmetry: bullish impulses are present, but the mid-term neutrality keeps conviction contained.
KGNAI ranks each instrument across large universes using multiple proprietary AI tests and statistical models (millions of data points). Lower ranks generally indicate stronger probability of favorable performance behavior, while higher ranks indicate weaker probability and more bearish positioning.
Term view: Short-term: Neutral. Mid-term: Neutral. Long-term: Neutral.
Want the full universe and complete rank tables? Unlock full access on KGNAI: https://www.kgnai.com/pricing
2) Price & trend overview
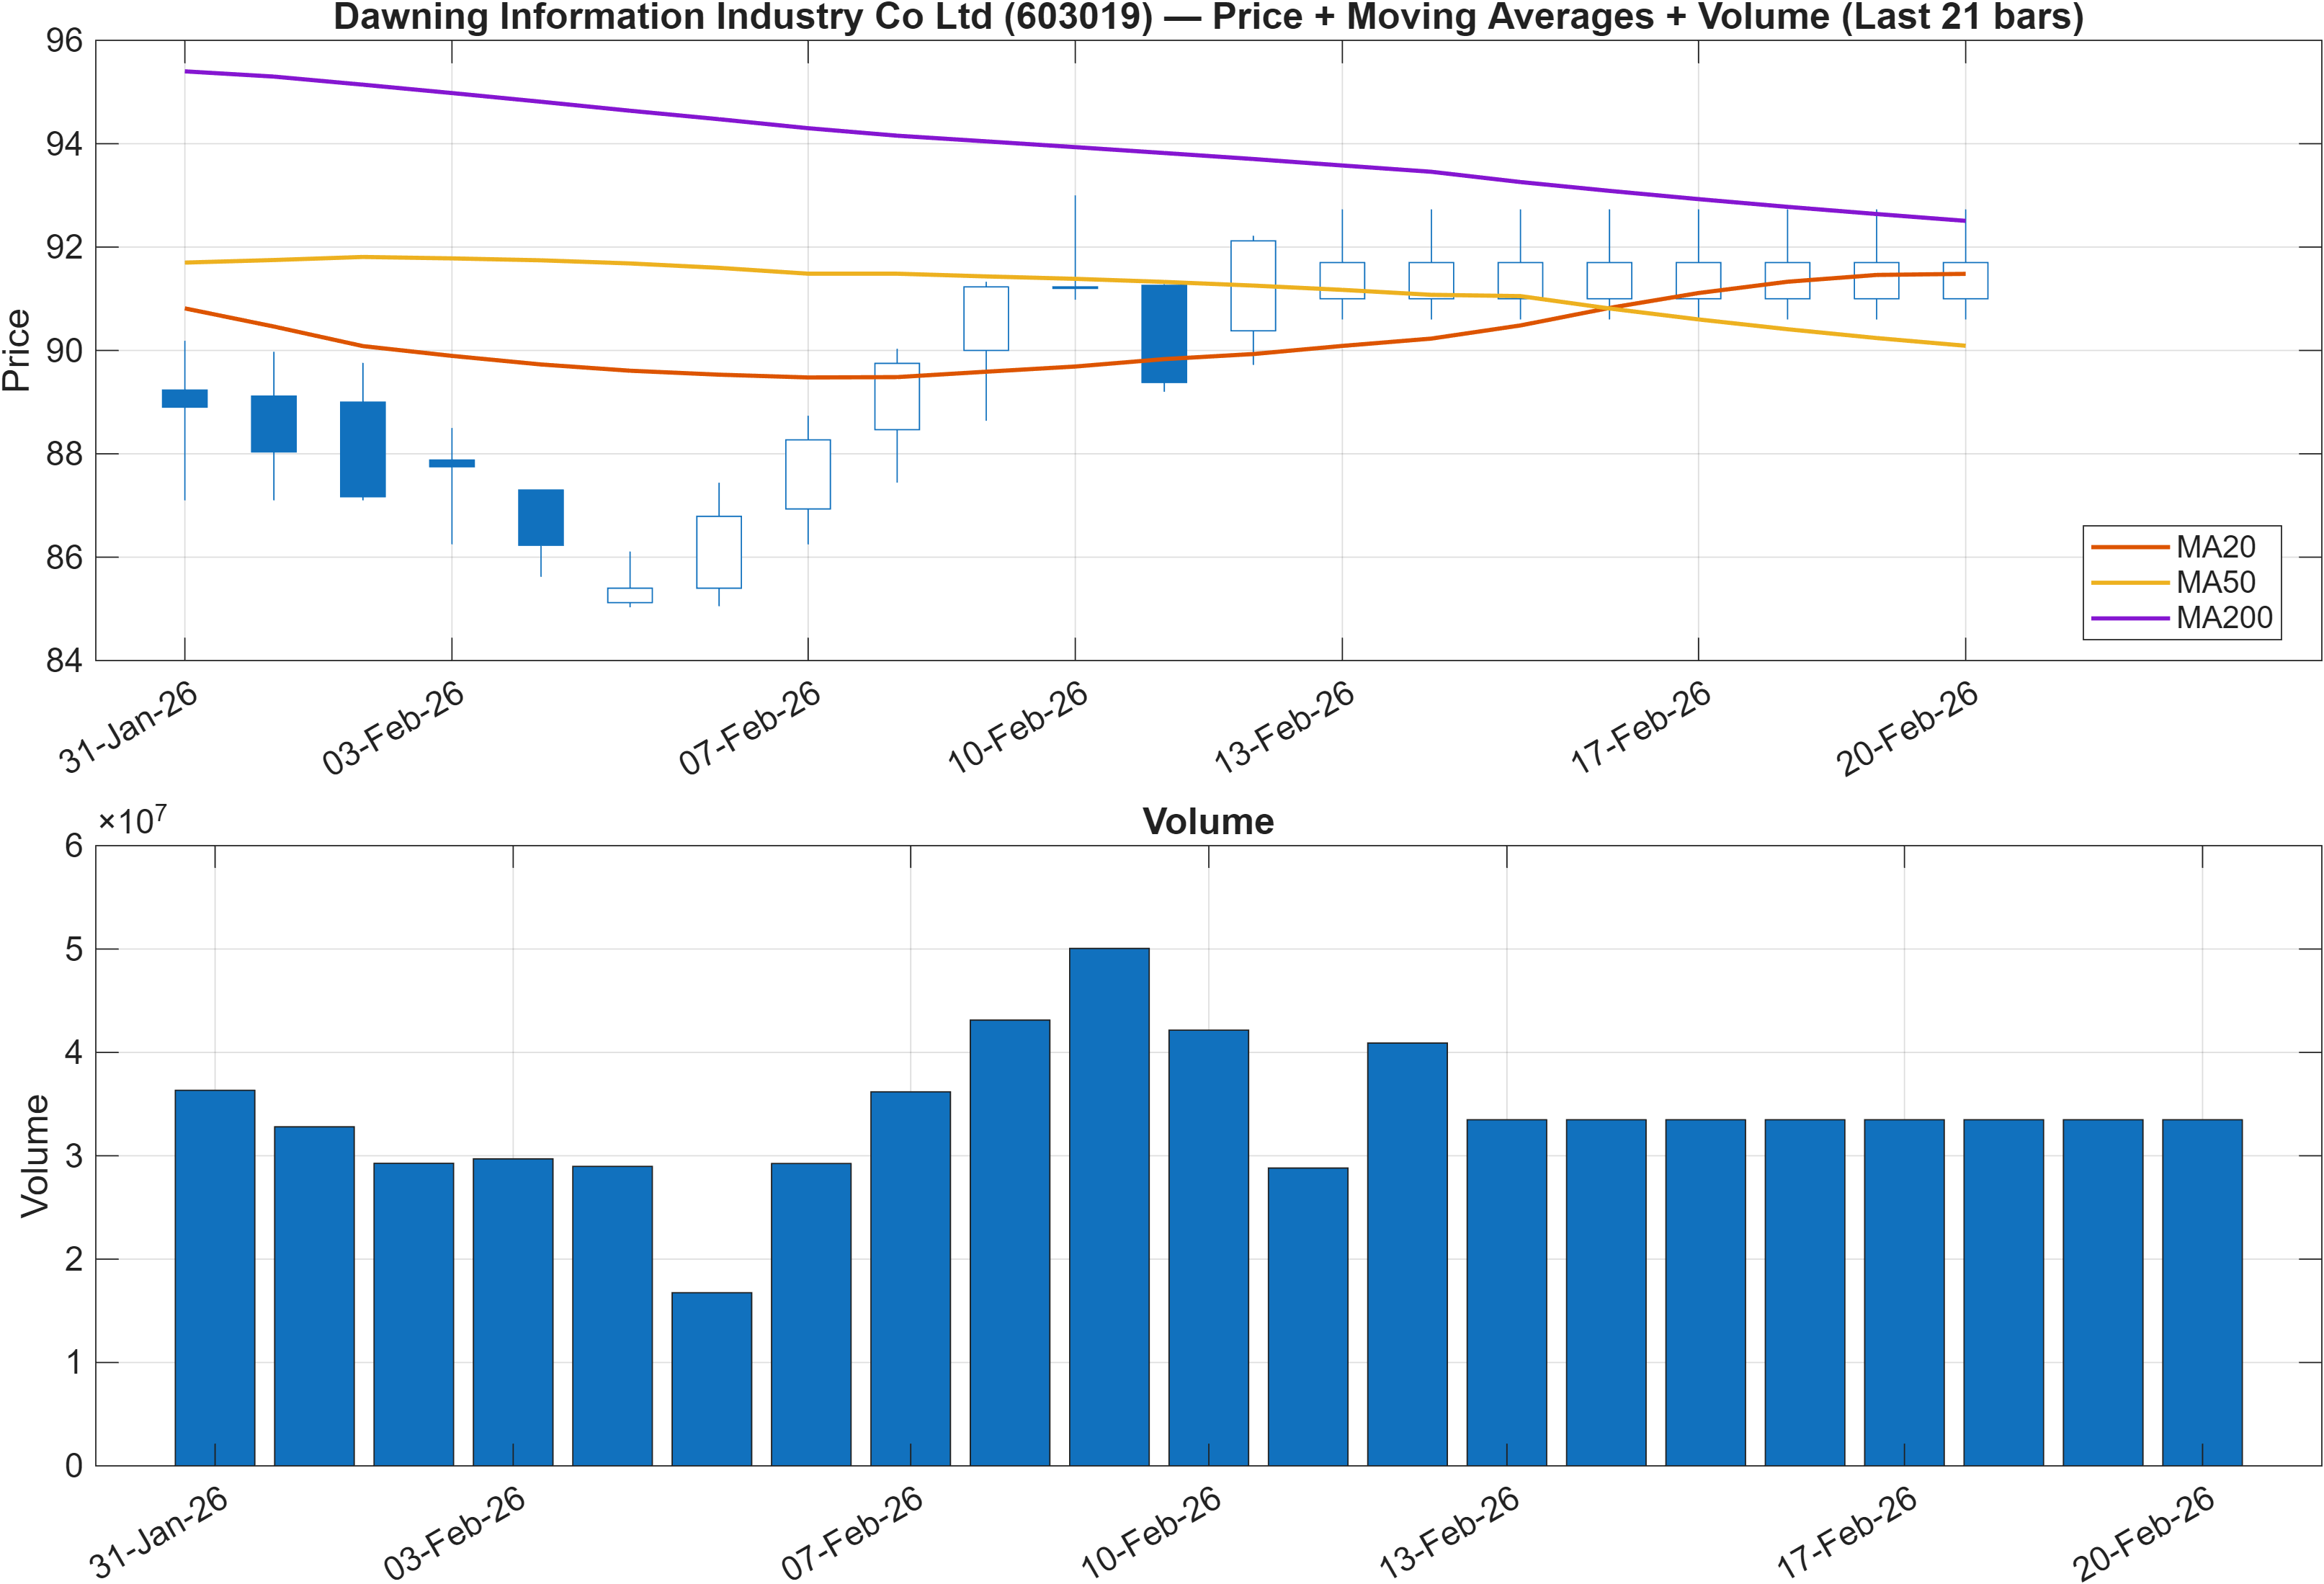
The trend read is explicitly mixed: Close vs MA50 = Bullish, while MA50 vs MA200 = Bearish. This combination commonly describes a market that is recovering within a larger, still-unresolved trend structure. The near-term bid is strong enough to sit above the intermediate average, but the longer-term regime marker (the MA200 relationship) has not flipped.
That framing aligns with the rank profile: Daily #38 and 3-Monthly #81 show relative strength, yet Weekly #545 and Monthly #584 stay neutral—consistent with a market that is improving but still working through overhead supply and longer-cycle constraints. With defined levels at 85.0600 (support) and 96.9100 (resistance), trend interpretation becomes less about narrative and more about where price accepts.
If price continues to hold above the intermediate trend reference (MA50) while progressing toward 96.9100, that would represent further consolidation of the recovery phase. Conversely, failure to sustain the near-term trend (a drift back into the lower part of the range toward 85.0600) would reinforce that the longer-term bearish MA structure still dominates. The practical takeaway is that the chart currently supports continuation attempts, but not yet an unequivocal long-duration trend reversal.
3) Momentum & volatility dashboard
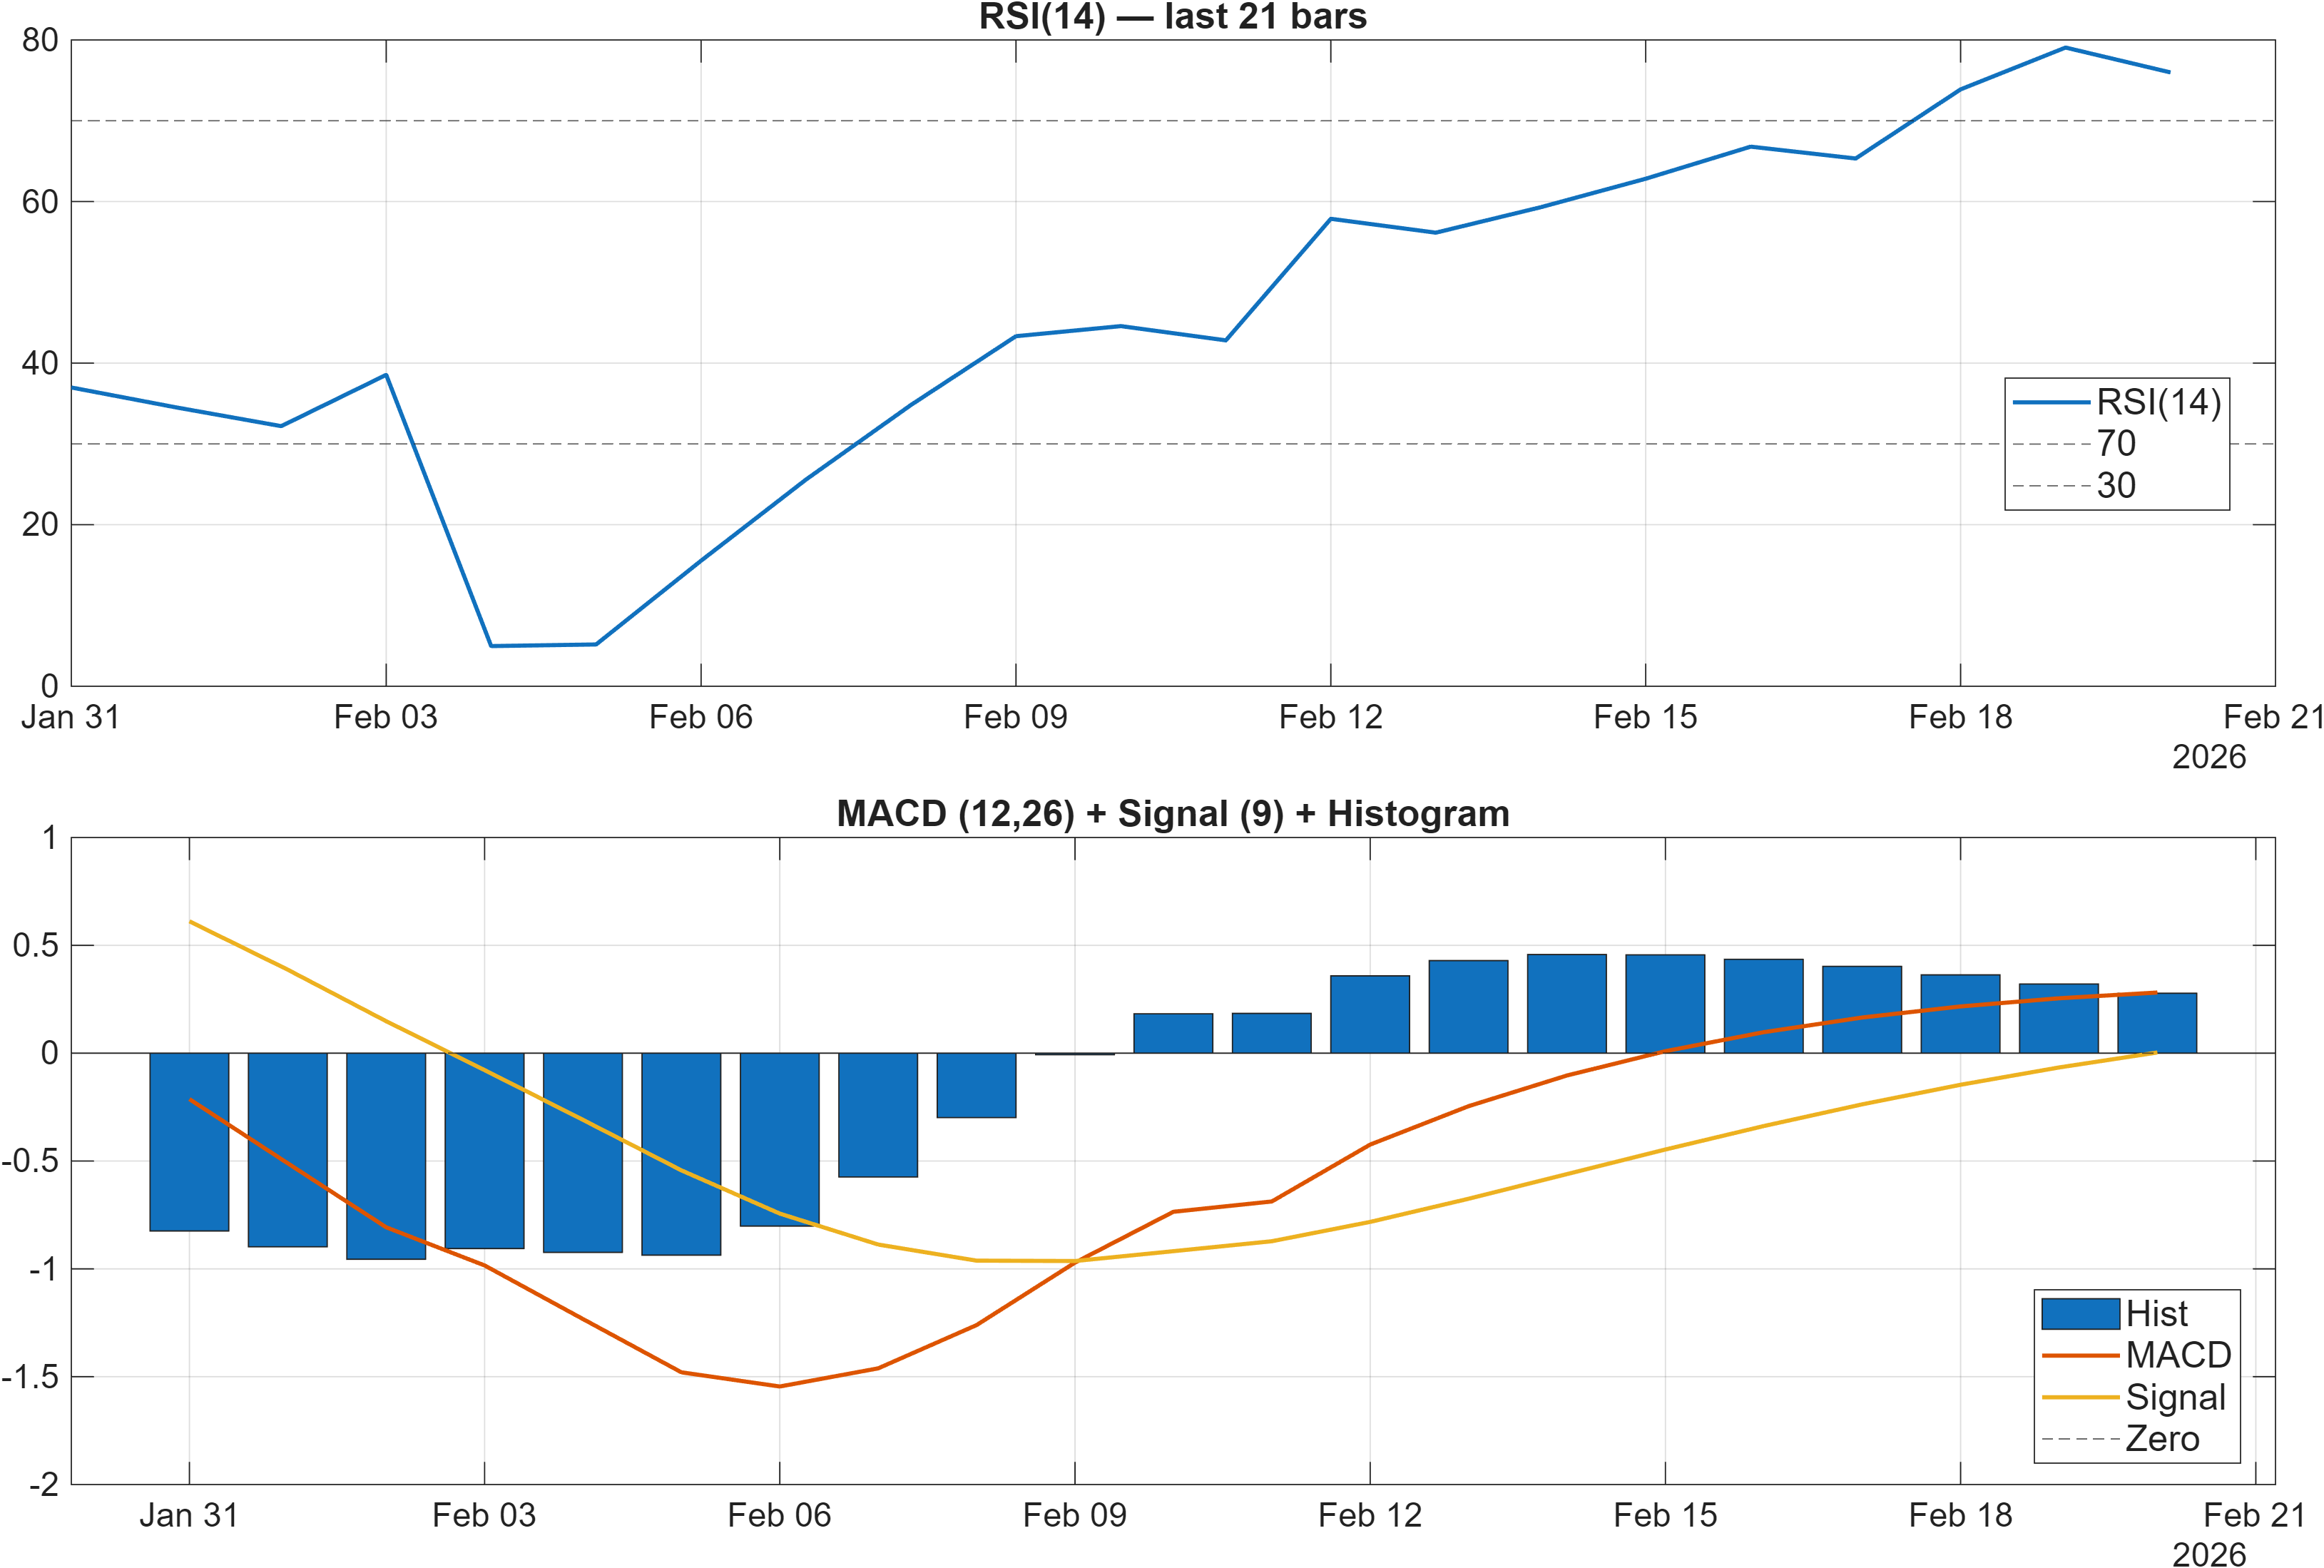
Momentum indicators are aligned on the constructive side. The dashboard states RSI bias = Bullish, and the MACD histogram is positive at 0.2780, which generally supports the idea that upside impulses are currently dominating recent price changes. In the signal table, RSI(14) = 75.98 and MACD Hist = 0.278 reinforce that the move has traction, though RSI at this level can also imply late-stage momentum if follow-through stalls.
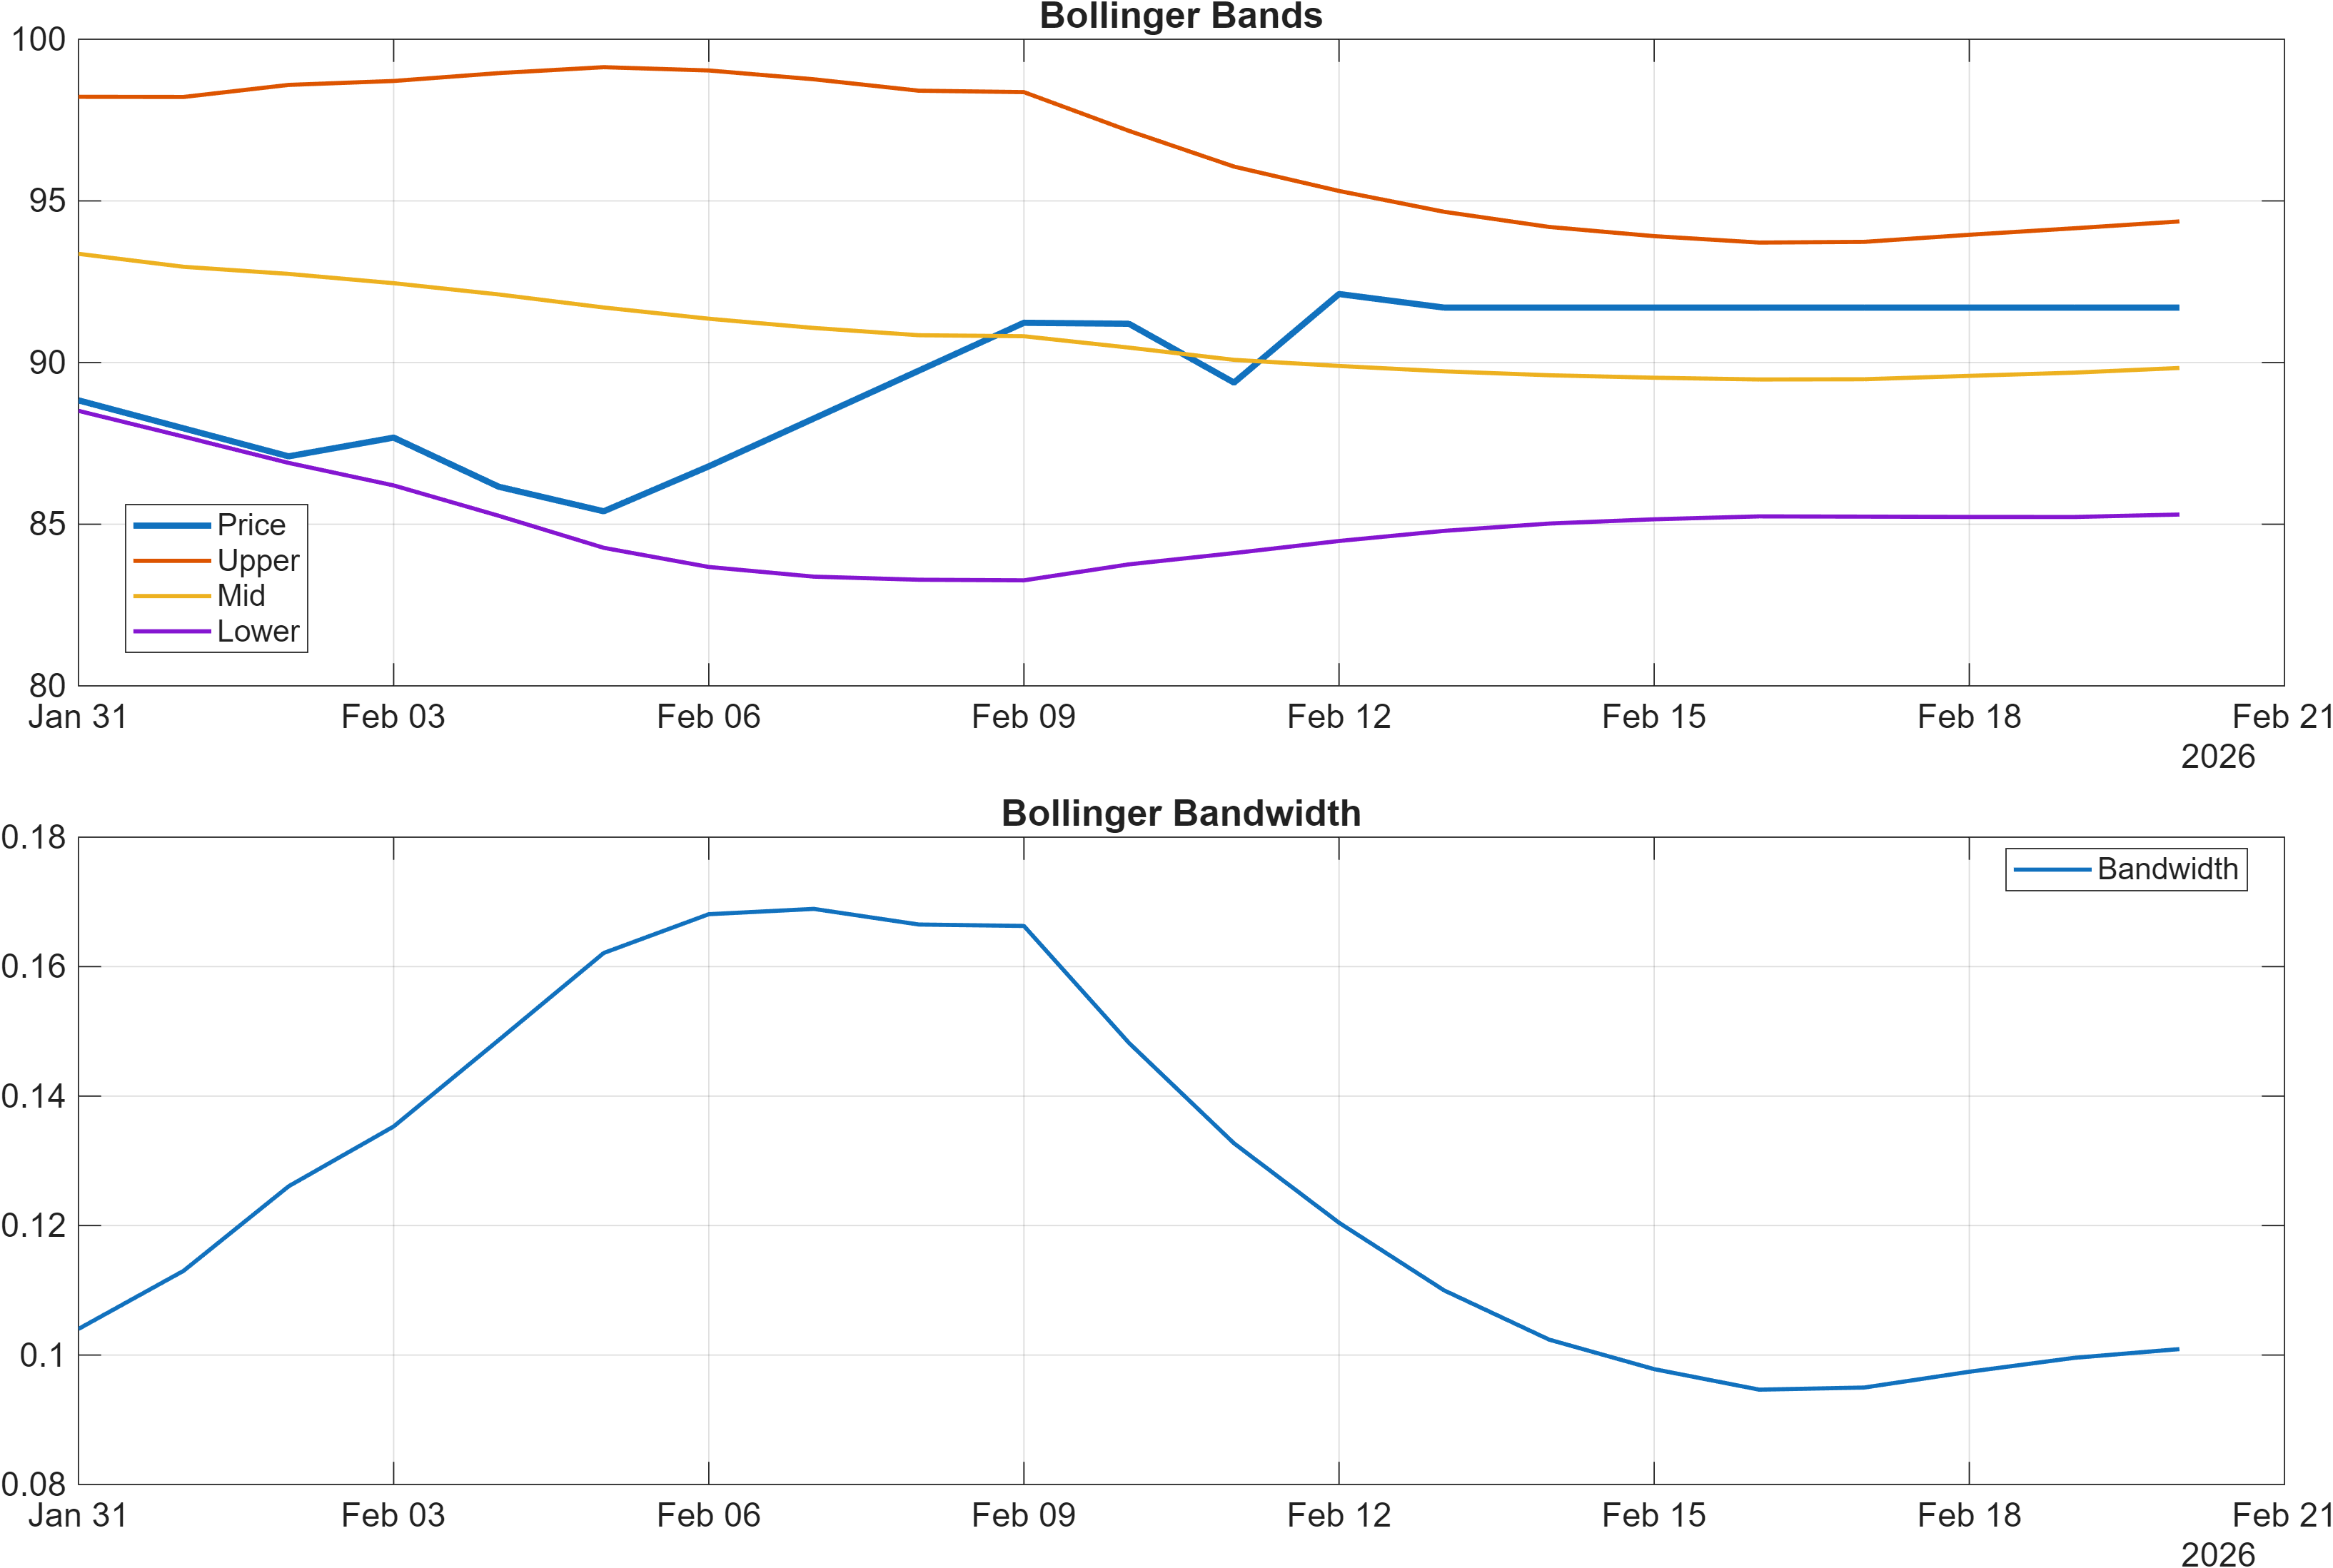
Volatility is not flashing a fully expanded breakout regime. Bollinger bandwidth is 0.1009, and the dashboard labels it as a volatility regime reading rather than a directional signal. When bandwidth is contained while momentum reads bullish, markets often enter a compression-with-bias state: trend can continue, but it may do so with intermittent pauses and mean-reversion episodes.
This matters for interpretation: a positive MACD histogram (0.2780) and bullish RSI bias can persist even as bandwidth remains moderate, but the market tends to be more sensitive to confirmation at key levels. With resistance at 96.9100, momentum is most credible if it is accompanied by acceptance above that zone rather than repeated failures that would turn strong RSI into a fatigue signal.
4) Support / Resistance zones
Support ~ 85.0600 | Resistance ~ 96.9100
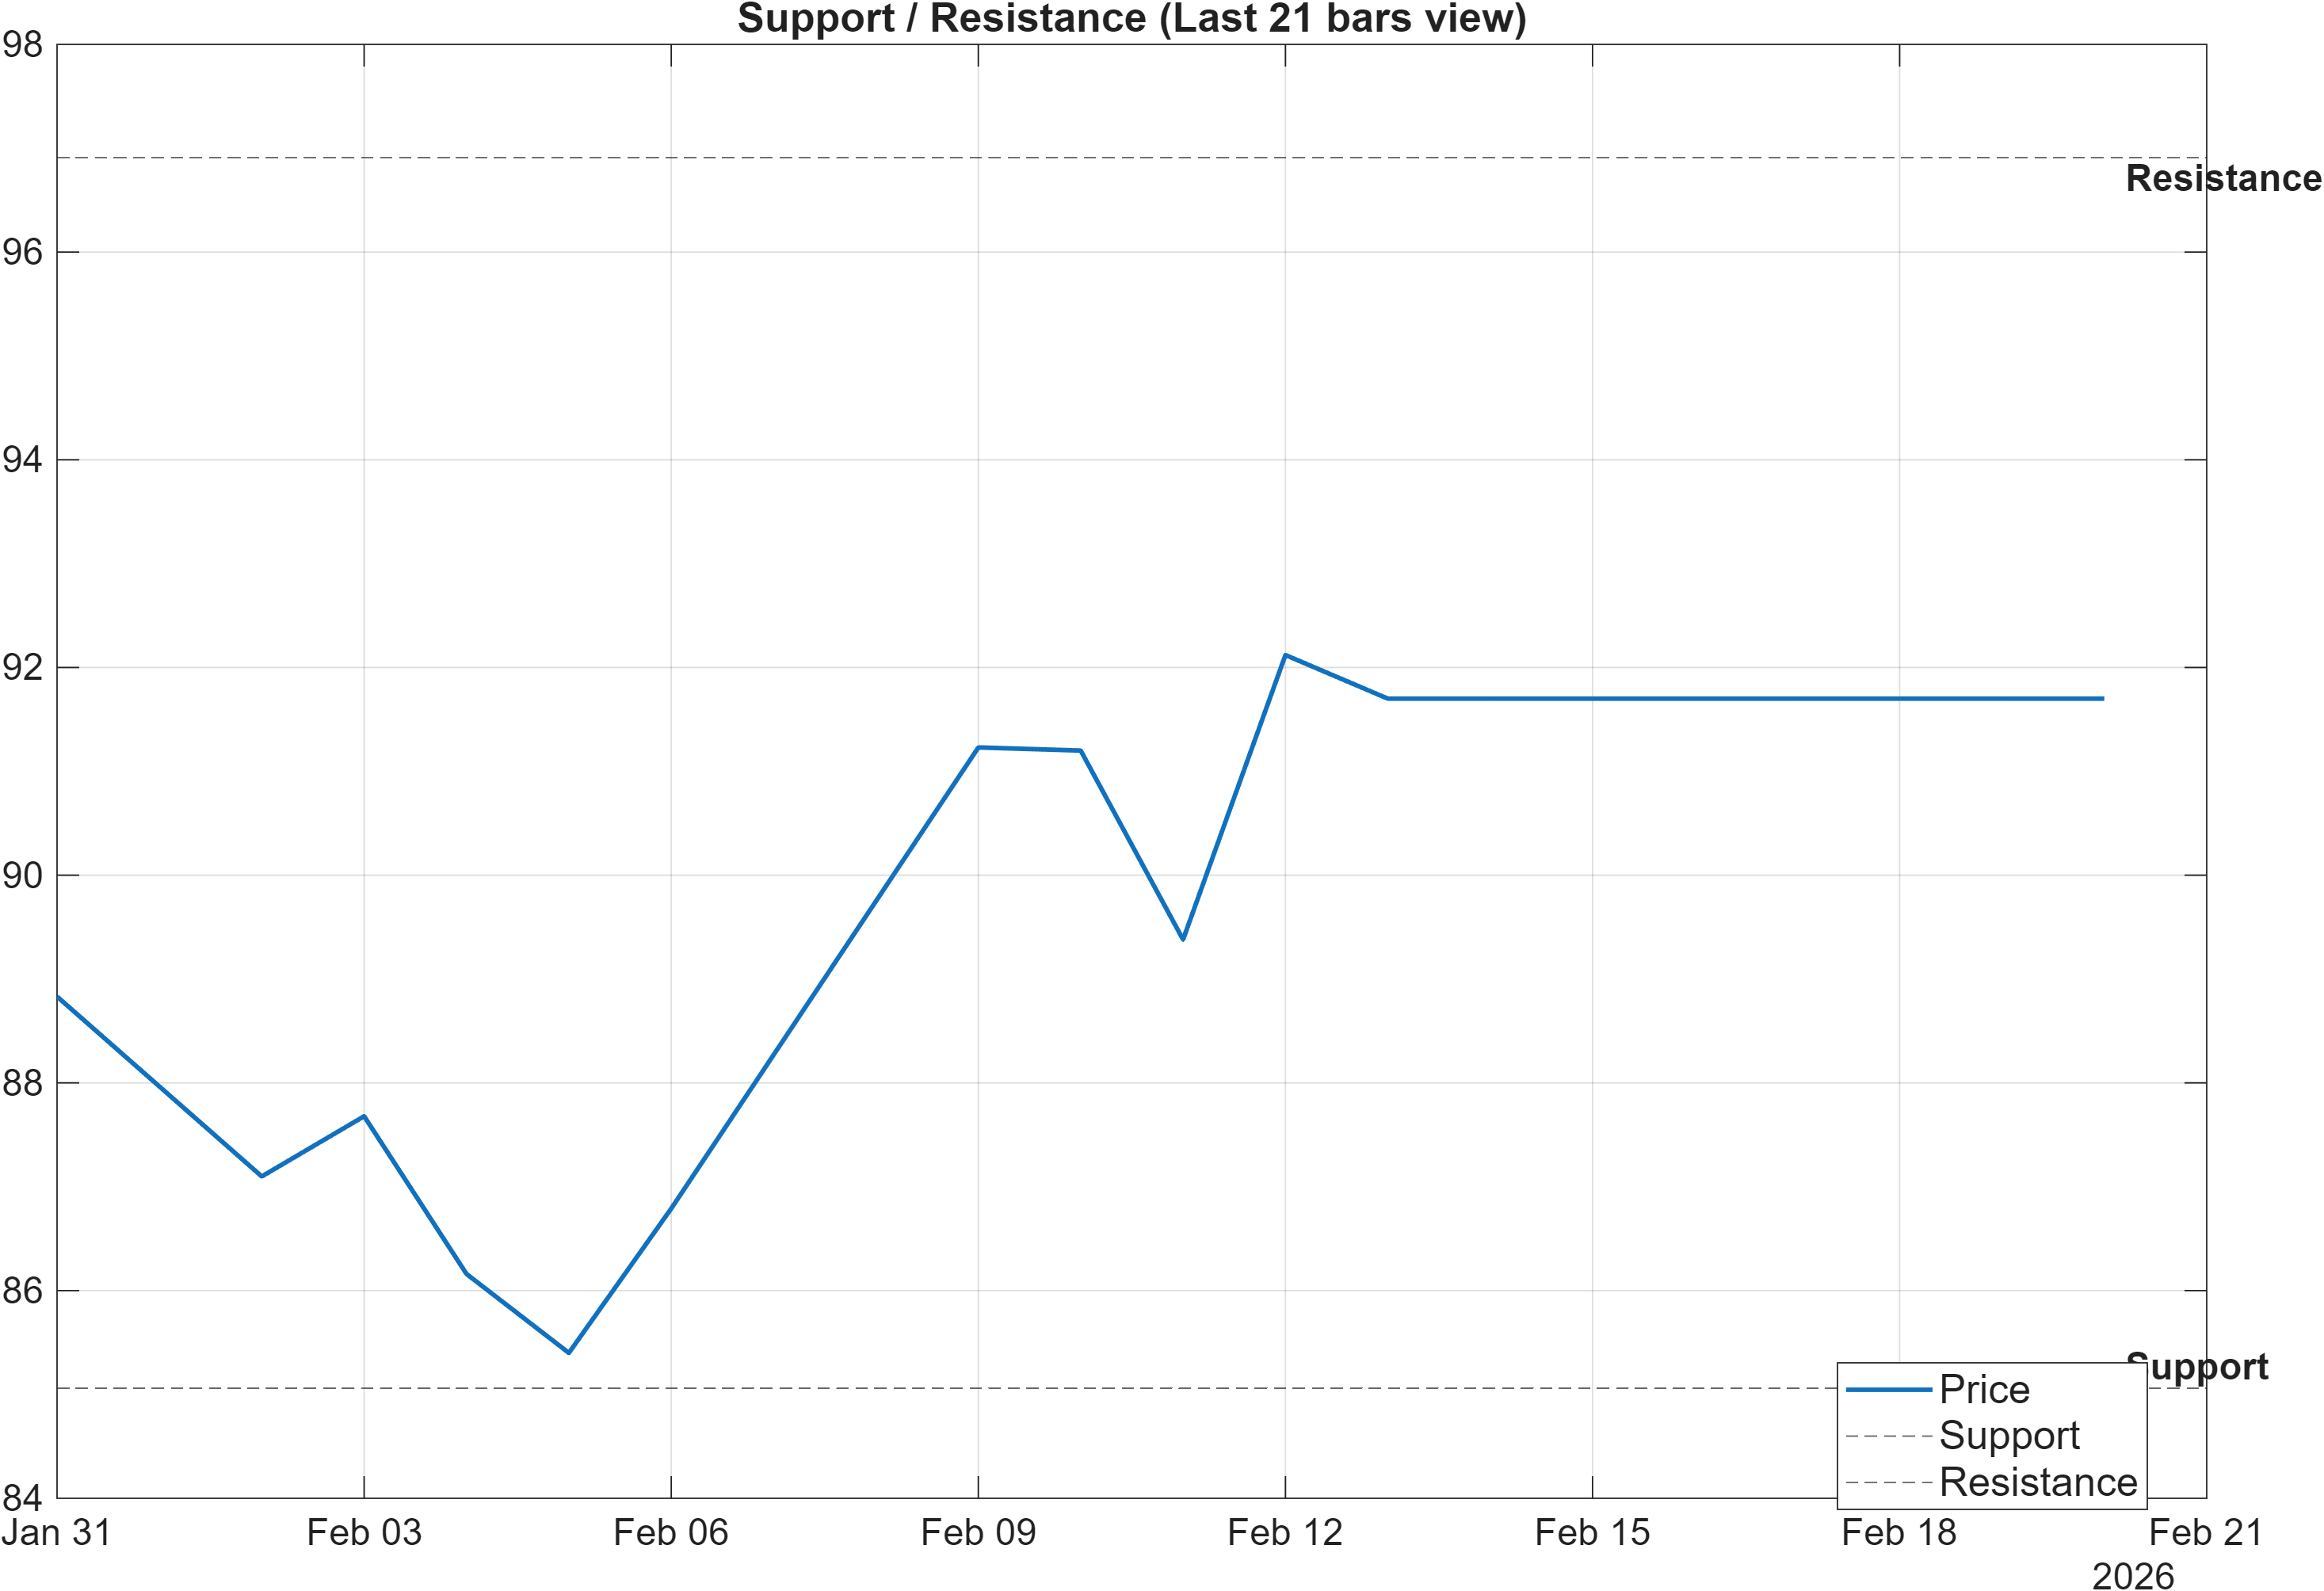
The current setup is cleanly framed by a single, high-utility range: 85.0600 as the primary support reference and 96.9100 as the primary resistance reference. This range functions as a decision corridor for both risk containment and evidence gathering, particularly when the broader read mixes bullish confluence with neutral mid-term ranks.
The scenario mapping is explicit: break above resistance with volume → continuation, while a close below support → signal deterioration risk. Given the bullish technical blend (0.641) and strong DRL technical rank (#19), the resistance test becomes the natural location where bullish evidence either compounds or fails.
The practical interpretation is not that 96.9100 must break, but that repeated rejection near resistance can create divergence against momentum signals (for example, a still-elevated RSI(14) of 75.98 without new price acceptance). On the downside, holding above 85.0600 keeps the constructive thesis intact even during pullbacks, because it preserves the structure implied by the “Close vs MA50 = Bullish” state. In short: 96.9100 is the confirmation zone; 85.0600 is the risk boundary.
5) Quant Technical Dashboard (18 Signals)
KGNAI AI Technical Analysis Score (Deep Reinforcement Learning): Rank #19 out of 1294 (Rank 1 represents the strongest technical positioning and a higher probability of favorable price behavior. As ranks increase toward the maximum, the probability of favorable outcomes weakens and bearish positioning becomes more dominant.) | Label: Bullish | Score: 0.971
18-Signal Technical Confluence Score: 0.500 (Bullish)
Overall Technical Score (18-signal confluence + DRL rank blend): 0.641 (Bullish)
Note: The blended score reflects signal strength weighted against broader AI technical ranking, which may temporarily diverge.
Blended technical score breakdown: 0.641 (Bullish | Bull 11 / Bear 2 / Neutral 5)
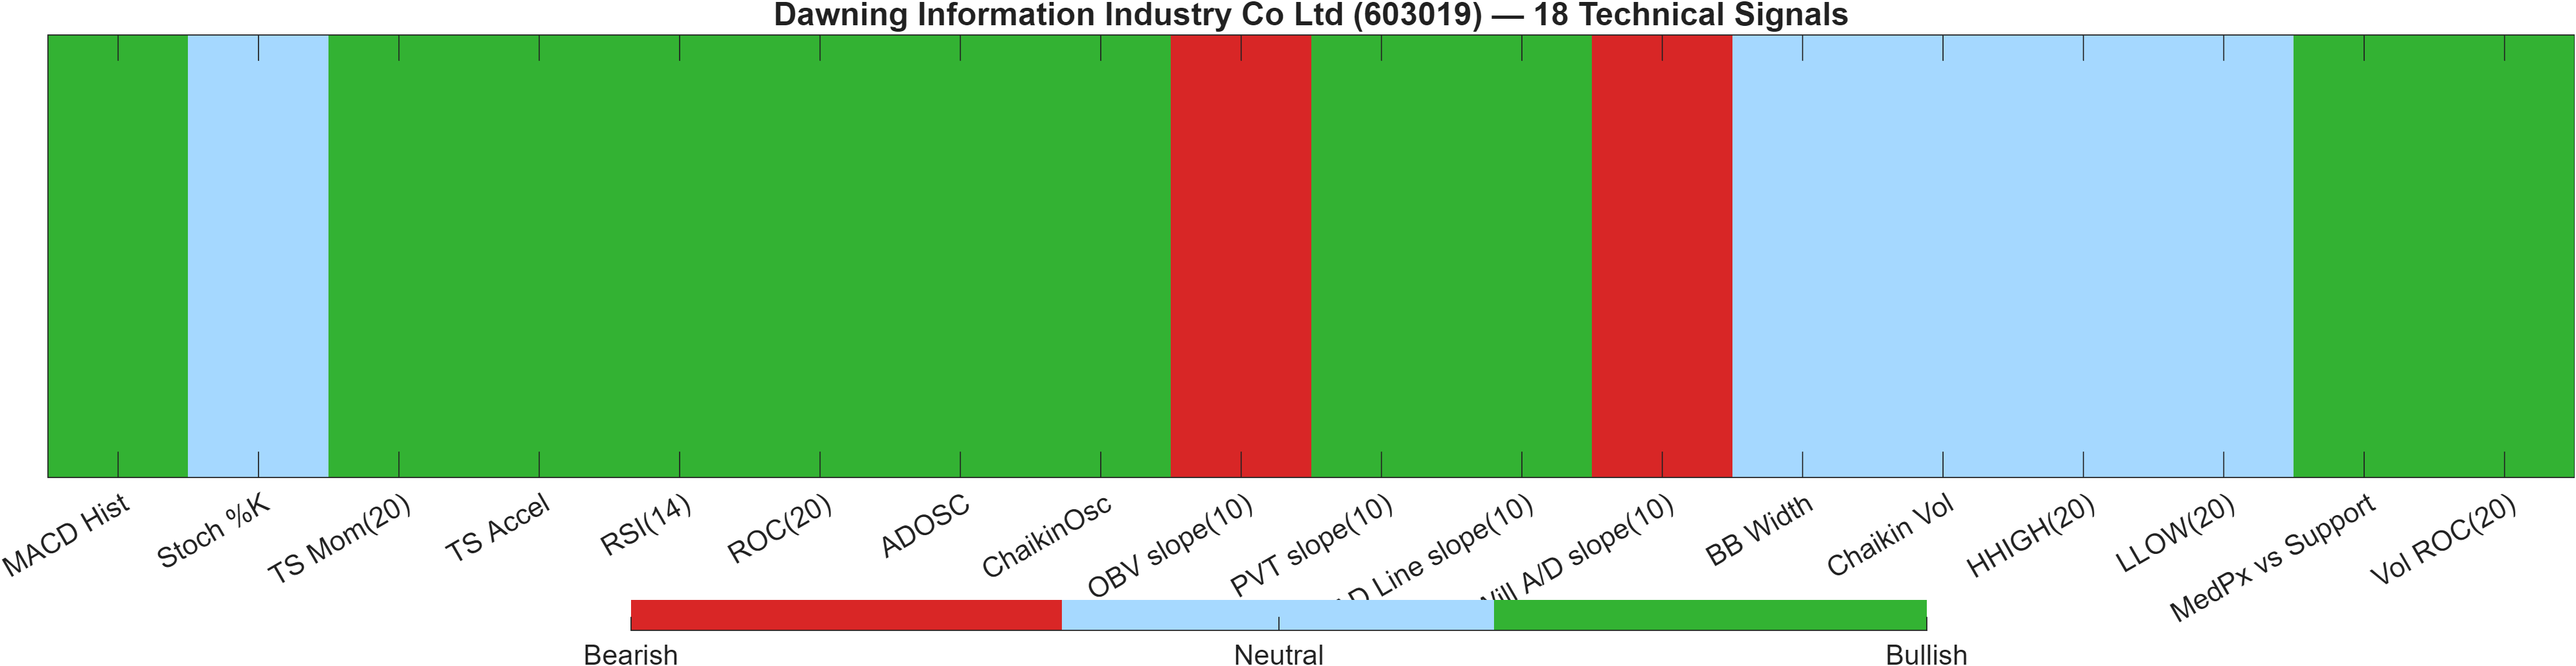
The technical layer is the strongest component of the report and is internally consistent across two different lenses. First, the DRL model places the instrument at Rank #19 out of 1294 with a Score of 0.971, signaling that—within this universe—recent technical behavior resembles historically favorable regimes more than average. Second, the rules-based basket reports an 18-Signal Technical Confluence Score of 0.500 (Bullish), and the blend yields an Overall Technical Score of 0.641 (Bullish).
The blend composition (Bull 11 / Bear 2 / Neutral 5) suggests the bullish case is not dependent on a single indicator. For example, momentum and rate-of-change features are constructive (e.g., TS Mom(20) = 3.663, ROC(20) = 4.246), and the MACD histogram remains positive (0.278). At the same time, the dashboard also shows where skepticism can arise: volume/accumulation features are not perfectly aligned, with OBV slope(10) = -2.139e+07 flagged bearish even as other flow measures remain positive.
This is the type of configuration that can support continued upside while being vulnerable to short, sharp pullbacks if participation thins near resistance. When the DRL rank is as strong as #19, the usual “next question” is whether price can convert that statistical edge into acceptance above 96.9100, rather than merely oscillating with elevated momentum readings (e.g., RSI(14) = 75.98).
Signal table (Bull/Bear/Neutral)
| Indicator | Value | Signal |
|---|---|---|
| MACD Hist | 0.278 | Bullish |
| Stoch %K | 70.82 | Neutral |
| TS Mom(20) | 3.663 | Bullish |
| TS Accel | 7.127 | Bullish |
| RSI(14) | 75.98 | Bullish |
| ROC(20) | 4.246 | Bullish |
| ADOSC | 66.43 | Bullish |
| ChaikinOsc | 9.229e+06 | Bullish |
| OBV slope(10) | -2.139e+07 | Bearish |
| PVT slope(10) | 5.263e+05 | Bullish |
| AD Line slope(10) | 2.261e+07 | Bullish |
| Will A/D slope(10) | -0.19 | Bearish |
| BB Width | 0.1009 | Neutral |
| Chaikin Vol | -7.254 | Neutral |
| HHIGH(20) | 93 | Neutral |
| LLOW(20) | 85.03 | Neutral |
| MedPx vs Support | 6.605 | Bullish |
| Vol ROC(20) | 2.084 | Bullish |
Interpretation: Indicator-level signals form the base confluence, which is then adjusted using a separate AI-driven technical ranking model. The final technical score summarizes this combined view.
6) News sentiment + extractive gist
Note: Instrument-specific news matches were not found, so the digest includes broader market/sector headlines. Links are provided for verification.
Sentiment score (avg): -0.013 | Positive: 6% | Neutral: 81% | Negative: 12%
KGNAI AI News Sentiment Score (normalized -1 to +1): Not available (as of —) | Label: Not available | Overall news score: -0.01
Positive Developments
Recent coverage across major financial outlets indicates a modestly constructive backdrop, largely driven by policy-sensitive and liquidity-adjacent themes rather than company-specific catalysts. Market-facing commentary has emphasized stabilization dynamics in parts of Greater China’s property and risk-asset complex, which can support broader sentiment toward cyclicals and technology-adjacent names when equity momentum is already improving. In this report, that tone aligns with a technical picture that is currently constructive—such as a positive MACD histogram (0.2780) and a bullish RSI bias—without forcing a strong directional conclusion from news flow alone. With the aggregate sentiment mix still dominated by 81% neutral coverage and an average score of -0.013, “positive” here reads as incremental: supportive enough to avoid headwinds, but not strong enough to override price-level evidence at 96.9100 and 85.0600.
Neutral / Mixed Developments
The dominant feature of the news dataset is its lack of instrument specificity, which naturally pulls the digest toward macro and geopolitics rather than earnings, guidance, or product cycles. That structure tends to produce a low signal-to-noise input: plenty of information, limited direct linkage to 603019’s near-term trading behavior. The sentiment breakdown reflects this: 6% positive, 81% neutral, and 12% negative, with a near-flat average score of -0.013. In this context, news should be treated as background conditions that can amplify or dampen an existing technical move rather than initiate one. For positioning, the cleaner decision cues remain technical—particularly whether the bullish confluence (0.641) is validated by acceptance above 96.9100.
Negative / Risk Signals
Recent coverage across major financial outlets also highlights episodic risk clusters—primarily geopolitical and energy-route related—which can reprice volatility quickly even when single-name technicals look constructive. Such risk pulses tend to show up as abrupt shifts in risk appetite and sector rotation, which can matter for a name whose medium-term ranks remain neutral (e.g., Weekly #545, Monthly #584) despite strong short-term readings. With RSI elevated (75.98), downside sensitivity can increase if a macro shock triggers de-risking, because momentum-heavy setups can unwind faster when liquidity thins. In that scenario, attention typically returns to structural levels: a close below 85.0600 would be consistent with the report’s own deterioration condition, while repeated failure at 96.9100 could turn positive momentum into a stalled advance rather than continuation.
- What to monitor next: price/volume behavior on approaches to 96.9100
- What to monitor next: any shift in the neutral-heavy mix (81%) toward a more negative distribution
- What to monitor next: whether pullbacks hold above 85.0600 as momentum cools from elevated RSI
Sources referenced: Reuters, Bloomberg, Yahoo Finance, MarketWatch, Investing.com
Snapshot: AI Rank (Short–Mid–Long): Neutral (Neutral–Neutral–Neutral) · Technical Confluence: Bullish · Key Levels: Support ~85.06 | Resistance ~96.91 · News Sentiment: Neutral
7) Sources
Instrument-specific sources are not available in the provided data. The included digest reflects broader market/sector coverage used for contextual sentiment only.
Sources referenced: Reuters, Bloomberg, Yahoo Finance, MarketWatch, Investing.com
You may also like: How KGNAI AI ranks instruments across global markets
Disclaimer: KGNAI provides AI-generated analytics and educational market commentary only. This is not financial advice. Markets involve risk. Always do your own research.