
Zhejiang Sanmei Chemical Industry Co Ltd (603379) — 25-Feb-2026 Technical Confluence Bullish, Ranks Mixed in a Sideways Regime
Zhejiang Sanmei Chemical Industry Co Ltd (603379) is presenting a notable cross-signal split: short-horizon relative strength appears firm while longer-horizon ranking context remains pressured. Within KGNAI’s 1026-instrument China universe, the daily rank (#61) sits in the upper tier, yet the monthly rank (#1002) is in the weakest tail—an alignment pattern often associated with rebound attempts that still require confirmation at key levels. Technically, the picture is more constructive: the moving-average read is bullish (close vs MA50 bullish; MA50 vs MA200 bullish) and the broader technical blend remains Bullish with an overall technical score of 0.672. Momentum inputs also lean supportive with RSI(14) at 70.1 and a positive MACD histogram (0.0417), while the Bollinger bandwidth (0.0620) implies a relatively contained volatility regime. News flow is largely non-committal, reflected in a near-flat average sentiment of -0.013 and heavy neutral clustering.
- Rank stance (Short / Mid / Long): Mixed — Daily #61 supportive, Monthly #1002 weak; broader horizons mostly Neutral.
- Technical confluence: Bullish (Overall Technical Score 0.672; DRL rank #95).
- Key levels: Support ~ 57.5633 | Resistance ~ 70.9900.
- News sentiment bias: Neutral (avg -0.013; 94% neutral).
- Confirmation / invalidation: A sustained move above 70.9900 with volume supports continuation; a close below 57.5633 elevates deterioration risk.
What KGNAI Measures
KGNAI evaluates assets using large cross-sectional datasets built from millions of structured data points. Inputs incorporate fundamental metrics, technical structures, and systematically processed news sentiment. Statistical models, machine learning, and AI frameworks are used to assess relative positioning, signal alignment, and probabilistic behavior across broad universes.
How to Read This Report
- Ranks are comparative across the tracked universe, not absolute price targets.
- Confluence reflects alignment among independent signal groups.
- Support/resistance levels are probabilistic decision zones, not guarantees.
- Sentiment provides contextual bias within the broader analytical framework.
KGNAI Signal + Technical Snapshot + News Sentiment Digest
As of: 25-Feb-2026
Ticker: 603379
1) KGNAI AI Analysis
Region: CHINA
Total universe size: 1026 ranked instruments
- Daily rank: #61 out of 1026 — Bullish
- Weekly rank: #733 out of 1026 — Neutral
- Monthly rank: #1002 out of 1026 — Bearish
- 3-Monthly rank: #369 out of 1026 — Neutral
- 6-Monthly rank: #361 out of 1026 — Neutral
- Yearly rank: #710 out of 1026 — Neutral
The ranking stack is internally inconsistent across horizons, which is typical of a market transitioning between regimes rather than trending cleanly. The daily position (#61) places 603379 in the upper slice of the 1026-name universe, consistent with near-term bid support and improving relative behavior. In contrast, the monthly rank (#1002) is in the weakest tail, indicating that longer-horizon tests still classify the instrument as structurally challenged versus peers.
This spread between short and mid-term ranks is important because it constrains interpretation: a favorable daily signal can reflect either (a) an early reversal attempt or (b) a temporary bounce inside a larger, weaker context. The weekly rank (#733) and yearly rank (#710) sitting in the lower third reinforce that the short-term improvement has not yet been broadly “accepted” across slower models.
KGNAI’s declared term view—Short-term Neutral, Mid-term Bearish, Long-term Neutral—captures that tension. Neutral at the short end, despite a bullish daily rank, suggests the framework is emphasizing confirmation over single-window strength. The mid-term bearish label is consistent with the monthly weakness, while long-term neutrality implies the longer series is not persistently deteriorating—more consistent with a range-bound structure than a one-way downtrend.
Practical decision-making here centers on confirmation: until technical structure and levels (notably 70.9900 resistance and 57.5633 support) resolve, the rank dispersion argues for disciplined invalidation planning rather than directional anchoring.
KGNAI ranks each instrument across large universes using multiple proprietary AI tests and statistical models (millions of data points). Lower ranks generally indicate stronger probability of favorable performance behavior, while higher ranks indicate weaker probability and more bearish positioning.
Term view: Short-term: Neutral. Mid-term: Bearish. Long-term: Neutral.
Want the full universe and complete rank tables? Unlock full access on KGNAI: https://www.kgnai.com/pricing
2) Price & trend overview
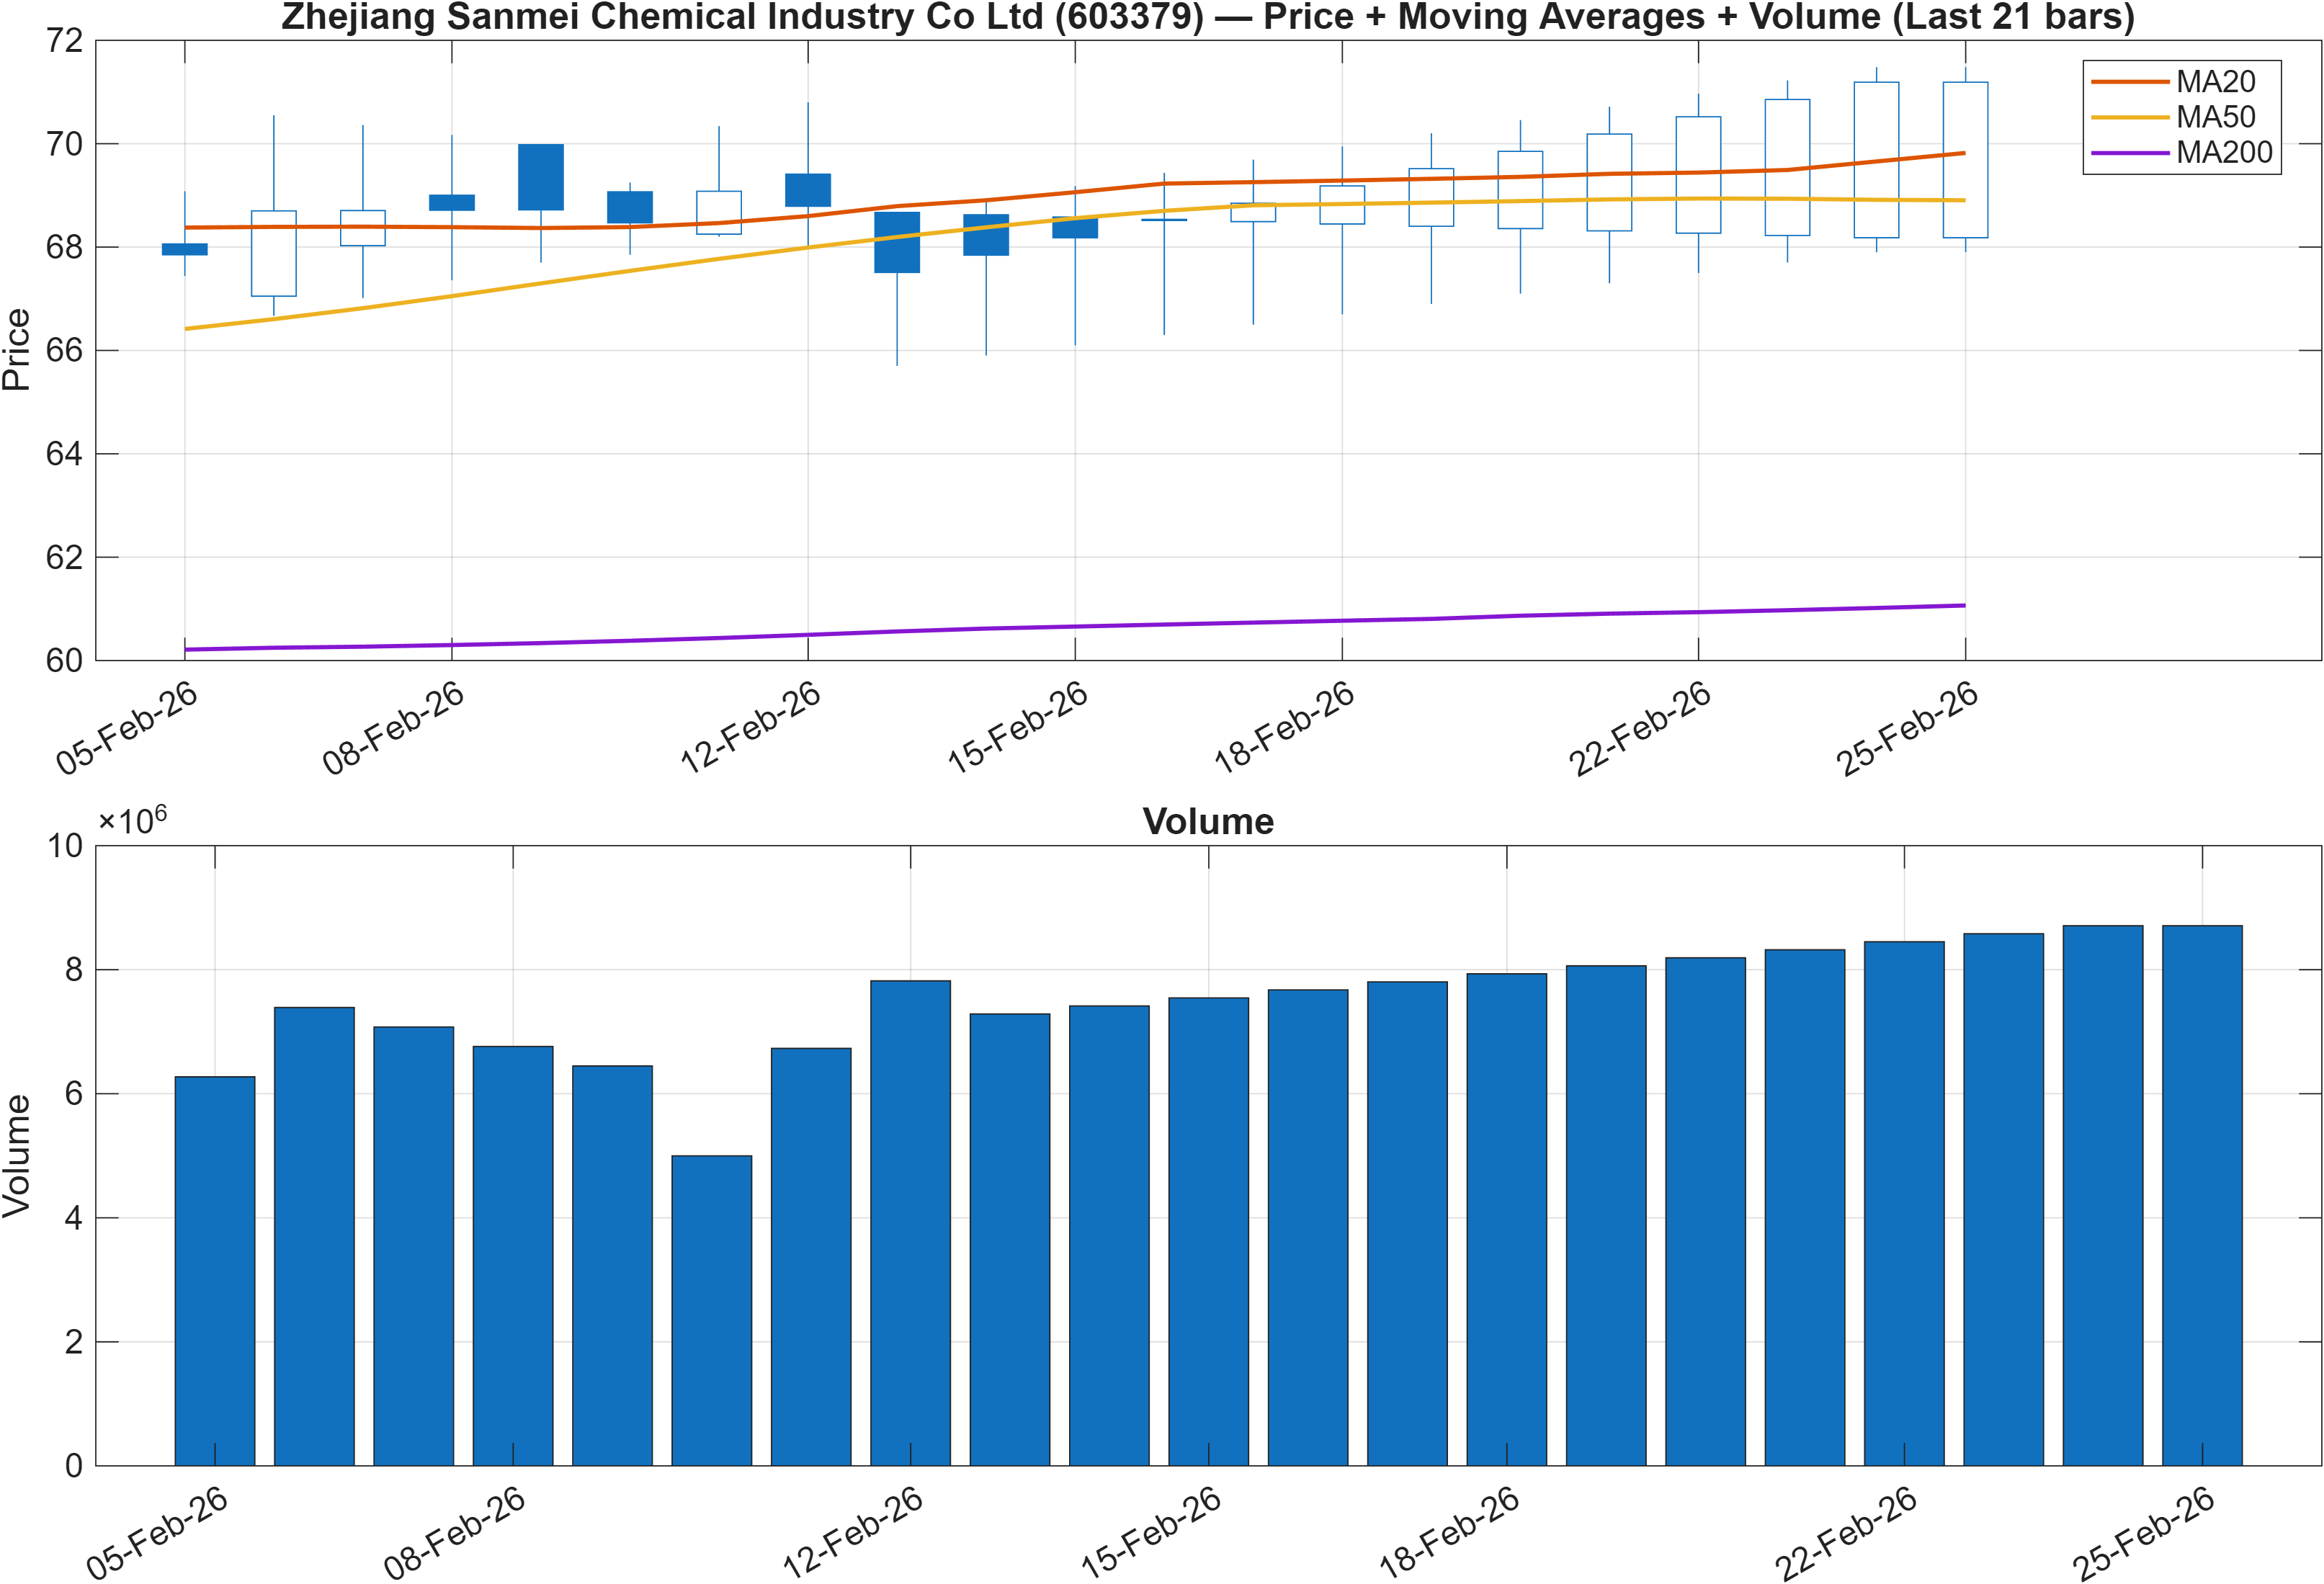
Price structure is currently defined by a constructive moving-average stack while the rank profile remains mixed. The framework’s interpretation flags close vs MA50 as Bullish and MA50 vs MA200 as Bullish, which typically corresponds to improving intermediate trend conditions and a market that is, at minimum, no longer fighting its own trend filters.
The analytical question is whether this trend filter strength is persistent or merely a feature of a sideways band where moving averages have turned up due to recent strength. The existence of a clearly defined resistance region (70.9900) and support zone (57.5633) argues that the market is still operating inside a structured range rather than a one-directional breakout environment.
Relative context also matters: the daily rank (#61) supports the idea that recent price behavior is outperforming most of the universe now, even as the monthly rank (#1002) indicates the larger window remains weak. When trend filters turn bullish in the presence of poor monthly rank, follow-through often depends on whether price can convert prior supply into support near resistance rather than simply tag it and fade.
Volume is referenced in the scenario logic for a reason: a resistance break “with volume” is treated as a higher-quality continuation condition, while weakness below the support zone elevates the risk that the bullish moving-average configuration is not durable. In other words, the trend read is supportive, but the market still needs to validate that support through behavior around 70.9900 and 57.5633.
Interpretation: Close vs MA50 = Bullish, MA50 vs MA200 = Bullish.
3) Momentum & volatility dashboard
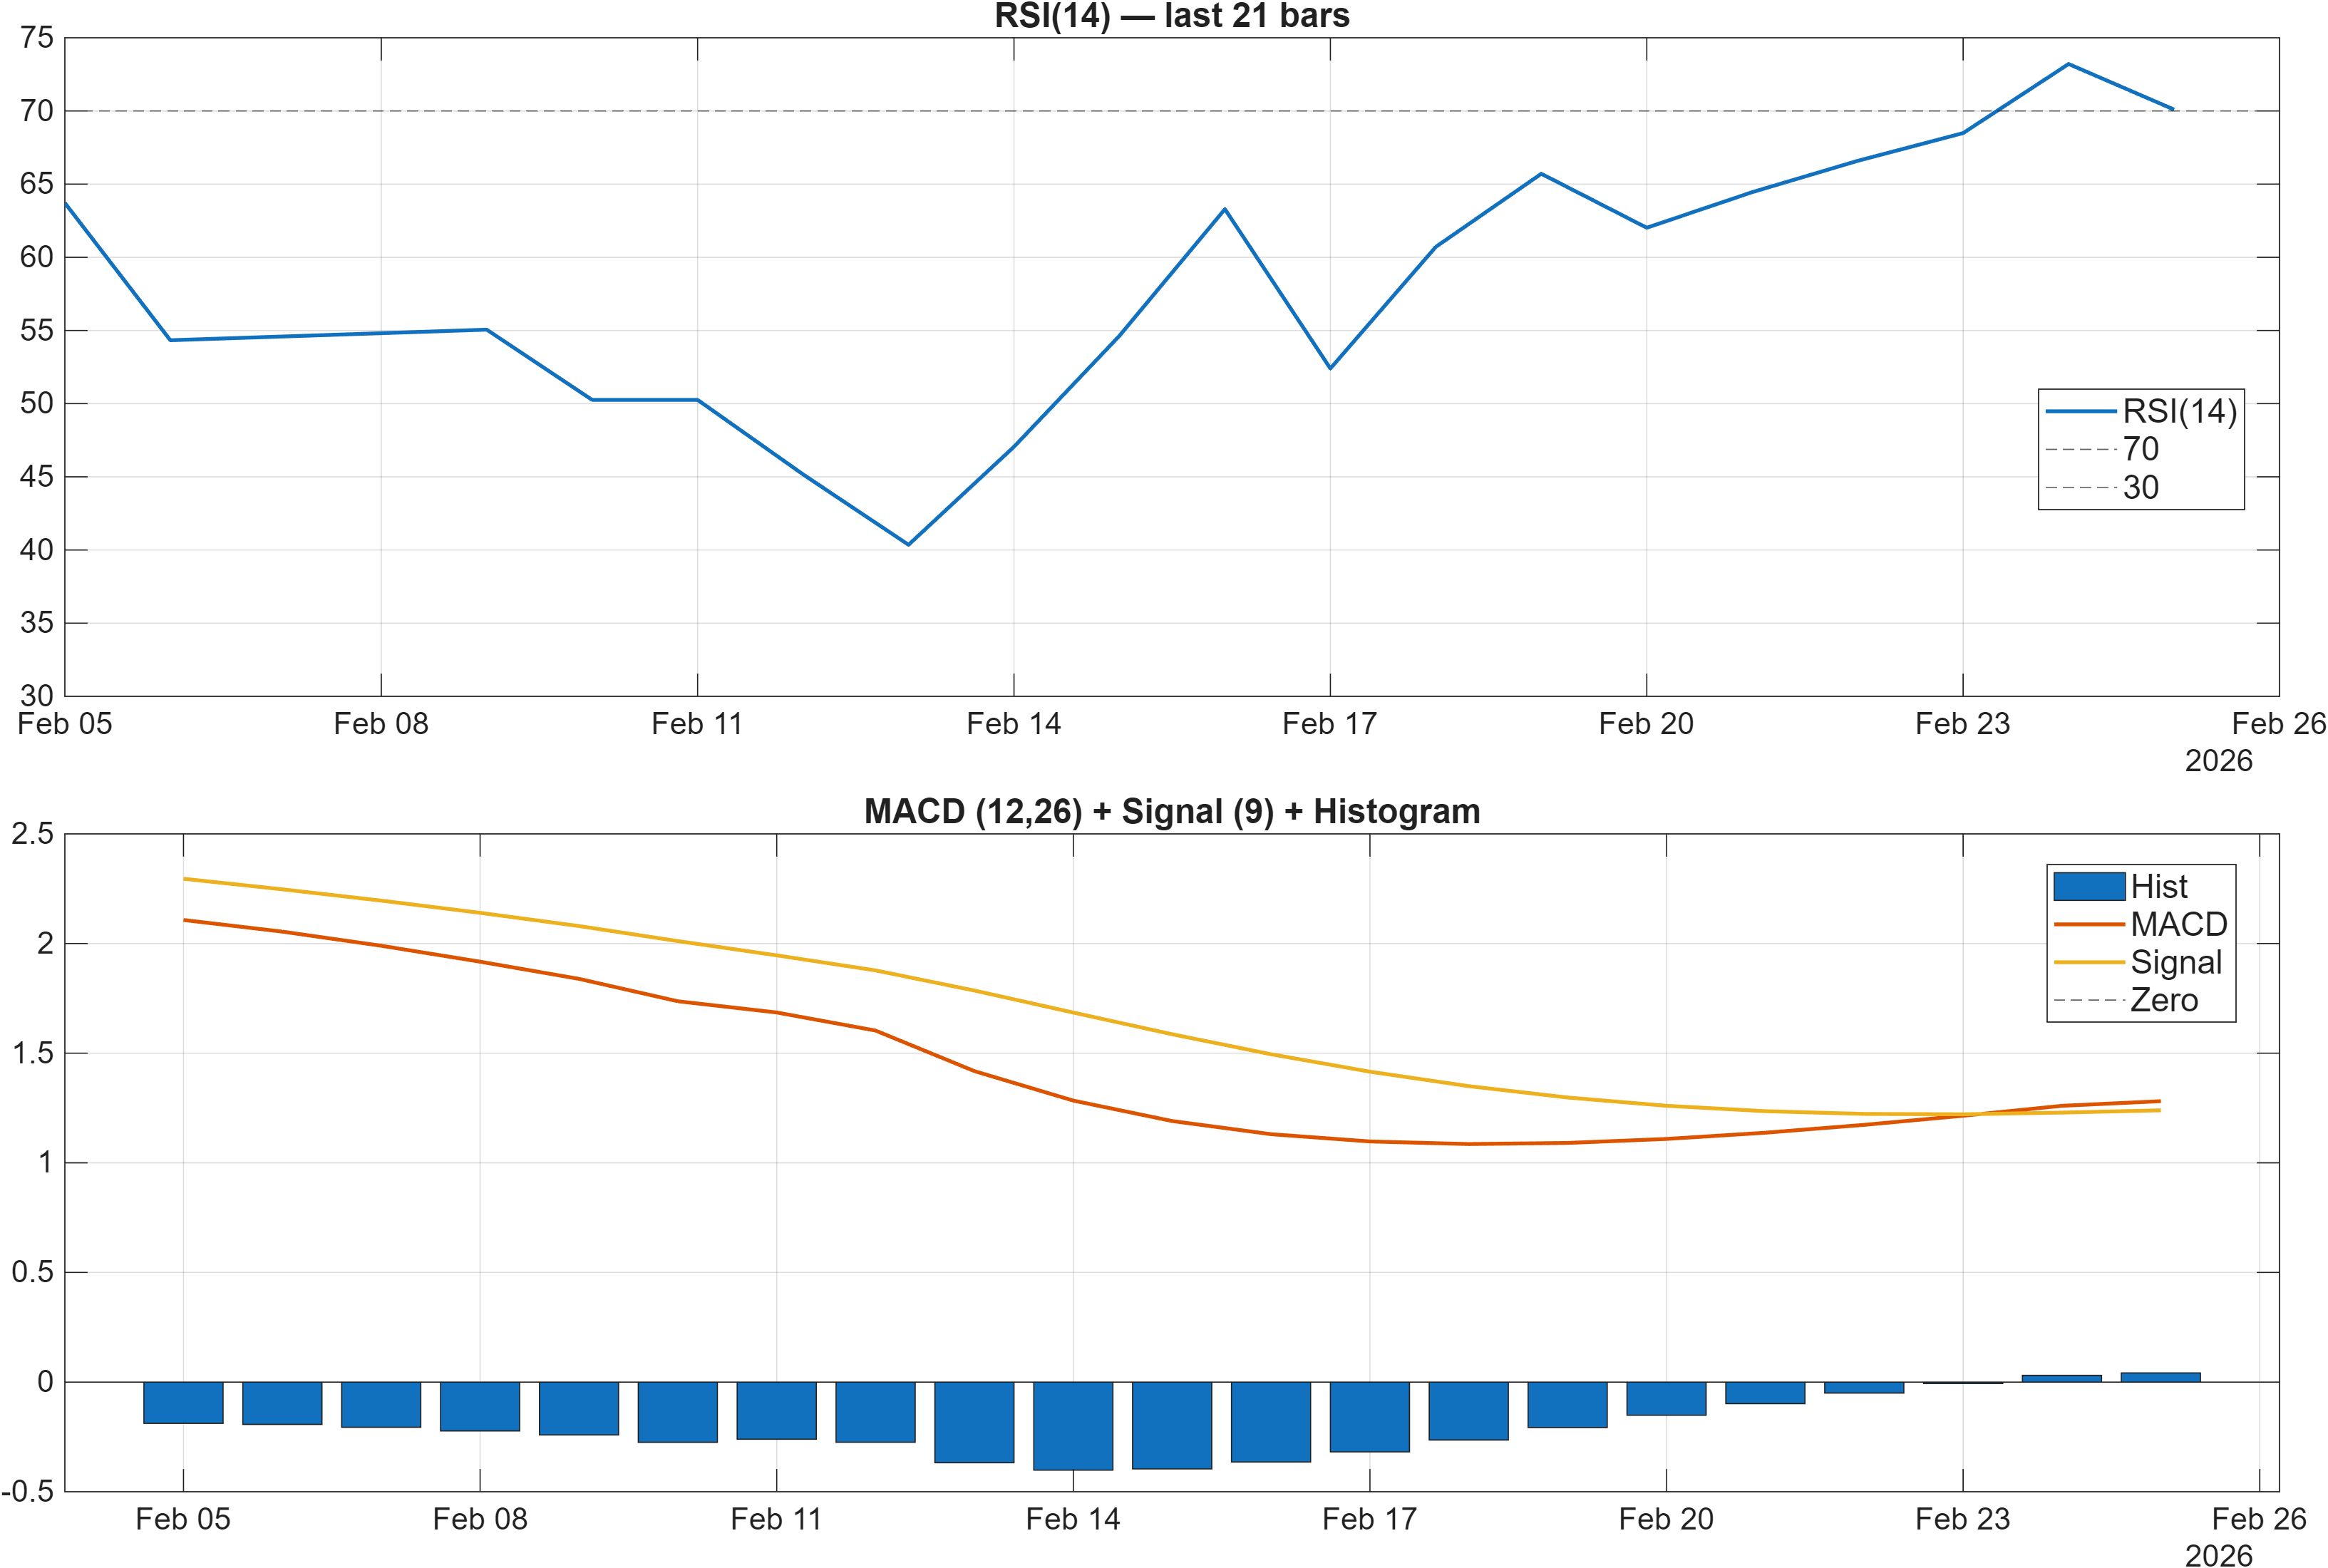
Momentum signals are broadly supportive, but the mix suggests late-stage strength rather than early-cycle acceleration. The dashboard interpretation reads RSI bias = Bullish, and the signal table confirms RSI(14) at 70.1 as Bullish. At the same time, elevated RSI values can coincide with either trend continuation or short-term exhaustion—especially when the broader market is range-bound.
MACD is also pointing in a constructive direction: the stated MACD histogram is 0.0417 (and in the signal table MACD Hist 0.04166 is Bullish). A positive histogram typically indicates positive momentum carry, but the magnitude here is modest enough that it aligns with a “grind higher” profile rather than a high-impulse breakout—consistent with sideways-to-up behavior.
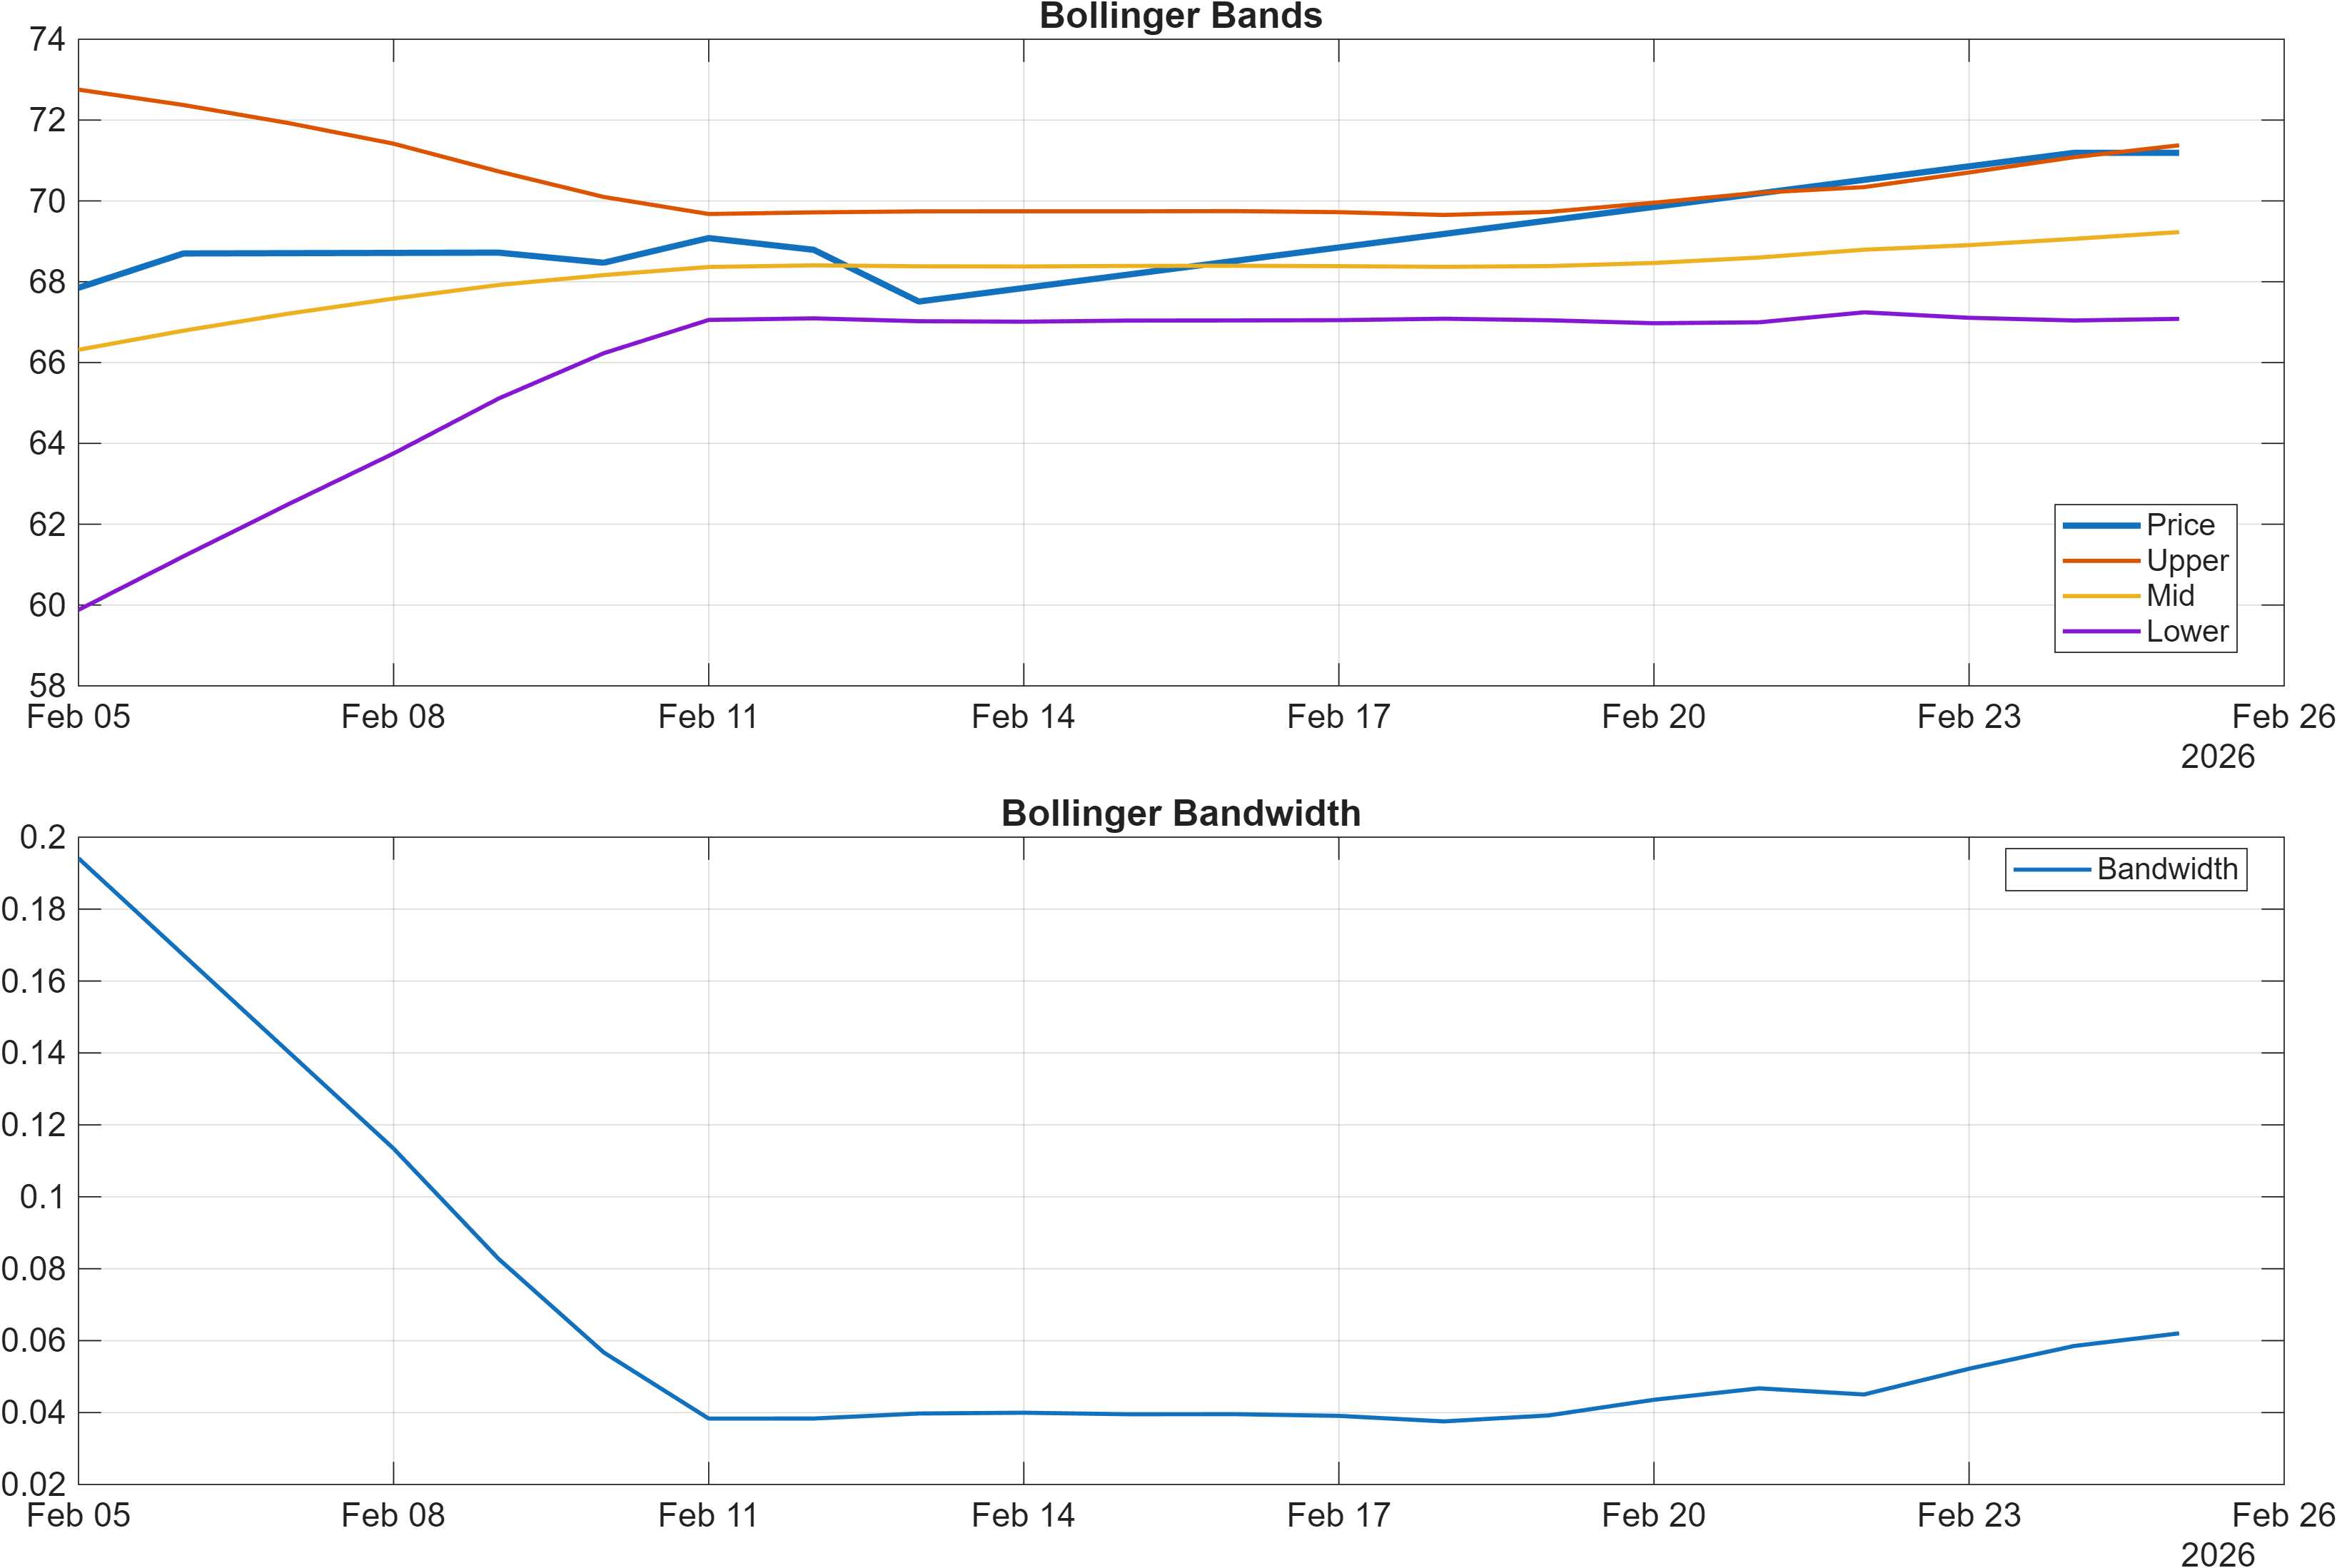
Volatility diagnostics reinforce the “contained regime” view. The latest Bollinger bandwidth is 0.0620 (signal table: BB Width 0.06202, Bullish), suggesting volatility is not aggressively expanding. In many setups, lower-to-moderate bandwidth can precede expansion, but it can also persist in a stable range—making level-based confirmation more valuable than indicator-only inference.
The broader signal set embeds an internal check on overextension: Stoch %K at 94.4 is Bearish, while other momentum measures such as ROC(20) at 3.624 are Bullish. That combination often reflects a market that is strong, but near the upper end of its recent distribution—supporting patience around resistance rather than chasing momentum.
Interpretation: RSI bias = Bullish, MACD hist = 0.0417.
Interpretation: Bandwidth (volatility regime) latest = 0.0620.
4) Support / Resistance zones
Support ~ 57.5633 | Resistance ~ 70.9900
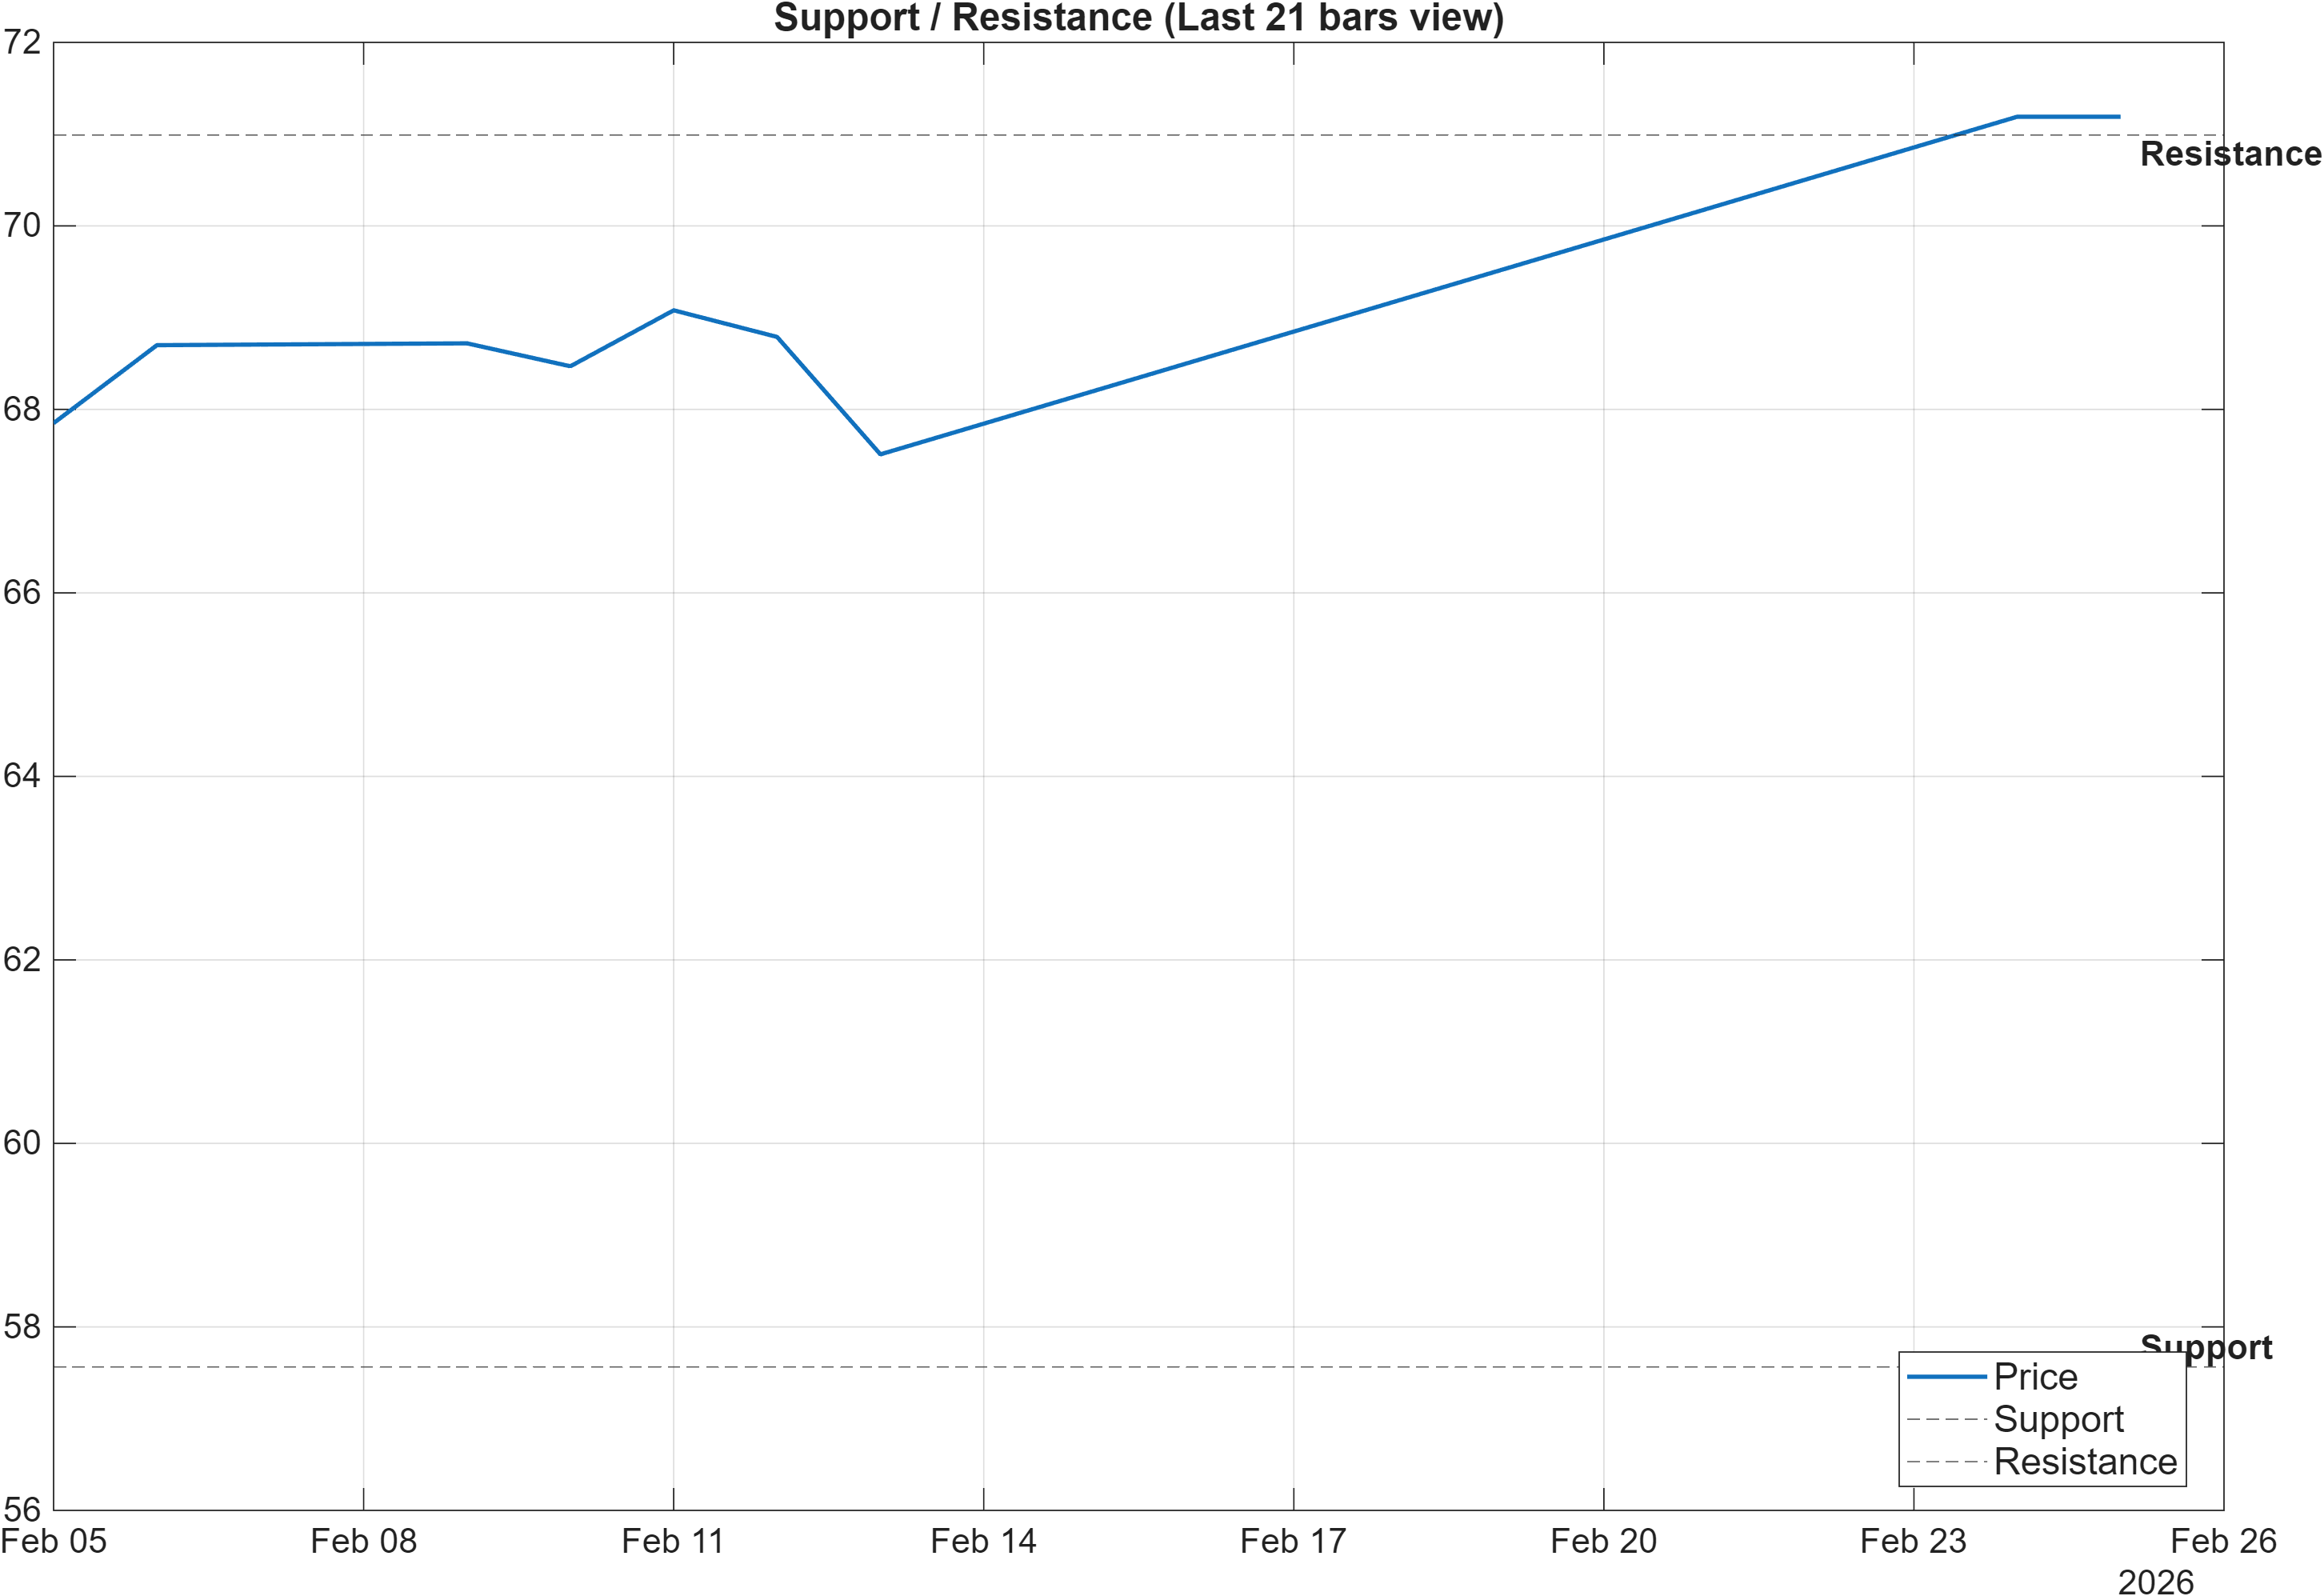
The level map defines the decision framework more clearly than any single oscillator. With support at 57.5633 and resistance at 70.9900, the instrument is operating within well-specified probabilistic zones. Given the mixed rank regime—daily strong (#61) but monthly weak (#1002)—these zones act as the primary arbiter of whether the recent strength is a durable transition or a range-bound oscillation.
The scenario statement is deliberately conditional: a break above resistance with volume is treated as continuation, while a close below support signals deterioration risk. This symmetry is particularly relevant when RSI is already elevated at 70.1. Elevated momentum can help pressure resistance, but it can also be where mean reversion begins if the level is not absorbed.
From a market-structure perspective, 70.9900 functions as the supply test—where previous selling interest is likely to concentrate. A clean resolution tends to require not just an intraday breach but sustained acceptance above the zone. Conversely, 57.5633 is the integrity level for the bullish technical stack: falling through that area would challenge the bullish moving-average interpretation and could pull shorter-horizon ranks back toward the weaker monthly regime.
The more volatility remains contained (bandwidth 0.0620), the more these zones tend to dominate outcomes. In a low-expansion environment, price often oscillates between decision levels, and false breaks are more common—raising the value of volume-confirmed closes relative to intrabar moves.
Scenario view: Break above resistance with volume → continuation. Close below support → signal deterioration risk.
5) Quant Technical Dashboard (18 Signals)
KGNAI AI Technical Analysis Score (Deep Reinforcement Learning): Rank #95 out of 1026 (Rank 1 represents the strongest technical positioning and a higher probability of favorable price behavior. As ranks increase toward the maximum, the probability of favorable outcomes weakens and bearish positioning becomes more dominant.) | Label: Bullish | Score: 0.815
18-Signal Technical Confluence Score: 0.611 (Bullish)
Overall Technical Score (18-signal confluence + DRL rank blend): 0.672 (Bullish)
Note: The blended score reflects signal strength weighted against broader AI technical ranking, which may temporarily diverge.
Blended technical score breakdown: 0.672 (Bullish | Bull 14 / Bear 3 / Neutral 1)
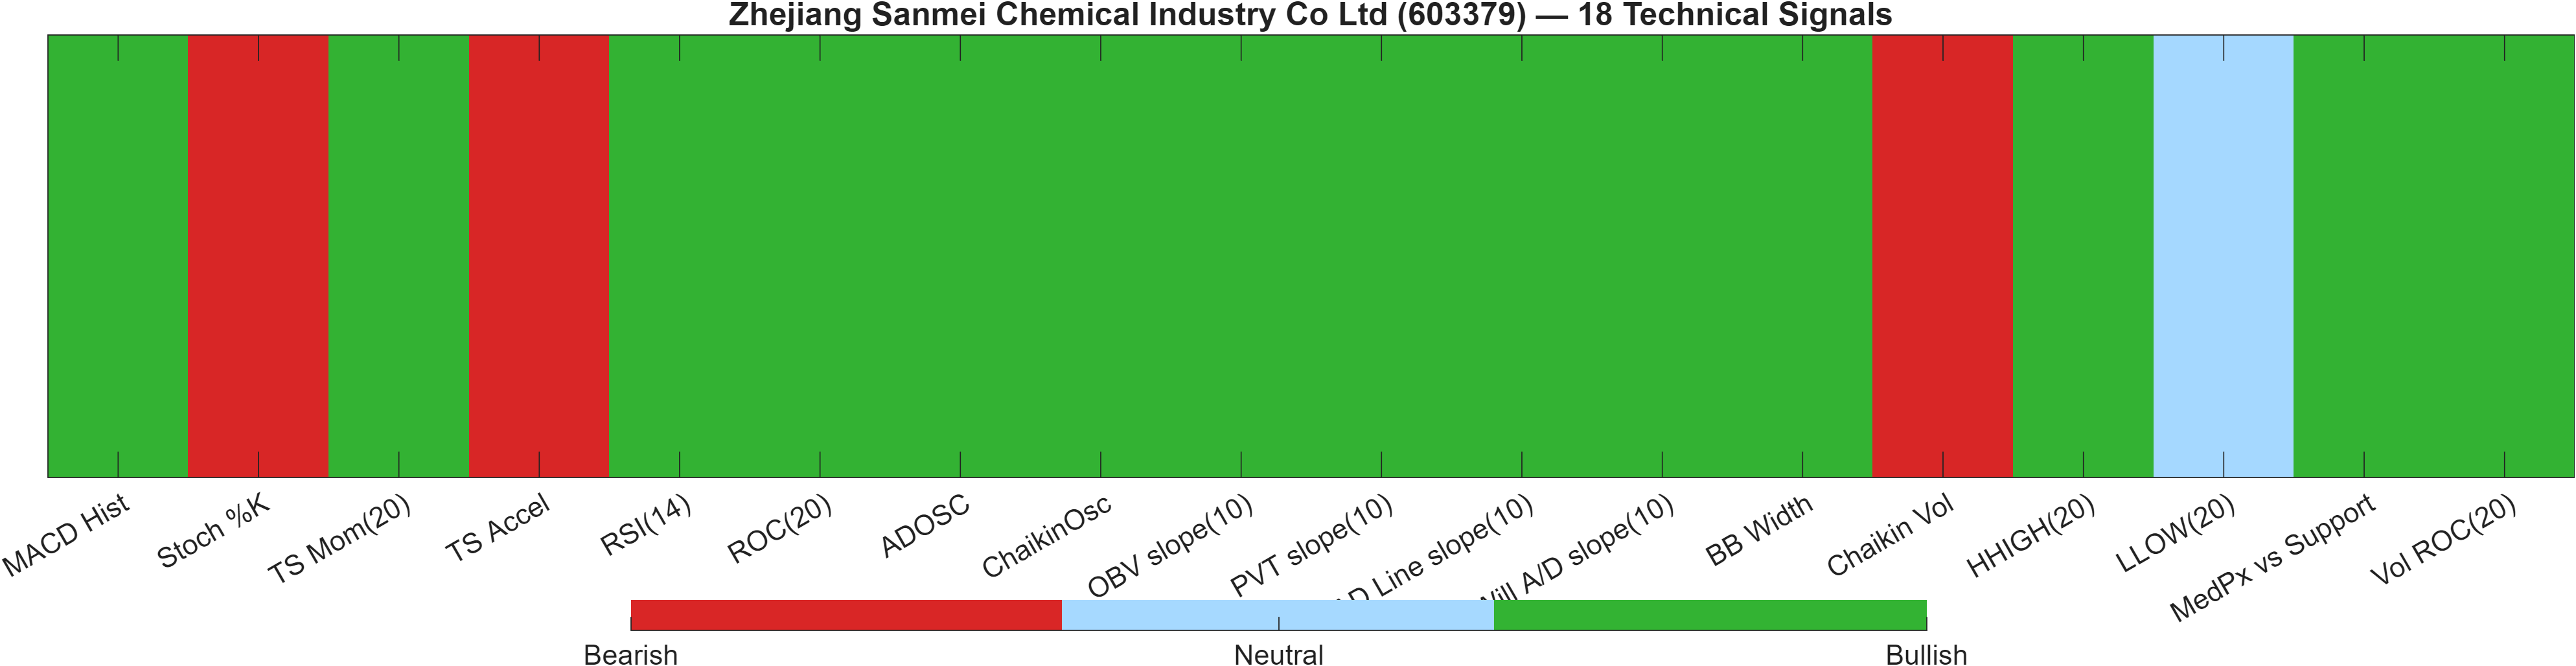
The technical dashboard is one of the clearest areas of alignment in the report. The Deep Reinforcement Learning technical rank is #95 out of 1026 with a Bullish label and score 0.815, placing the setup in a relatively strong technical cohort even as fundamental ranking horizons remain mixed. In parallel, the 18-signal confluence score is 0.611 (Bullish), and the blended overall technical score is 0.672 (Bullish). The blend matters: it reduces the chance that one clustered indicator family dominates the conclusion.
Breadth within the signals is also favorable: Bull 14 / Bear 3 / Neutral 1 implies the bullish view is not narrowly concentrated. That said, the presence of a few bearish readings (for example, Stoch %K 94.4 Bearish and Chaikin Vol 18.26 Bearish) is consistent with a market that can be strong while still vulnerable to short, sharp mean reversion—especially near resistance.
Volume/flow proxies are predominantly supportive, with accumulation-type metrics flagged bullish (e.g., ADOSC 92.04 and OBV slope(10) 7.372e+07). When these signals align with a positive MACD histogram (0.04166) and a bullish volatility regime read (BB Width 0.06202), the technical case is generally that pullbacks are more likely to be absorbed—unless price violates the defined support zone at 57.5633.
The key analytical constraint is regime: with the monthly rank still deeply bearish (#1002), the technical dashboard is best treated as evidence of improving internal structure rather than a guarantee of sustained trend. Confirmation remains anchored to behavior at 70.9900 and to whether bullish breadth persists through any volatility expansion.
Signal table (Bull/Bear/Neutral)
| Indicator | Value | Signal |
|---|---|---|
| MACD Hist | 0.04166 | Bullish |
| Stoch %K | 94.4 | Bearish |
| TS Mom(20) | 2.49 | Bullish |
| TS Accel | -5.95 | Bearish |
| RSI(14) | 70.1 | Bullish |
| ROC(20) | 3.624 | Bullish |
| ADOSC | 92.04 | Bullish |
| ChaikinOsc | 1.725e+07 | Bullish |
| OBV slope(10) | 7.372e+07 | Bullish |
| PVT slope(10) | 3.547e+05 | Bullish |
| AD Line slope(10) | 5.438e+07 | Bullish |
| Will A/D slope(10) | 24.77 | Bullish |
| BB Width | 0.06202 | Bullish |
| Chaikin Vol | 18.26 | Bearish |
| HHIGH(20) | 71.48 | Bullish |
| LLOW(20) | 65.7 | Neutral |
| MedPx vs Support | 12.13 | Bullish |
| Vol ROC(20) | 17.84 | Bullish |
Interpretation: Indicator-level signals form the base confluence, which is then adjusted using a separate AI-driven technical ranking model. The final technical score summarizes this combined view.
6) News sentiment + extractive gist
Note: Instrument-specific news matches were not found, so the digest includes broader market/sector headlines. Links are provided for verification.
Sentiment score (avg): -0.013 | Positive: 0% | Neutral: 94% | Negative: 6%
KGNAI AI News Sentiment Score (normalized -1 to +1): Not available (as of —) | Label: Not available | Overall news score: -0.01
Positive Developments
Recent coverage across major financial outlets indicates a generally constructive tone around technology and innovation themes in China-linked headlines, which can support risk appetite at the margin even when not issuer-specific. In the context of this report, that matters because the tape is already showing a relatively strong short-horizon posture (daily rank #61) and a broadly bullish technical configuration (overall technical score 0.672). When macro/sector narratives are not overtly negative, technically supported instruments can sustain bids long enough to test key decision levels such as 70.9900. The key point is not that these stories are direct drivers for 603379, but that the surrounding information environment is not strongly conflicting with the chart-based evidence of improving momentum (RSI(14) 70.1) and a positive MACD histogram (0.0417).
Neutral / Mixed Developments
The sentiment distribution is dominated by neutrality—94% neutral with an average score of -0.013—which is consistent with a low-conviction information backdrop. For decision-making, neutral flow often shifts emphasis back to market structure: support at 57.5633, resistance at 70.9900, and whether volatility remains contained (bandwidth 0.0620) or begins to expand. Mixed or non-directional news also tends to align with sideways price regimes, where technical signals can remain bullish while progress slows near overhead supply. This is compatible with the rank dispersion (monthly #1002 vs daily #61): without strong narrative confirmation, the market may require clearer price acceptance above resistance before reclassifying the longer-horizon view.
Negative / Risk Signals
The negative share is small (6%), but risk signals in broad trade and geopolitical coverage can still introduce episodic volatility, particularly if they affect global demand expectations or market liquidity conditions. In a setup where RSI is elevated (70.1) and Stochastics are extended (94.4 Bearish), adverse headlines can increase the probability of sharp mean-reversion moves even if the primary trend filter remains bullish. From a framework perspective, the most actionable risk control remains level-based: a close below 57.5633 would be consistent with deterioration risk, and it would also likely pressure the short-term rank improvement that currently contrasts with the weak monthly posture (#1002). With the normalized news sentiment score Not available, the report treats news as contextual rather than determinative.
- Whether price can hold above resistance 70.9900 on a volume-backed move, rather than a brief intraday breach.
- Any shift away from the current heavy-neutral sentiment mix (94% neutral) toward more directional clustering.
- Volatility regime change: bandwidth stabilization near 0.0620 versus a sustained expansion.
Sources referenced: Reuters, Bloomberg, Yahoo Finance, MarketWatch, Investing.com
Snapshot: AI Rank (Short–Mid–Long): Mixed (Neutral–Bearish–Neutral) · Technical Confluence: Bullish · Key Levels: Support ~57.56 | Resistance ~70.99 · News Sentiment: Neutral
7) Sources
Instrument-specific news matches: Not available in the provided data. The original draft contained broader market/sector items; this section is presented as a compressed, non-attributed source summary per publication format.
You may also like: How KGNAI AI ranks instruments across global markets
Disclaimer: KGNAI provides AI-generated analytics and educational market commentary only. This is not financial advice. Markets involve risk. Always do your own research.