
688363 (Bloomage Biotechnology Corp Ltd) — 17-May-2026 Technical Read: Consolidation With Bearish Short-Term Pressure
Bloomage Biotechnology Corp Ltd (688363) is currently characterized by a short-term bearish posture within KGNAI’s cross-sectional universe, while longer horizons remain more balanced. The daily and weekly ranks sit in the lower tier of the 1292-instrument universe (#1139 and #1043), contrasting with a notably strong 3-month rank of #22, a profile that often appears when a prior up-cycle cools into consolidation and recent price action underperforms. Technically, the moving-average structure is bearish (close vs MA50 and MA50 vs MA200 both bearish), and momentum is weak with RSI(14) at 31.15 and MACD histogram at -0.1727. Volatility is not elevated (Bollinger bandwidth 0.0873), which can reduce the probability of immediate trend acceleration without a catalyst. Key decision zones are clearly defined around support ~40.3800 and resistance ~43.7483, framing what confirmation would look like for either stabilization or renewed deterioration.
- Rank stance: Short Bearish | Mid Neutral | Long Neutral
- Technical confluence: 18-signal score -0.333 Bearish; blended overall -0.277 Neutral
- Key levels: Support ~40.3800 | Resistance ~43.7483
- News sentiment bias: Neutral tilt (avg -0.013; Neutral 94%)
- Confirmation / invalidation: A break above 43.7483 with volume improves continuation odds; a close below 40.3800 raises deterioration risk.
What KGNAI Measures
KGNAI evaluates assets using large cross-sectional datasets built from millions of structured data points. Inputs incorporate fundamental metrics, technical structures, and systematically processed news sentiment. Statistical models, machine learning, and AI frameworks are used to assess relative positioning, signal alignment, and probabilistic behavior across broad universes.
How to Read This Report
- Ranks are comparative across the tracked universe, not absolute price targets.
- Confluence reflects alignment among independent signal groups.
- Support/resistance levels are probabilistic decision zones, not guarantees.
- Sentiment provides contextual bias within the broader analytical framework.
1) KGNAI AI Analysis
Region: CHINA
Total universe size: 1292 ranked instruments
- Daily rank: #1139 out of 1292 — Bearish
- Weekly rank: #1043 out of 1292 — Bearish
- Monthly rank: #866 out of 1292 — Neutral
- 3-Monthly rank: #22 out of 1292 — Bullish
- 6-Monthly rank: #173 out of 1292 — Bullish
- Yearly rank: #768 out of 1292 — Neutral
The rank stack for 688363 is defined by time-horizon divergence. Near-term ranks are weak (daily #1139, weekly #1043), placing the instrument toward the lower portion of the universe and aligning with a short-term Bearish stance. In contrast, the 3-month rank of #22 sits near the top of the universe, with the 6-month rank #173 still comfortably in the upper tier. This combination typically implies the larger trend context has been constructive, but recent behavior has deteriorated enough to pressure shorter-horizon models.
The monthly rank (#866) and yearly rank (#768) remain Neutral, suggesting the broader distribution of outcomes is not skewed strongly in either direction on those horizons. In regime terms, this reads less like a trend reversal confirmed across models and more like a compression phase where the strongest mid-horizon signal has not been fully invalidated, but short-term underperformance is real.
The stated term view—short-term bearish, mid-term neutral, long-term neutral—fits that interpretation. Practically, the analytical burden for a more constructive view would be to see the short-term ranks recover meaningfully without undermining the longer-horizon positioning that produced the #22 reading at 3 months. Absent that, the current configuration implies fragile consolidation rather than stable accumulation.
Want the full universe and complete rank tables? Unlock full access on KGNAI: https://www.kgnai.com/pricing
2) Price & trend overview
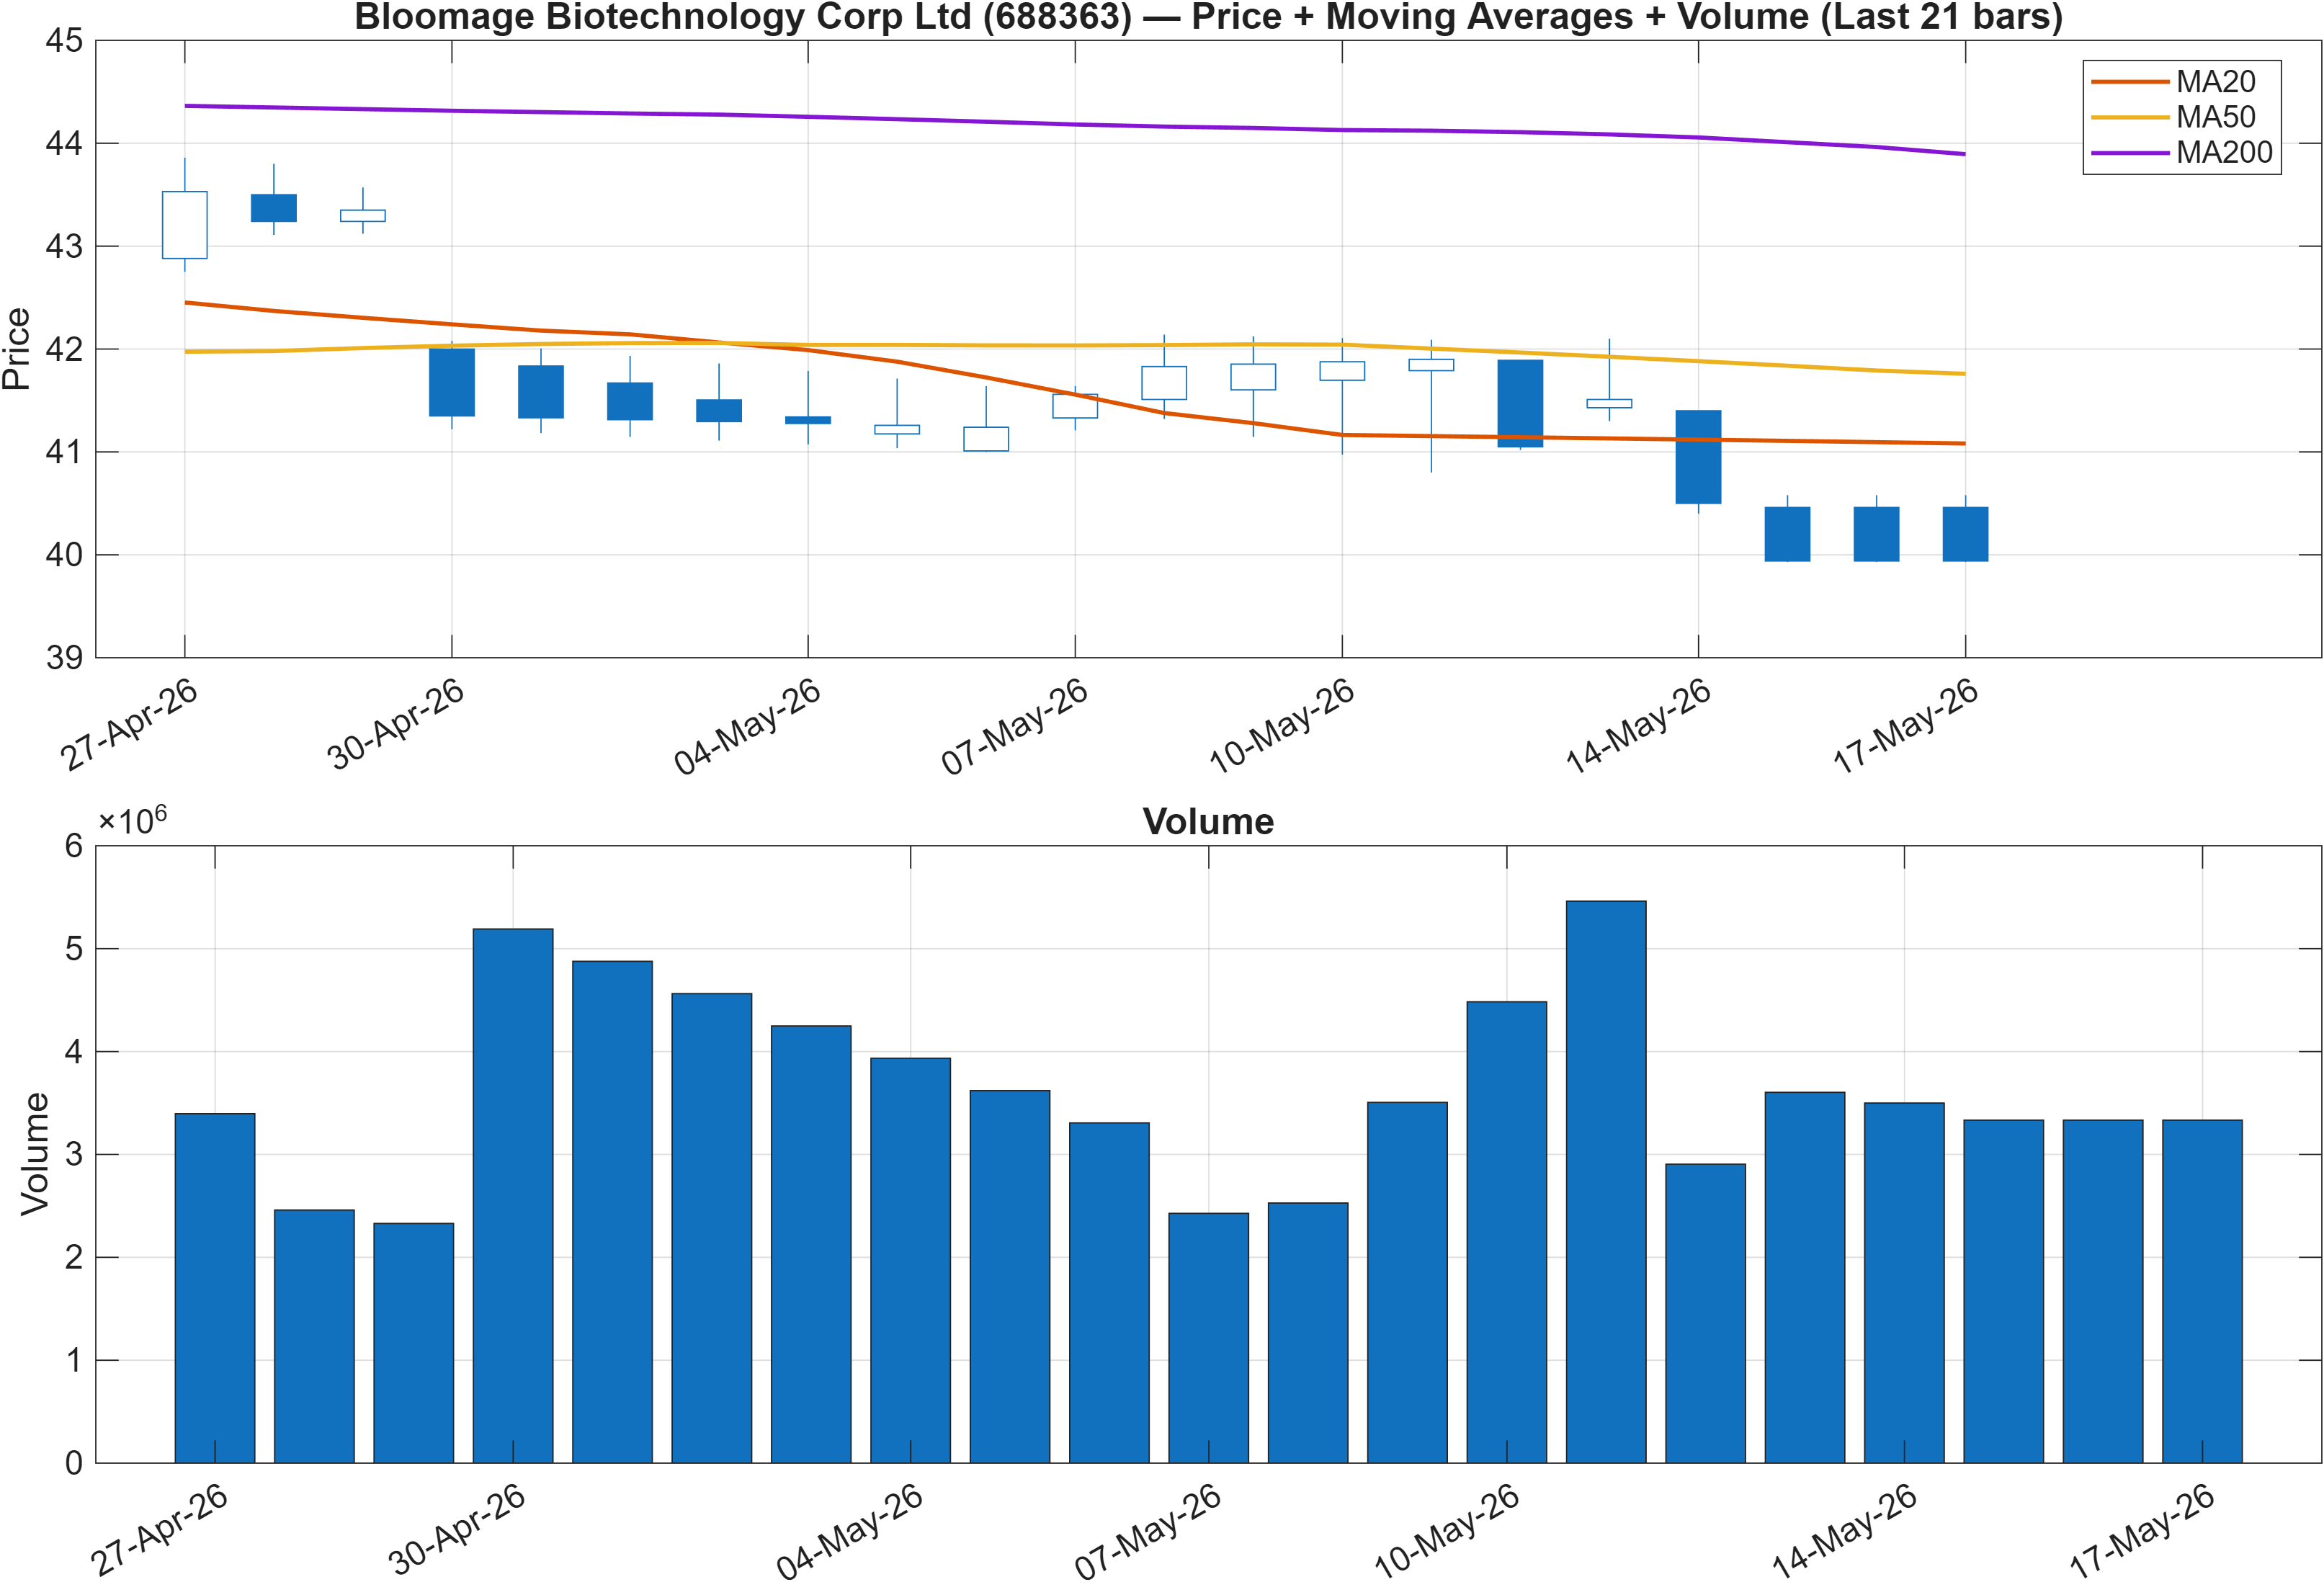
The moving-average configuration is uniformly tilted to the downside: close vs MA50 is bearish, and MA50 vs MA200 is bearish. That pairing typically reflects a market where both the immediate trend and the longer baseline are not yet supportive of sustained upside follow-through. When price sits below the intermediate average while the intermediate sits below the long average, rebounds often face overhead supply before they can transition into a durable uptrend.
What stands out in this report is the tension between trend structure and the rank history: the 3-month rank (#22) signals that, within that horizon, the asset has displayed comparatively favorable behavior versus the 1292-instrument peer set. The current bearish MA stack suggests that advantage has weakened recently, which helps explain why the daily and weekly ranks are now deep in bearish territory (#1139, #1043). In other words, longer-horizon relative strength can coexist with a short-horizon downshift when a prior trend is cooling into consolidation.
From a market-structure perspective, this is where confirmation matters more than narrative. The nearby technical decision zones—support ~40.3800 and resistance ~43.7483—provide an objective frame for whether the current consolidation is stabilizing or simply pausing before another leg lower. With the MA200 relationship still bearish, the evidence required for a clean regime transition is higher: the market would generally need to reclaim and hold key levels while showing improving breadth/participation signals.
Until that occurs, the trend read is best described as bearish pressure within a consolidation attempt, where rallies are more likely to be evaluated for quality (participation/volume, momentum confirmation) rather than assumed to be trend continuation.
3) Momentum & volatility dashboard
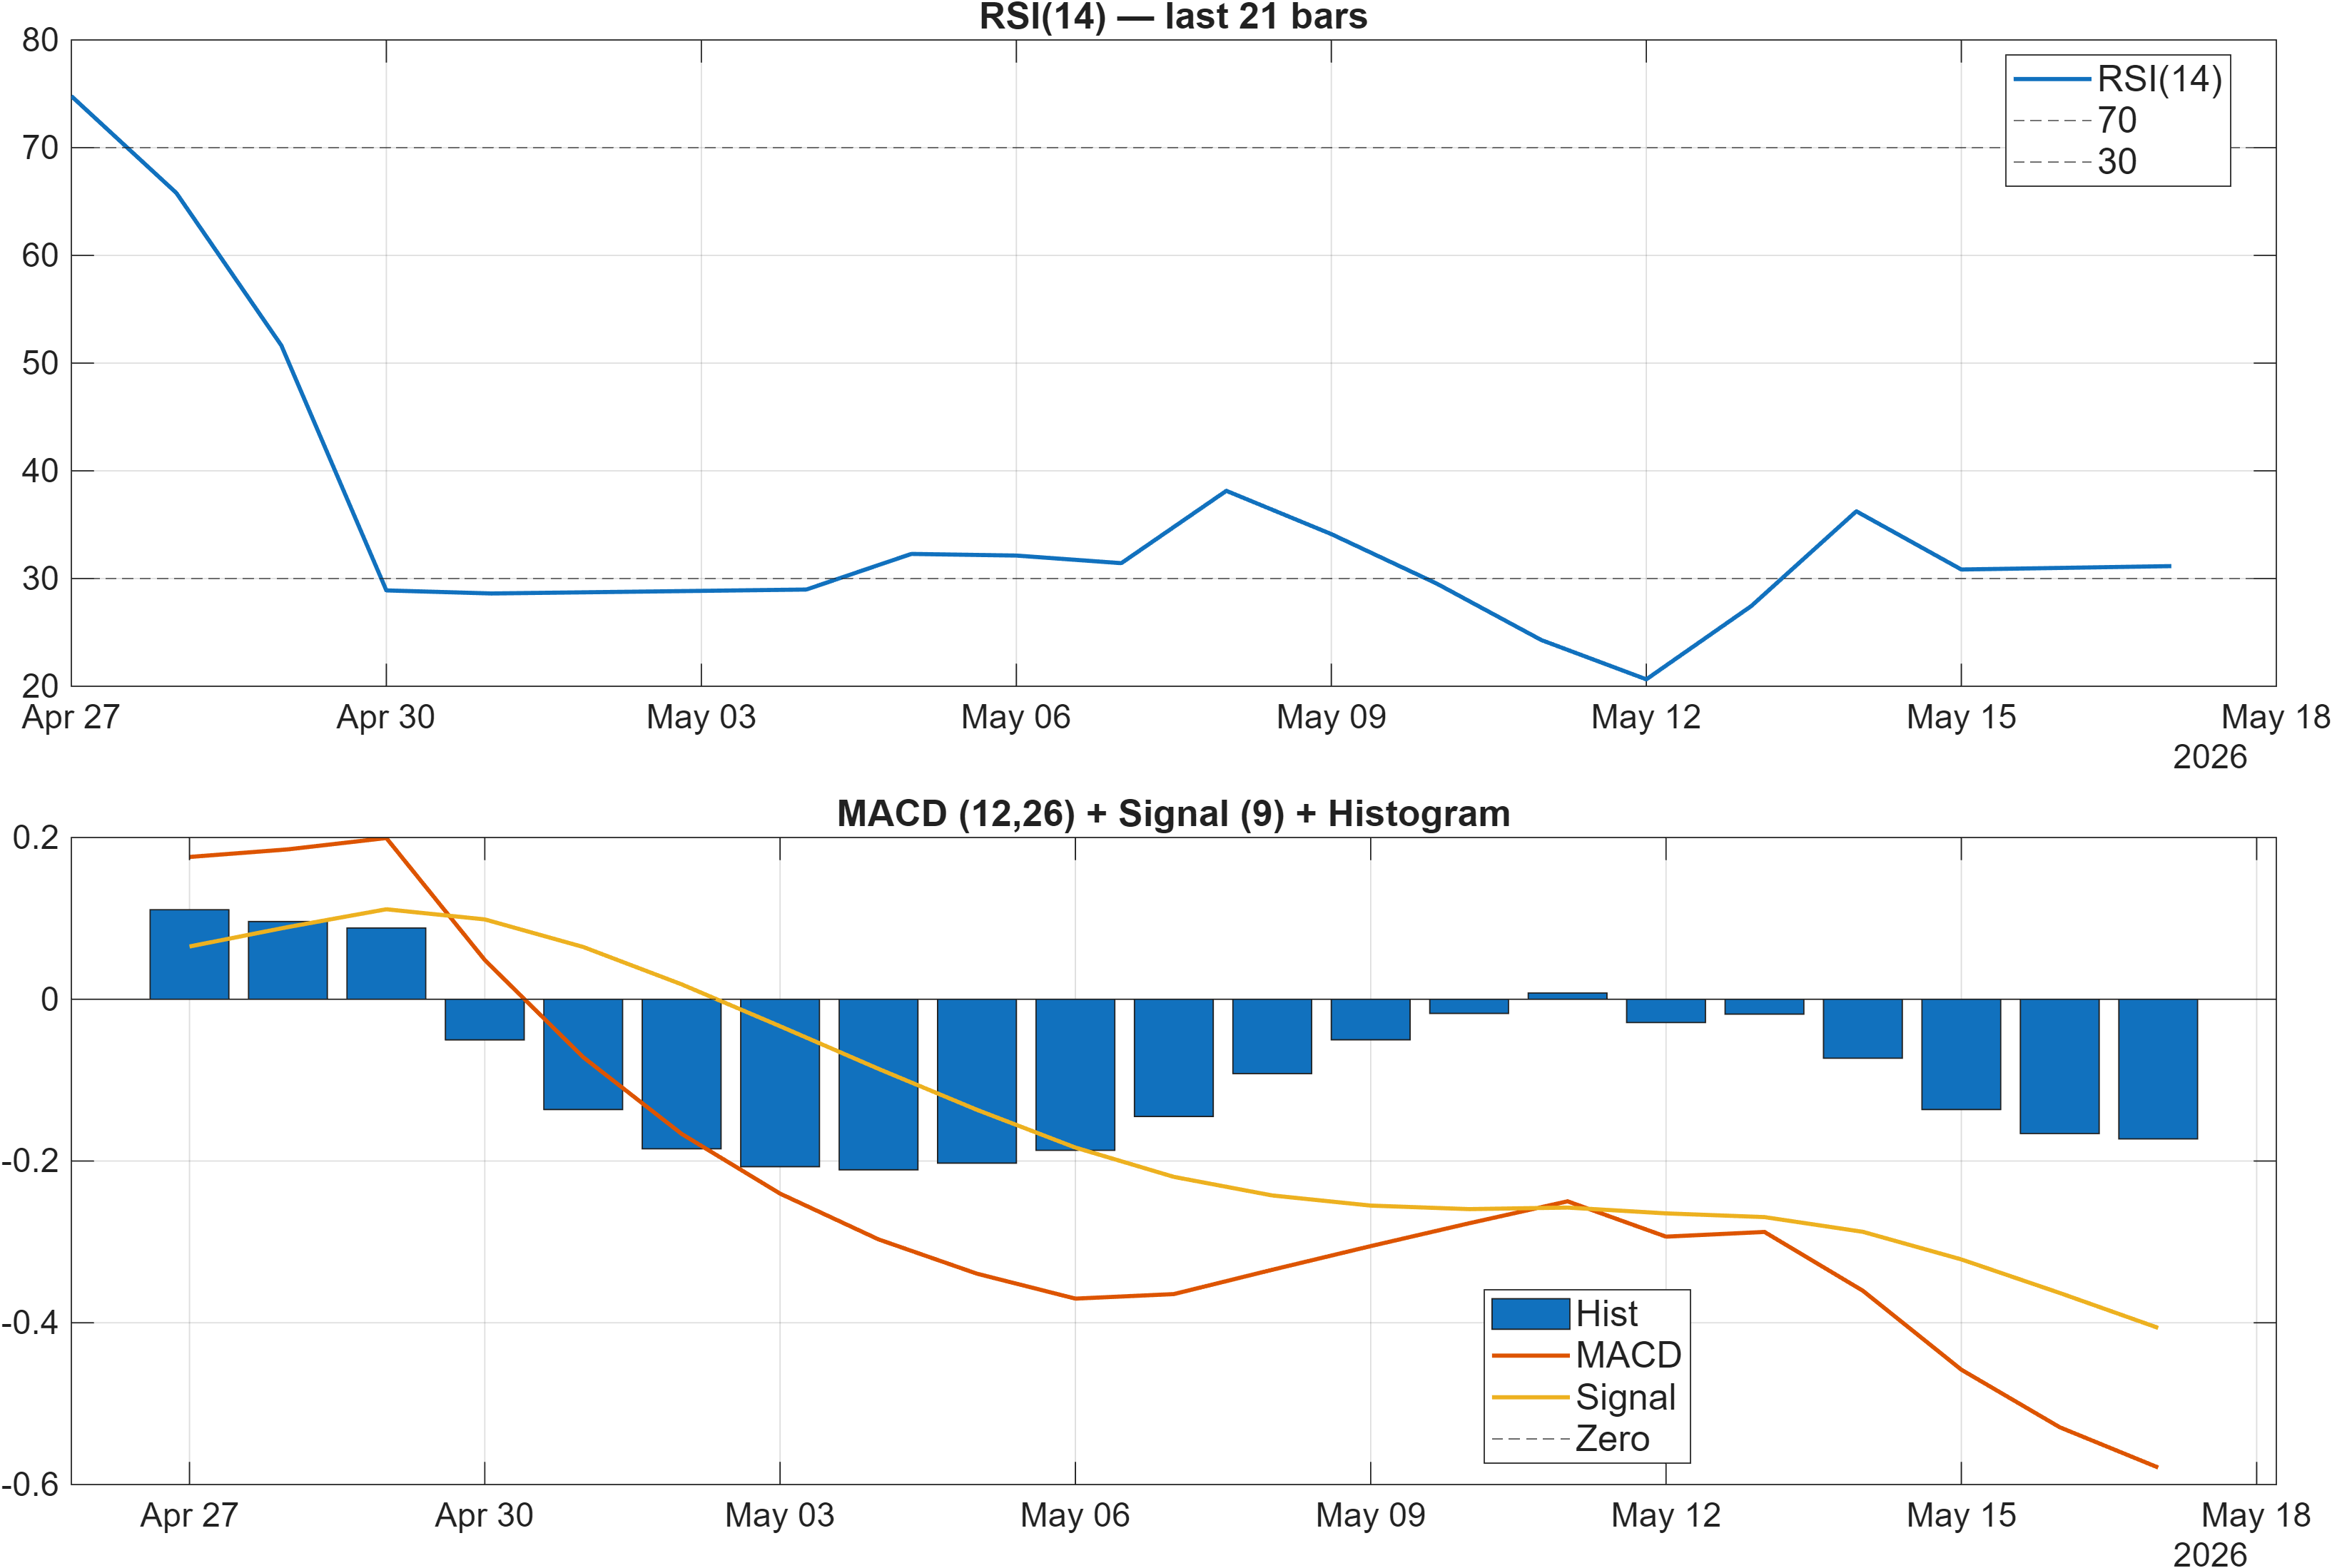
Momentum conditions remain tilted to the downside. The dashboard flags RSI bias as bearish, with RSI(14) at 31.15, which is consistent with a market that is closer to the lower end of its recent momentum range. While low RSI readings can sometimes coincide with late-stage selling, the framework here does not treat oversold as a buy signal; it treats it as a sign that downside momentum has dominated.
MACD reinforces that message: the MACD histogram is -0.1727, indicating negative momentum persistence rather than a confirmed turn. In combination with the bearish moving-average structure (Section 2), the momentum profile suggests that any bounce attempt would need to show clear stabilization evidence before it can be interpreted as a transition, rather than a mean-reversion move within a downtrend.
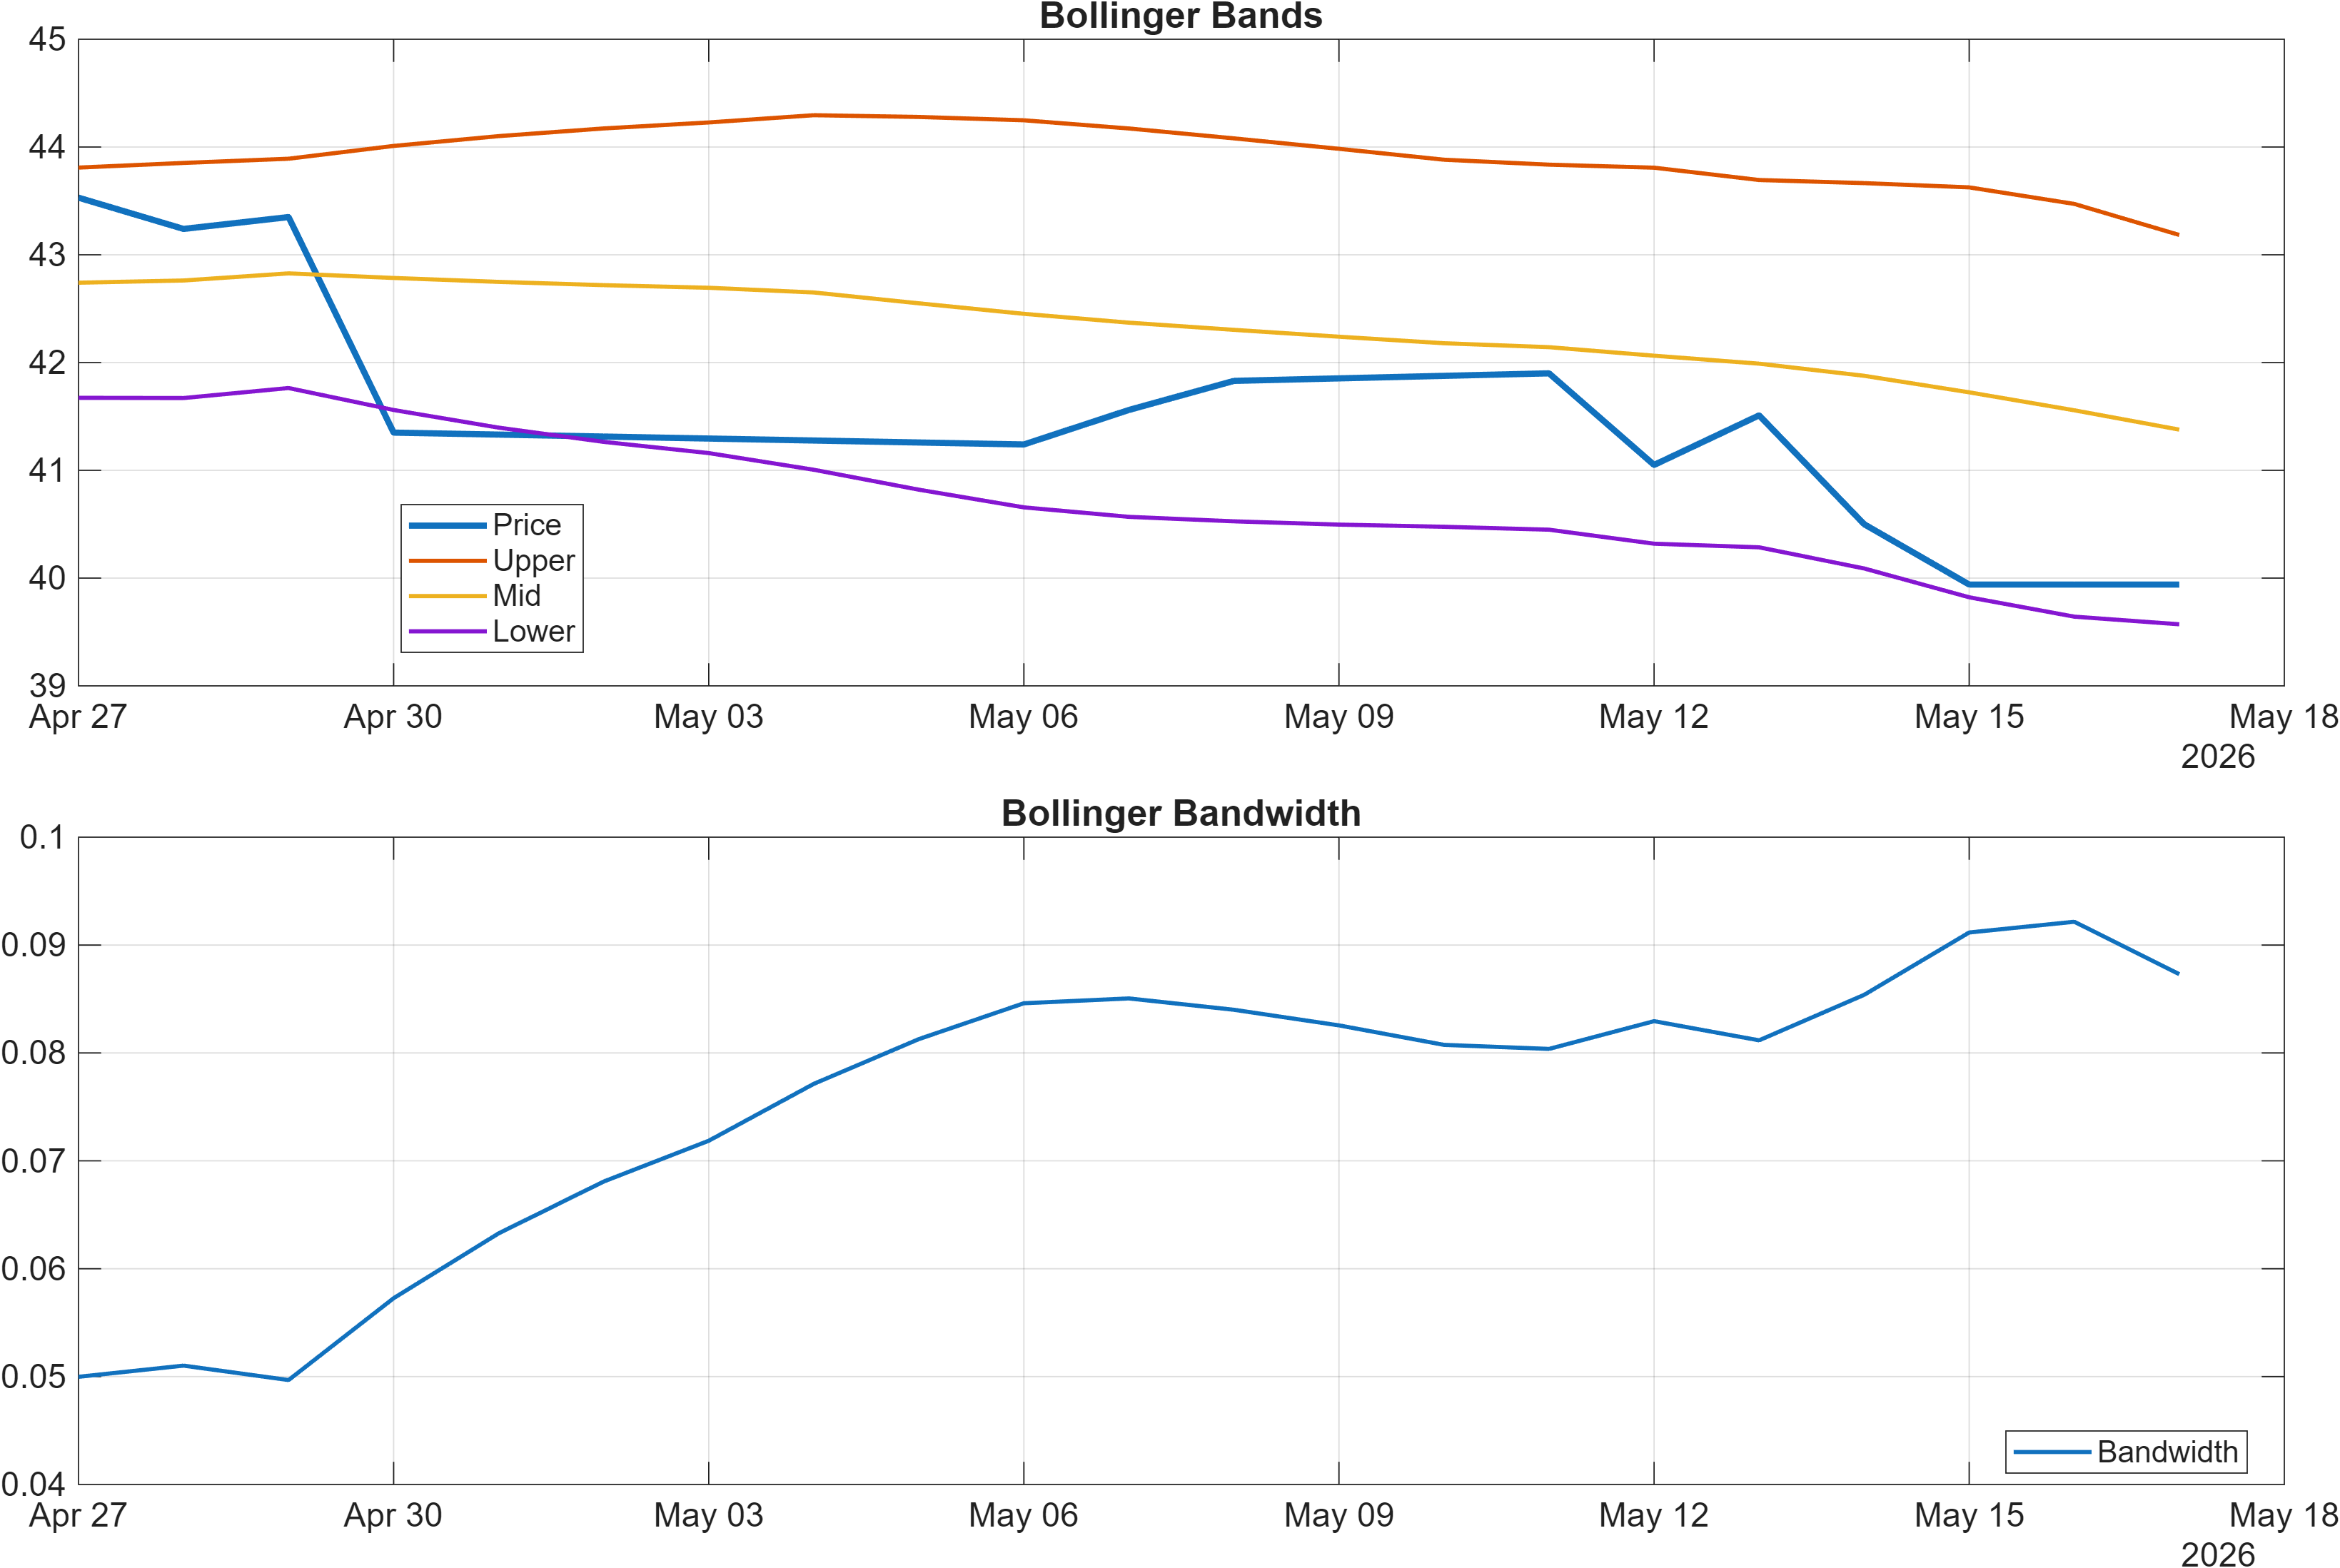
Volatility is comparatively contained. The latest Bollinger bandwidth is 0.0873, consistent with a compressed volatility regime rather than a high-impulse expansion. This matters because bearish momentum inside a low-volatility environment can produce two different outcomes: (1) gradual drift lower as sellers maintain control, or (2) a base-building process where volatility compresses ahead of a directional resolution.
The practical implication is that a directional break tends to be more informative when it is paired with confirmation—especially around the defined levels (40.3800 / 43.7483). Without that, the momentum/volatility mix reads as weak momentum with limited volatility expansion, which often keeps price action range-bound until a catalyst or participation shift emerges.
4) Support / Resistance zones
Support ~ 40.3800 | Resistance ~ 43.7483
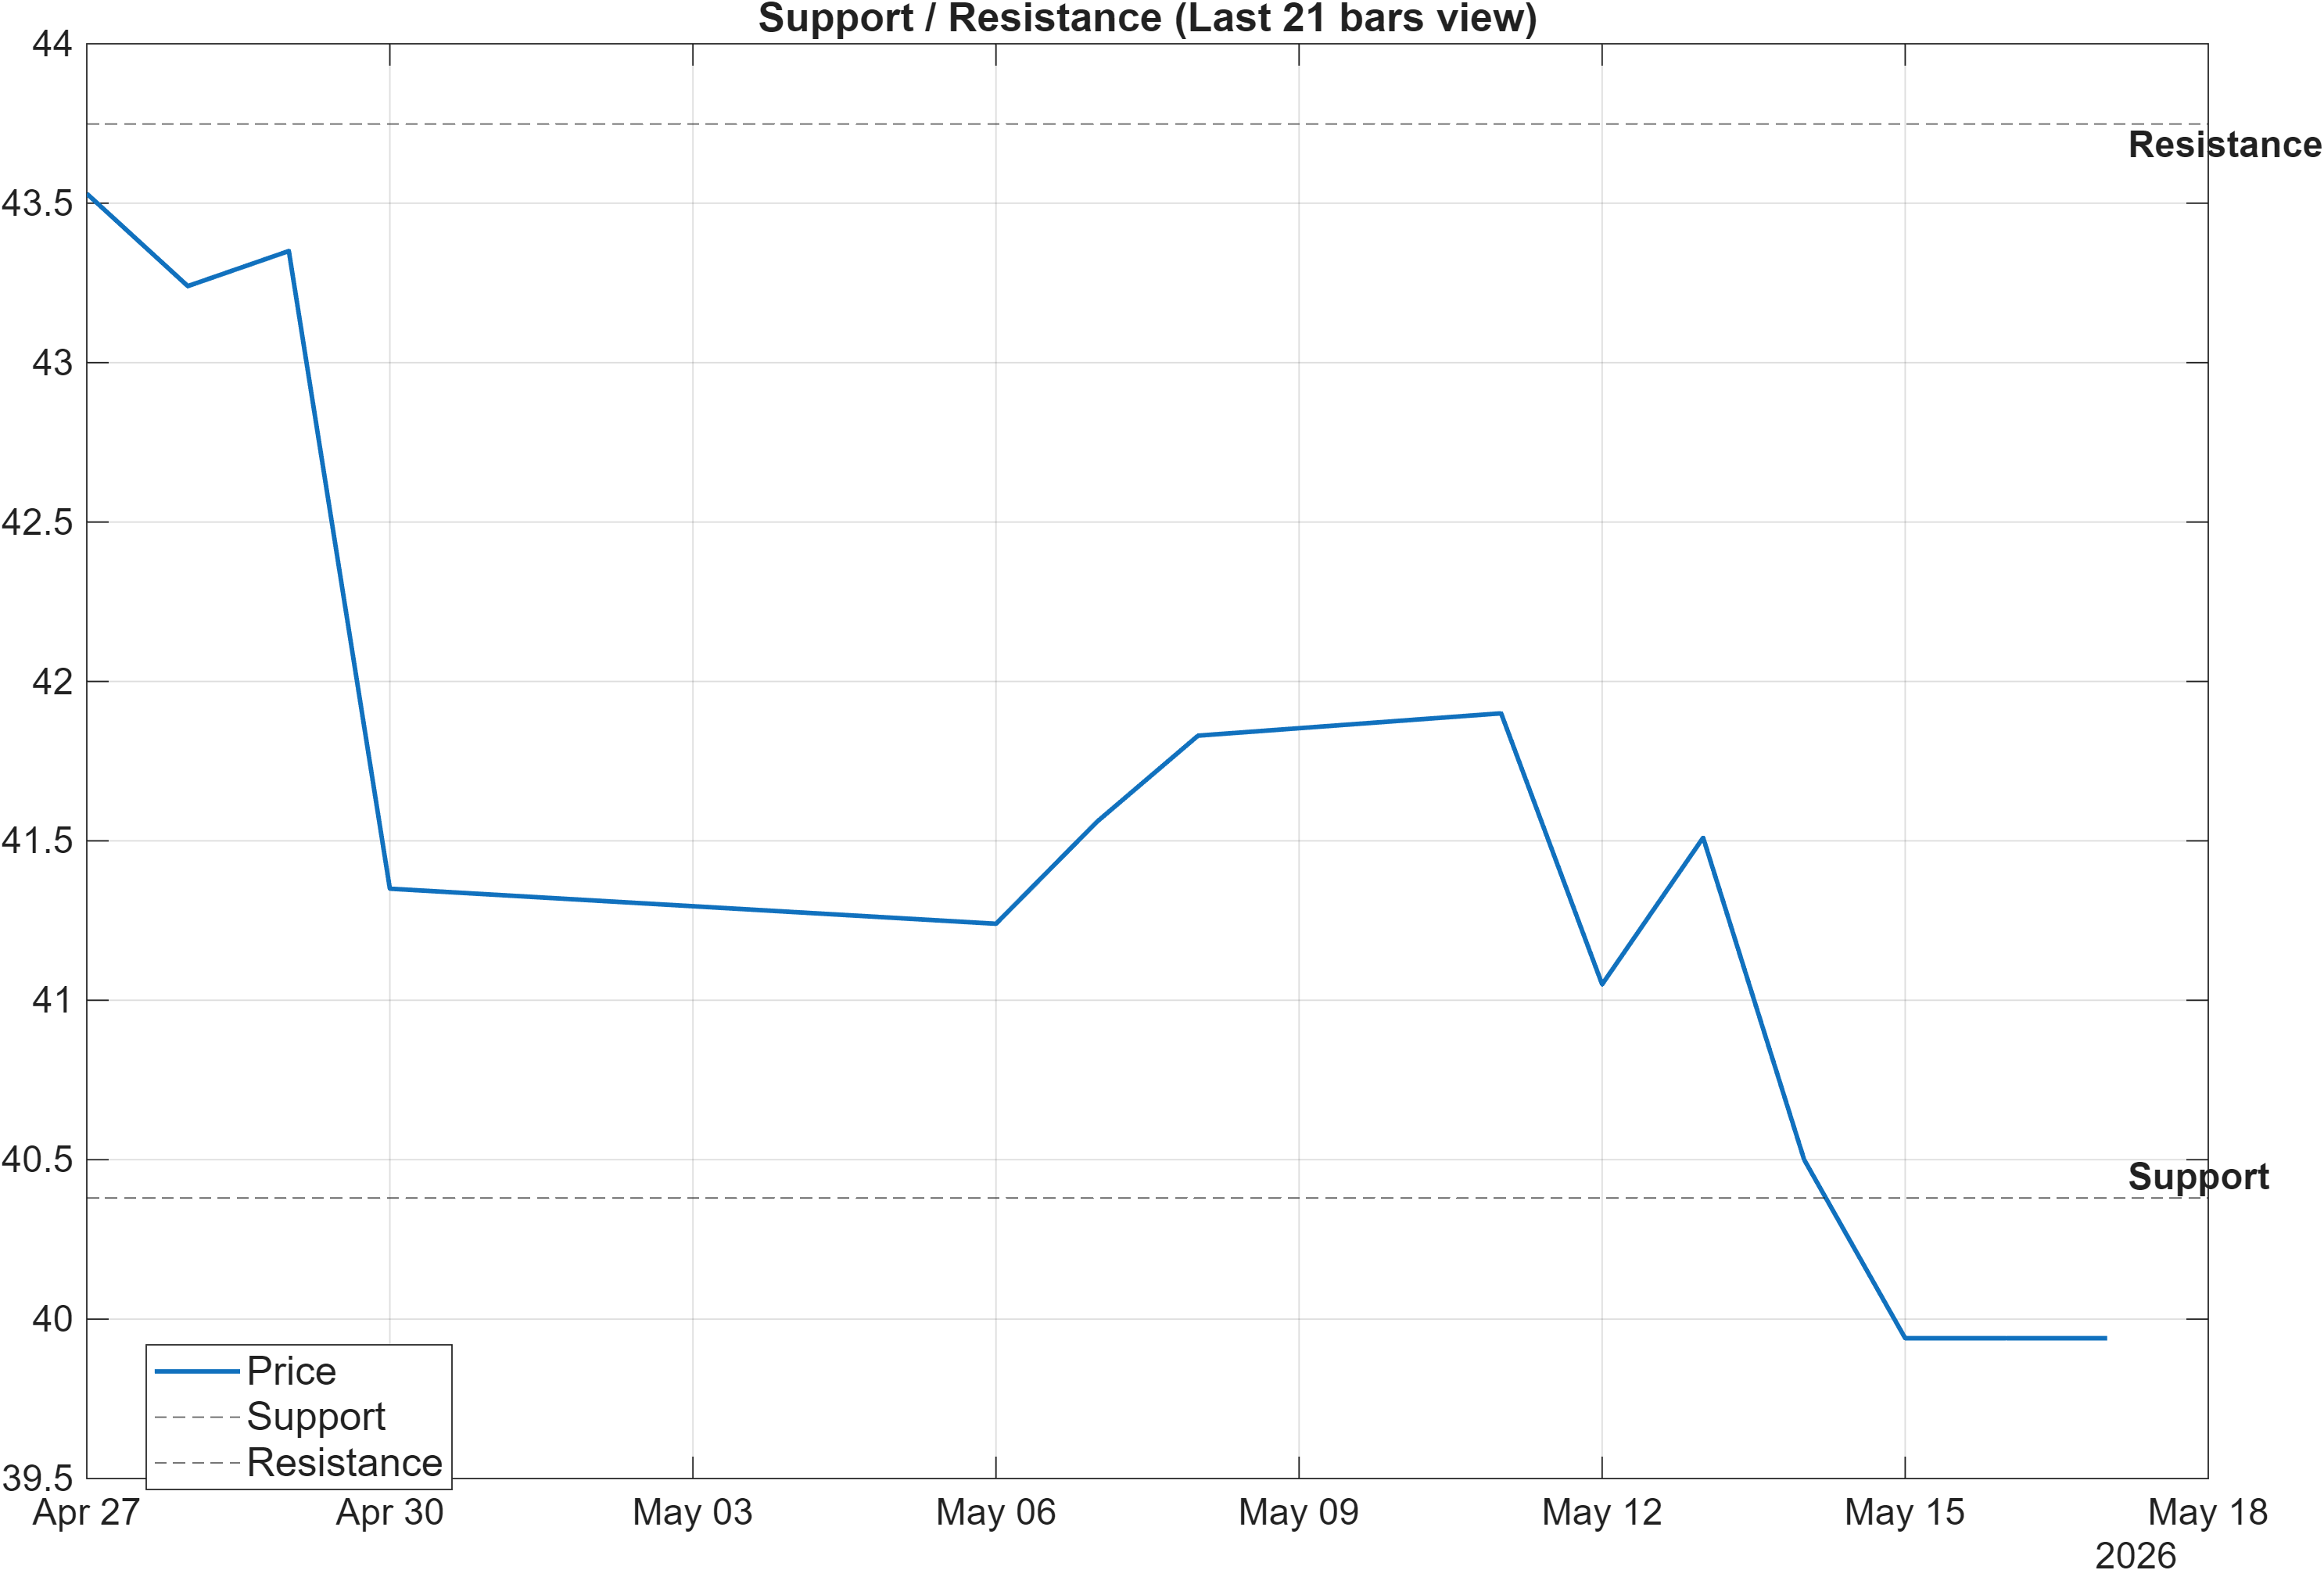
The current technical map is clean: support ~40.3800 is the key downside reference, while resistance ~43.7483 defines the nearest upside ceiling. In a market where short-term ranks are bearish (daily #1139, weekly #1043) and momentum is weak (RSI(14) 31.15, MACD hist -0.1727), these zones function less as “targets” and more as decision thresholds—areas where behavior changes can be observed and evaluated.
The scenario logic embedded in the report is appropriately conditional: a break above resistance with volume points toward continuation, while a close below support increases deterioration risk. Given the compressed volatility backdrop (bandwidth 0.0873), a breakout attempt that lacks volume confirmation may be less reliable, because low-volatility environments can generate false moves before a durable resolution.
From a structure standpoint, the proximity of these two levels also frames a consolidation range that the market is negotiating. If price repeatedly tests the lower boundary (40.3800) without meaningful recovery, that can indicate weak demand absorption. Conversely, repeated rejections near 43.7483 would reinforce the interpretation that overhead supply remains active, consistent with the bearish MA stack noted earlier.
The most analytically robust read is to treat the range as a regime test: holding above 40.3800 while improving momentum signals would be consistent with stabilization; failure below that level would align with the current short-term bearish ranking and could shift mid-horizon neutrality toward a more cautious posture.
5) Quant Technical Dashboard (18 Signals)
KGNAI AI Technical Analysis Score (Deep Reinforcement Learning): Rank #740 out of 1292 (Rank 1 represents the strongest technical positioning and a higher probability of favorable price behavior. As ranks increase toward the maximum, the probability of favorable outcomes weakens and bearish positioning becomes more dominant.) | Label: Neutral | Score: -0.146
18-Signal Technical Confluence Score: -0.333 (Bearish)
Overall Technical Score (18-signal confluence + DRL rank blend): -0.277 (Neutral)
Note: The blended score reflects signal strength weighted against broader AI technical ranking, which may temporarily diverge.
Blended technical score breakdown: -0.277 (Neutral | Bull 5 / Bear 11 / Neutral 2)
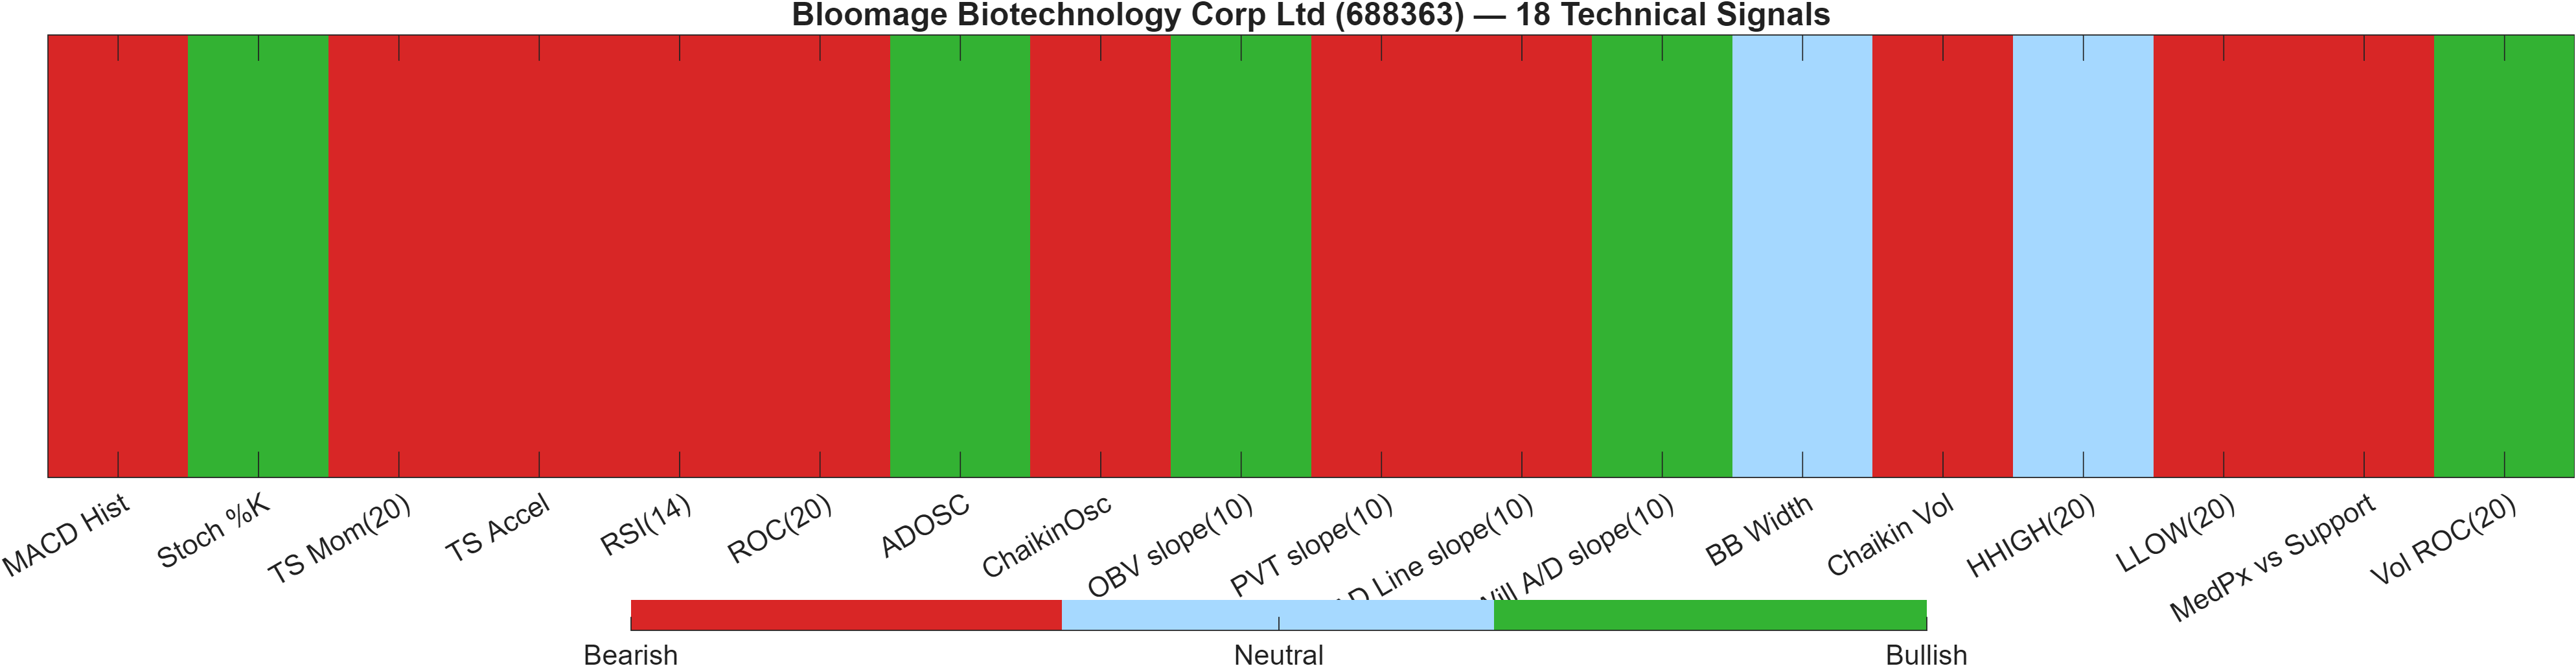
The technical dashboard shows a structured disagreement between indicator confluence and the broader AI technical rank blend. The 18-signal confluence score is -0.333 (Bearish), while the blended overall technical score is -0.277 (Neutral). That divergence is consistent with markets where near-term indicators skew bearish, but the broader pattern-recognition layer has not fully reclassified the asset into a decisively weak technical cohort.
Internally, the blend breakdown—Bull 5 / Bear 11 / Neutral 2—shows that bearish readings dominate at the signal level. This is coherent with the momentum dashboard: MACD histogram -0.1727 is bearish, and RSI(14) 31.15 also flags bearish. At the same time, select participation-oriented signals in the table (e.g., OBV slope(10) bullish and Vol ROC(20) 35.53 bullish) indicate that not all volume-related measures are uniformly negative, which can appear during consolidation phases where selling pressure is present but not perfectly synchronized across accumulation/distribution metrics.
The DRL technical rank sits at #740 out of 1292 with a Neutral label and score -0.146. In relative terms, that is closer to the middle than the extremes, which helps explain why the blended score is not as bearish as the raw confluence. Analytically, this setup often resolves in one of two ways: either indicator weakness persists long enough to pull the AI rank layer lower, or the market stabilizes and the indicator set improves back toward neutral.
Signal table (Bull/Bear/Neutral)
| Indicator | Value | Signal |
|---|---|---|
| MACD Hist | -0.1727 | Bearish |
| Stoch %K | 0.4525 | Bullish |
| TS Mom(20) | -3.3 | Bearish |
| TS Accel | -4.51 | Bearish |
| RSI(14) | 31.15 | Bearish |
| ROC(20) | -7.632 | Bearish |
| ADOSC | 10 | Bullish |
| ChaikinOsc | -4.917e+06 | Bearish |
| OBV slope(10) | 9.843e+06 | Bullish |
| PVT slope(10) | -1.259e+05 | Bearish |
| AD Line slope(10) | -8.209e+06 | Bearish |
| Will A/D slope(10) | 1.18 | Bullish |
| BB Width | 0.08731 | Neutral |
| Chaikin Vol | 10.05 | Bearish |
| HHIGH(20) | 43.8 | Neutral |
| LLOW(20) | 39.93 | Bearish |
| MedPx vs Support | -0.125 | Bearish |
| Vol ROC(20) | 35.53 | Bullish |
Interpretation: Indicator-level signals form the base confluence, which is then adjusted using a separate AI-driven technical ranking model. The final technical score summarizes this combined view.
6) News sentiment + extractive gist
Note: Instrument-specific news matches were not found, so the digest includes broader market/sector headlines. Links are provided for verification.
Sentiment score (avg): -0.013 | Positive: 0% | Neutral: 94% | Negative: 6%
KGNAI AI News Sentiment Score (normalized -1 to +1): Not available (as of —) | Label: Not available | Overall news score: -0.01
Positive Developments
Recent coverage across major financial outlets indicates a low-intensity, mostly non-market-specific news flow around the broader backdrop, consistent with the digest note that instrument-specific matches were not found. With the sentiment mix dominated by Neutral (94%) and an average score of -0.013, the informational environment reads as relatively stable rather than catalyst-driven. In that setting, market attention typically shifts back toward technical confirmation—particularly whether price can improve behavior near resistance (43.7483) while momentum stabilizes (RSI currently 31.15). A key constructive feature of neutral-dominant feeds is that price action can become the primary “signal generator,” meaning that improved tape and participation can matter more than incremental headlines. This aligns with the current volatility profile (bandwidth 0.0873), which suggests that if a directional resolution occurs, it may require visible confirmation rather than an obvious news trigger.
Neutral / Mixed Developments
The overall news read is best treated as contextual noise rather than a primary driver for 688363 in this update. The absence of a normalized KGNAI AI News Sentiment Score (Not available) limits model-based sentiment interpretation, leaving only the aggregate distribution (0% positive, 6% negative) and the small-magnitude average score (-0.013). Mixed, low-signal coverage environments often coincide with technical consolidation, where markets alternate between short-lived rebounds and renewed pressure. That is consistent with the broader technical picture: bearish short-term ranks (daily #1139) alongside a strong 3-month rank (#22) and a blended technical score that is Neutral (-0.277) despite bearish confluence.
Negative / Risk Signals
The primary risk signal in the current digest is not a concentrated negative headline set; it is the lack of a positive catalyst while technical and rank pressure remains evident. With short-horizon ranks deeply bearish (weekly #1043) and momentum indicators negative (MACD hist -0.1727, RSI bias bearish), a neutral news environment can still coincide with continued technical deterioration if price fails at key levels. The report’s key downside condition—a close below support (~40.3800)—becomes more relevant when the sentiment backdrop is not providing offsetting support. In addition, the small but present negative share (6%) suggests occasional risk-toned items can appear, even if the dominant tone is neutral; in compressed-volatility conditions, that can sometimes amplify short-term swings around support/resistance without changing the underlying regime.
- Whether sentiment distribution shifts materially away from 94% neutral alongside a break of 43.7483 or 40.3800.
- Any reappearance of instrument-specific coverage that changes the “Not available” status for the normalized news score.
- Consistency between price action and momentum stabilization (RSI and MACD) if volatility expands from 0.0873.
Sources referenced: Reuters, Bloomberg, Yahoo Finance, MarketWatch, Investing.com
Snapshot: AI Rank (Short–Mid–Long): Mixed (Bearish–Neutral–Neutral) · Technical Confluence: Bearish · Key Levels: Support ~40.38 | Resistance ~43.75 · News Sentiment: Neutral
7) Sources
Instrument-specific source mapping is not available in the provided data. The news digest above reflects aggregated coverage and the provided sentiment statistics without reproducing headline lists.
You may also like: How KGNAI AI ranks instruments across global markets
Disclaimer: KGNAI provides AI-generated analytics and educational market commentary only. This is not financial advice. Markets involve risk. Always do your own research.