
688198 — Beijing Balance Medical Technology Co Ltd (19-Apr-2026) | Mid/Long Ranks Bullish, Technicals Bearish
AI-Based Technical, Rank & Sentiment Analysis
Beijing Balance Medical Technology Co Ltd (688198) shows a notable horizon split in KGNAI’s cross-sectional ranking system as of 19-Apr-2026. The mid- to long-horizon ranks are positioned in the upper tail of the universe (Monthly #38, 3-Monthly #22, 6-Monthly #8 out of 1292), while the short-horizon picture is less supportive (Daily #854, Weekly #421). That internal tension is reinforced by the technical stack: the blended technical view is Bearish (Overall Technical Score -0.604), with momentum indicators such as RSI(14) at 37.71 and MACD histogram at -0.0352 leaning against immediate upside follow-through. Volatility is comparatively contained with Bollinger Bandwidth at 0.0897, which can amplify the significance of nearby decision levels. The nearest probabilistic zones are clearly defined: support ~93.5467 and resistance ~105.0050. News sentiment is broadly Neutral (avg 0.000; 88% neutral), providing limited directional bias versus the technical and rank signals.
Key Takeaways
- Rank stance: Short-term Neutral | Mid-term Bullish | Long-term Bullish
- Technical confluence: Bearish (Overall Technical Score -0.604; DRL rank #1276/1292)
- Key levels: Support ~ 93.5467 | Resistance ~ 105.0050
- News sentiment bias: Neutral (avg 0.000; 88% neutral)
- Confirmation / invalidation: A sustained break above 105.0050 with volume supports continuation; a close below 93.5467 increases deterioration risk.
What KGNAI Measures
KGNAI evaluates assets using large cross-sectional datasets built from millions of structured data points. Inputs incorporate fundamental metrics, technical structures, and systematically processed news sentiment. Statistical models, machine learning, and AI frameworks are used to assess relative positioning, signal alignment, and probabilistic behavior across broad universes.
How to Read This Report
- Ranks are comparative across the tracked universe, not absolute price targets.
- Confluence reflects alignment among independent signal groups.
- Support/resistance levels are probabilistic decision zones, not guarantees.
- Sentiment provides contextual bias within the broader analytical framework.
1) KGNAI AI Analysis
Region: CHINA
Total universe size: 1292 ranked instruments
- Daily rank: #854 out of 1292 — Neutral
- Weekly rank: #421 out of 1292 — Neutral
- Monthly rank: #38 out of 1292 — Bullish
- 3-Monthly rank: #22 out of 1292 — Bullish
- 6-Monthly rank: #8 out of 1292 — Bullish
- Yearly rank: Not available for this horizon — Not available
Cross-horizon positioning: short-term neutrality versus mid/long strength
The rank curve for 688198 is steeply improving with horizon, moving from #854 on the Daily and #421 on the Weekly to #38 on the Monthly and #8 on the 6-Monthly. In a 1292-instrument universe, the 6-Monthly rank sits in the top decile, while the Daily rank sits in the lower third. This configuration is often consistent with a market that is either (a) digesting a longer-horizon trend while near-term price structure is still repairing, or (b) experiencing a shorter-term drawdown inside a broader relative-strength regime.
The interpretation is not that one horizon is “correct,” but that the system is seeing timeframe disagreement. A practical way to frame the conflict is: the mid/long models are treating recent history as constructive enough to lift comparative rank, while the short-term models are not yet confirming. That split matters because it can create reversion pressure (short-term “catch up” toward stronger horizons) or trend attrition (longer-horizon rank fading if short-term weakness persists).
The Yearly rank is not available in the provided data, so the longest-cycle context cannot be validated here. With that constraint, the most actionable takeaway is the rank gradient: continued mid/long leadership will typically require the Daily/Weekly ranks to stabilize and begin improving rather than remain anchored at #854 and #421.
Term view: Short-term: Neutral. Mid-term: Bullish. Long-term: Bullish.
Want the full universe and complete rank tables? Unlock full access on KGNAI: https://www.kgnai.com/pricing
2) Price & trend overview
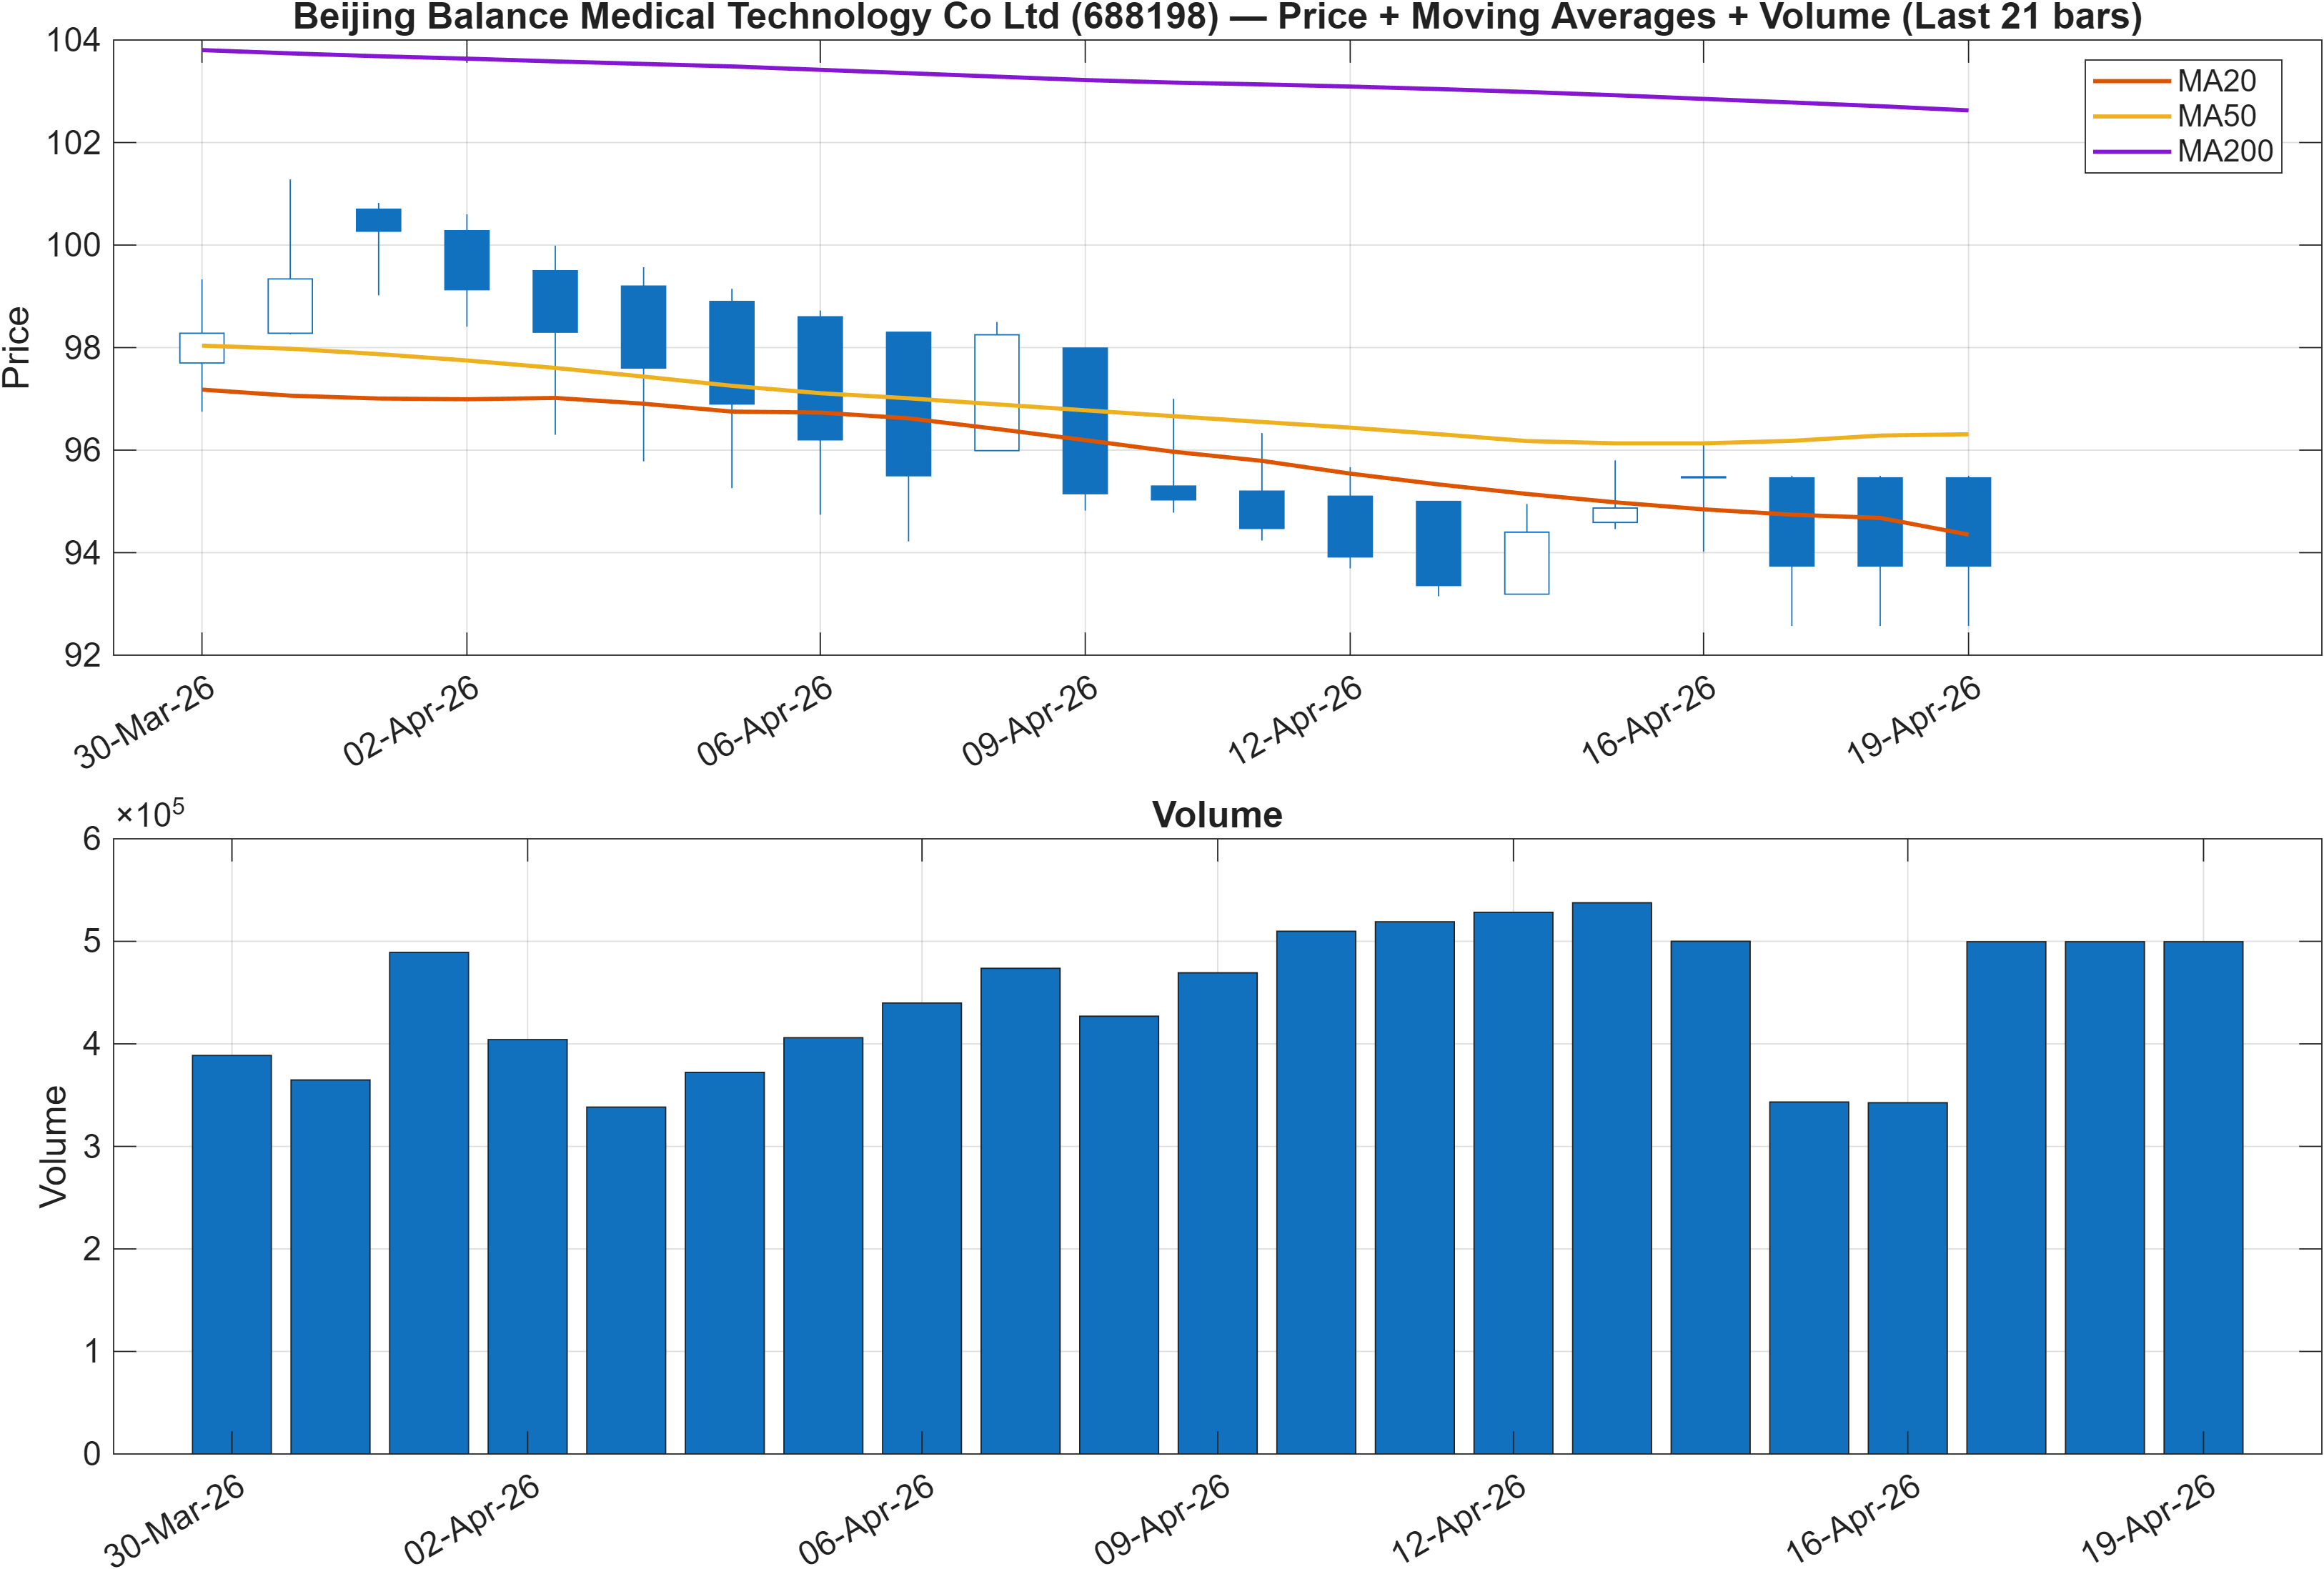
Trend structure: moving-average alignment remains risk-off
The trend read-through is explicitly negative on two common structural checks: close vs MA50 = Bearish and MA50 vs MA200 = Bearish. When both conditions are bearish simultaneously, it typically implies the shorter moving average remains below the longer moving average and price is trading below the intermediate trend proxy. In that configuration, rallies can be more sensitive to overhead supply until price and the MA50 begin to realign.
The key analytical tension is that this bearish moving-average structure coexists with stronger mid/long KGNAI ranks (notably #38 Monthly and #8 6-Monthly). That divergence can occur when an instrument’s longer-horizon behavior has been comparatively resilient across the universe, but the most recent segment of data has weakened enough to pull trend filters negative. Put differently: the cross-sectional models are still awarding relative credit, while the chart structure is signaling unfinished repair.
From a regime perspective, the next decision is whether price can transition from “below-trend” behavior into a reclaim of intermediate structure. Without changing the underlying signals, the nearby levels in this report (93.5467 support and 105.0050 resistance) become the practical boundaries for confirming whether the bearish MA stack is resolving or persisting. Until that transition occurs, the trend component remains a headwind to near-term continuation even if longer-horizon ranks stay constructive.
Interpretation: Close vs MA50 = Bearish, MA50 vs MA200 = Bearish.
3) Momentum & volatility dashboard
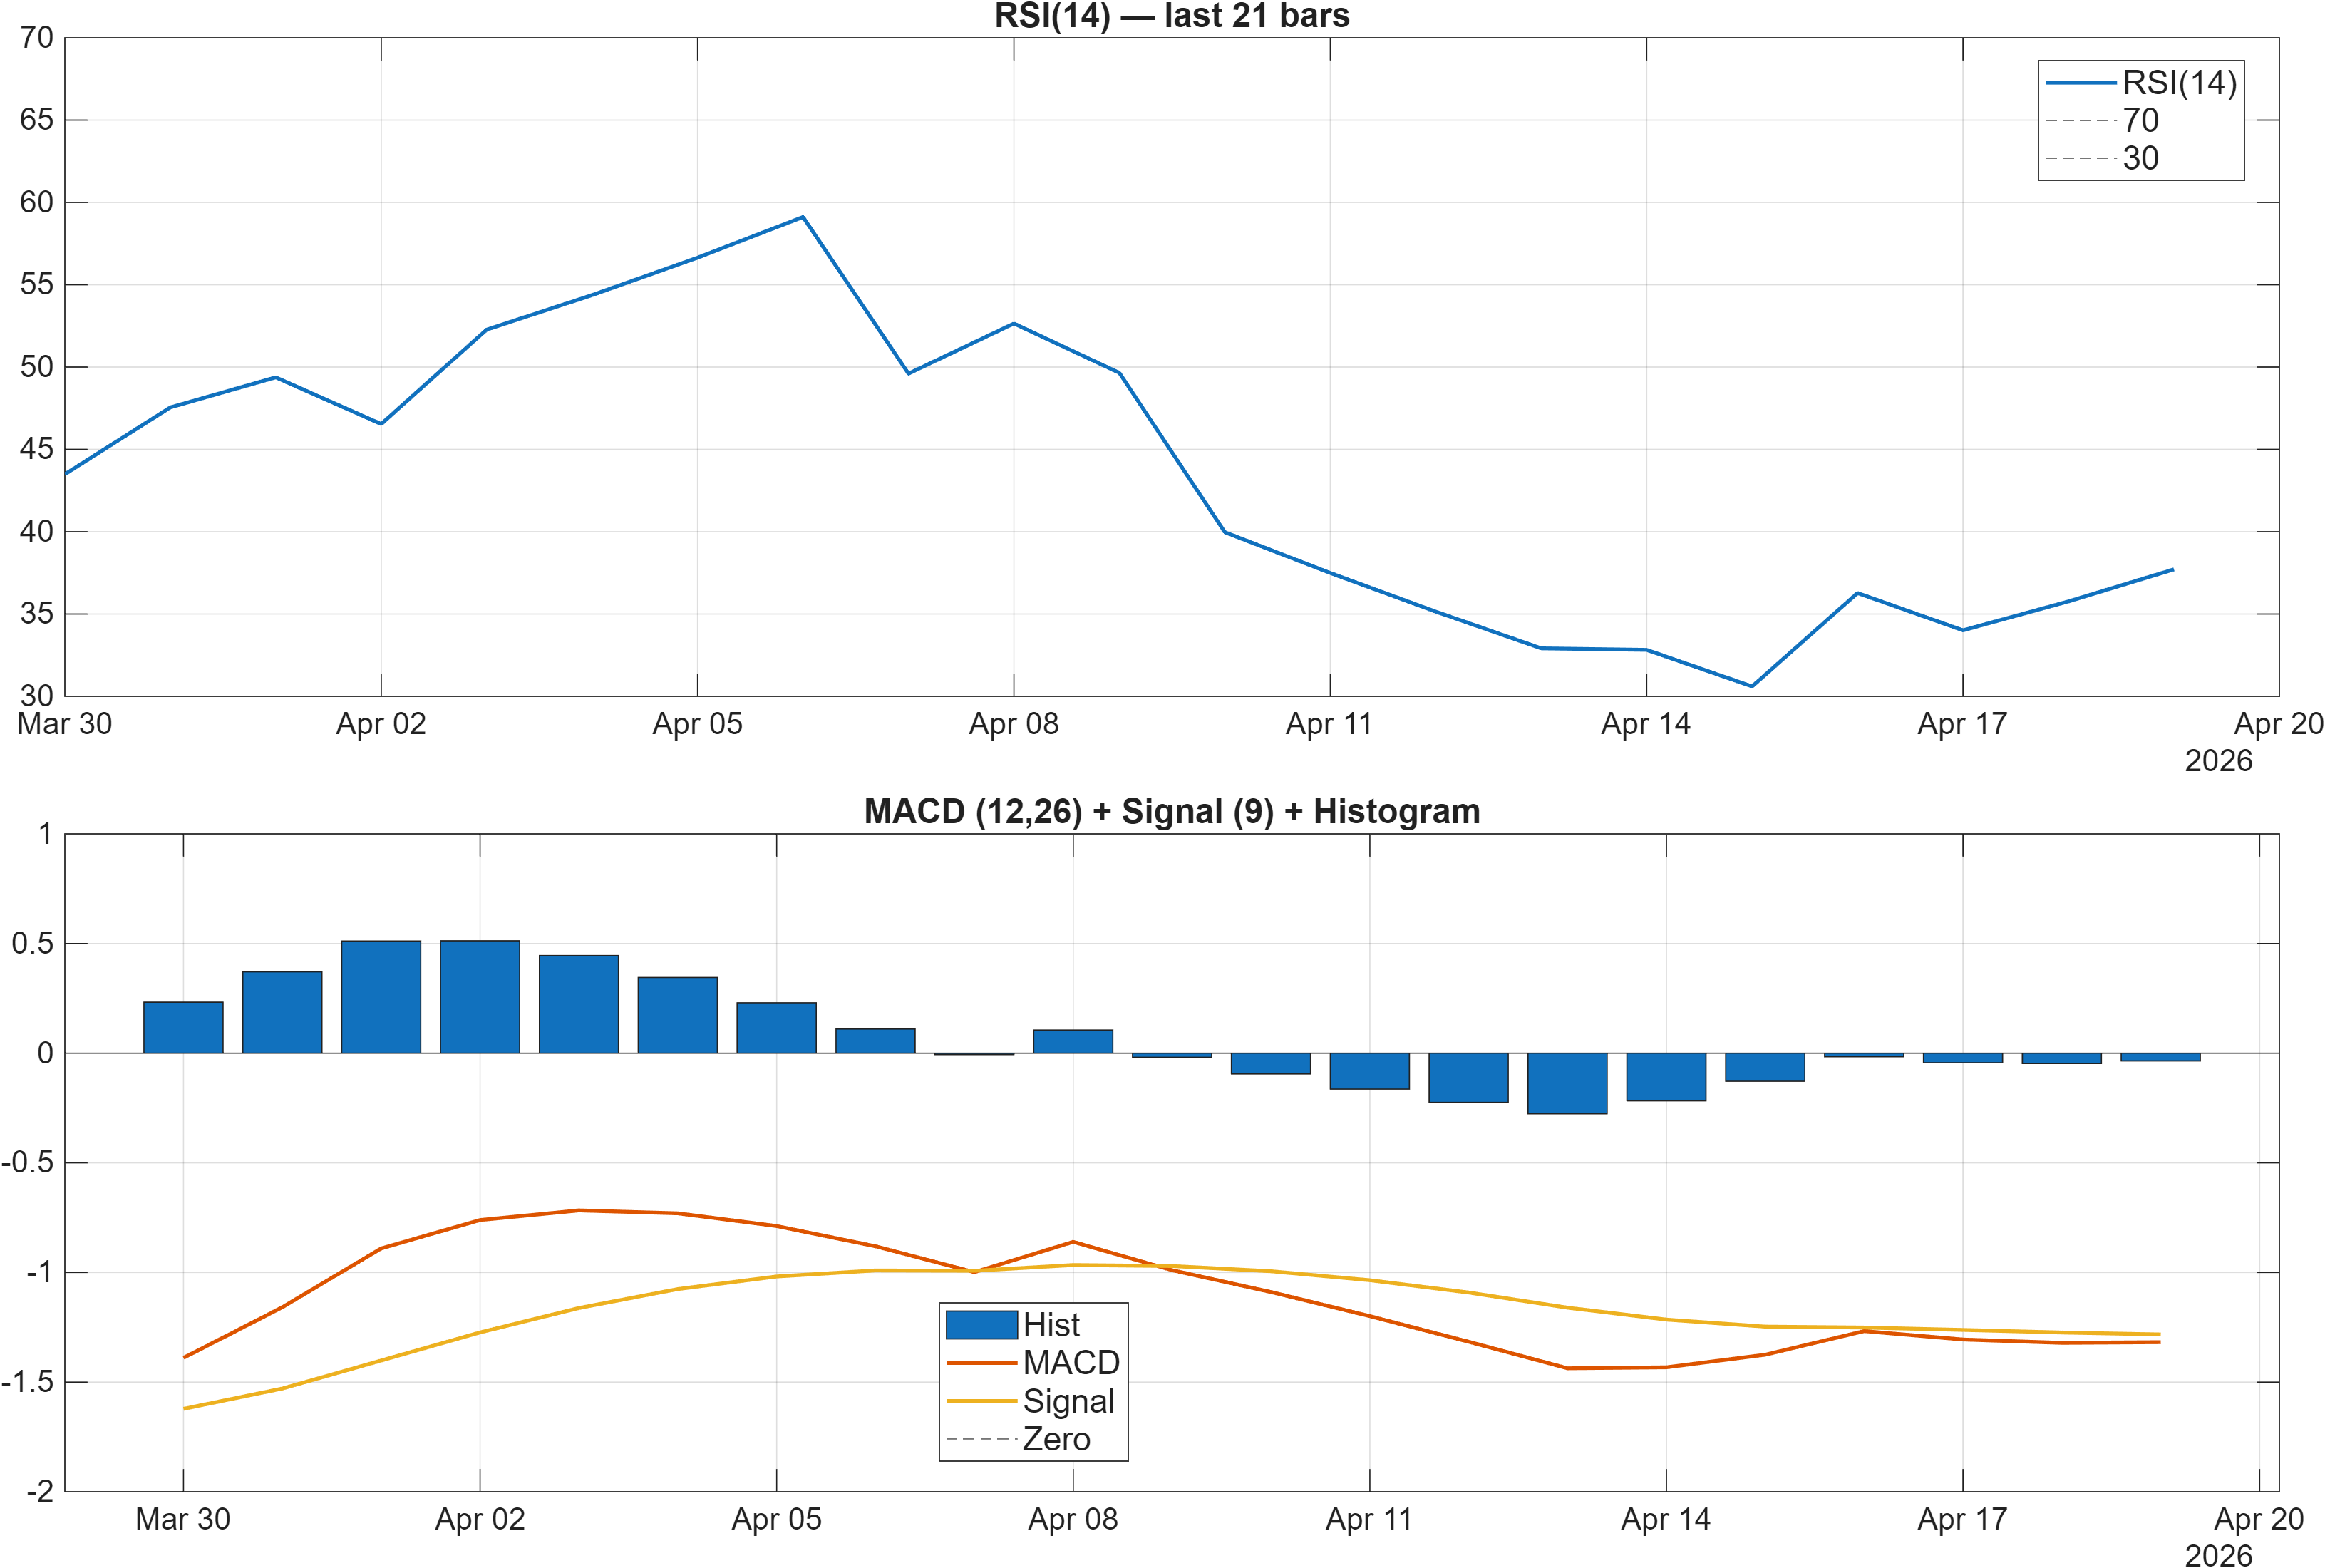
Interpretation: RSI bias = Bearish, MACD hist = -0.0352.
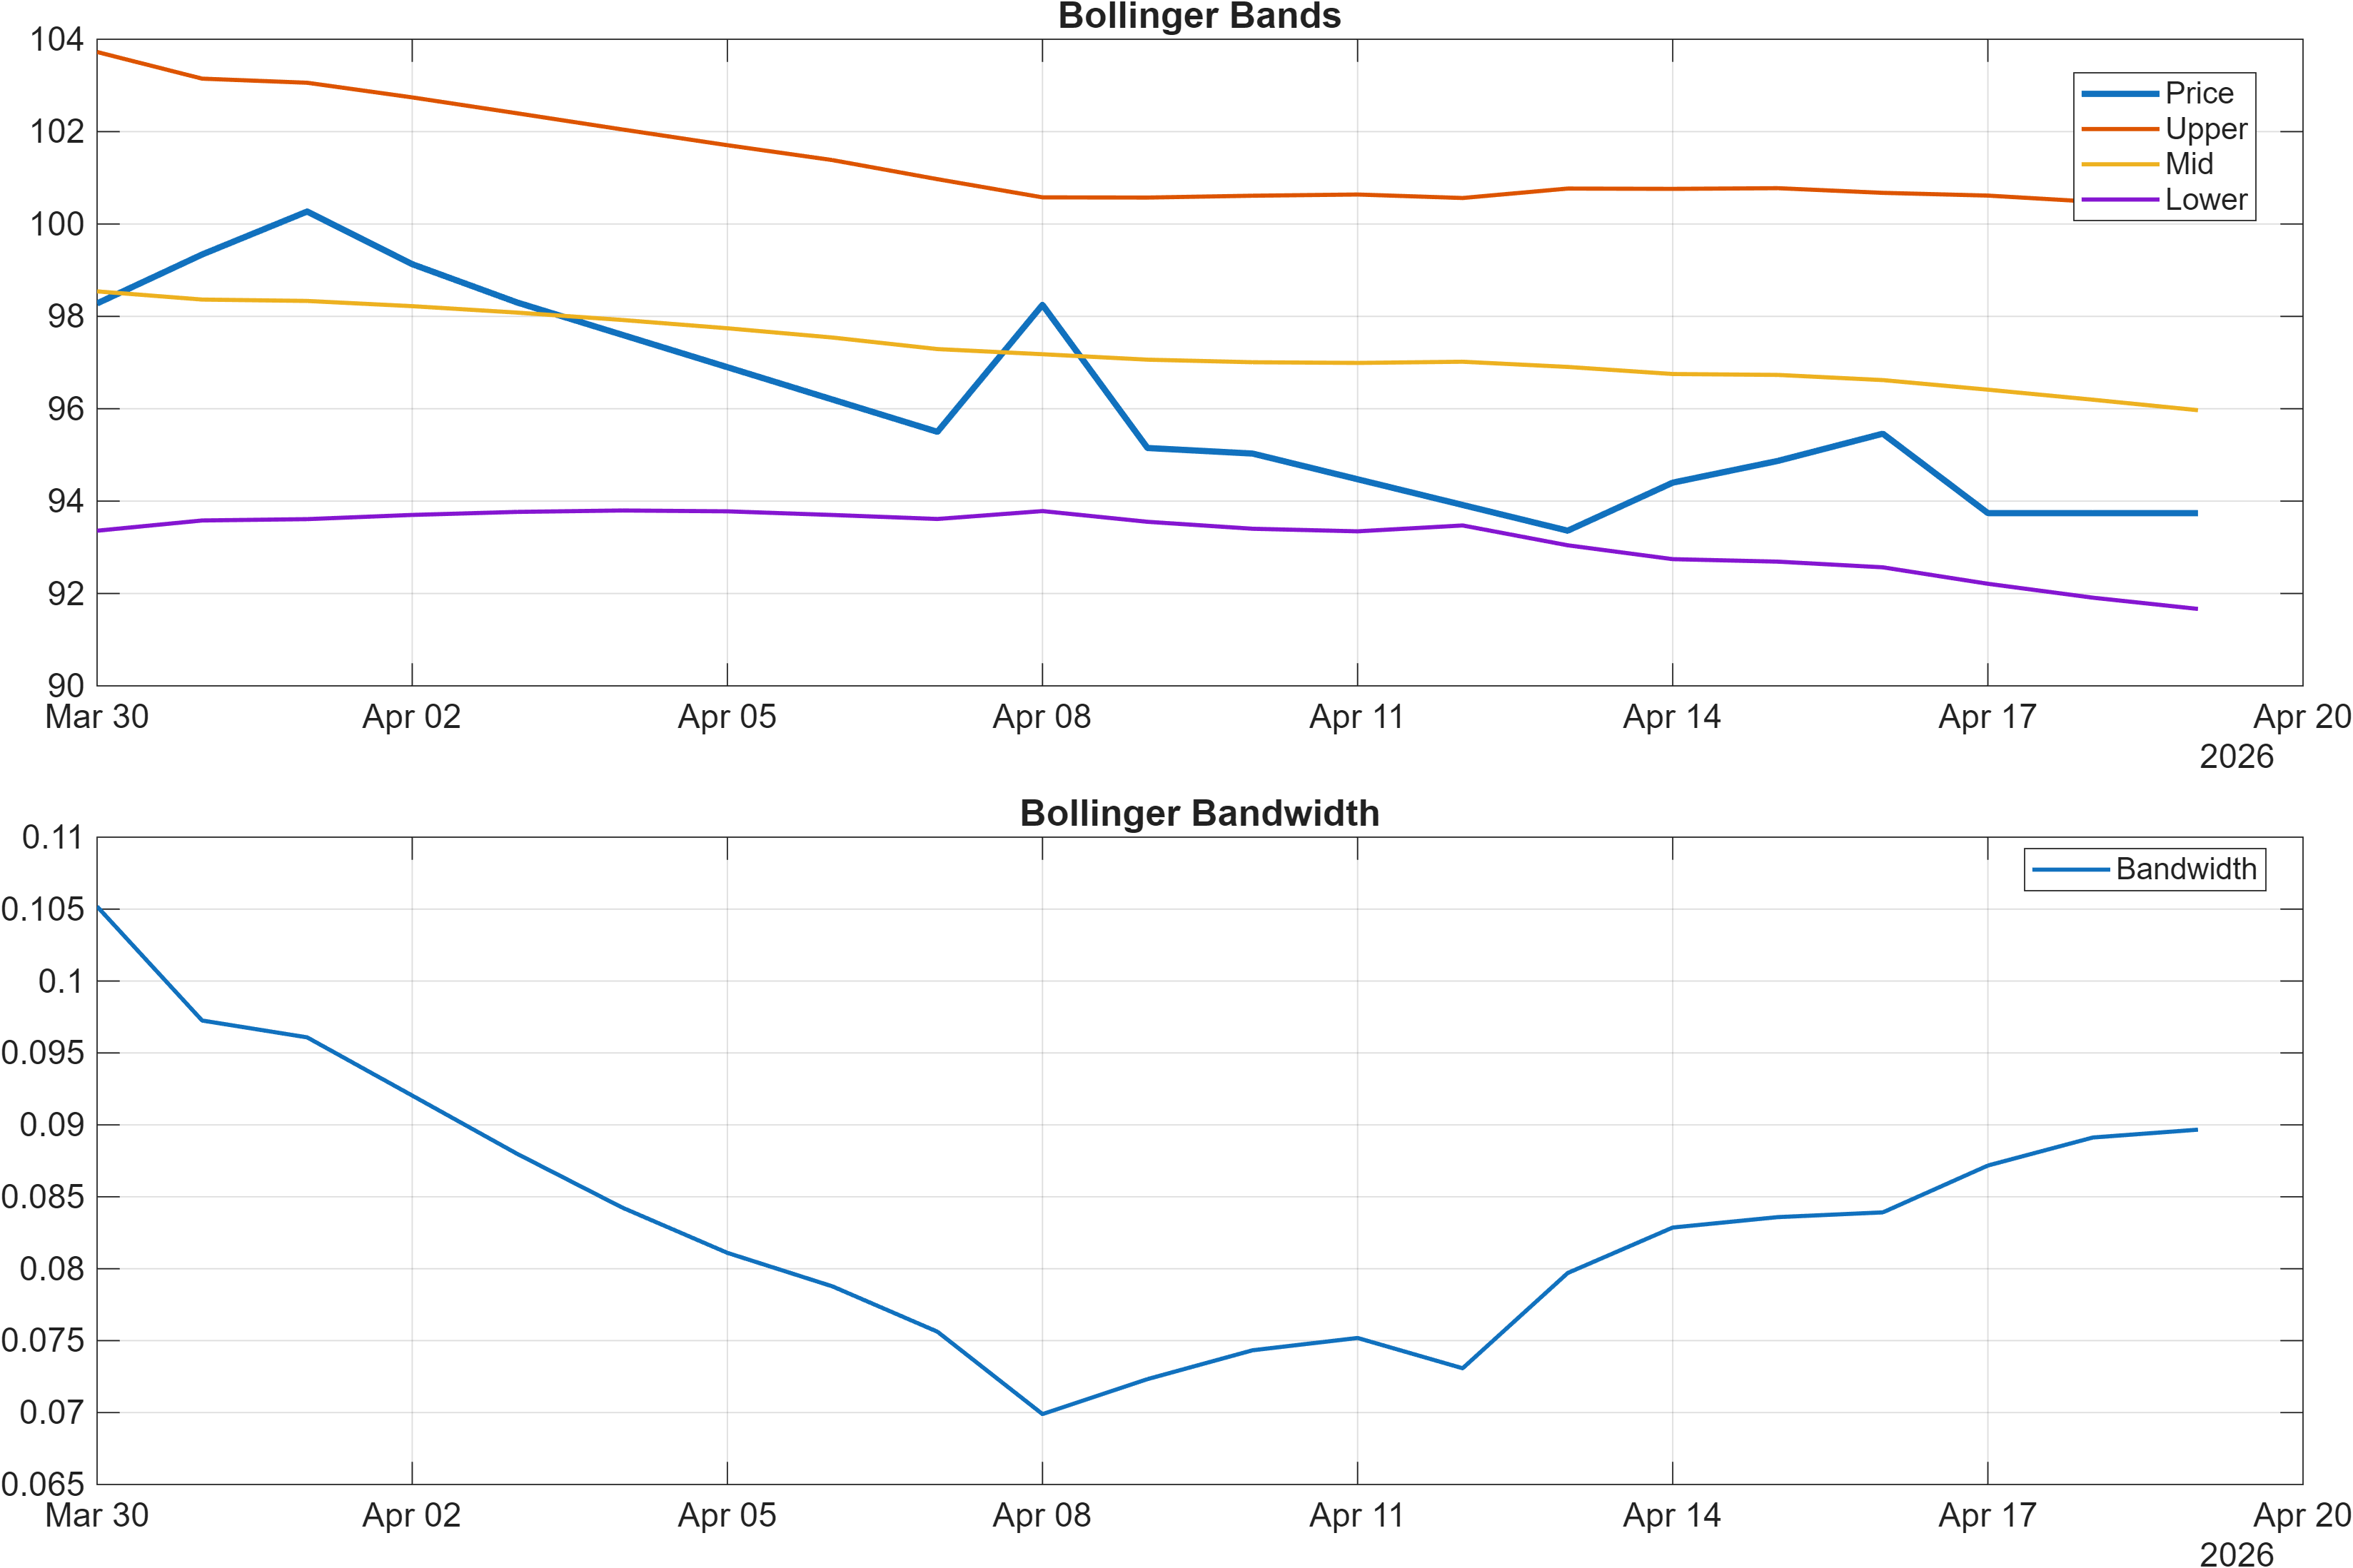
Interpretation: Bandwidth (volatility regime) latest = 0.0897.
Momentum drag with contained volatility: a “compression” setup
Momentum indicators currently lean defensive. RSI(14) at 37.71 is flagged as bearish bias, consistent with demand that has not yet regained control over the most recent lookback window. At the same time, the MACD histogram at -0.03522 indicates negative momentum persistence rather than a clean inflection to positive impulse. In combination, RSI and MACD are aligned toward trend-following caution rather than mean-reversion confidence.
Volatility conditions add nuance. The Bollinger Bandwidth at 0.08967 suggests a relatively contained volatility regime versus an expansion phase. Compression regimes can persist, but they also raise the importance of clean breaks around defined levels because realized volatility may increase rapidly when the range resolves. In a compressed state, false starts are possible; confirmation typically requires momentum measures to improve alongside price structure.
A notable internal contrast within the broader technical stack (expanded in Section 5) is that some participation/volume components can lean constructive even while momentum remains weak. That type of split often shows up when accumulation attempts appear before price has rebuilt trend. The near-term read remains: momentum is not yet supportive (37.71 RSI; -0.0352 MACD hist), while volatility is not providing a strong directional cue (0.0897 bandwidth). This combination frequently makes support/resistance (Section 4) the more decisive framework for risk definition.
4) Support / Resistance zones
Support ~ 93.5467 | Resistance ~ 105.0050
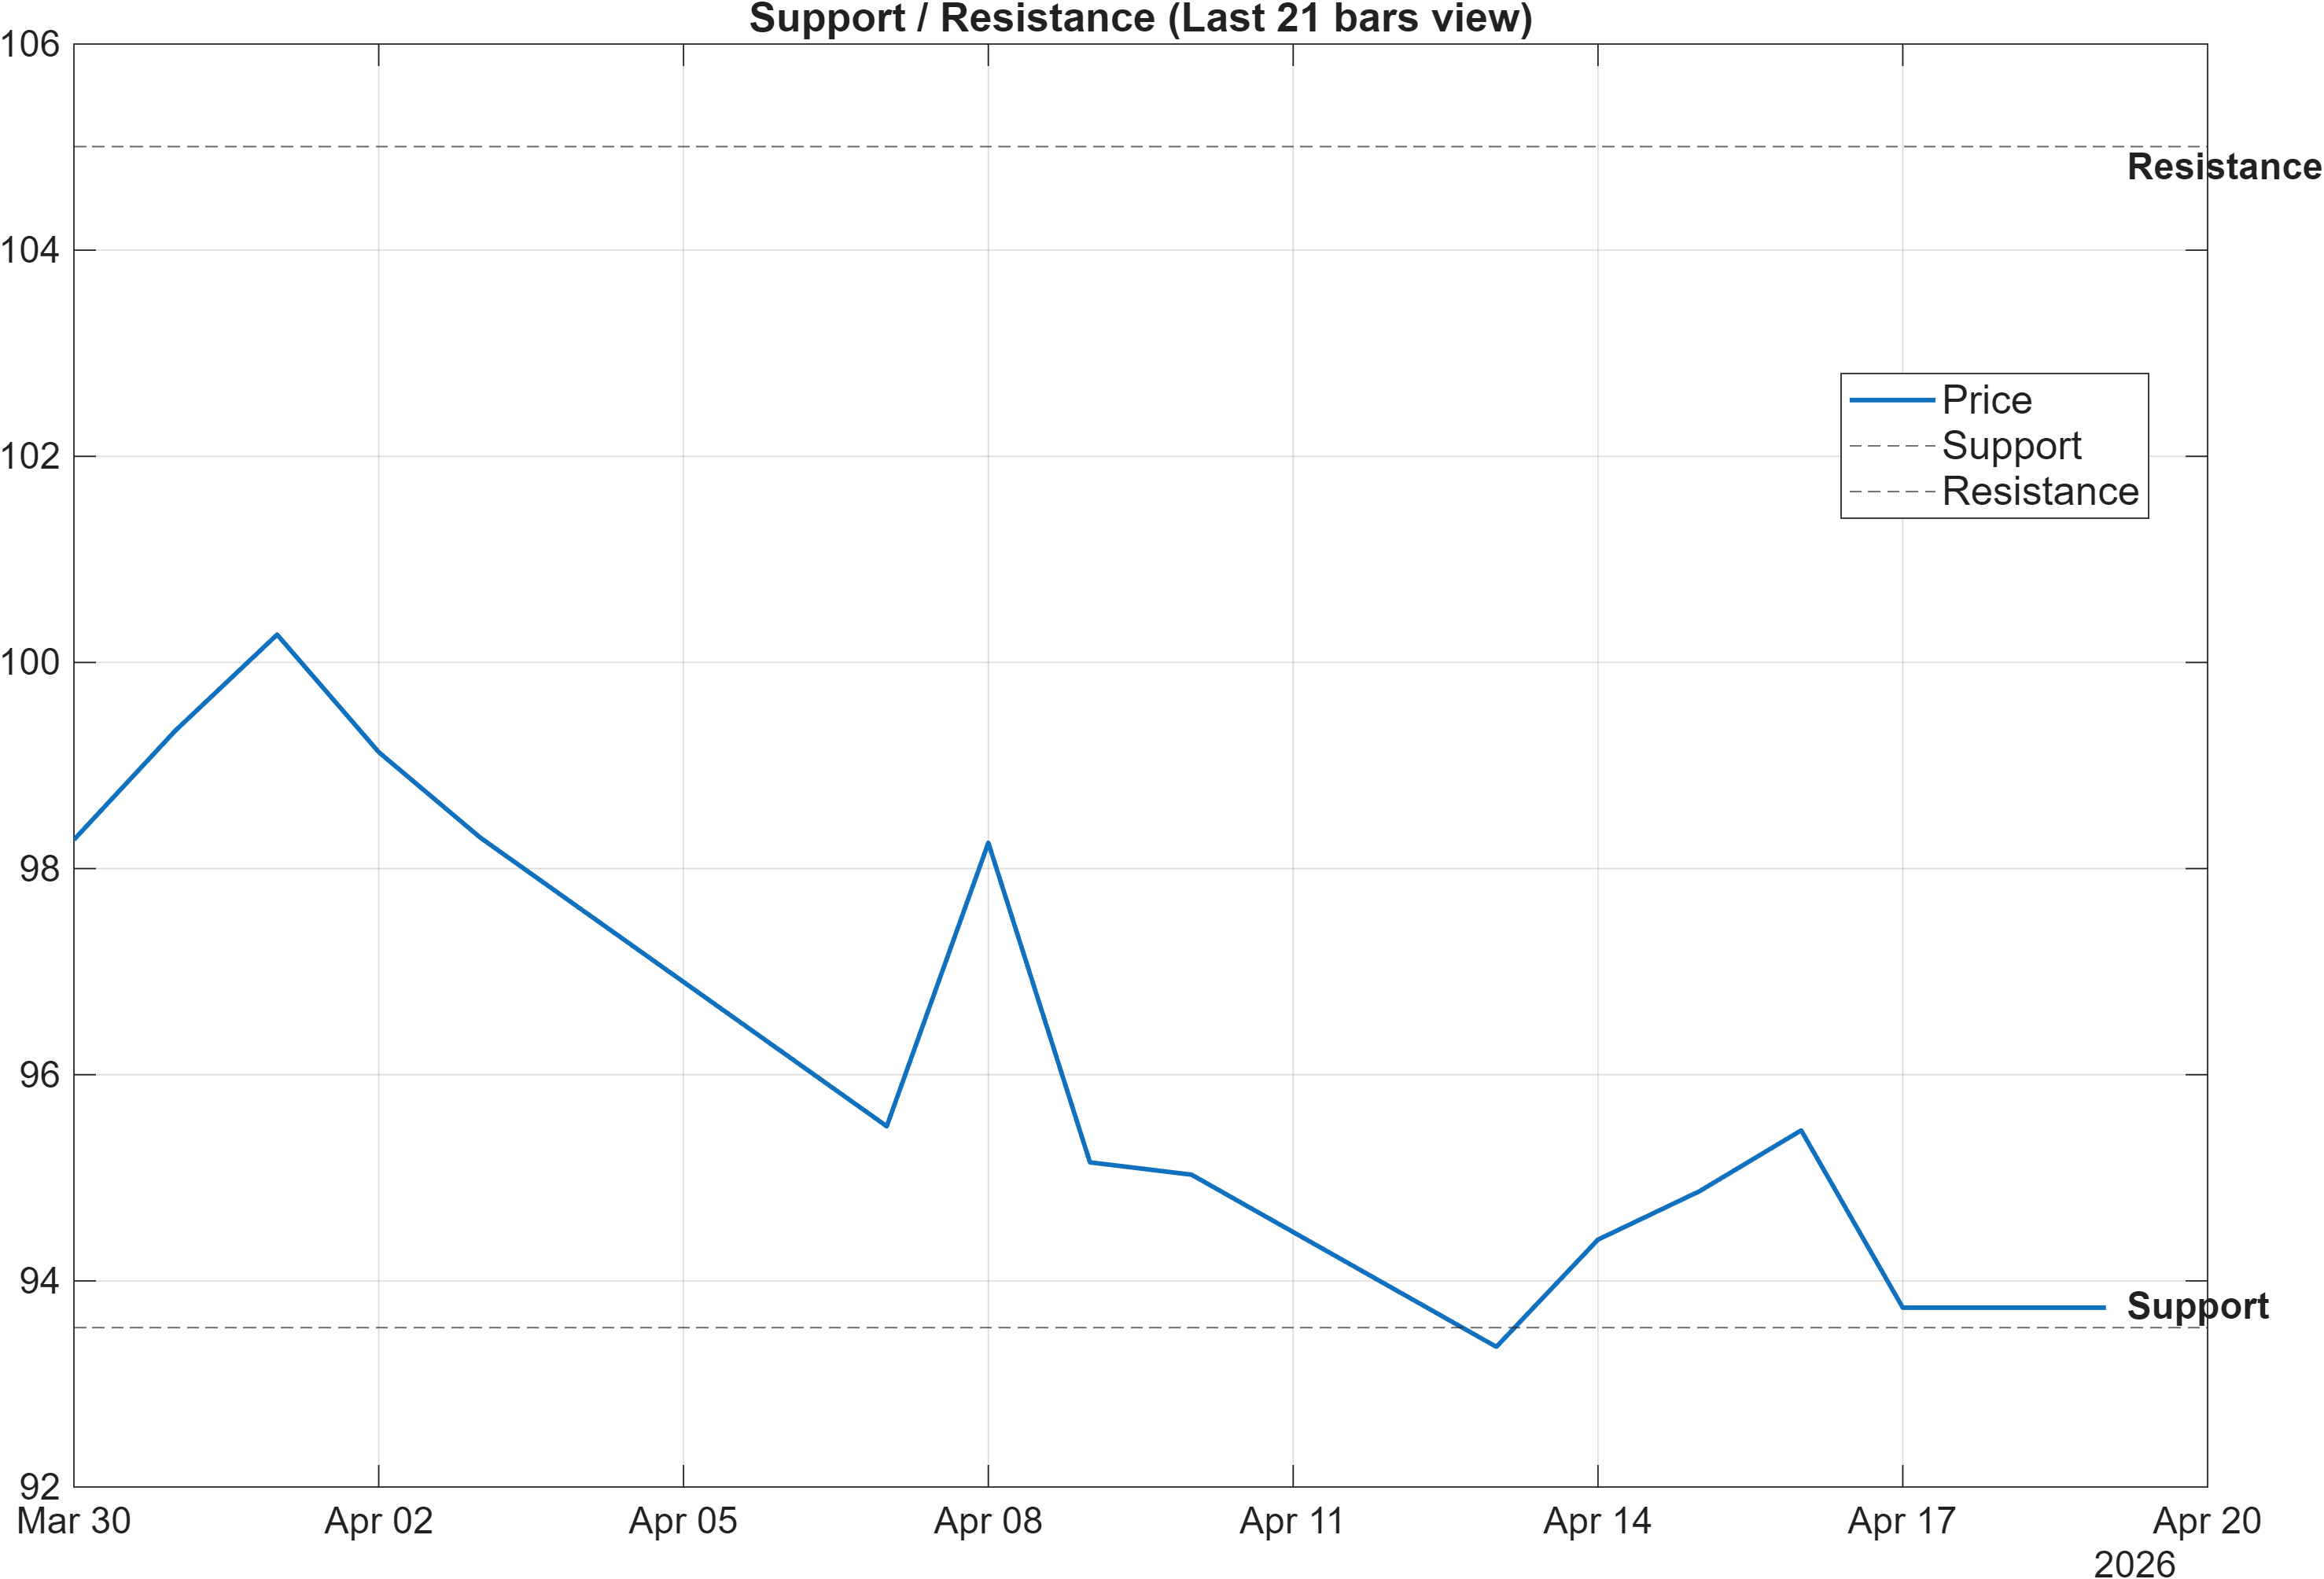
Scenario view: Break above resistance with volume → continuation. Close below support → signal deterioration risk.
Decision zones: defining continuation versus deterioration under bearish technical pressure
The report’s immediate trading map is anchored by support at ~93.5467 and resistance at ~105.0050. With trend and momentum readings currently negative (close vs MA50 bearish; RSI 37.71; MACD hist -0.0352), these zones become more than reference lines: they are the framework for whether the market is absorbing supply or extending weakness.
A key feature here is that volatility is not elevated (Bollinger Bandwidth 0.0897), which can make the first validated breakout or breakdown more informative than in a high-volatility environment where levels are frequently overshot. Under compression, a confirmed move above resistance tends to coincide with improving momentum metrics and stronger participation. Conversely, a close below support is typically associated with a deterioration in already-bearish momentum and can force a reassessment of the mid/long rank strength (Monthly #38, 6-Monthly #8) if weakness persists.
The price-to-level relationship also helps contextualize the technical confluence score (Section 5). The presence of a Bullish “MedPx vs Support” signal in the dashboard indicates that, at the time of calculation, price location versus the support framework was not uniformly negative—despite broad bearish signals elsewhere. That creates a clean conditional structure: holding above 93.5467 keeps a stabilization thesis viable, while a decisive breach shifts the balance toward the existing bearish confluence being dominant.
5) Quant Technical Dashboard (18 Signals)
KGNAI AI Technical Analysis Score (Deep Reinforcement Learning): Rank #1276 out of 1292 (Rank 1 represents the strongest technical positioning and a higher probability of favorable price behavior. As ranks increase toward the maximum, the probability of favorable outcomes weakens and bearish positioning becomes more dominant.) | Label: Bearish | Score: -0.975
18-Signal Technical Confluence Score: -0.444 (Bearish)
Overall Technical Score (18-signal confluence + DRL rank blend): -0.604 (Bearish)
Note: The blended score reflects signal strength weighted against broader AI technical ranking, which may temporarily diverge.
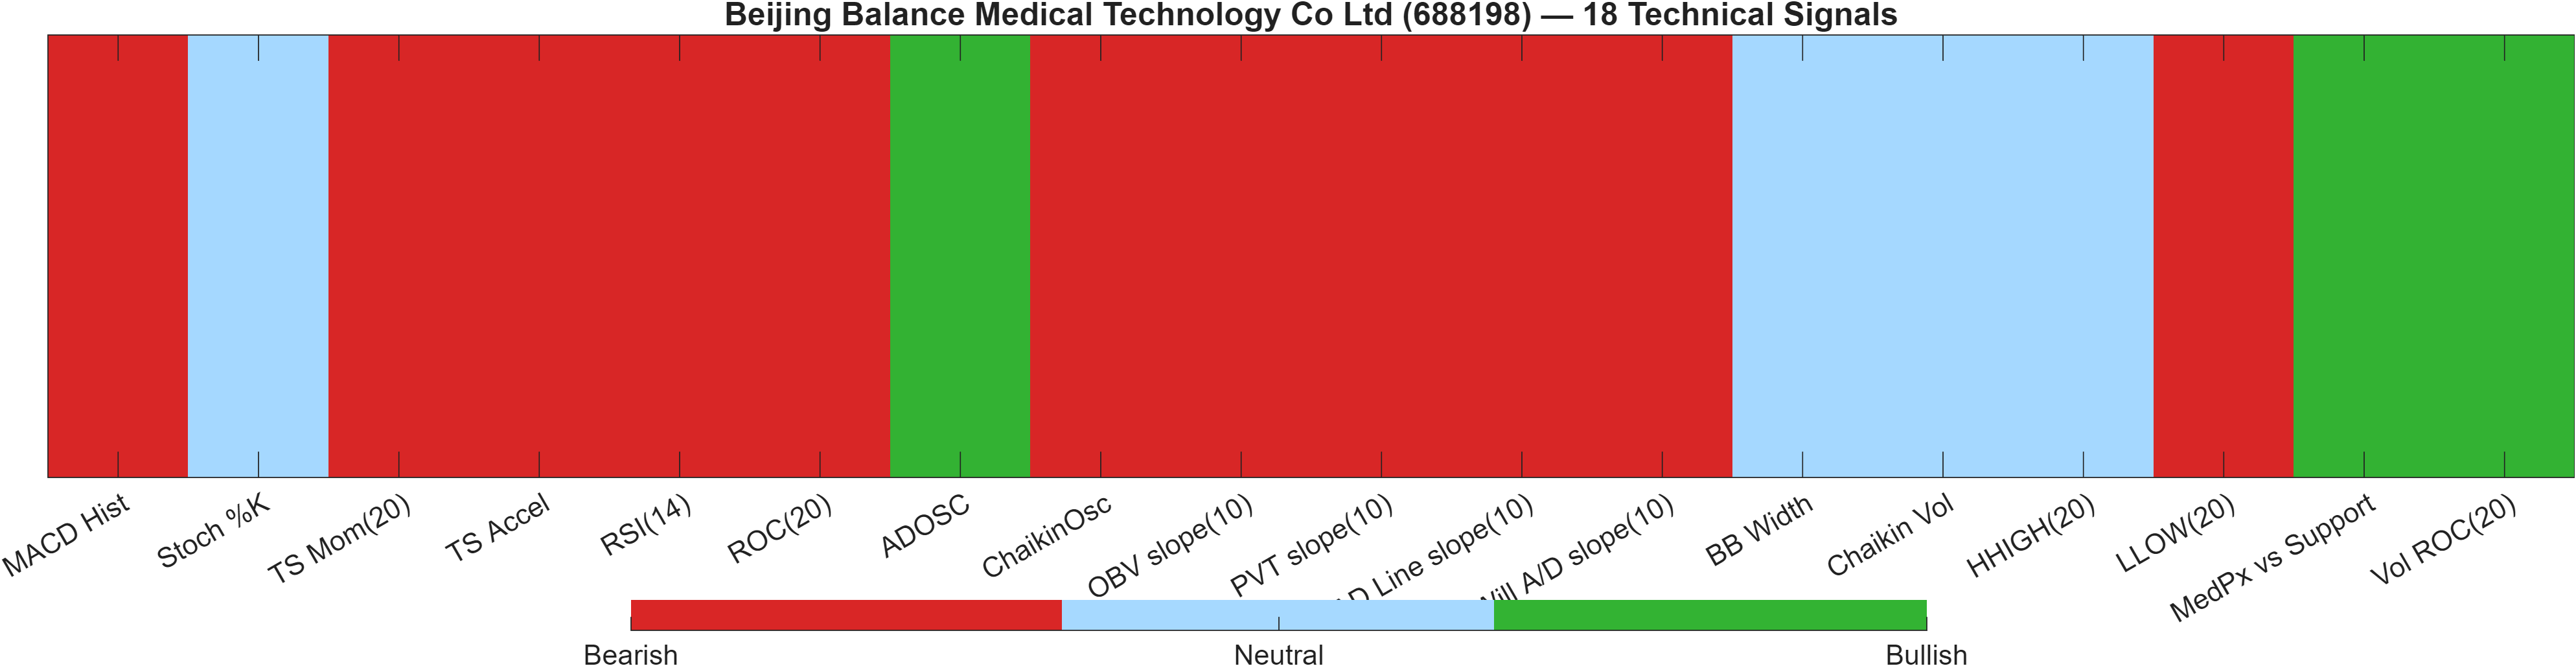
Blended technical score breakdown: -0.604 (Bearish | Bull 3 / Bear 11 / Neutral 4)
Composite read: bearish breadth with limited bullish pockets
The technical dashboard is decisively tilted negative. The 18-Signal Technical Confluence Score is -0.444 and the Overall Technical Score is -0.604, both labeled Bearish. The breadth breakdown reinforces that view: Bear 11 versus Bull 3 with Neutral 4. Separately, the DRL technical rank sits near the bottom of the universe at #1276 out of 1292, with a -0.975 score—an unusually weak placement that suggests the model is seeing an unfavorable technical state relative to peers.
Signal interactions: momentum/participation divergence is the main nuance
Within the locked signal table, the bearish side is anchored by momentum and price-behavior measures: RSI(14) 37.71 and MACD histogram -0.03522 both point to downside bias, while rate-of-change and trend-style components (e.g., ROC(20) -5.637) reinforce deceleration. Participation/flow signals are more mixed. ADOSC at 20.65 is marked bullish, and Vol ROC(20) at 36.98 is also bullish, suggesting there may be episodes of improved volume dynamics even as price momentum remains weak.
This matters because bullish participation without bullish momentum often results in failed rallies unless price can reclaim structure (Section 2) and clear resistance (Section 4). With the blended score still firmly negative, the burden of proof remains on price and momentum indicators to improve before the stronger mid/long ranks (Monthly #38, 6-Monthly #8) can be treated as aligned with the technical condition.
Signal table (Bull/Bear/Neutral)
| Indicator | Value | Signal |
|---|---|---|
| MACD Hist | -0.03522 | Bearish |
| Stoch %K | 26.41 | Neutral |
| TS Mom(20) | -5.6 | Bearish |
| TS Accel | -4.07 | Bearish |
| RSI(14) | 37.71 | Bearish |
| ROC(20) | -5.637 | Bearish |
| ADOSC | 20.65 | Bullish |
| ChaikinOsc | -3.886e+05 | Bearish |
| OBV slope(10) | -1.409e+06 | Bearish |
| PVT slope(10) | -9577 | Bearish |
| AD Line slope(10) | -1.739e+06 | Bearish |
| Will A/D slope(10) | -5.86 | Bearish |
| BB Width | 0.08967 | Neutral |
| Chaikin Vol | -17.56 | Neutral |
| HHIGH(20) | 101.3 | Neutral |
| LLOW(20) | 92.57 | Bearish |
| MedPx vs Support | 0.4883 | Bullish |
| Vol ROC(20) | 36.98 | Bullish |
Interpretation: Indicator-level signals form the base confluence, which is then adjusted using a separate AI-driven technical ranking model. The final technical score summarizes this combined view.
6) News sentiment + extractive gist
Note: Instrument-specific news matches were not found, so the digest includes broader market/sector headlines. Links are provided for verification.
Sentiment score (avg): 0.000 | Positive: 6% | Neutral: 88% | Negative: 6%
KGNAI AI News Sentiment Score (normalized -1 to +1): Not available (as of —) | Label: Not available | Overall news score: 0.00
Positive Developments
Recent coverage across major financial outlets indicates a generally calm information backdrop, consistent with the 88% neutral classification and an average sentiment score of 0.000. Where constructive tone appears, it tends to be framed as broader macro and cross-border trade discussion rather than company-specific catalysts, which aligns with KGNAI’s note that instrument-level matches were not found. In practical market terms, a low-intensity news tape can reduce headline-driven volatility and shift attention back toward price structure and liquidity signals. For 688198, that places additional weight on technical confirmation points such as the 105.0050 resistance threshold and whether momentum metrics (e.g., RSI(14) 37.71 and MACD histogram -0.0352) begin to improve. With positive sentiment measured at only 6%, “positive” here is best interpreted as the absence of destabilizing narratives rather than an affirmative catalyst stream.
Neutral / Mixed Developments
The dominant characterization is neutral, with sentiment distribution showing 88% neutral and a balanced 6% positive / 6% negative split. This type of profile often functions as a contextual filter rather than a primary driver: it suggests the market is not receiving strong incremental information that would override technical conditions. Given that the technical composite is Bearish (Overall Technical Score -0.604), a neutral news environment may allow existing chart dynamics—moving-average alignment and momentum drift—to remain the main determinants of near-term behavior. Mixed narratives can still matter at the margin, but the data here does not indicate a strong directional headline impulse.
Negative / Risk Signals
Risk tone is present but limited in magnitude, consistent with only 6% negative classification and an average sentiment score anchored at 0.000. The key risk from a market-structure standpoint is less about any single story and more about information mismatch: broad, non-instrument headlines may not map cleanly to 688198’s price behavior, increasing the likelihood that traders default to technical triggers. In a setup where momentum is already weak (RSI 37.71; MACD histogram -0.0352) and the AI technical rank is near the universe bottom (#1276/1292), negative macro or policy narratives—even if not company-specific—can reinforce defensive positioning. Under that condition, the 93.5467 support zone carries more significance: a close below it is explicitly flagged as deterioration risk and would likely dominate any ambiguous sentiment backdrop.
What to monitor next
- Whether price can reclaim 105.0050 with volume while momentum measures improve from RSI(14) 37.71.
- Any shift in sentiment distribution away from 88% neutral toward a more directional skew.
- Behavior around 93.5467 support, given the bearish technical composite (-0.604).
Sources referenced: Reuters, Bloomberg, Yahoo Finance, MarketWatch, Investing.com
Snapshot: AI Rank (Short–Mid–Long): Mixed (Bullish tilt) (Neutral–Bullish–Bullish) · Technical Confluence: Bearish · Key Levels: Support ~93.55 | Resistance ~105.00 · News Sentiment: Neutral
7) Sources
The source list in the draft contained URLs and extended headline items. Per publication format, detailed links are omitted here.
You may also like: How KGNAI AI ranks instruments across global markets
Disclaimer: KGNAI provides AI-generated analytics and educational market commentary only. This is not financial advice. Markets involve risk. Always do your own research.