
603477 (Leshan Giantstar Farming & Husbandry Corp Ltd) — Balanced, Two-Sided Technical Read | 12-Apr-2026
KGNAI Signal + Technical Snapshot + News Sentiment Digest
As of: 12-Apr-2026
Ticker: 603477
Leshan Giantstar Farming & Husbandry Corp Ltd (603477) presents a split-horizon setup: KGNAI’s longer-run ranking profile remains strong while near-term conditions are softer. The Daily rank (#1083) and Weekly rank (#1100) sit in the weaker end of the 1293-instrument China universe, yet the longer lens is materially stronger with the 6-Month rank (#22) and Yearly rank (#41) in the top decile. Technically, the tape shows a bearish moving-average structure (close below MA50; MA50 below MA200), while the indicator layer is less one-sided: RSI(14) at 53.81 reads neutral and MACD histogram at 0.07126 remains positive. Volatility is not extreme, with Bollinger Bandwidth at 0.1415, keeping the focus on level-based validation around support ~16.2900 and resistance ~19.4650. News sentiment is near-flat (-0.013), suggesting context rather than a directional driver.
Key Takeaways
- Short / Mid / Long rank stance: Short-term Bearish · Mid-term Neutral · Long-term Bullish
- Technical confluence label: 18-signal confluence 0.500 (Bullish) vs blended overall technical score 0.102 (Neutral)
- Key levels: Support ~16.2900 · Resistance ~19.4650
- News sentiment bias: Near-neutral (-0.013; 6% positive / 81% neutral / 12% negative)
- Confirmation / invalidation condition: A break above 19.4650 with volume supports continuation; a close below 16.2900 increases deterioration risk.
What KGNAI Measures
KGNAI evaluates assets using large cross-sectional datasets built from millions of structured data points. Inputs incorporate fundamental metrics, technical structures, and systematically processed news sentiment. Statistical models, machine learning, and AI frameworks are used to assess relative positioning, signal alignment, and probabilistic behavior across broad universes.
How to Read This Report
- Ranks are comparative across the tracked universe, not absolute price targets.
- Confluence reflects alignment among independent signal groups.
- Support/resistance levels are probabilistic decision zones, not guarantees.
- Sentiment provides contextual bias within the broader analytical framework.
1) KGNAI AI Analysis
Region: CHINA
Total universe size: 1293 ranked instruments
- Daily rank: #1083 out of 1293 — Bearish
- Weekly rank: #1100 out of 1293 — Bearish
- Monthly rank: #462 out of 1293 — Neutral
- 3-Monthly rank: #104 out of 1293 — Bullish
- 6-Monthly rank: #22 out of 1293 — Bullish
- Yearly rank: #41 out of 1293 — Bullish
603477’s cross-horizon ranking profile is defined by timeframe divergence. The short-term ranks sit in the lower tail of the universe (Daily #1083, Weekly #1100), implying weaker near-term positioning relative to peers. At the same time, the longer windows are firmly in the upper tier, with the 6-Month rank (#22) and Yearly rank (#41) signaling strong relative persistence at a broader horizon.
The pivot point is the middle: the Monthly rank (#462) is neutral and the 3-Month rank (#104) remains bullish. This pattern often maps to a market that has not fully invalidated the longer-run regime, but is still working through a nearer-term drawdown or consolidation phase. In practical risk terms, the long-term signal is not “in control” unless it is supported by stabilization in the short windows.
KGNAI’s stated term view is consistent with that split (Short-term: Bearish; Mid-term: Neutral; Long-term: Bullish). For allocation or risk overlay, this setup typically rewards discipline around confirmation: a near-term improvement would be reflected first by a rising daily/weekly rank profile, rather than by further strength in already-strong 6-month and yearly ranks.
KGNAI ranks each instrument across large universes using multiple proprietary AI tests and statistical models (millions of data points). Lower ranks generally indicate stronger probability of favorable performance behavior, while higher ranks indicate weaker probability and more bearish positioning.
Term view: Short-term: Bearish. Mid-term: Neutral. Long-term: Bullish.
Want the full universe and complete rank tables? Unlock full access on KGNAI: https://www.kgnai.com/pricing
2) Price & trend overview
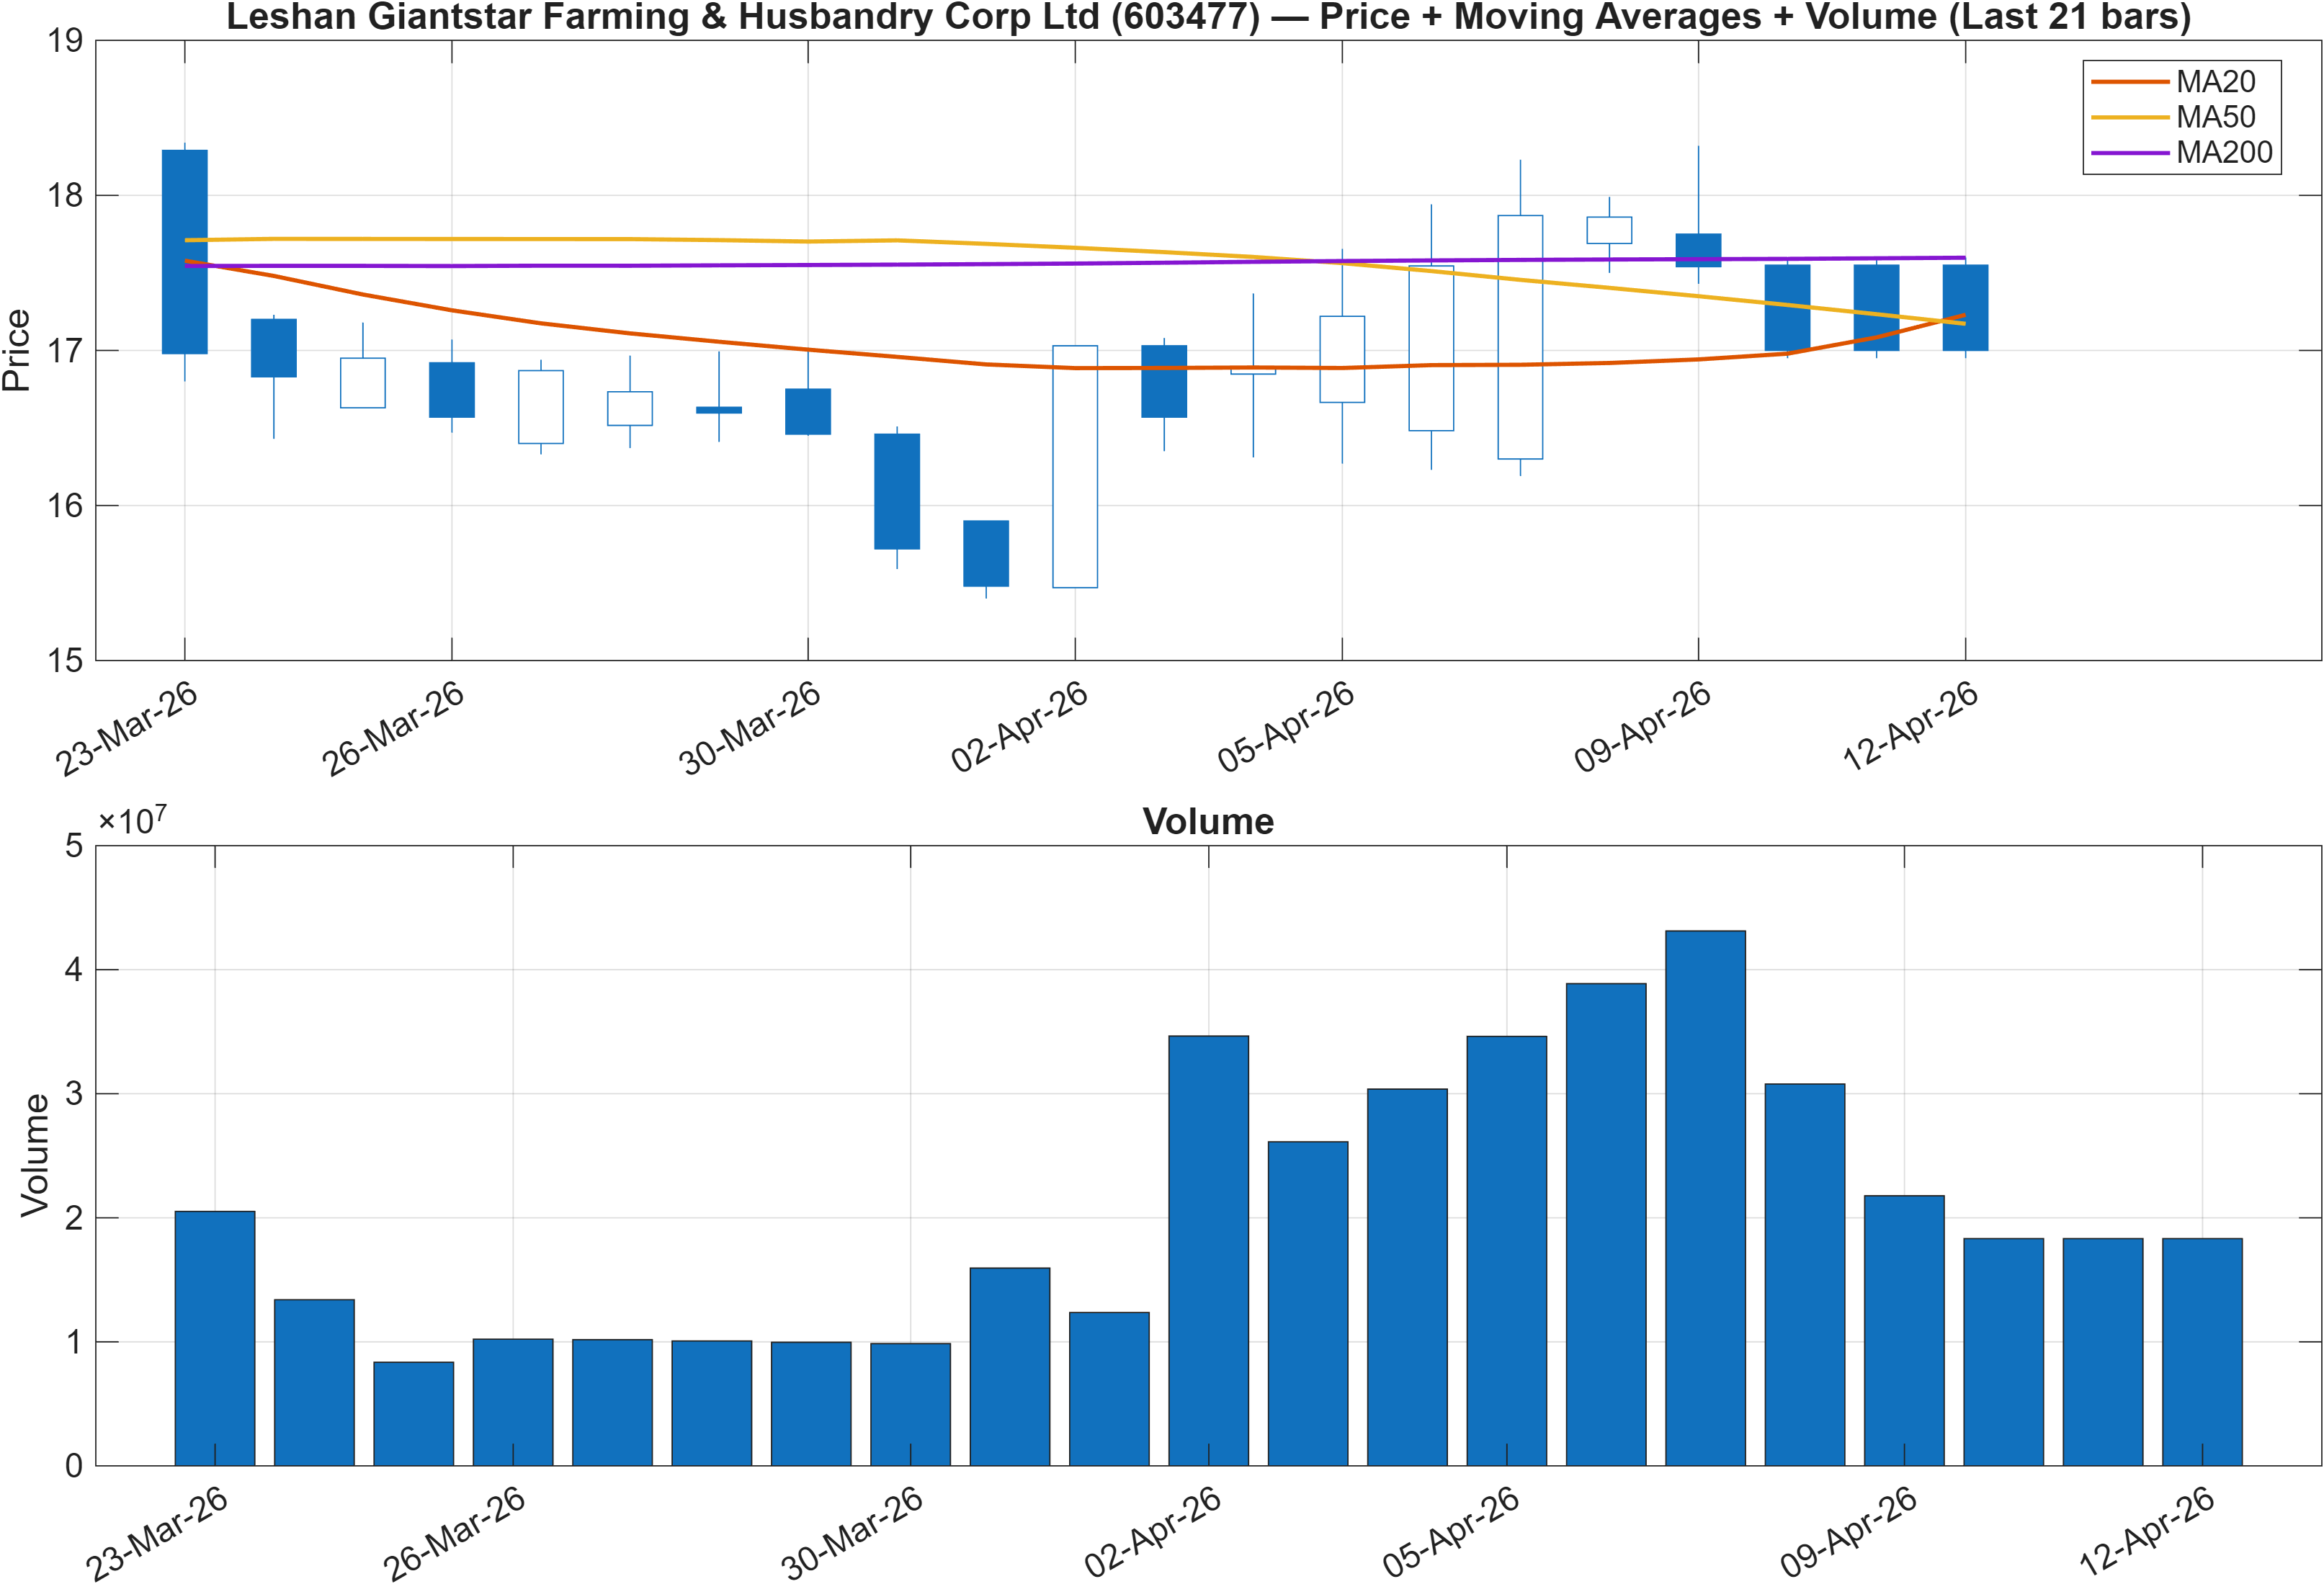
Interpretation: Close vs MA50 = Bearish, MA50 vs MA200 = Bearish.
The moving-average stack places 603477 in a defensive trend state at the timeframe captured: the close is below the MA50 and the MA50 is below the MA200. In conventional trend taxonomy, that combination is consistent with a market that has not yet regained intermediate momentum, even if other indicators show early stabilization.
What makes this more nuanced is the broader KGNAI ranking context: despite bearish short-term ranks (#1083 daily; #1100 weekly), the longer-run profile remains supportive (#22 at 6 months; #41 yearly). That mismatch can occur when a longer-term uptrend is still “statistically present” across the universe, but the price structure is temporarily below key trend filters. In those cases, the moving averages often act as regime gates: regaining the MA50 is typically a first test, while a positive MA50/MA200 relationship tends to confirm a more durable reversal in trend classification.
The more actionable lens becomes how trend structure interacts with the level map in this report: support ~16.2900 and resistance ~19.4650. With the MA stack bearish, resistance generally matters more as an invalidation threshold for bearish pressure; conversely, holding above support is the condition that prevents the downtrend framing from turning into a larger deterioration scenario.
Net read: the trend filter is still cautious, and any improvement in the near-term ranking profile is likely to require visible repair in the moving-average relationship rather than isolated one-day strength.
3) Momentum & volatility dashboard
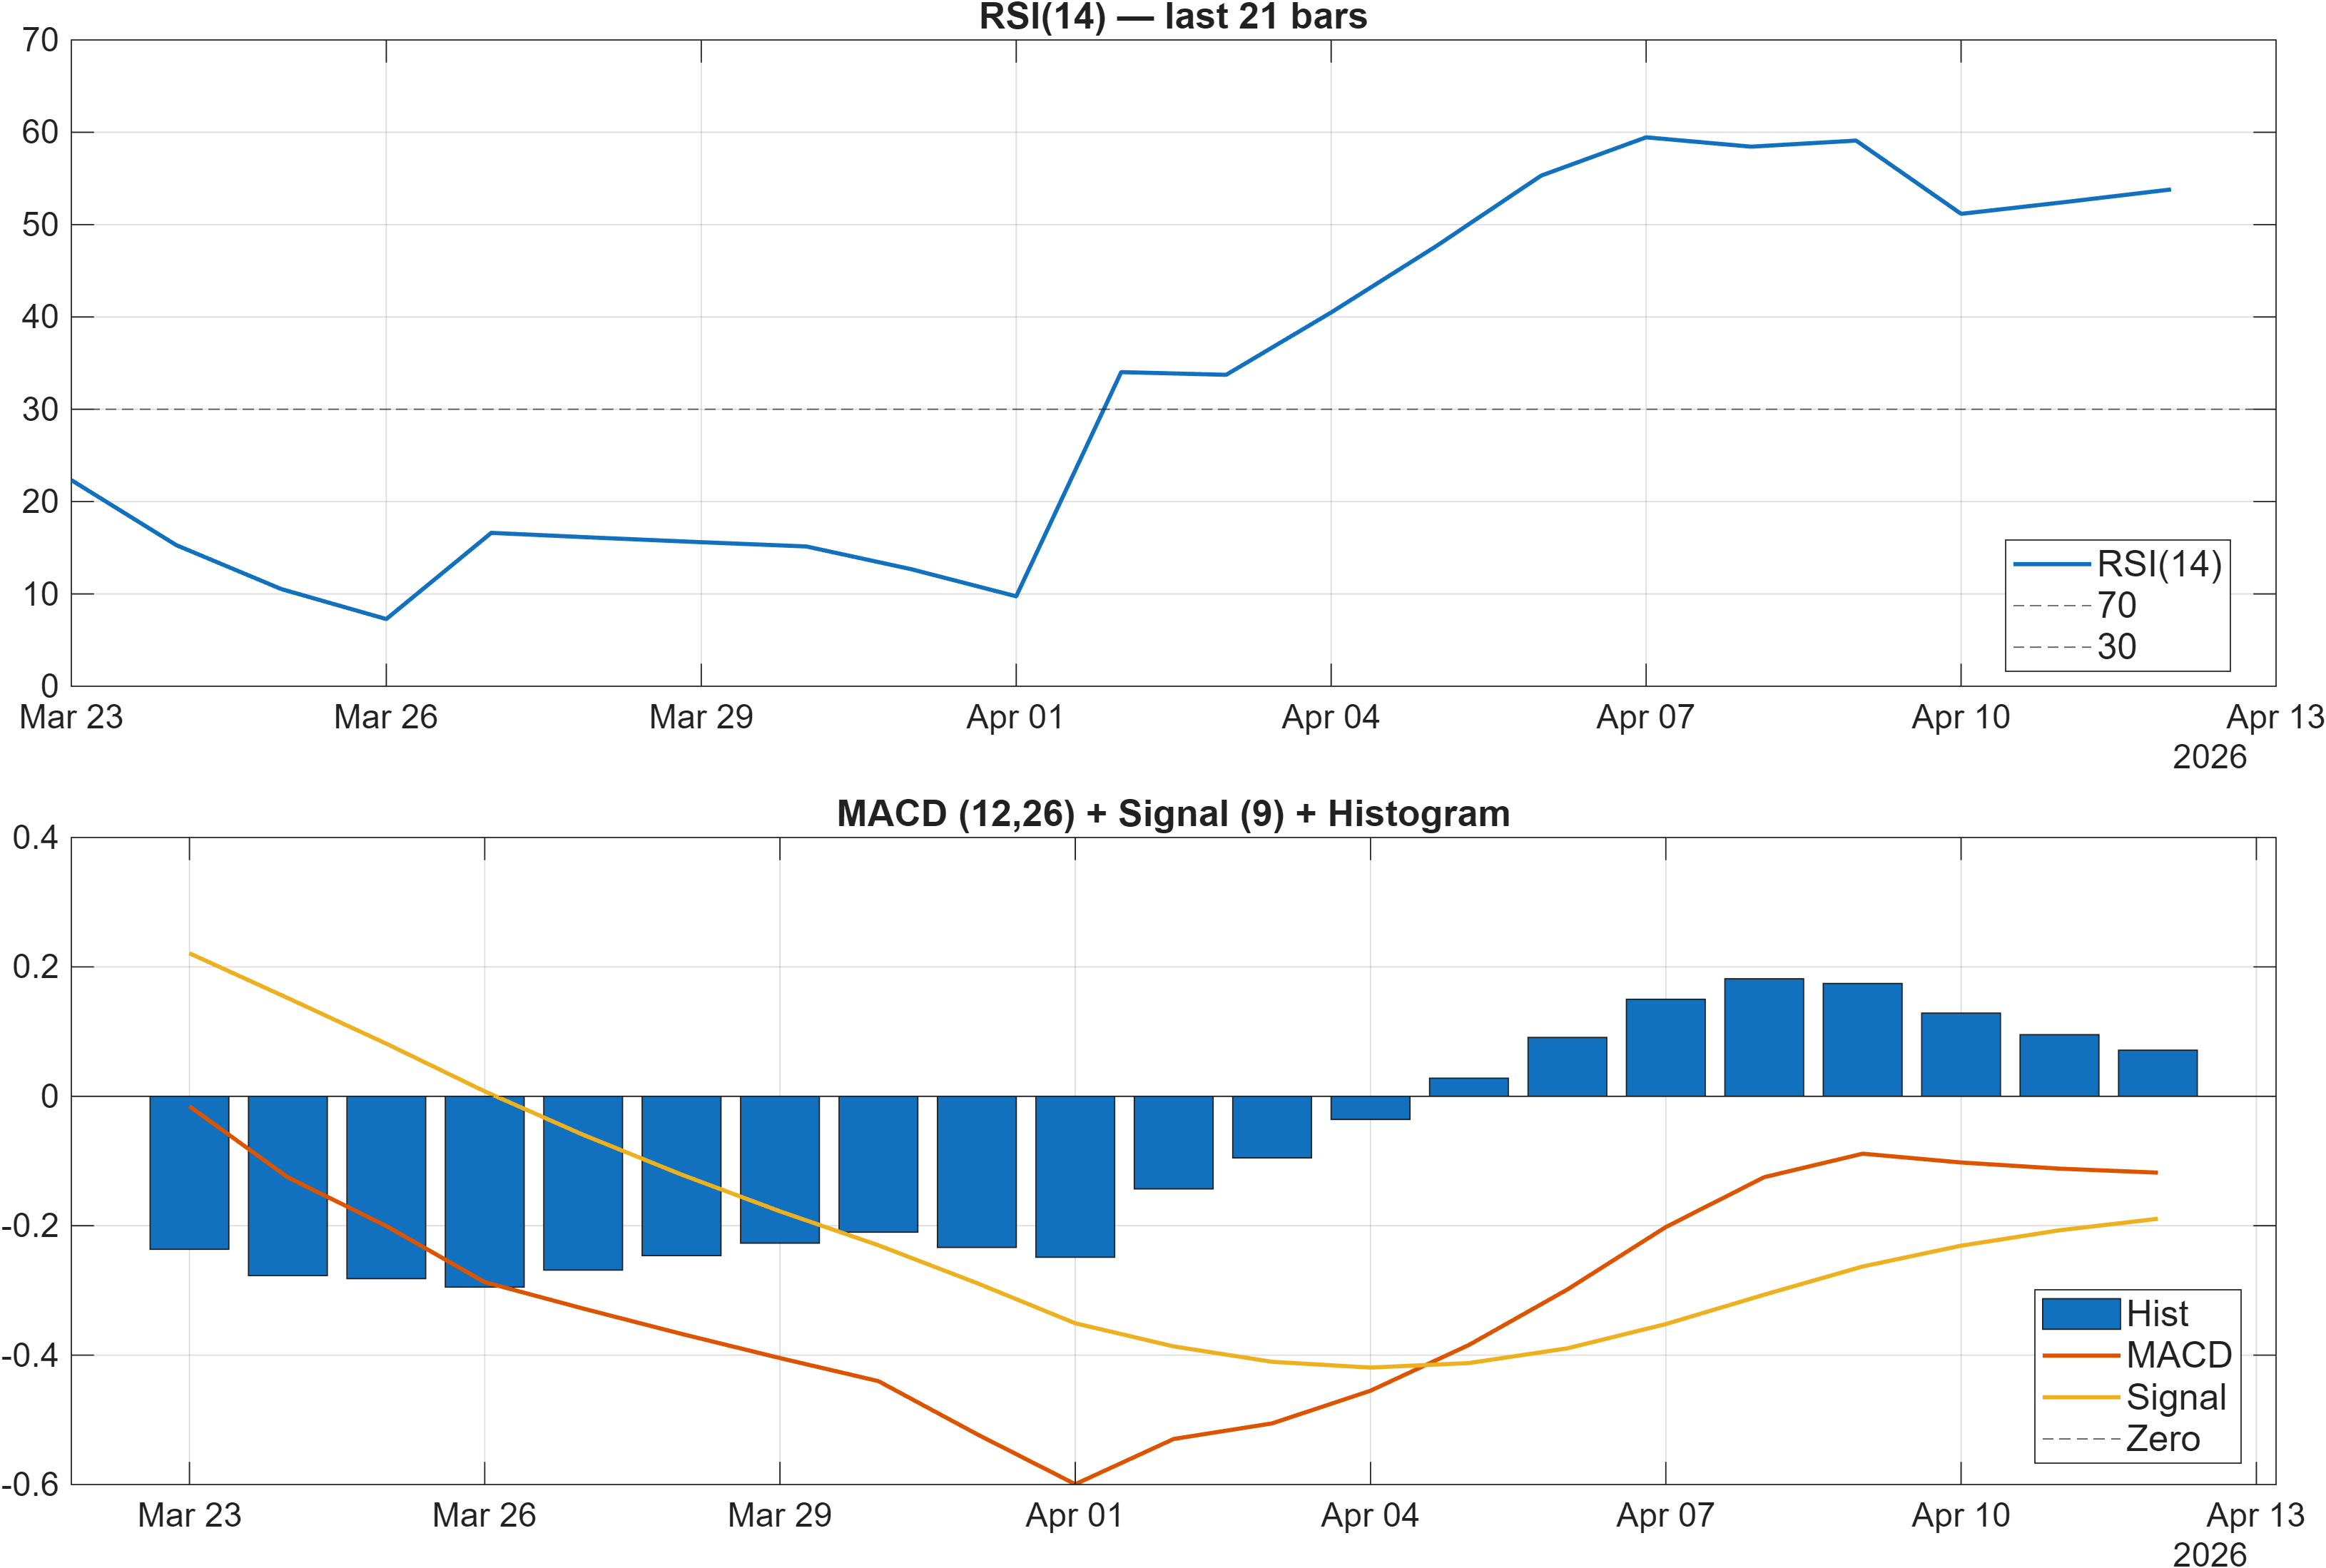
Interpretation: RSI bias = Neutral, MACD hist = 0.0713.
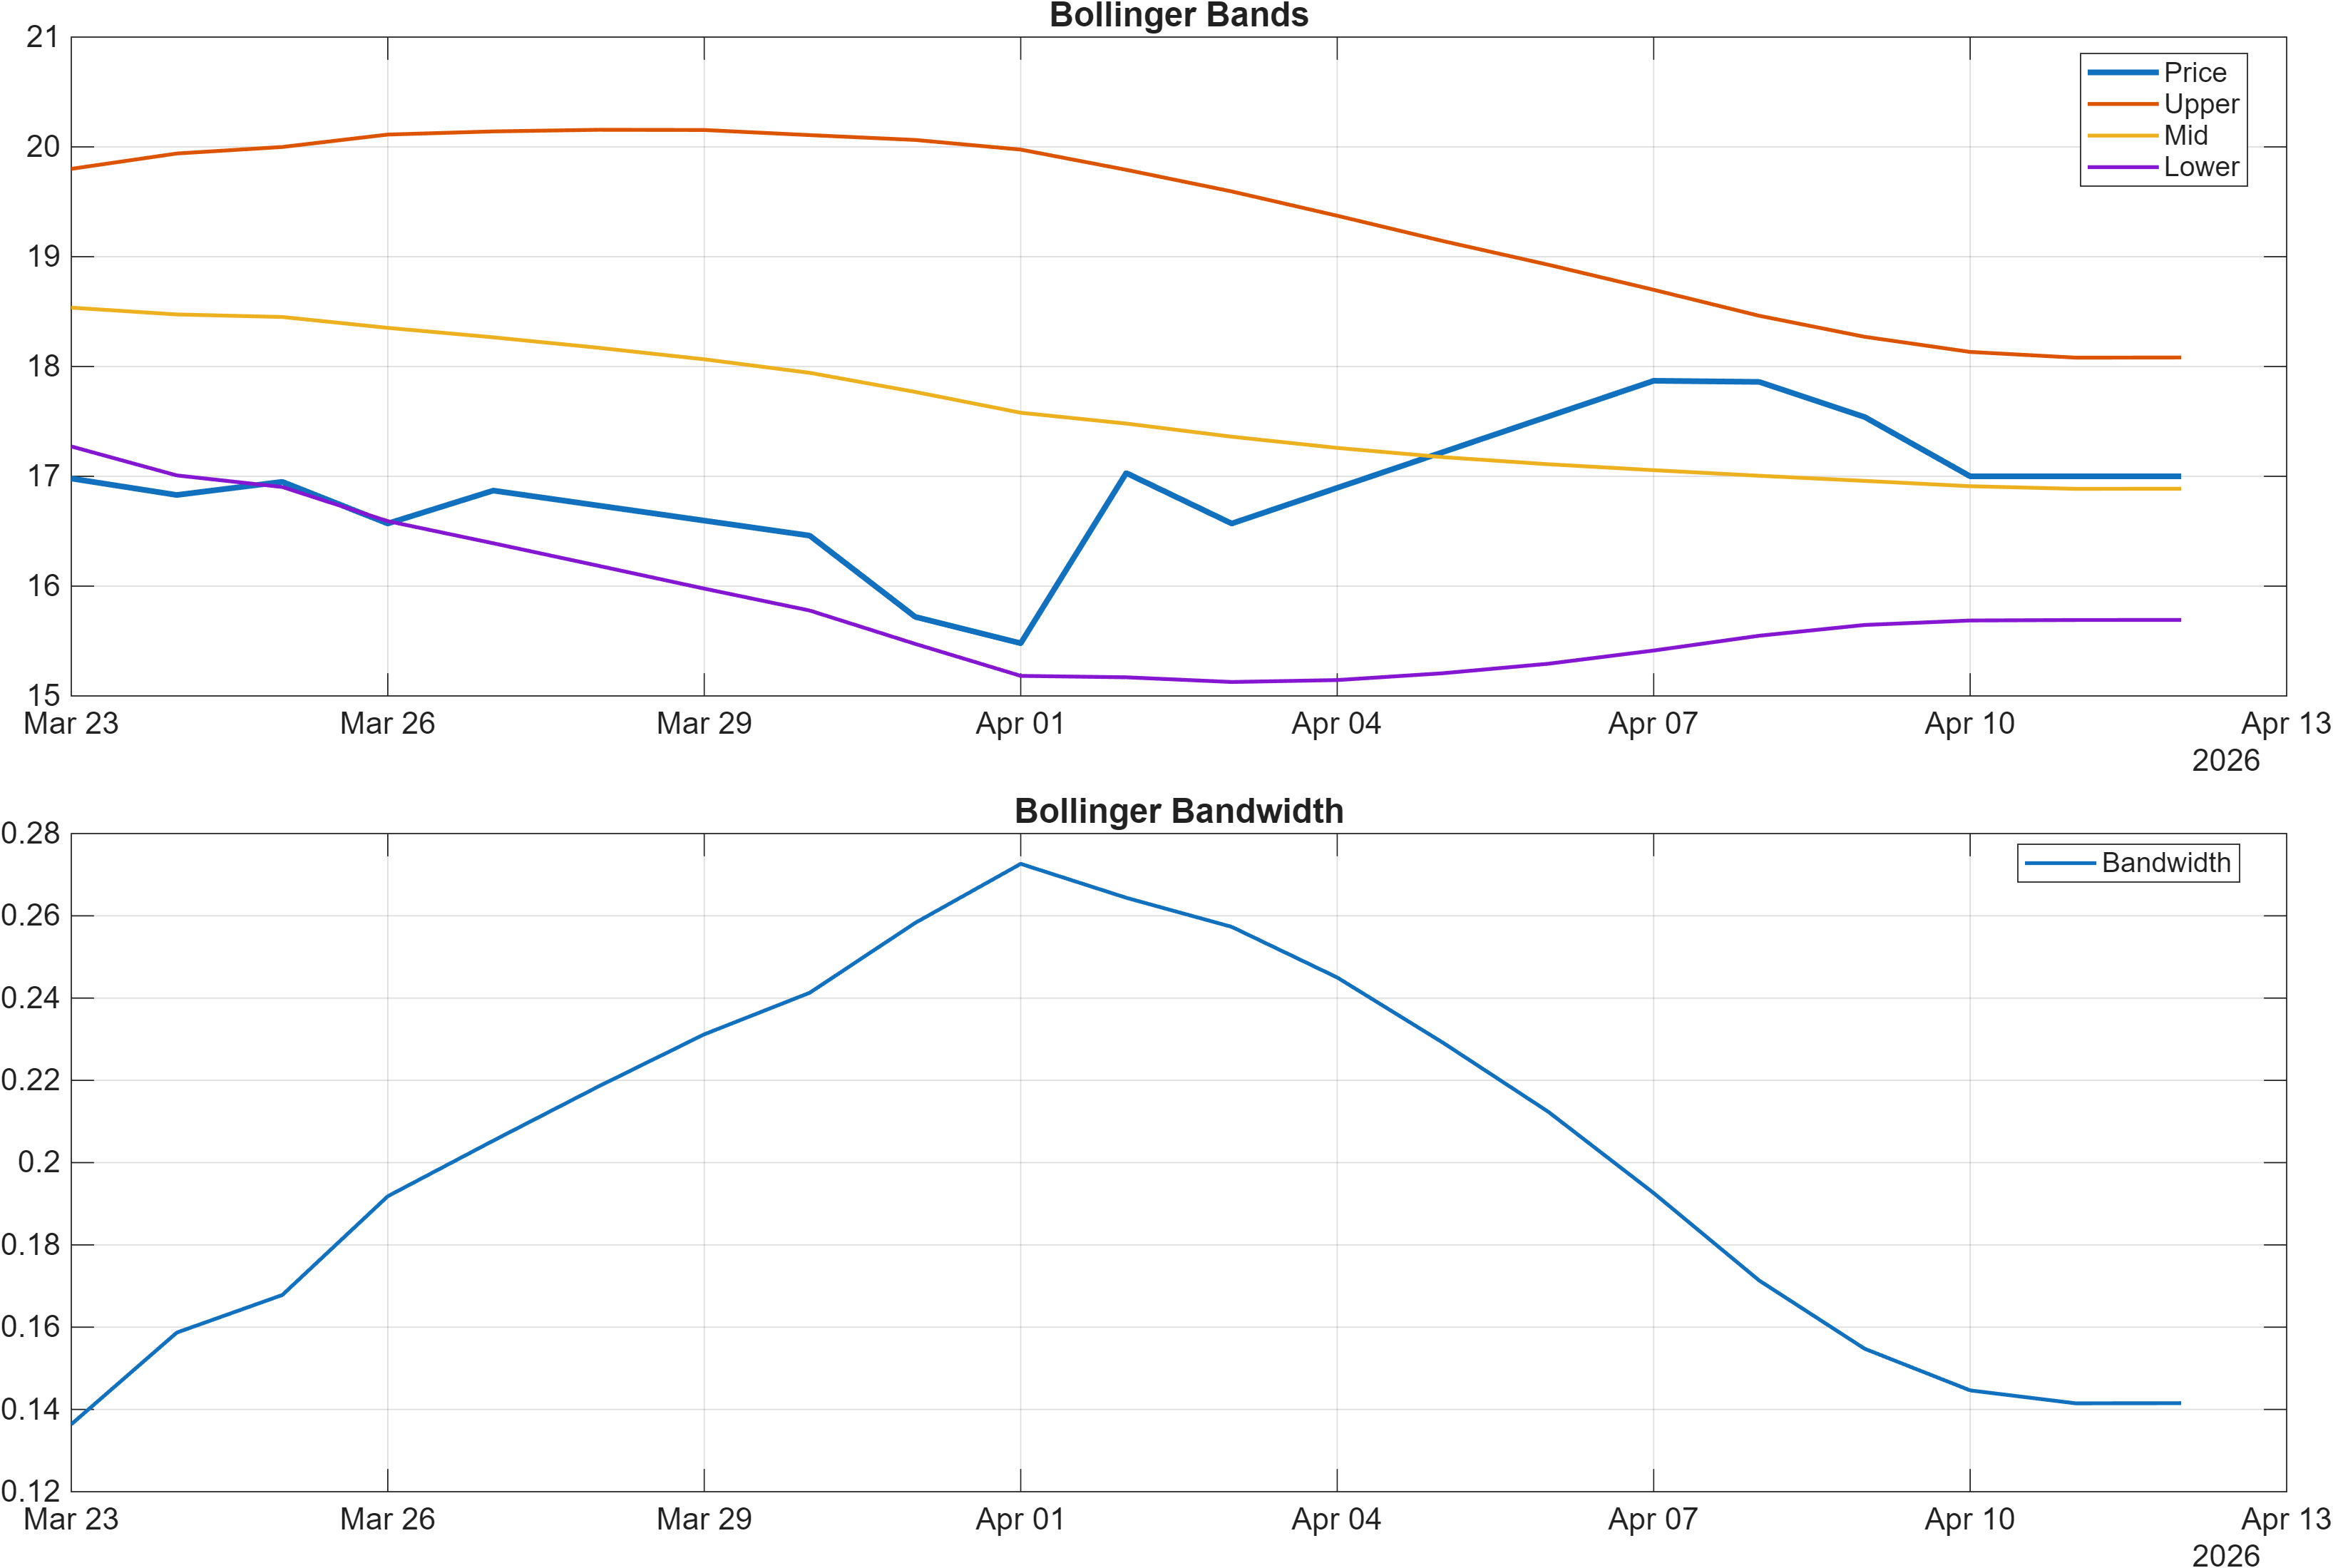
Interpretation: Bandwidth (volatility regime) latest = 0.1415.
Momentum and volatility are not fully aligned with the bearish trend filter, which is why the overall posture reads “two-sided.” The RSI(14) at 53.81 is neutral and consistent with a market that is neither extended nor capitulating. At the same time, the MACD histogram at 0.07126 is positive, indicating that downside pressure is not dominating the immediate momentum differential even while the moving averages remain bearish.
Volatility conditions also look contained: Bollinger Bandwidth at 0.1415 points to a moderate volatility regime rather than a high-dislocation phase. That matters for execution and signal reliability: in compressed-to-moderate volatility, level breaks (support/resistance) tend to carry more weight than in high-volatility conditions where false breaks are more common.
The indicator mix inside the 18-signal set reinforces this “stabilizing but not confirmed” interpretation. ROC(20) at 1.01 is bullish, but Stoch %K at 38.03 remains neutral, suggesting momentum is present without signaling an overbought thrust. Volume-linked components are mixed: ADOSC at 7.692 is bullish while the ChaikinOsc at -3.964e+06 is bearish, a divergence that can appear when accumulation measures improve but shorter-term flow oscillators lag.
Overall, the dashboard reads like a market that is attempting to base: momentum is not emphatically bearish, volatility is not forcing liquidation, but trend confirmation is still pending through the moving-average structure and the key level map.
4) Support / Resistance zones
Support ~ 16.2900 | Resistance ~ 19.4650
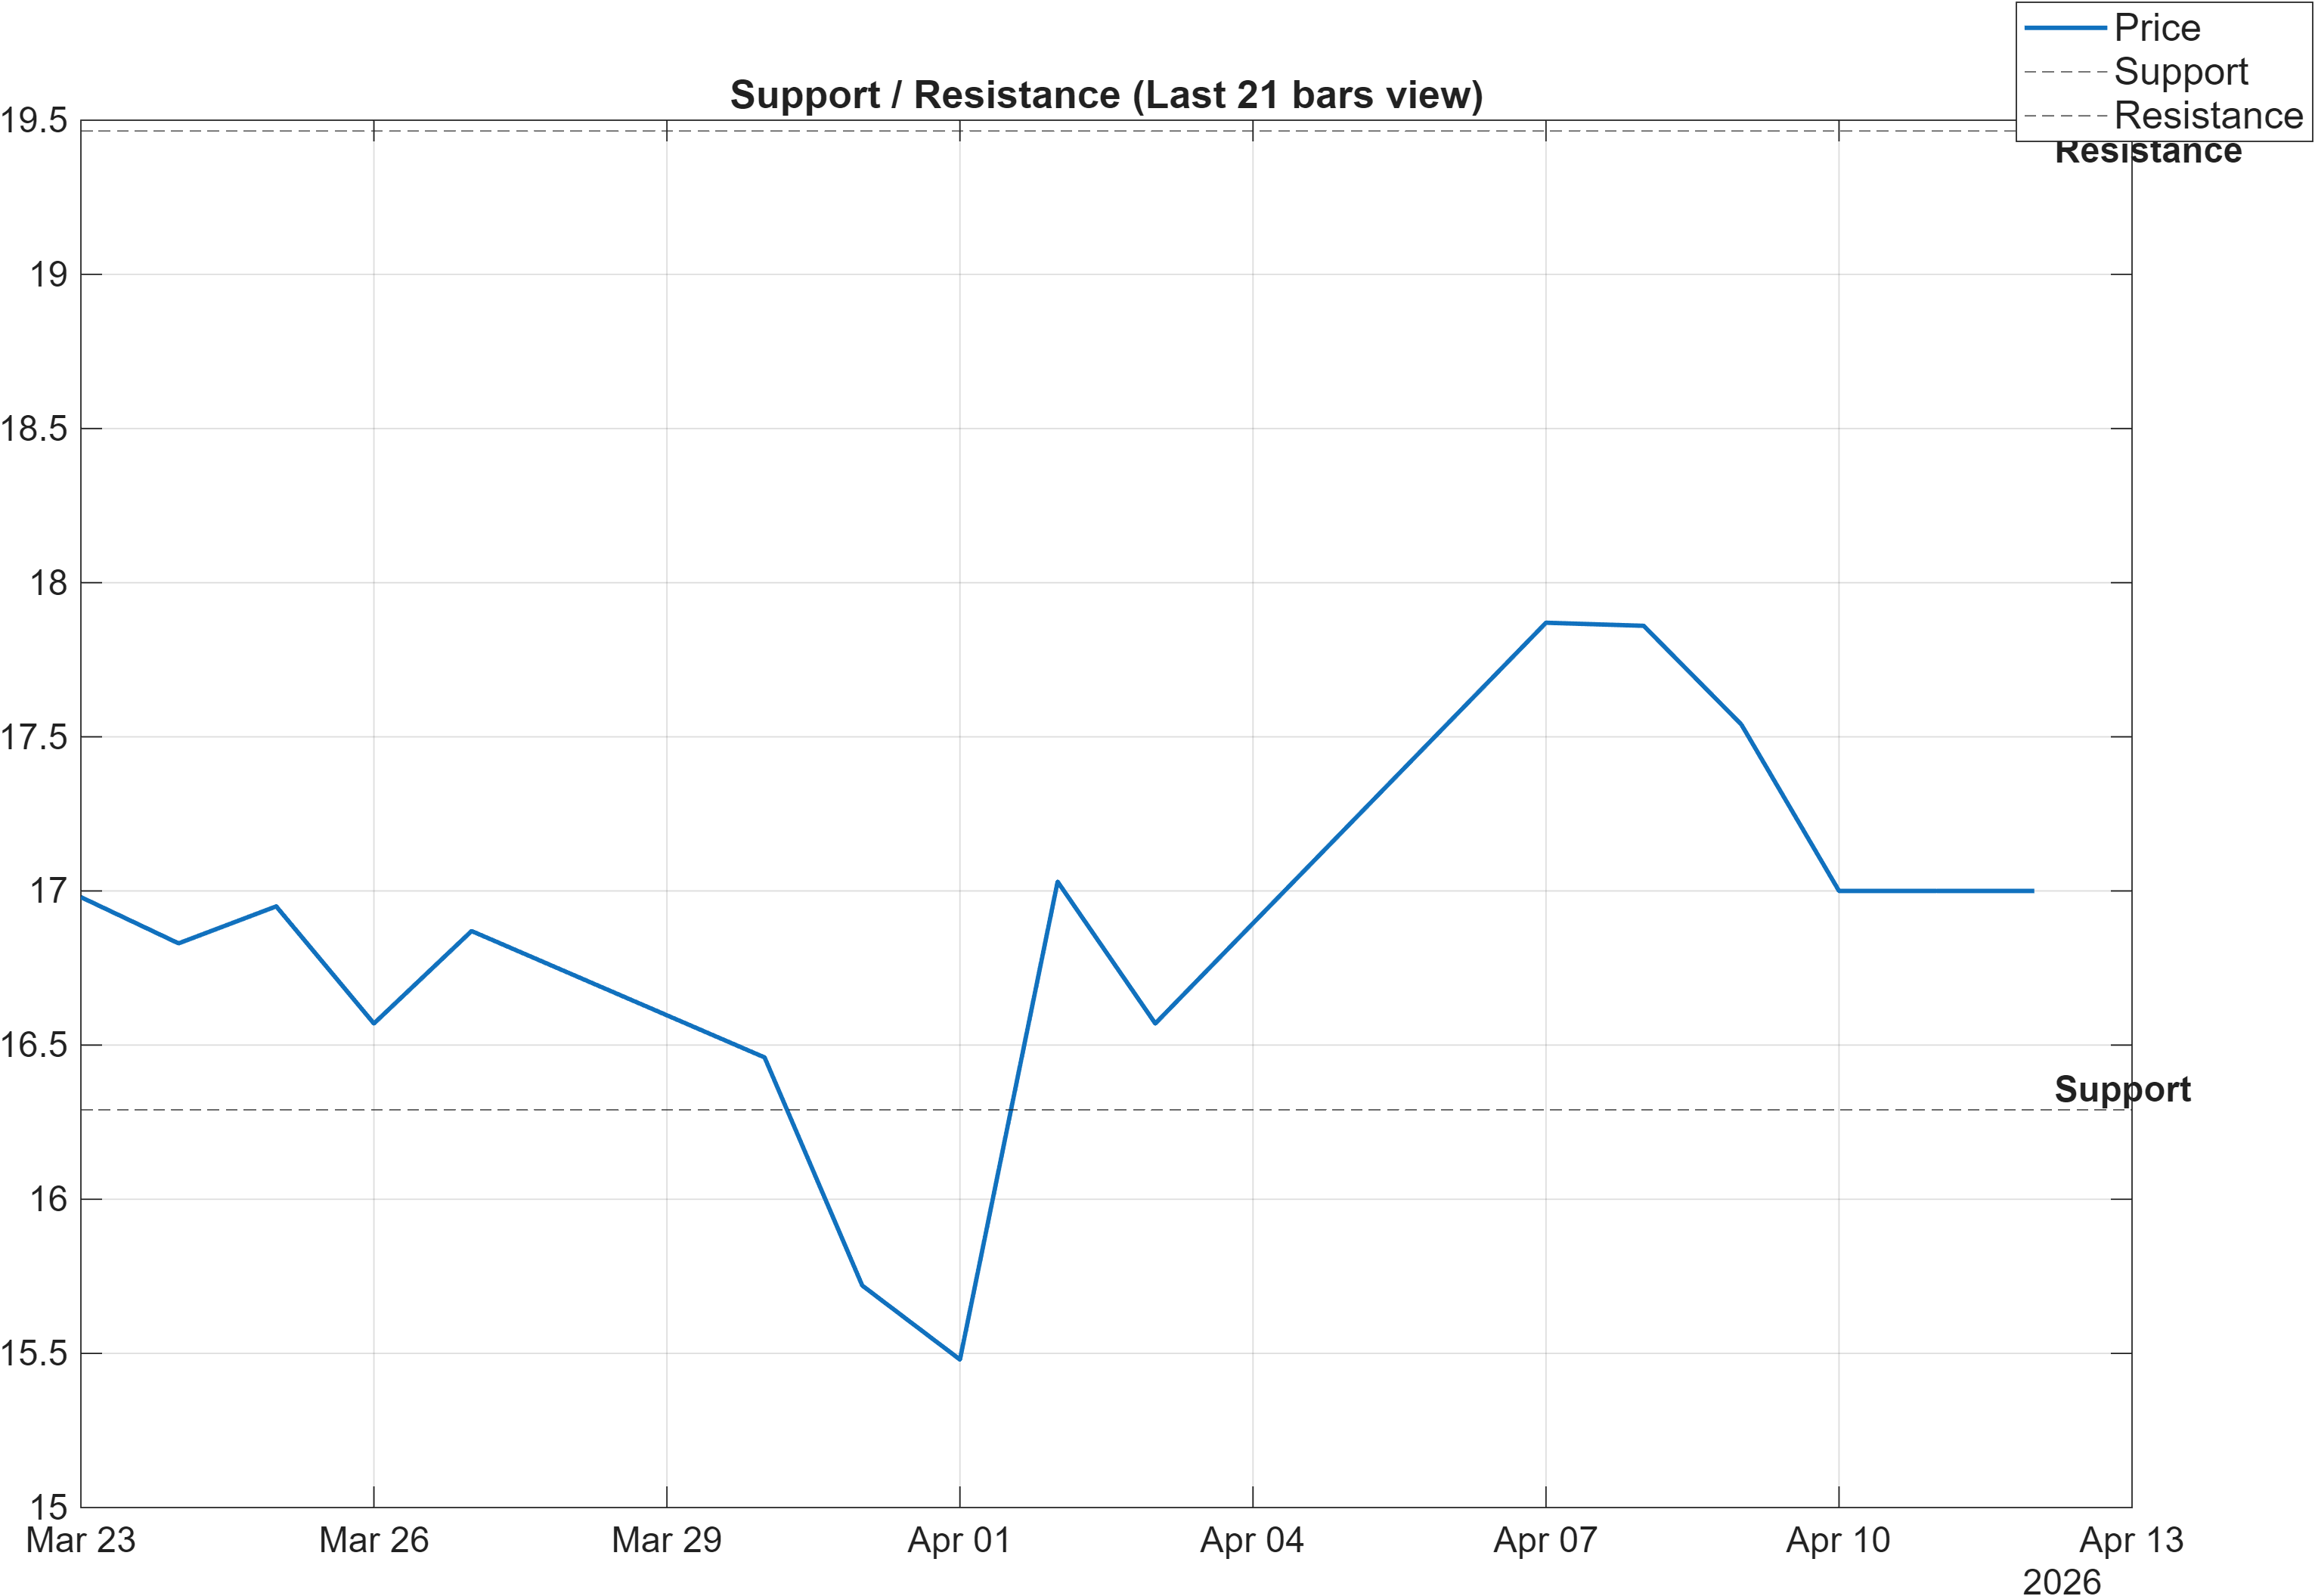
Scenario view: Break above resistance with volume → continuation. Close below support → signal deterioration risk.
The level structure provides the cleanest framework for reconciling mixed signals. With support at 16.2900 and resistance at 19.4650, the market is effectively priced between a risk-defined floor and a trend-repair ceiling. Given the bearish moving-average configuration (close below MA50; MA50 below MA200), resistance becomes the key “proof point” for shifting from stabilization to continuation.
Several signals in the 18-indicator set add context to how these zones may behave. MedPx vs Support at 0.985 is labeled bullish, which is consistent with price holding close enough to the defined support region to keep a base-building narrative alive. Meanwhile, the neutral range components (HHIGH(20) at 18.32 and LLOW(20) at 15.4) suggest the market has identifiable bounds that can anchor mean-reversion behavior until a decisive break occurs.
Resistance at 19.4650 is also where confirmation should be stricter, because it must overcome not only level supply but also the broader short-term weakness implied by ranks such as #1083 (daily) and #1100 (weekly). Conversely, a close below 16.2900 would align the level break with the already-cautious trend filter, raising the probability that the short-term bearish regime is extending rather than fading.
From a market-structure perspective, the highest-quality information often comes from how price reacts at these zones: acceptance above resistance (with volume) versus rejection, and defense of support versus accelerated failure.
5) Quant Technical Dashboard (18 Signals)
KGNAI AI Technical Analysis Score (Deep Reinforcement Learning): Rank #1181 out of 1293 (Rank 1 represents the strongest technical positioning and a higher probability of favorable price behavior. As ranks increase toward the maximum, the probability of favorable outcomes weakens and bearish positioning becomes more dominant.) | Label: Bearish | Score: -0.827
18-Signal Technical Confluence Score: 0.500 (Bullish)
Overall Technical Score (18-signal confluence + DRL rank blend): 0.102 (Neutral)
Note: The blended score reflects signal strength weighted against broader AI technical ranking, which may temporarily diverge.
Blended technical score breakdown: 0.102 (Neutral | Bull 11 / Bear 2 / Neutral 5)
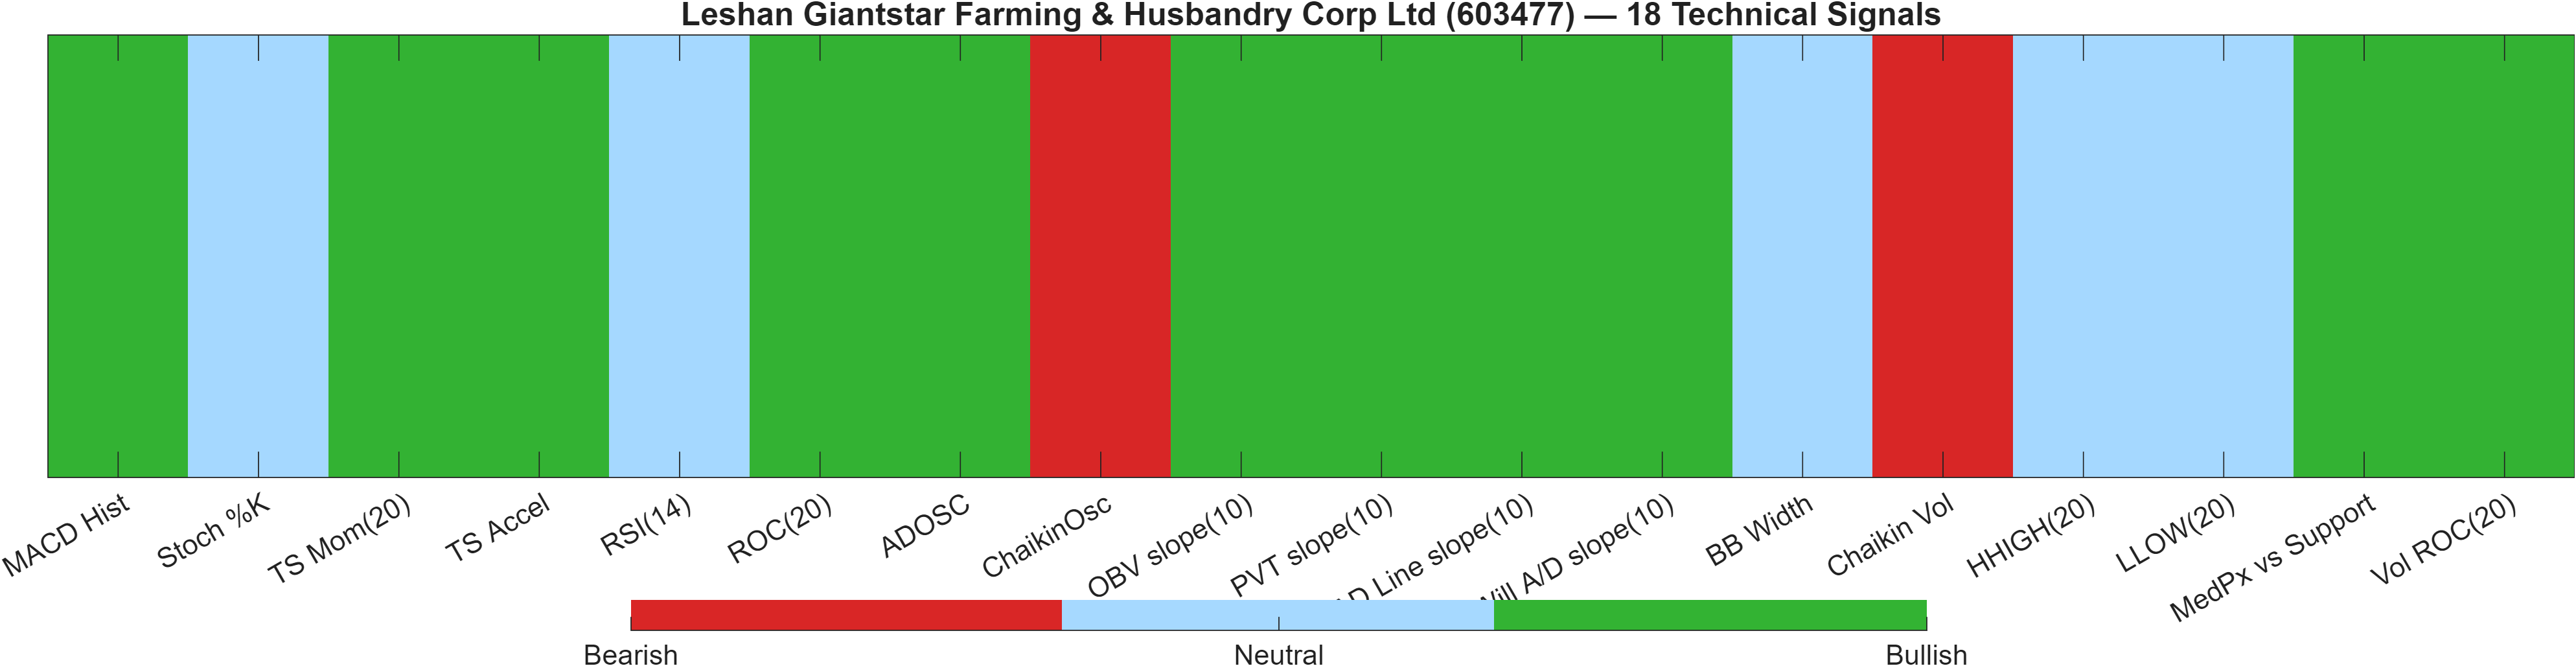
The technical stack highlights a confluence-vs-model divergence. On one hand, the discrete indicator set scores 0.500 (Bullish), with 11 bullish readings versus only 2 bearish. On the other hand, the DRL technical rank is weak at #1181 with a -0.827 score, pulling the blended result down to 0.102 (Neutral).
Interpreting that split: indicator confluence can improve before the broader technical rank model responds, especially when the price trend filter is still damaged (as indicated by the bearish MA relationships) and when near-term cross-sectional ranks remain weak. In that context, the bullish confluence may be best treated as early stabilization evidence rather than full confirmation.
A few components help explain why confluence is positive despite the DRL rank. The MACD histogram (0.07126) is bullish and consistent with improving momentum. Several flow/participation measures are also bullish—OBV slope(10) at 4.999e+07 and Vol ROC(20) at 36.8—suggesting activity has not collapsed. Meanwhile, the bearish signals are concentrated in volatility/flow oscillators (Chaikin Vol at 7.619 and ChaikinOsc at -3.964e+06), which can be sensitive to short-window swings and may lag during regime transitions.
Netting these layers together, the blended neutral score is coherent: the indicator set argues “improving internals,” while the DRL rank argues “still weak technical state” relative to the full universe.
Signal table (Bull/Bear/Neutral)
| Indicator | Value | Signal |
|---|---|---|
| MACD Hist | 0.07126 | Bullish |
| Stoch %K | 38.03 | Neutral |
| TS Mom(20) | 0.17 | Bullish |
| TS Accel | 0.75 | Bullish |
| RSI(14) | 53.81 | Neutral |
| ROC(20) | 1.01 | Bullish |
| ADOSC | 7.692 | Bullish |
| ChaikinOsc | -3.964e+06 | Bearish |
| OBV slope(10) | 4.999e+07 | Bullish |
| PVT slope(10) | 1.117e+06 | Bullish |
| AD Line slope(10) | 6.009e+06 | Bullish |
| Will A/D slope(10) | 2.51 | Bullish |
| BB Width | 0.1415 | Neutral |
| Chaikin Vol | 7.619 | Bearish |
| HHIGH(20) | 18.32 | Neutral |
| LLOW(20) | 15.4 | Neutral |
| MedPx vs Support | 0.985 | Bullish |
| Vol ROC(20) | 36.8 | Bullish |
Interpretation: Indicator-level signals form the base confluence, which is then adjusted using a separate AI-driven technical ranking model. The final technical score summarizes this combined view.
6) News sentiment + extractive gist
Note: Instrument-specific news matches were not found, so the digest includes broader market/sector headlines. Links are provided for verification.
Sentiment score (avg): -0.013 | Positive: 6% | Neutral: 81% | Negative: 12%
KGNAI AI News Sentiment Score (normalized -1 to +1): Not available (as of —) | Label: Not available | Overall news score: -0.01
Positive Developments
Recent coverage across major financial outlets skews largely non-market-specific for this ticker, and the aggregate sentiment distribution reflects that: 81% neutral with a small positive share (6%) and limited negative share (12%). The positive bucket appears driven more by general “constructive” developments and innovation narratives than by company-specific catalysts. With the average sentiment score only slightly negative at -0.013, the practical takeaway is that news flow is not currently acting as a directional driver, leaving the technical map (support at 16.2900, resistance at 19.4650) and the momentum structure (e.g., MACD histogram 0.07126) as the primary near-term inputs. In this environment, “positive” coverage tends to function as background tone—potentially supporting risk appetite at the margin—rather than providing a standalone reason to override the bearish moving-average configuration.
Neutral / Mixed Developments
The neutral share (81%) dominates, consistent with a digest built from broader market/sector items rather than 603477-specific reporting. This typically reduces the signal value of day-to-day headlines for position timing: when news is not instrument-specific, price often responds more to positioning, liquidity, and technical thresholds than to narrative updates. The absence of a normalized KGNAI AI News Sentiment Score (Not available) further reinforces the need to treat sentiment here as contextual bias only, not a standalone factor. For traders, mixed/neutral news regimes often coincide with range-bound behavior until price resolves above resistance (19.4650) or fails below support (16.2900), especially with volatility moderate (Bandwidth 0.1415).
Negative / Risk Signals
Negative items in the broader digest are best framed as macro risk tone rather than issuer-specific risk. With the sentiment score still close to flat (-0.013) and negative share at 12%, the data suggests the market is not being hit by a concentrated negative narrative, but it is also not receiving strong supportive catalysts. The key risk is therefore more technical than informational: short-term KGNAI ranks remain weak (Daily #1083, Weekly #1100), and the bearish MA structure implies that downside reactions can travel faster if support at 16.2900 is lost. In a neutral-volatility regime (0.1415), risk can still rise quickly if level breaks turn into acceptance (multiple closes below support) rather than brief intraday probes.
What to monitor next
- Whether price acceptance develops above 19.4650 alongside improving short-term ranks.
- Any sustained closes below 16.2900 versus quick recoveries back into the range.
- Whether near-neutral sentiment (-0.013) shifts meaningfully as instrument-specific coverage emerges.
Snapshot: AI Rank (Short–Mid–Long): Mixed (Bearish–Neutral–Bullish) · Technical Confluence: Bullish · Key Levels: Support ~16.29 | Resistance ~19.46 · News Sentiment: Neutral
Sources referenced: Reuters, Bloomberg, Yahoo Finance, MarketWatch, Investing.com
7) Sources
Not available in the provided data.
You may also like: How KGNAI AI ranks instruments across global markets
Disclaimer: KGNAI provides AI-generated analytics and educational market commentary only. This is not financial advice. Markets involve risk. Always do your own research.