
42-coin (42-USD) Technical & Rank Dashboard — 15-May-2026 | Neutral Bias with Mixed Timeframe Ranks
This KGNAI report reviews 42-coin (42-USD) as of 15-May-2026, emphasizing confirmation and invalidation zones rather than point forecasts. Across the 800-instrument crypto universe, ranks show a mixed profile: the daily rank (#430) sits near the middle of the distribution, while the weekly rank (#665) leans into the weaker tier, suggesting near-term relative softness versus peers. Technically, the picture is more balanced than the ranks imply: the 18-signal confluence score (0.333) is labeled bullish, yet the overall blended technical score (0.269) remains neutral, consistent with a market that is not delivering decisive follow-through. Momentum inputs (e.g., RSI(14) 53.63 and MACD histogram 220.9580) point to mild positive bias without overextension. Key decision zones remain anchored around support ~22850.3827 and resistance ~29478.6320, with neutral news sentiment (0.000) providing limited directional context.
Key Takeaways
- Rank stance: Short Bearish | Mid Neutral | Long Neutral
- Technical confluence: Bullish (18-signal confluence 0.333) with a Neutral blended overlay (0.269)
- Key levels: Support ~ 22850.3827 | Resistance ~ 29478.6320
- News sentiment: Neutral (avg 0.000; Neutral 100%)
- Confirmation / invalidation: A break above 29478.6320 with volume supports continuation; a close below 22850.3827 increases deterioration risk.
What KGNAI Measures
KGNAI evaluates assets using large cross-sectional datasets built from millions of structured data points. Inputs incorporate fundamental metrics, technical structures, and systematically processed news sentiment. Statistical models, machine learning, and AI frameworks are used to assess relative positioning, signal alignment, and probabilistic behavior across broad universes.
How to Read This Report
- Ranks are comparative across the tracked universe, not absolute price targets.
- Confluence reflects alignment among independent signal groups.
- Support/resistance levels are probabilistic decision zones, not guarantees.
- Sentiment provides contextual bias within the broader analytical framework.
1) KGNAI AI Analysis
Region: CRYPTO
Total universe size: 800 ranked instruments
- Daily rank: #430 out of 800 — Neutral
- Weekly rank: #665 out of 800 — Bearish
- Monthly rank: #619 out of 800 — Neutral
- 3-Monthly rank: #424 out of 800 — Neutral
The cross-sectional rank profile implies non-uniform strength across horizons. The daily position at #430 is broadly mid-pack, while the weekly reading at #665 pushes into the weaker tail of the 800-instrument universe. This spread between daily and weekly ranks often coincides with short-term stabilization attempts that have not yet translated into sustained relative leadership.
On longer windows, the monthly rank (#619) and 3-month rank (#424) return toward neutral territory, suggesting that weakness is more concentrated in the near-term peer comparison rather than uniformly negative across all regimes. That matters because rank deterioration limited to one horizon can reverse quickly if price action confirms, but it can also persist if the market remains range-bound and capital rotates elsewhere.
The stated term view consolidates this: Short-term is Bearish, while Mid-term and Long-term are Neutral. Read as a positioning map, this is less a directional call and more a statement that 42-USD currently lacks consistent advantage across the full stack of KGNAI tests. In that environment, the most reliable decision points typically come from confirmation at well-defined levels (see support/resistance) and from whether technical breadth (the 18-signal mix) can overcome the weaker weekly rank.
KGNAI ranks each instrument across large universes using multiple proprietary AI tests and statistical models (millions of data points). Lower ranks generally indicate stronger probability of favorable performance behavior, while higher ranks indicate weaker probability and more bearish positioning.
Term view: Short-term: Bearish. Mid-term: Neutral. Long-term: Neutral.
Want the full universe and complete rank tables? Unlock full access on KGNAI: https://www.kgnai.com/pricing
2) Price & trend overview
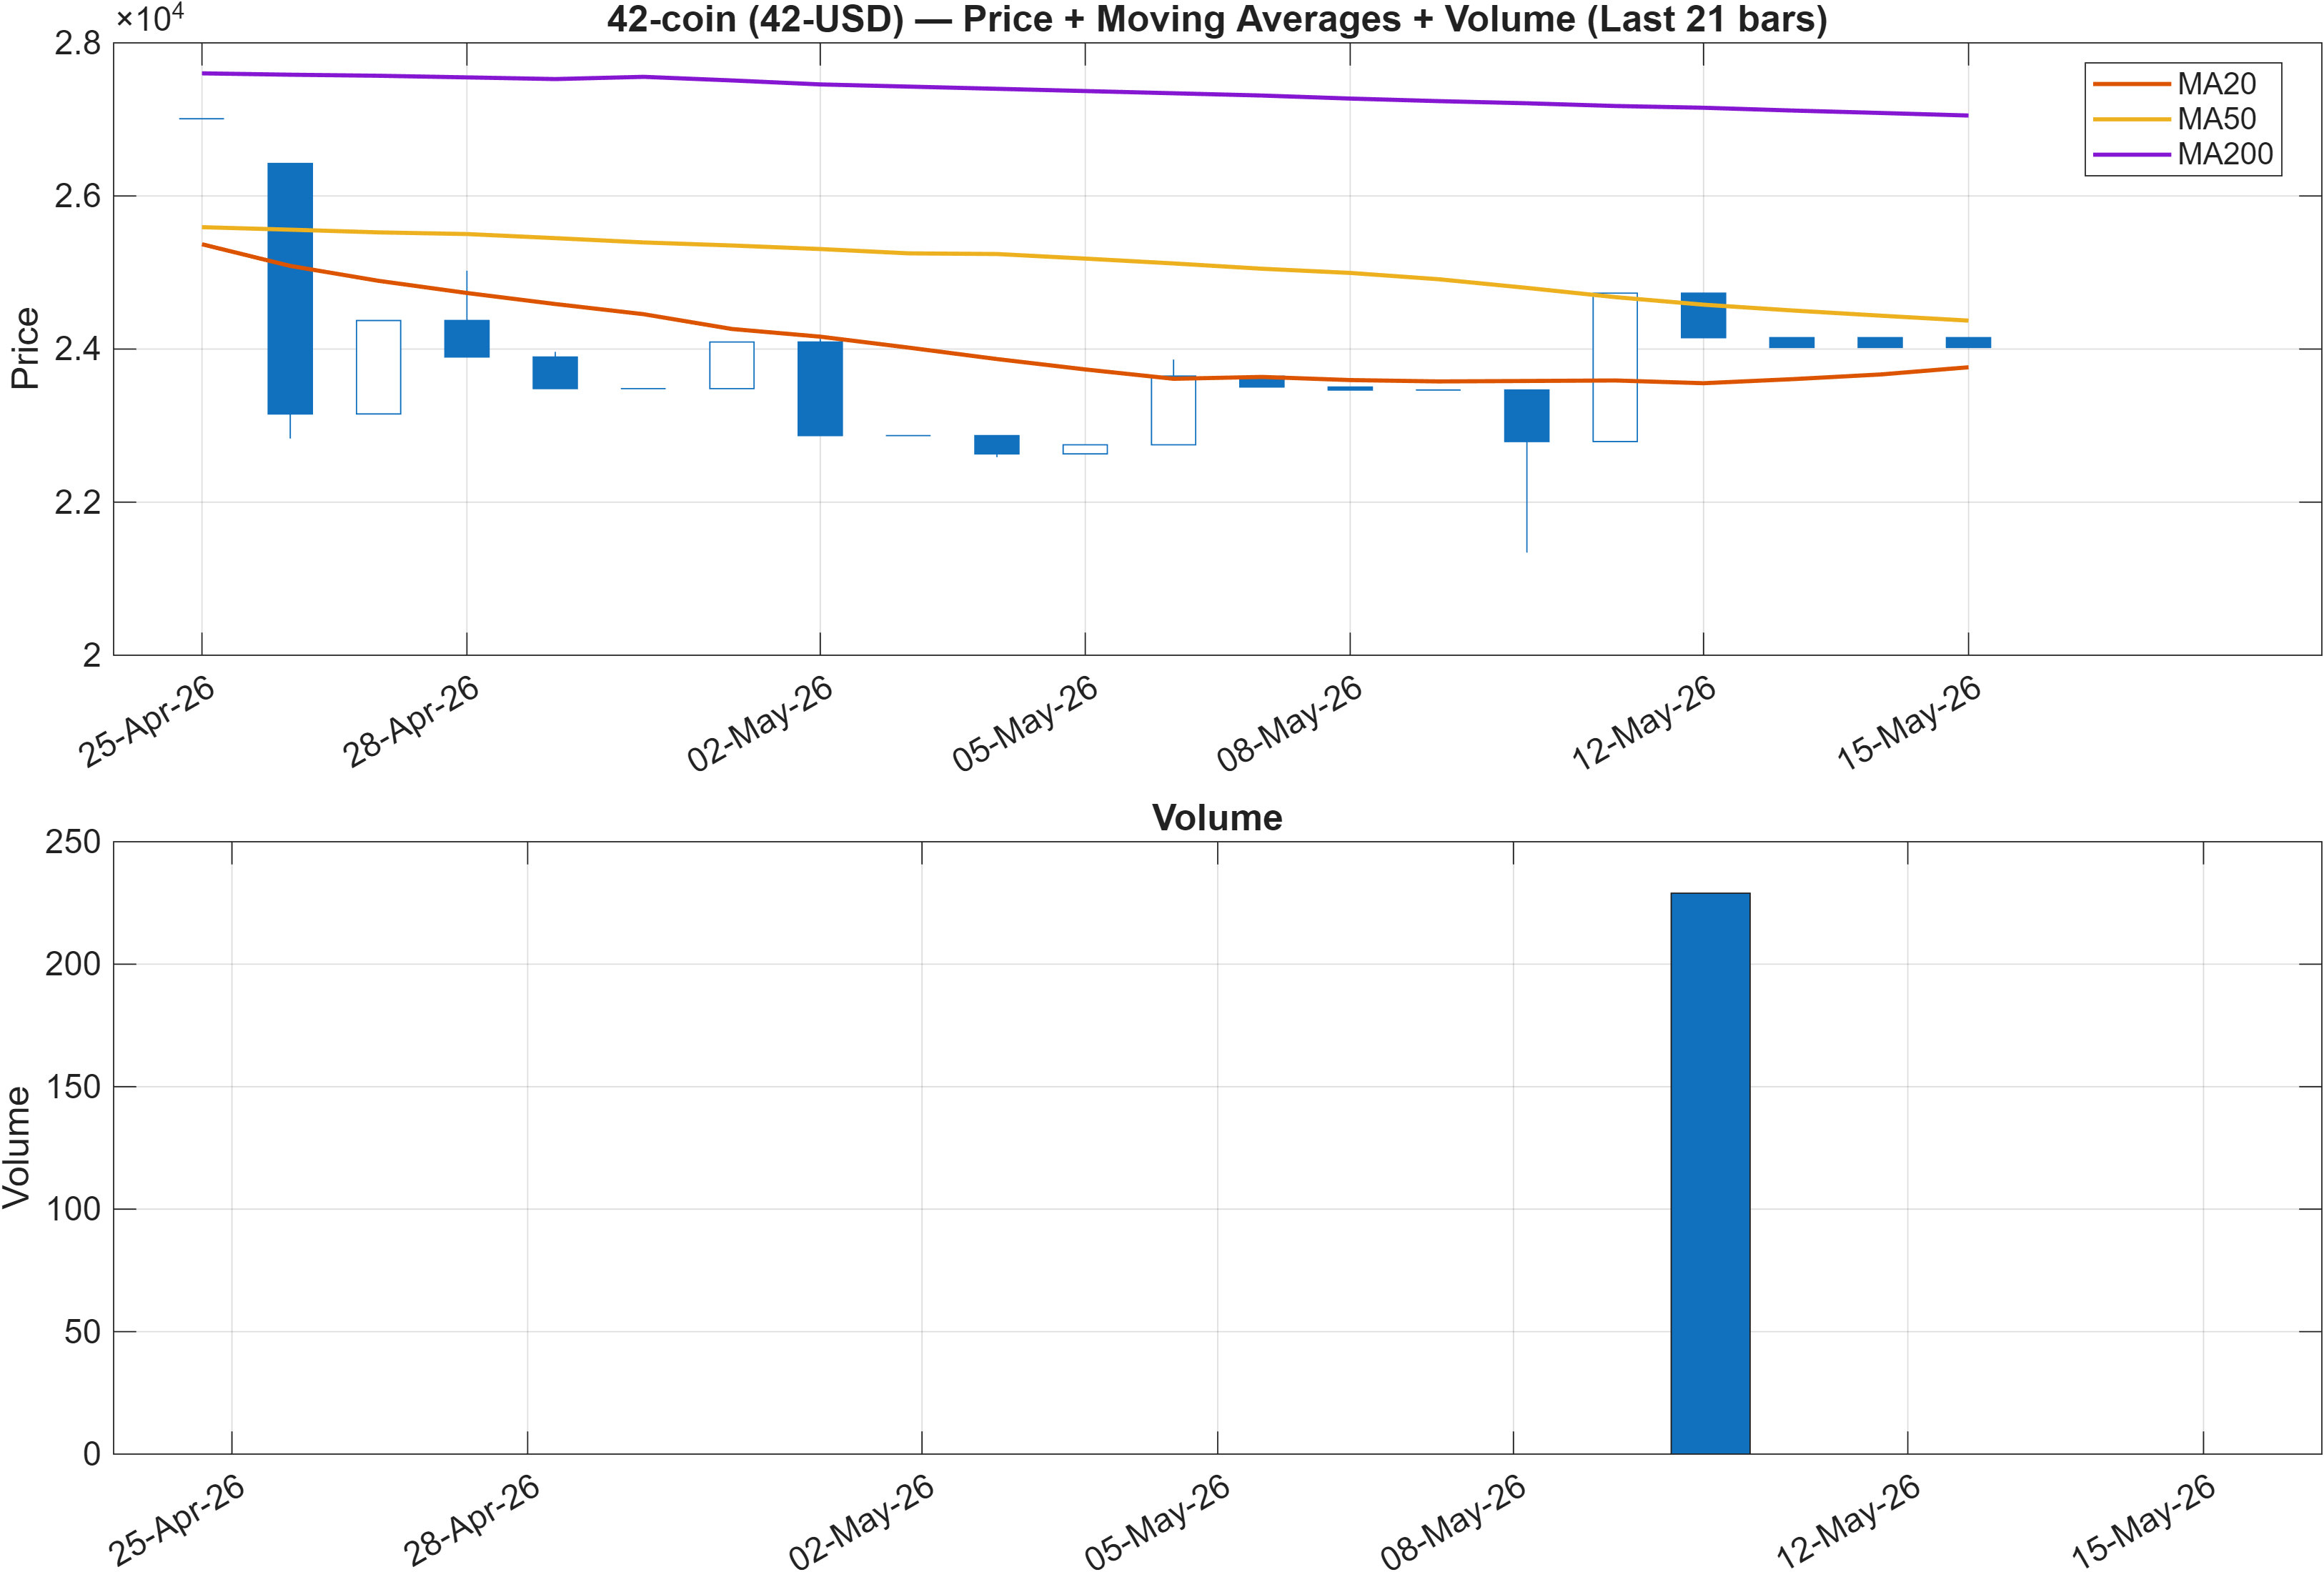
Interpretation: Close vs MA50 = Bullish, MA50 vs MA200 = Bearish.
Trend alignment vs. regime friction
The moving-average read is explicitly split: price relative to MA50 is Bullish, while MA50 relative to MA200 is Bearish. This configuration is common in transition phases—either a developing recovery within a longer-term down/flat regime, or a late-stage bounce that has not altered the broader structure. The practical implication is that trend signals may conflict depending on time horizon, which matches the rank stack where weekly (#665) remains notably weaker than daily (#430) and 3-month (#424).
In such mixed regimes, follow-through often becomes a function of whether participation confirms the move. While this section does not provide explicit volume metrics beyond the figure, the report’s framework emphasizes that volume-based indicators help assess participation-backed movement. That emphasis becomes more relevant when fast trend proxies (MA50) improve before slow trend proxies (MA200) do—because early-stage reversals tend to fail without consistent engagement.
The second-order check is whether technical breadth supports the direction of the near-term trend proxy. The broader dashboard later shows a Bullish confluence (0.333) but a Neutral blended score (0.269), reinforcing the idea that trend improvement exists but remains incomplete. When a market sits in this “improving but not confirmed” state, the most robust read typically comes from level interaction: holding above support while repeatedly testing resistance tends to firm up the structure; failure back through support tends to revalidate the longer-term bearish MA relationship.
For readers mapping risk, the trend message is not “up” or “down” as much as “conditional.” With the long/slow trend still lagging, confirmations should be treated as stronger only when they align with the key zones and with improving participation signals shown elsewhere in the dashboard.
3) Momentum & volatility dashboard
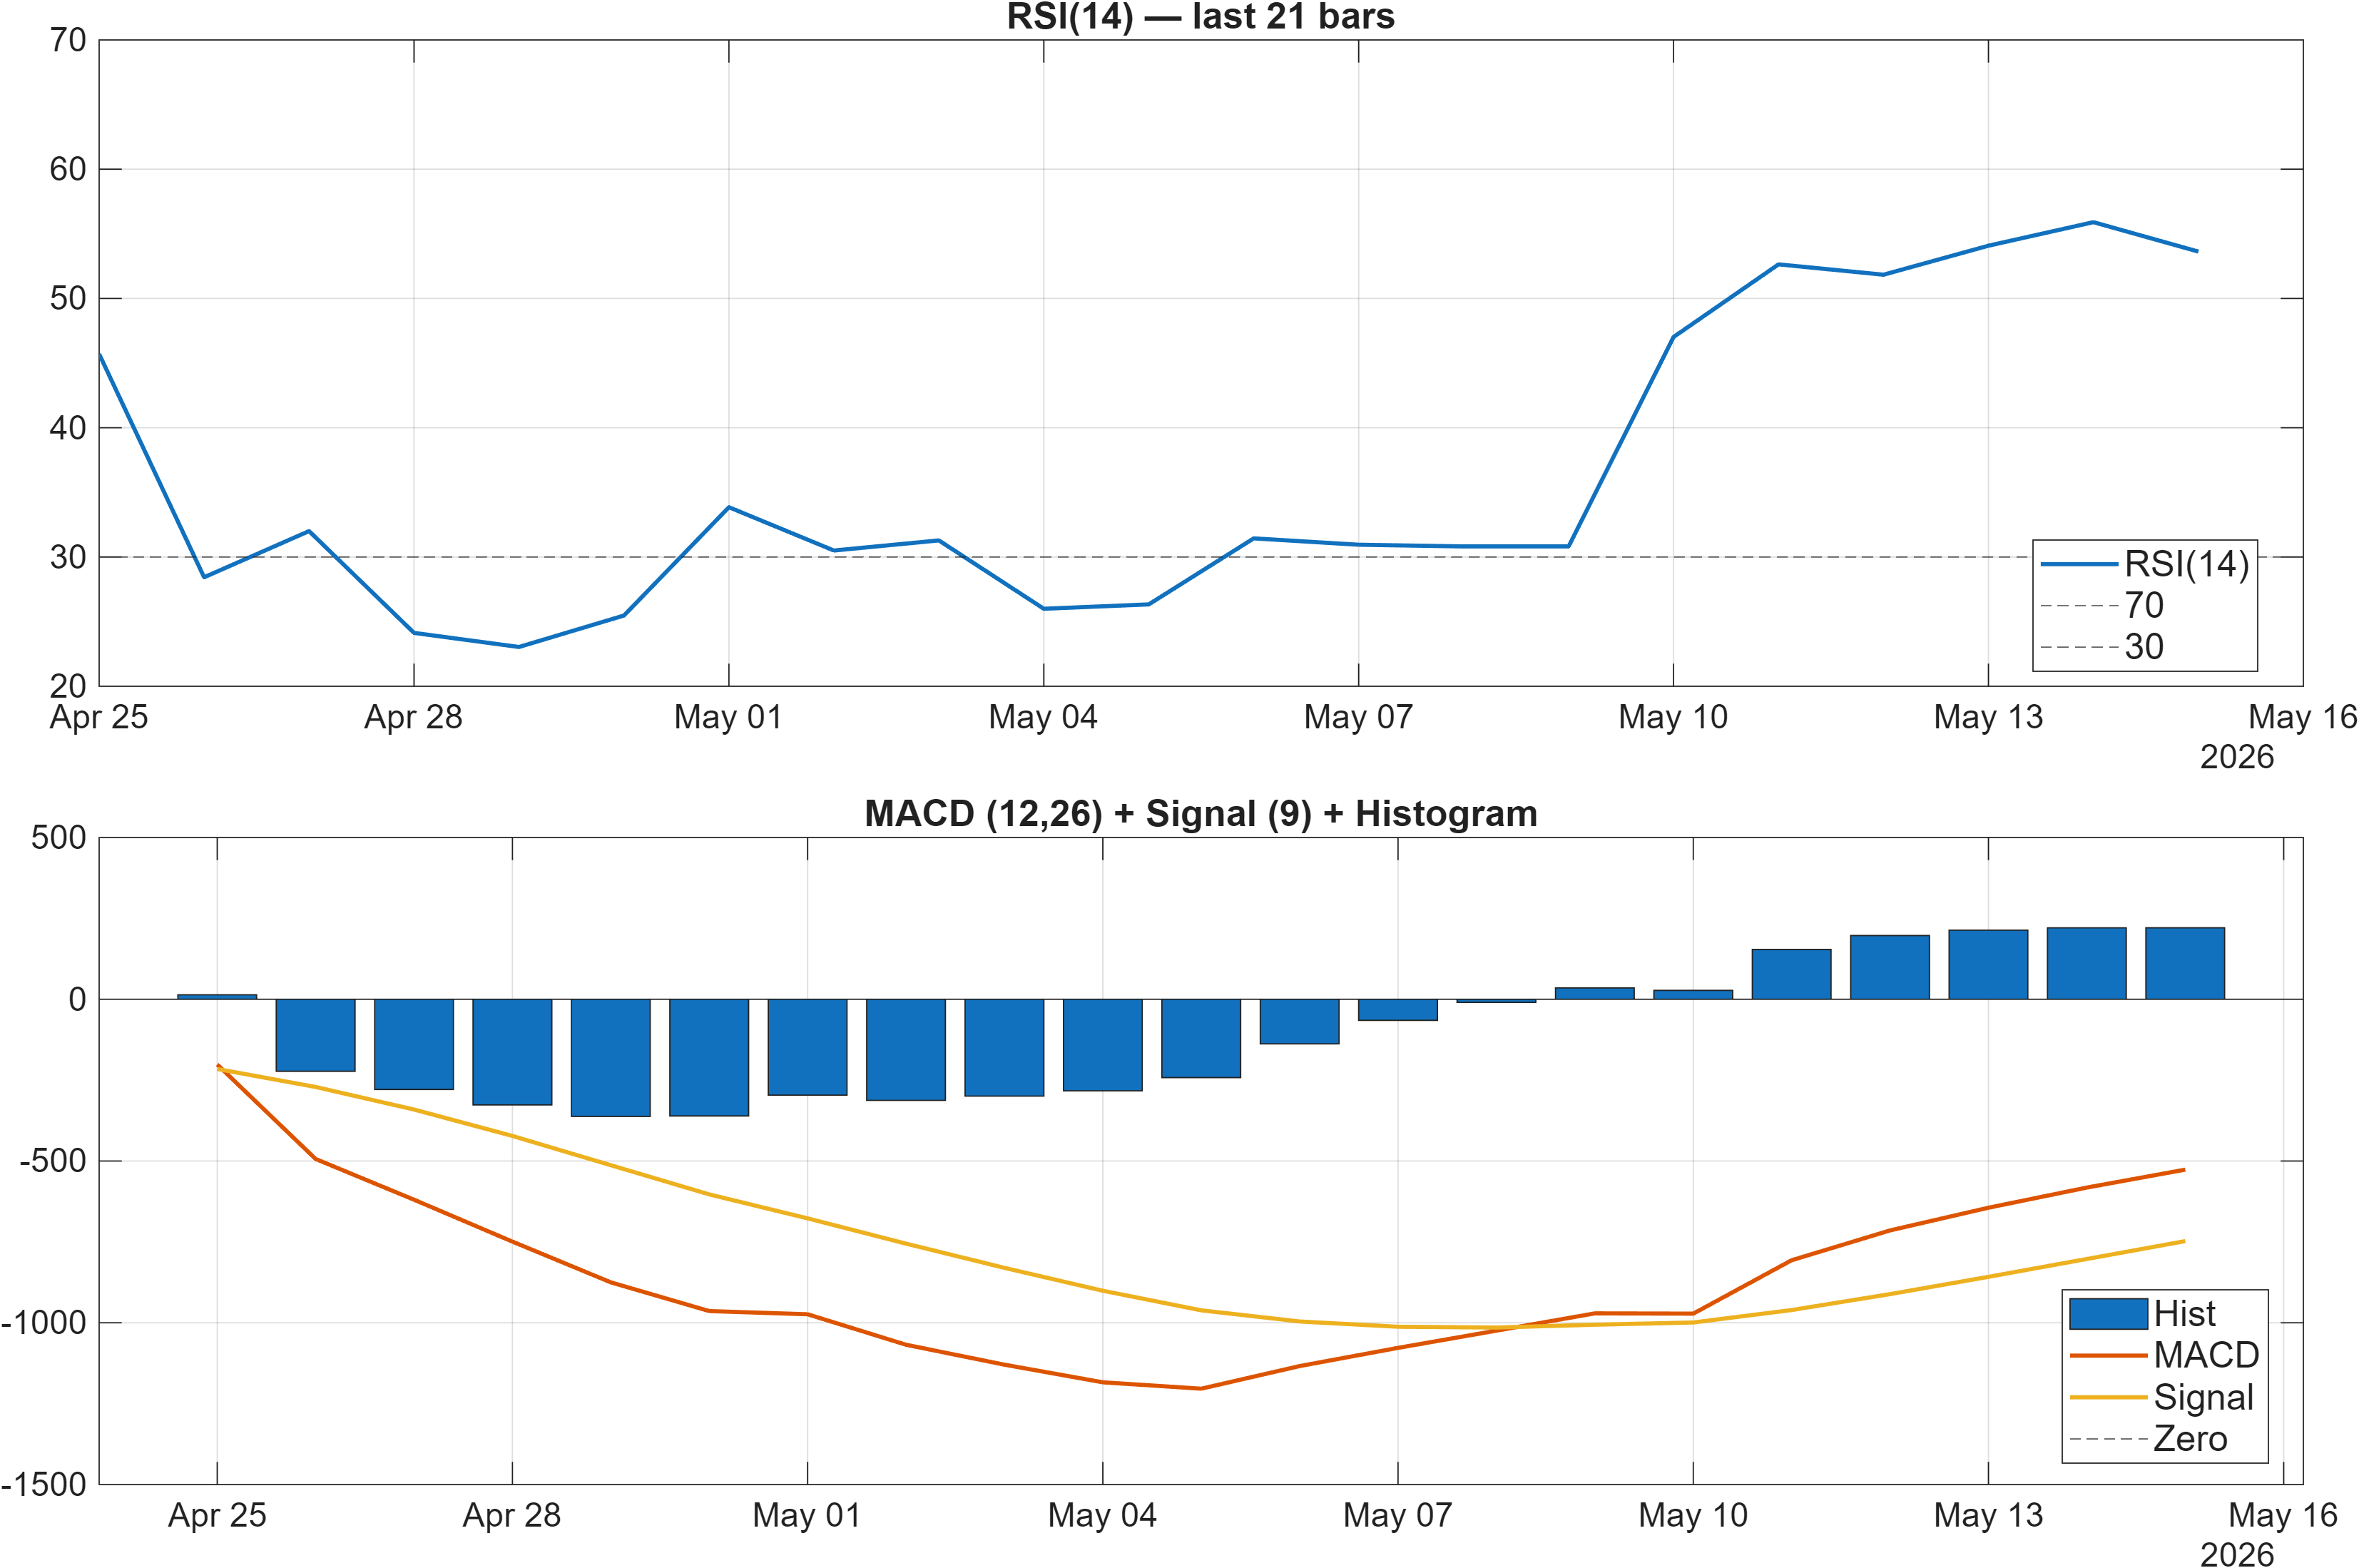
Interpretation: RSI bias = Neutral, MACD hist = 220.9580.
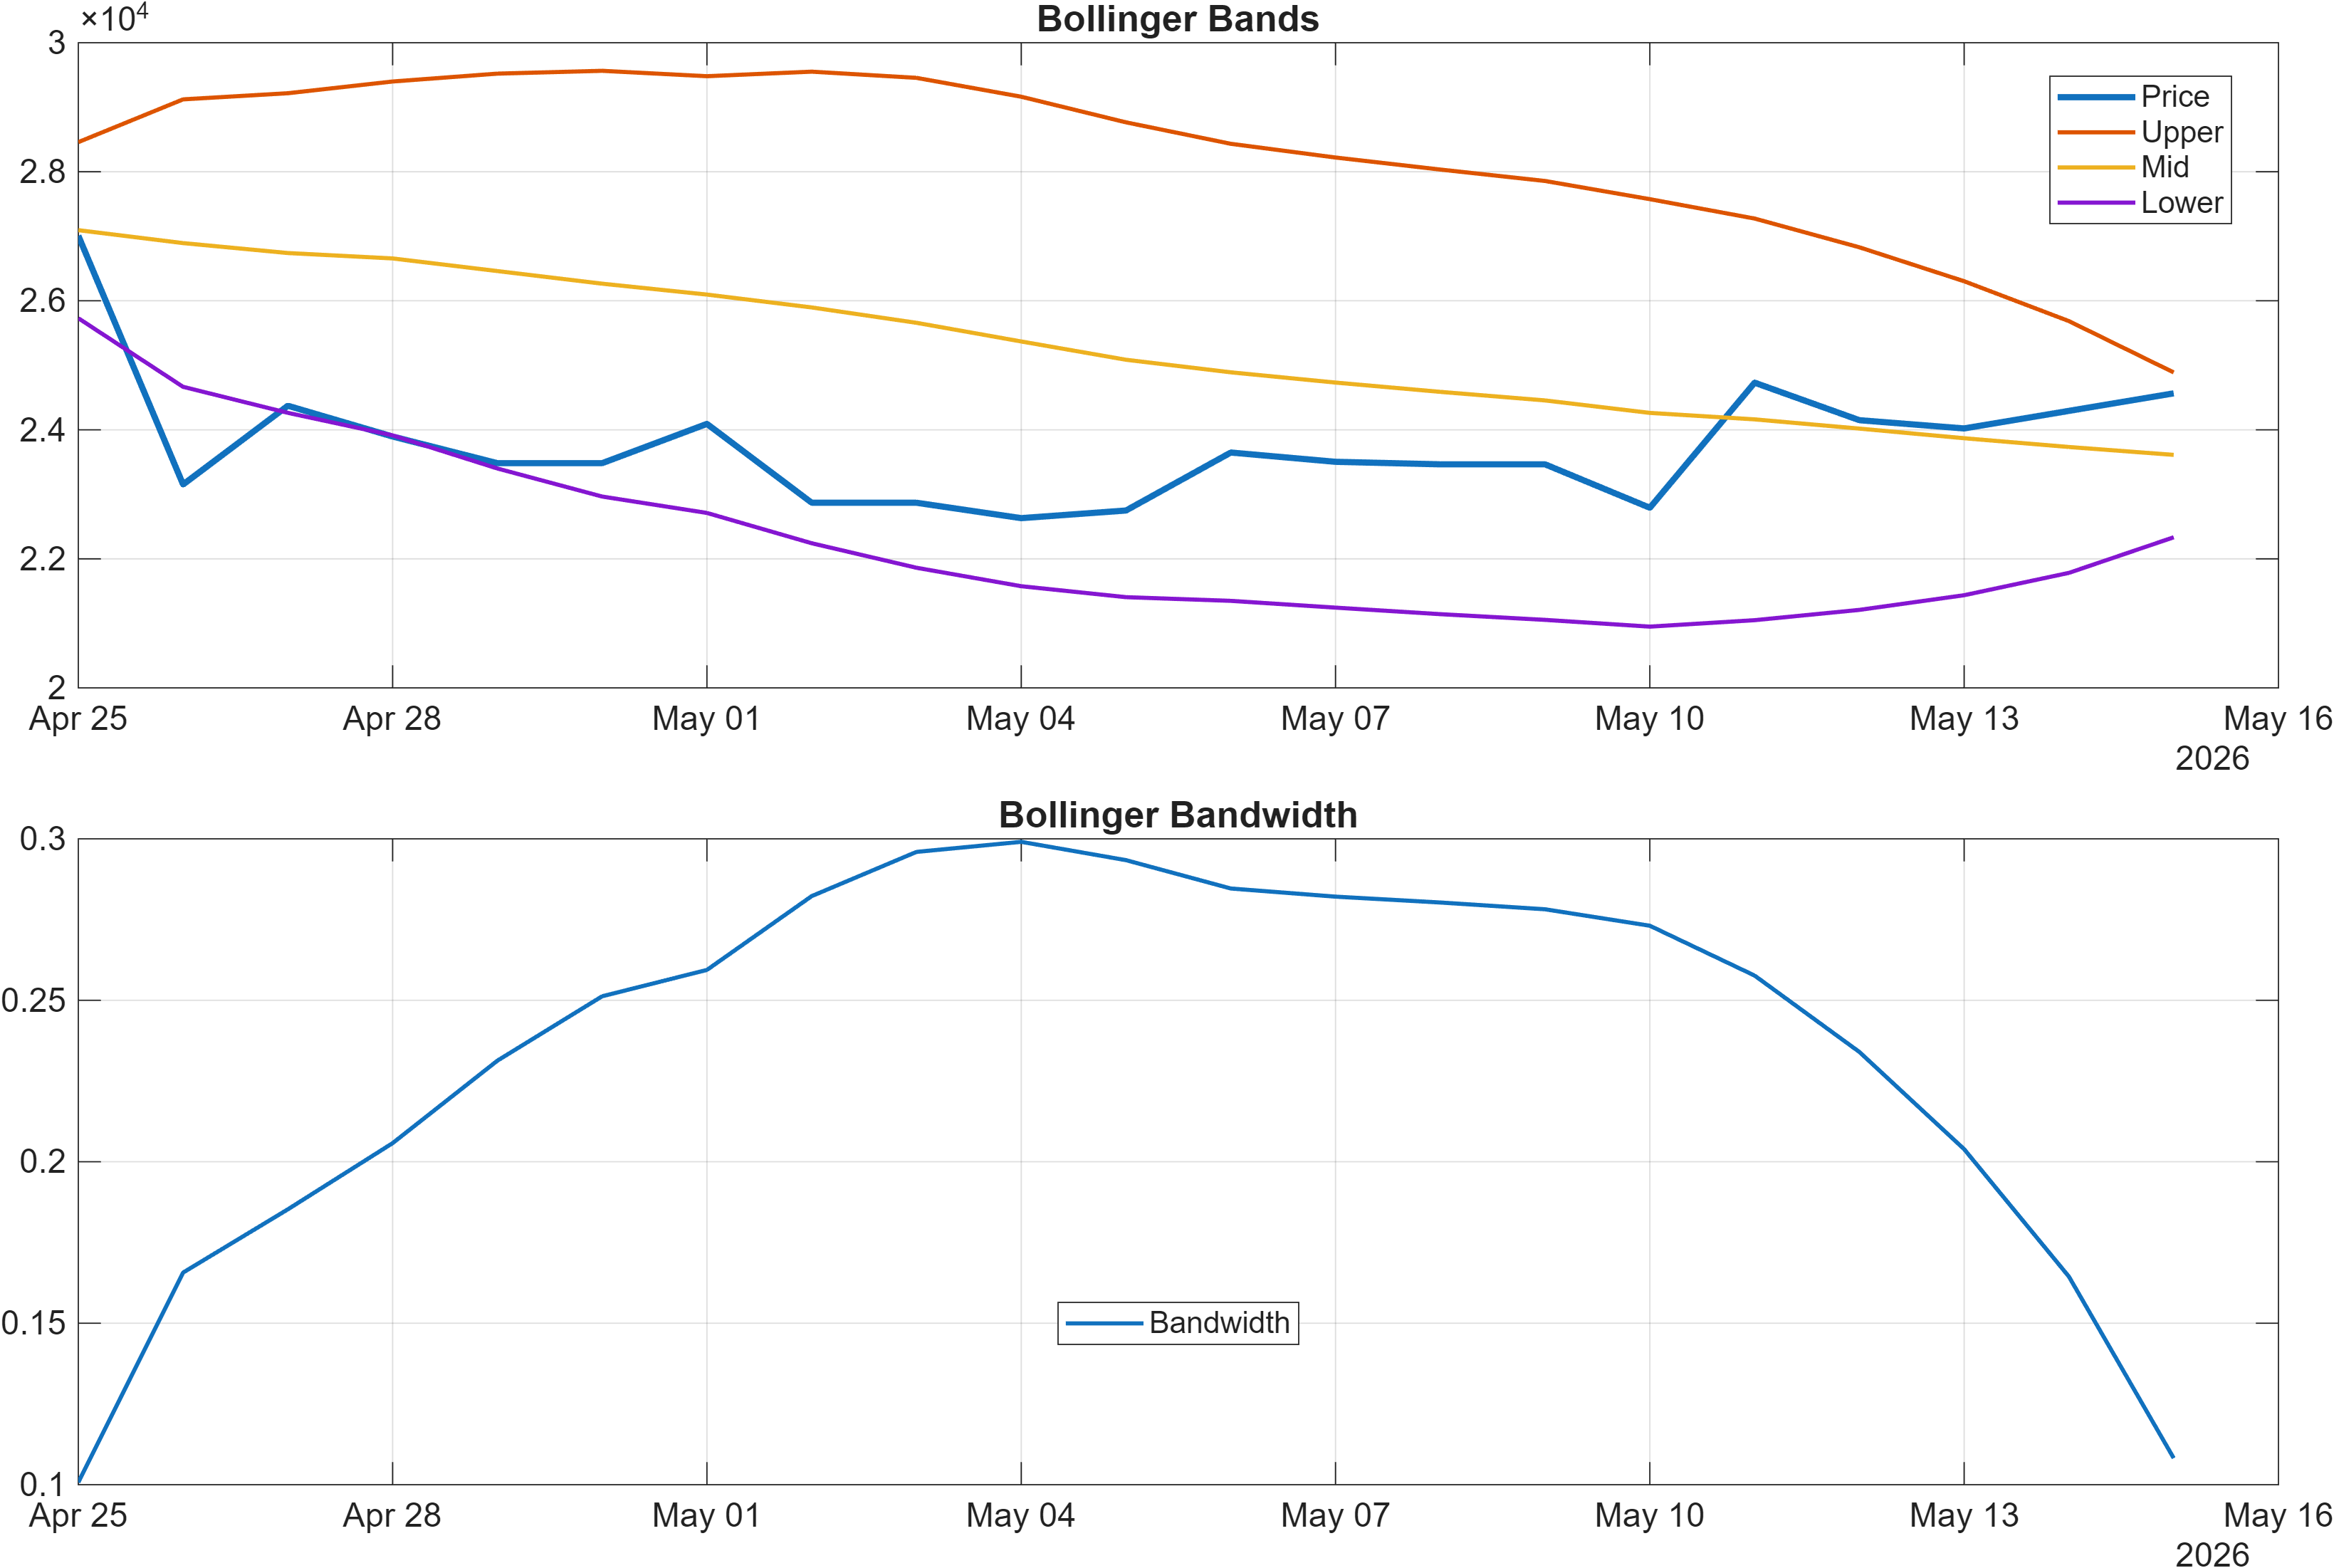
Interpretation: Bandwidth (volatility regime) latest = 0.1082.
Momentum: mild positive impulse without overextension
Momentum diagnostics sit in a relatively balanced zone. The report flags RSI bias as Neutral, with the signal table specifying RSI(14) at 53.63, consistent with an asset that is not stretched but also not depressed. At the same time, the MACD histogram at 220.9580 (and 221 in the signal table) reads as constructive, implying that positive momentum exists even if it is not sufficiently dominant to move the higher-level regime signals decisively.
The internal momentum stack in the 18-signal set reinforces that the impulse is present but not universally confirmed: ROC(20) is 6.103 (Bullish), and time-series measures show TS Mom(20) 868.7 and TS Accel 5170 as bullish. Yet the stochastic channel remains Neutral with Stoch %K 79.07, which can be read as elevated but not explicitly flagged as overbought by the system—another indication of “positive, but not decisive.”
Volatility: contained regime that can amplify level breaks
Volatility conditions appear comparatively contained, with Bollinger Bandwidth at 0.1082 labeled neutral. In compressed-to-moderate volatility regimes, price often spends more time respecting nearby support/resistance, but when it does break, the move can be sharper due to positioning and stop placement. That links this section directly to the level framework: momentum is not flashing exhaustion, so the next informational update likely comes from whether volatility expands alongside a test of 29478.6320 or a breakdown toward 22850.3827.
4) Support / Resistance zones
Support ~ 22850.3827 | Resistance ~ 29478.6320
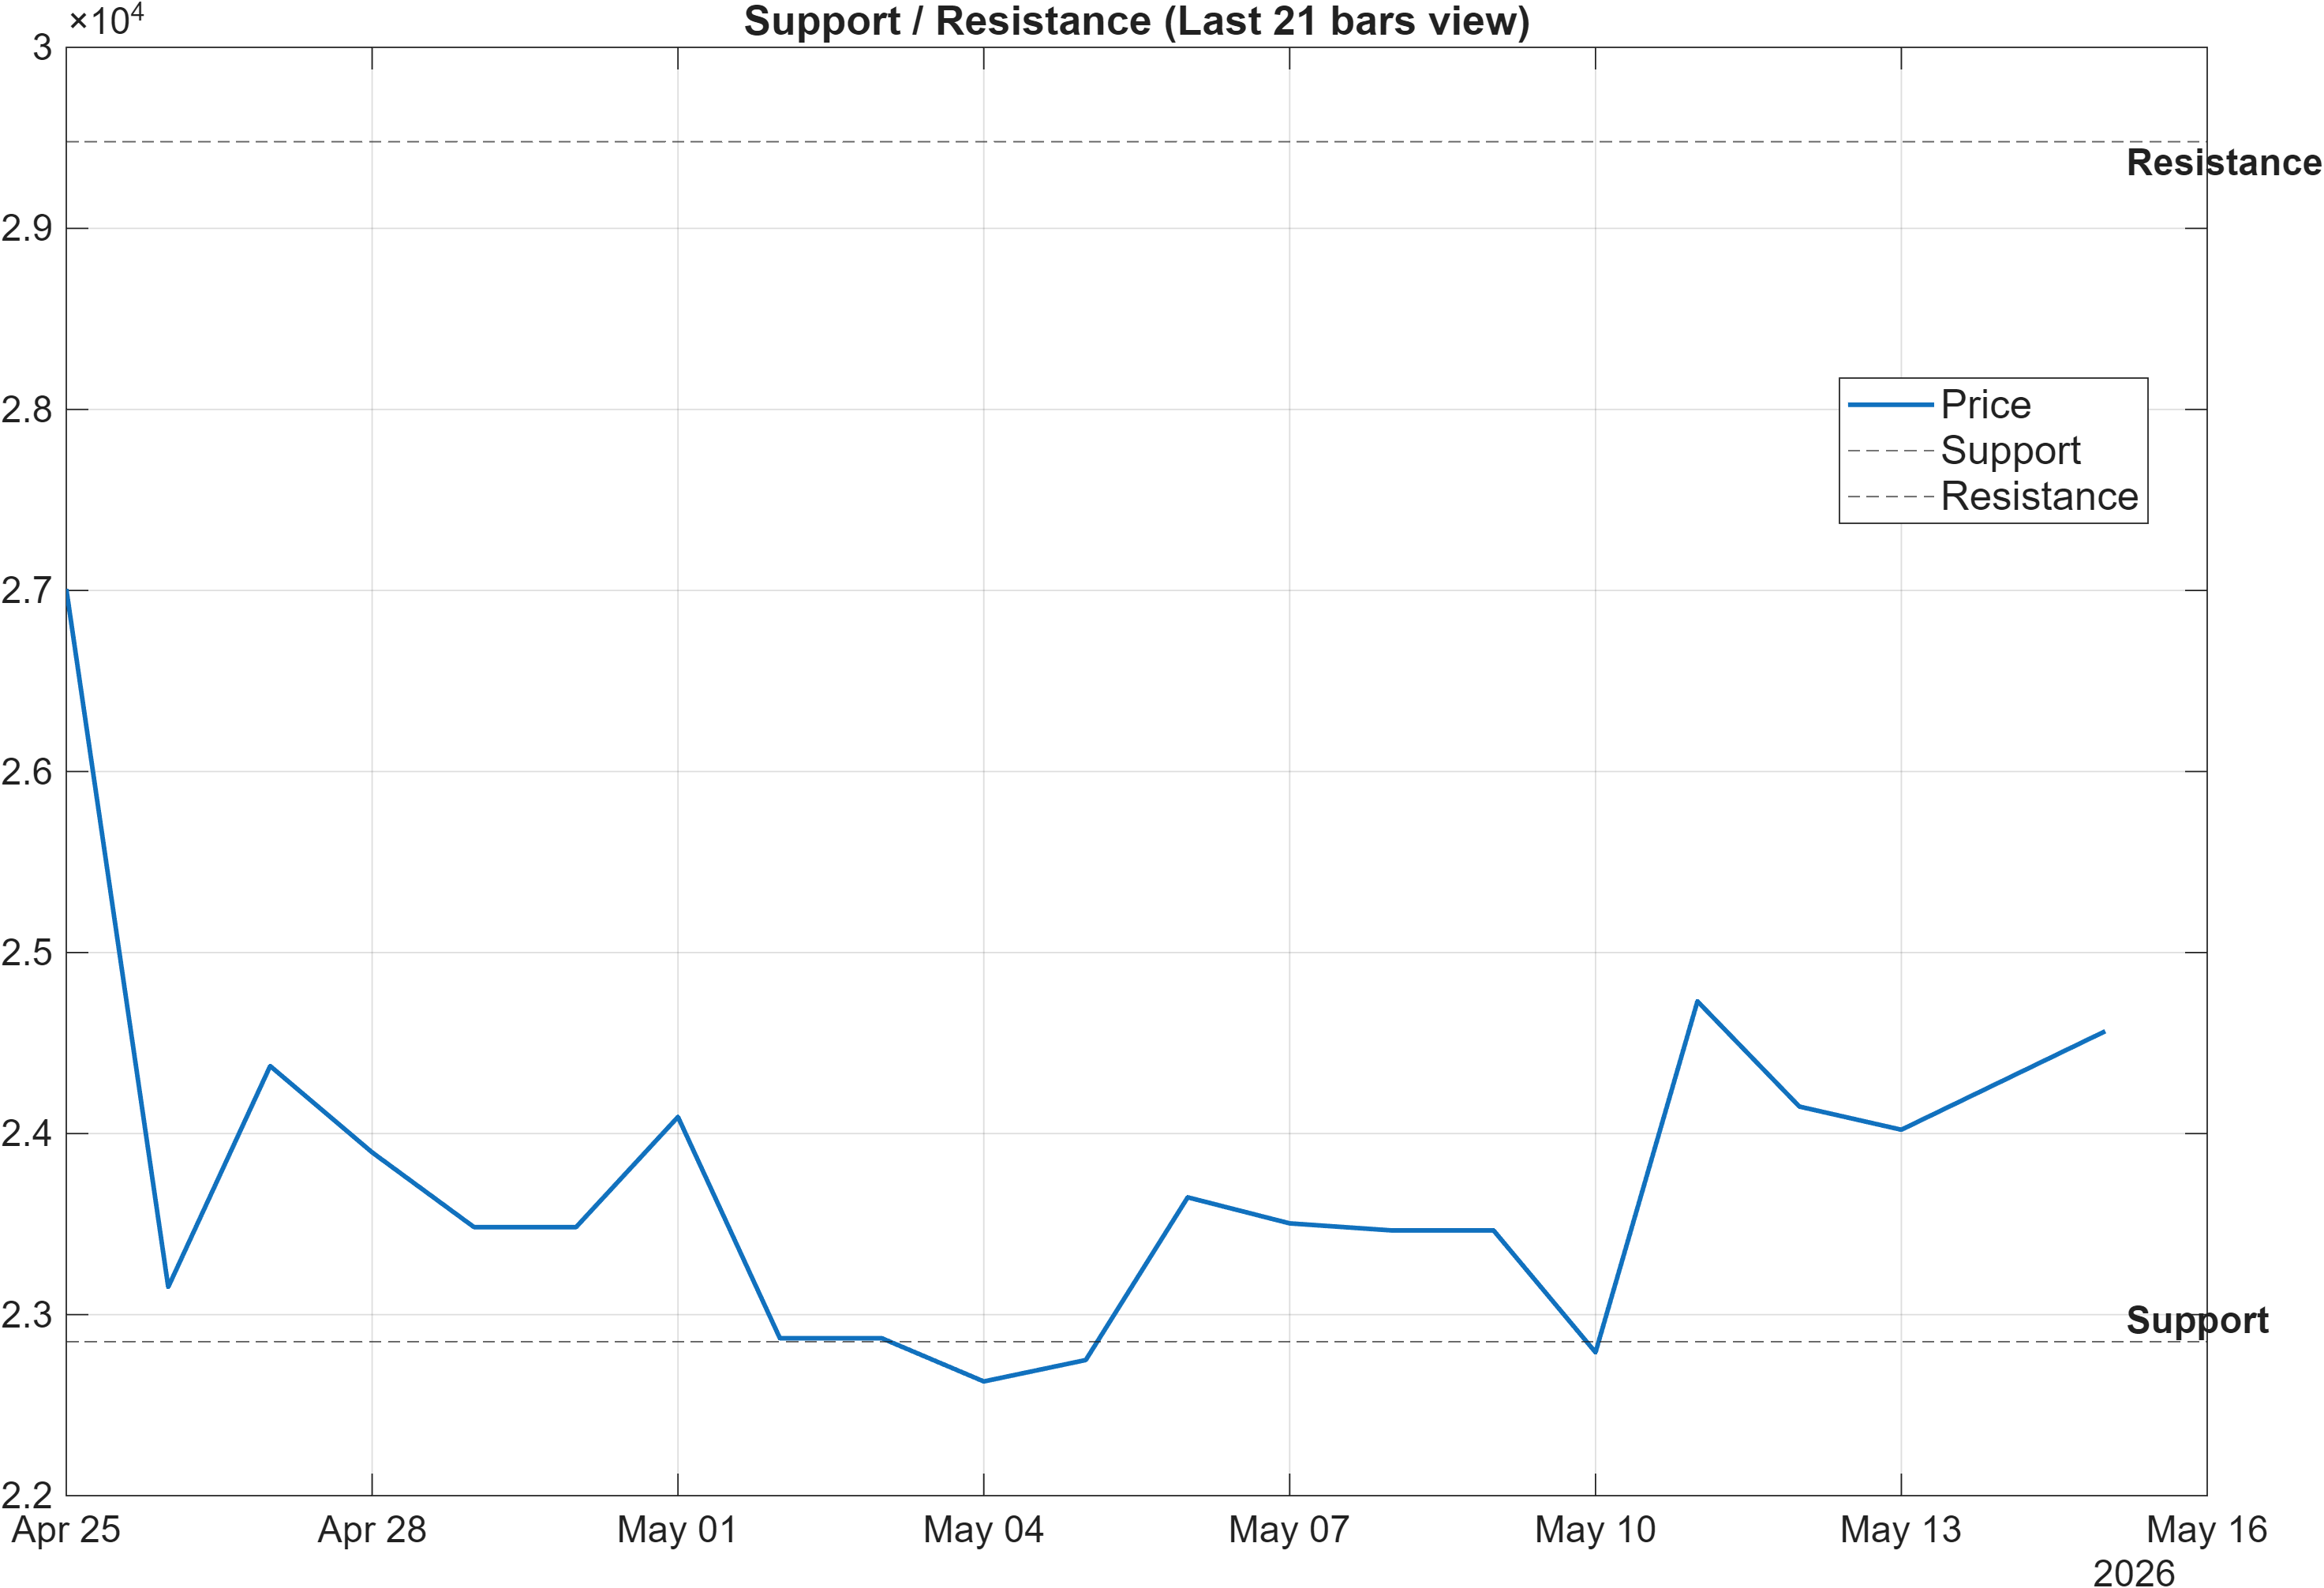
Scenario view: Break above resistance with volume → continuation. Close below support → signal deterioration risk.
Decision zones: validating trend repair vs. rejecting it
The level map is clean and wide: support ~22850.3827 defines the primary invalidation zone, while resistance ~29478.6320 defines the confirmation ceiling. Given the mixed regime in the moving-average stack (Bullish close vs MA50, Bearish MA50 vs MA200), these levels become more informative than a single trend label: holding above support supports the interpretation that the bullish elements are building; a close below support would align with the weaker weekly rank (#665) and reassert relative fragility.
The momentum/volatility context matters for how these zones are treated. With RSI(14) 53.63 neutral and BB Width 0.1082 neutral, the market is not signaling an obvious “exhaustion” setup into resistance, nor an obvious “capitulation” into support. Instead, it suggests that price may need a catalyst in participation (volume confirmation) to convert a resistance break into persistence—consistent with the report’s scenario note: break above resistance with volume → continuation.
The technical dashboard also hints at where failure risk can show up first. Despite multiple bullish momentum/acceleration signals, the participation proxies are not uniformly supportive: OBV slope(10) -229 and PVT slope(10) -6.571 are bearish. If resistance is approached on fading participation, the probability of rejection typically rises; if resistance is approached with improving breadth and participation, the level can flip from ceiling to support. In this framework, the zones are less about predicting direction and more about structuring conditional outcomes around 22850.3827 and 29478.6320.
5) Quant Technical Dashboard (18 Signals)
KGNAI AI Technical Analysis Score (Deep Reinforcement Learning): Rank #352 out of 800 (Rank 1 represents the strongest technical positioning and a higher probability of favorable price behavior. As ranks increase toward the maximum, the probability of favorable outcomes weakens and bearish positioning becomes more dominant.) | Label: Neutral | Score: 0.120
18-Signal Technical Confluence Score: 0.333 (Bullish)
Overall Technical Score (18-signal confluence + DRL rank blend): 0.269 (Neutral)
Note: The blended score reflects signal strength weighted against broader AI technical ranking, which may temporarily diverge.
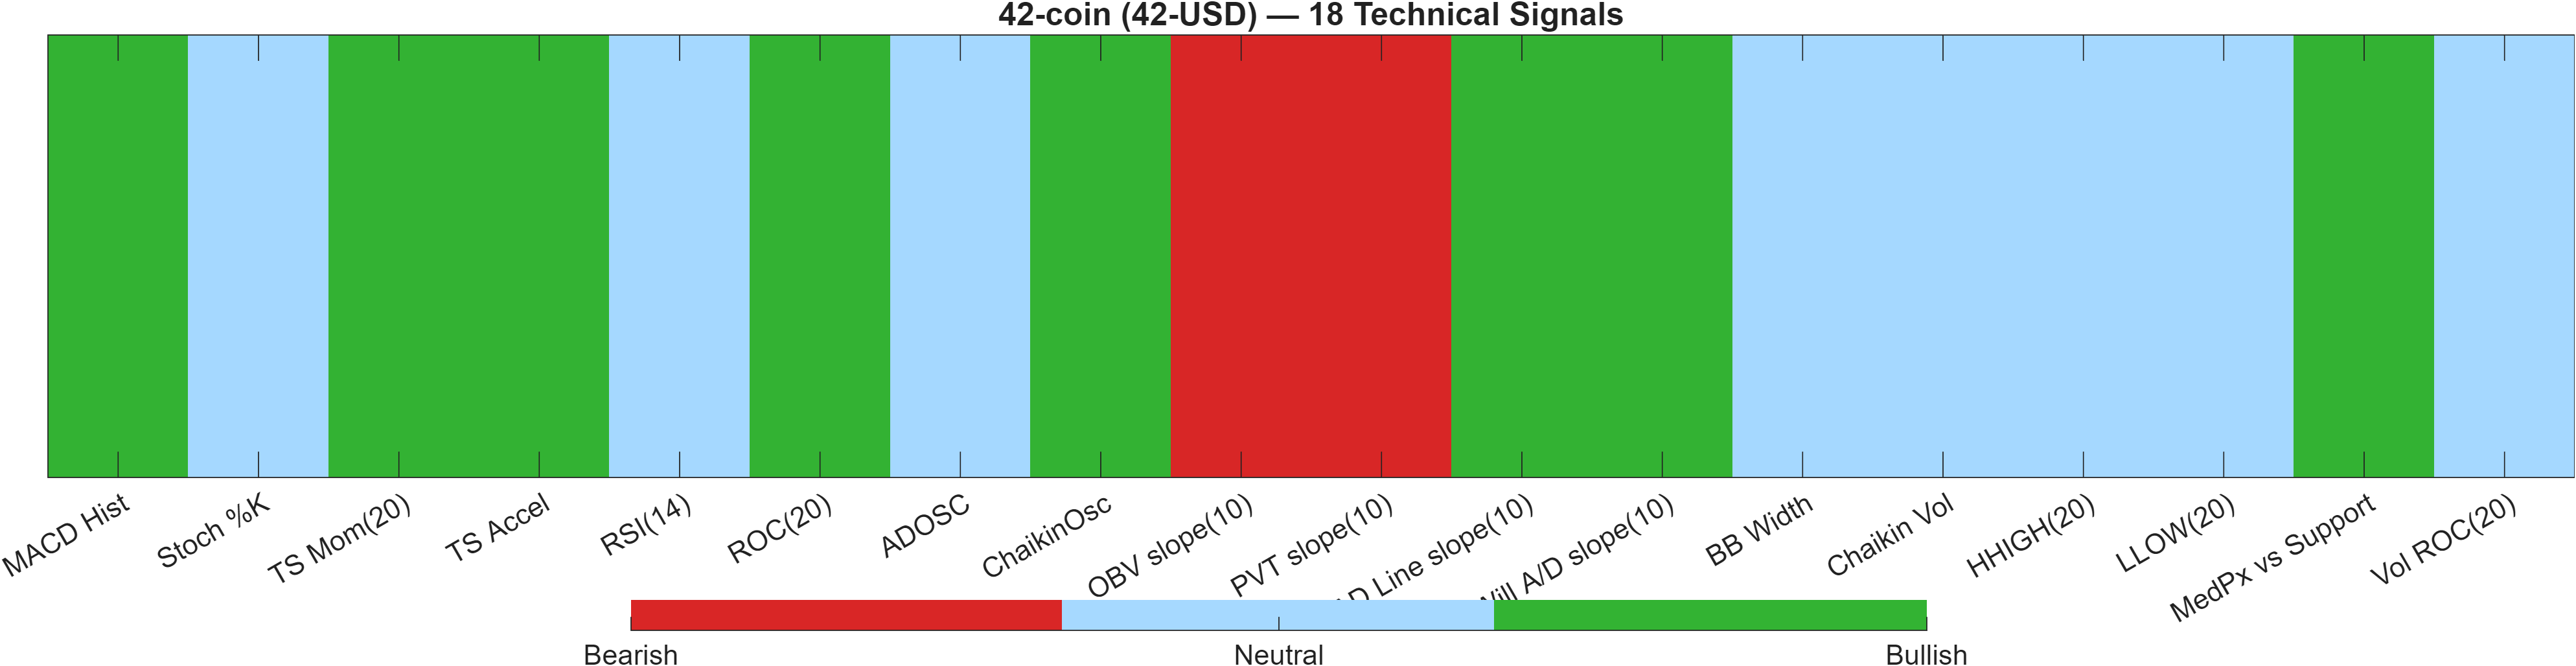
Blended technical score breakdown: 0.269 (Neutral | Bull 8 / Bear 2 / Neutral 8)
Confluence vs. model overlay: why “Bullish” can still blend to Neutral
The dashboard highlights a useful tension: the 18-signal confluence score is 0.333 (Bullish), yet the overall technical score is 0.269 (Neutral) once blended with the Deep Reinforcement Learning (DRL) model output. The DRL layer itself is ranked #352 out of 800 with a Neutral label and a score of 0.120. This is a classic “breadth improving, regime not fully endorsed” configuration, where indicator-level alignment exists but the broader pattern-recognition layer is not confirming a strong technical edge relative to the universe.
The breakdown (Bull 8 / Bear 2 / Neutral 8) explains the neutrality: bullish signals are present, but they are counterbalanced by a large neutral set, implying incomplete agreement rather than a one-sided trend. Where the signals do lean bullish, they cluster in momentum and acceleration: MACD histogram is Bullish (value 221), ROC(20) 6.103 is bullish, and time-series dynamics (TS Accel 5170) are bullish. That cluster supports the interpretation of positive impulse without decisive trend resolution.
The bearish signals are concentrated in participation-linked measures: OBV slope(10) -229 and PVT slope(10) -6.571 are both bearish. This creates a measurable divergence—price/momentum improvement without matching confirmation from these participation slopes. Meanwhile, volatility is not signaling a breakout regime (BB Width 0.1082 neutral), which can keep signals in a “grinding” state until a level is decisively taken.
Signal table (Bull/Bear/Neutral)
| Indicator | Value | Signal |
|---|---|---|
| MACD Hist | 221 | Bullish |
| Stoch %K | 79.07 | Neutral |
| TS Mom(20) | 868.7 | Bullish |
| TS Accel | 5170 | Bullish |
| RSI(14) | 53.63 | Neutral |
| ROC(20) | 6.103 | Bullish |
| ADOSC | 0 | Neutral |
| ChaikinOsc | 23.79 | Bullish |
| OBV slope(10) | -229 | Bearish |
| PVT slope(10) | -6.571 | Bearish |
| AD Line slope(10) | 83.83 | Bullish |
| Will A/D slope(10) | 1272 | Bullish |
| BB Width | 0.1082 | Neutral |
| Chaikin Vol | -16.92 | Neutral |
| HHIGH(20) | 2.642e+04 | Neutral |
| LLOW(20) | 2.134e+04 | Neutral |
| MedPx vs Support | 1235 | Bullish |
| Vol ROC(20) | — | Neutral |
Interpretation: Indicator-level signals form the base confluence, which is then adjusted using a separate AI-driven technical ranking model. The final technical score summarizes this combined view.
6) News sentiment + extractive gist
Sentiment score (avg): 0.000 | Positive: 0% | Neutral: 100% | Negative: 0%
KGNAI AI News Sentiment Score (normalized -1 to +1): Not available (as of —) | Label: Not available | Overall news score: 0.00
Positive Developments
Recent coverage across major financial outlets contains some constructive narrative fragments, but they do not concentrate tightly on 42-coin itself. The tone is largely framed around broader crypto-adjacent themes and cross-market developments, which can still matter indirectly when liquidity and risk appetite shift across digital assets. Within KGNAI’s scoring, this shows up as no positive skew in the extracted distribution (Positive 0%) even though some individual items carry an upbeat phrasing. From an analytical standpoint, the main “positive” takeaway is the absence of clearly adverse, asset-specific headlines in the provided stream, leaving technical structure and cross-sectional ranks (e.g., daily #430 vs weekly #665) to carry most of the decision weight. Where constructive coverage does appear, it tends to read as contextual rather than catalytic, which is consistent with the current Neutral blended technical posture (0.269).
Neutral / Mixed Developments
The news feed in the provided data is dominated by neutral classification, reflected directly in the distribution (Neutral 100%) and an average sentiment score of 0.000. This suggests that, at present, sentiment is unlikely to act as a differentiator for 42-USD versus peer assets. Neutral sentiment environments typically place greater emphasis on market structure signals—such as whether momentum (e.g., RSI(14) 53.63) can translate into a break of the primary ceiling at 29478.6320, or whether price drifts back toward 22850.3827. With the normalized news score not available, the report should be read as primarily technical and cross-sectional in nature for this date.
Negative / Risk Signals
No explicit negative skew is captured in the provided sentiment summary (Negative 0%), but risk is still present in the form of information scarcity and weak differentiation. When the news layer is effectively flat, markets can reprice quickly based on technical triggers, especially near well-defined zones. Here, the most relevant “risk signal” is the structural one: a mixed rank profile with a notably weak weekly rank (#665) alongside a more neutral daily rank (#430) can indicate fragile near-term sponsorship if price fails to confirm. In addition, participation-linked signals in the technical table (e.g., OBV slope(10) -229 and PVT slope(10) -6.571) highlight a potential vulnerability if volatility expands to the downside. In that sense, the primary risk channel is not sentiment-driven; it is level-driven—a close below 22850.3827 is the deterioration condition described in the scenario framework.
- What to monitor next: Price acceptance or rejection around 29478.6320, ideally with participation confirmation.
- What to monitor next: Whether BB Width 0.1082 transitions from neutral compression to expansion during a level test.
- What to monitor next: Any shift in the sentiment distribution away from Neutral 100% toward a directional skew.
Snapshot: AI Rank (Short–Mid–Long): Mixed (Bearish–Neutral–Neutral) · Technical Confluence: Bullish · Key Levels: Support ~22850.38 | Resistance ~29478.63 · News Sentiment: Neutral
Sources referenced: Reuters, Bloomberg, Yahoo Finance, MarketWatch, Investing.com
7) Sources
Not available in the provided data.
You may also like: How KGNAI AI ranks instruments across global markets
Disclaimer: KGNAI provides AI-generated analytics and educational market commentary only. This is not financial advice. Markets involve risk. Always do your own research.