
VENOM-USD (Venom) Technical & Rank Review — 13-May-2026 | Short-Term Bearish, Mid-Term Neutral
Venom (VENOM-USD) currently sits in the lower tier of KGNAI’s cross-sectional crypto universe on short horizons, while the mid-to-long view is closer to neutral. Daily and weekly ranks remain elevated (#674 and #670 out of 800), signaling comparatively weaker technical positioning versus peers, even as the monthly rank improves modestly to #615. Price structure also remains heavy: the close is below the MA50 and the MA50 is below the MA200, a configuration typically associated with downtrend persistence. At the same time, momentum gauges are not deeply stretched—RSI(14) at 47.95 reads neutral and MACD histogram at 0.0001706 is slightly positive—suggesting the bearish backdrop is not being reinforced by strong downside acceleration. With Bollinger bandwidth at 0.0596, volatility appears contained, increasing the importance of confirmation around key levels: support ~0.0187 and resistance ~0.0310.
- Rank stance: Short-term Bearish | Mid-term Neutral | Long-term Neutral
- Technical confluence: 18-signal confluence -0.167 (Neutral); blended overall -0.374 (Bearish)
- Key levels: Support 0.0187 | Resistance 0.0310
- News sentiment bias: Neutral overall (avg 0.042; Neutral 81%)
- Confirmation / invalidation: Sustained strength is more credible on a break above 0.0310 with volume; deterioration risk increases on a close below 0.0187.
KGNAI evaluates assets using large cross-sectional datasets built from millions of structured data points. Inputs incorporate fundamental metrics, technical structures, and systematically processed news sentiment. Statistical models, machine learning, and AI frameworks are used to assess relative positioning, signal alignment, and probabilistic behavior across broad universes.
- Ranks are comparative across the tracked universe, not absolute price targets.
- Confluence reflects alignment among independent signal groups.
- Support/resistance levels are probabilistic decision zones, not guarantees.
- Sentiment provides contextual bias within the broader analytical framework.
1) KGNAI AI Analysis
- Daily rank: #674 out of 800 — Bearish
- Weekly rank: #670 out of 800 — Bearish
- Monthly rank: #615 out of 800 — Neutral
- 3-Monthly rank: Not available for this horizon — Not available
Cross-sectional positioning: weak short horizon, stabilizing mid horizon
The rank profile places VENOM-USD in the lower decile of the tracked universe on both the daily and weekly windows (#674 and #670 of 800), indicating comparatively weaker recent behavior versus peers. That weakness is not fully echoed in the monthly reading: the monthly rank improves to #615 and is labeled Neutral, which often aligns with a market that is losing downside momentum without yet establishing a durable uptrend.
This “short-term bearish / mid-term neutral” split increases the value of confirmation signals. In practice, the setup is less about forecasting direction and more about recognizing that, while the short-horizon probability skew remains unfavorable, the monthly improvement suggests that additional deterioration may require a fresh catalyst (e.g., a breakdown of nearby support) rather than simply trend inertia.
The 3-month horizon is Not available in the provided data. That limitation matters because intermediate regime shifts often show first in multi-month stabilization. Without that window, the safest interpretation is to treat the monthly neutral rank as an early stabilization flag rather than a completed transition.
2) Price & trend overview
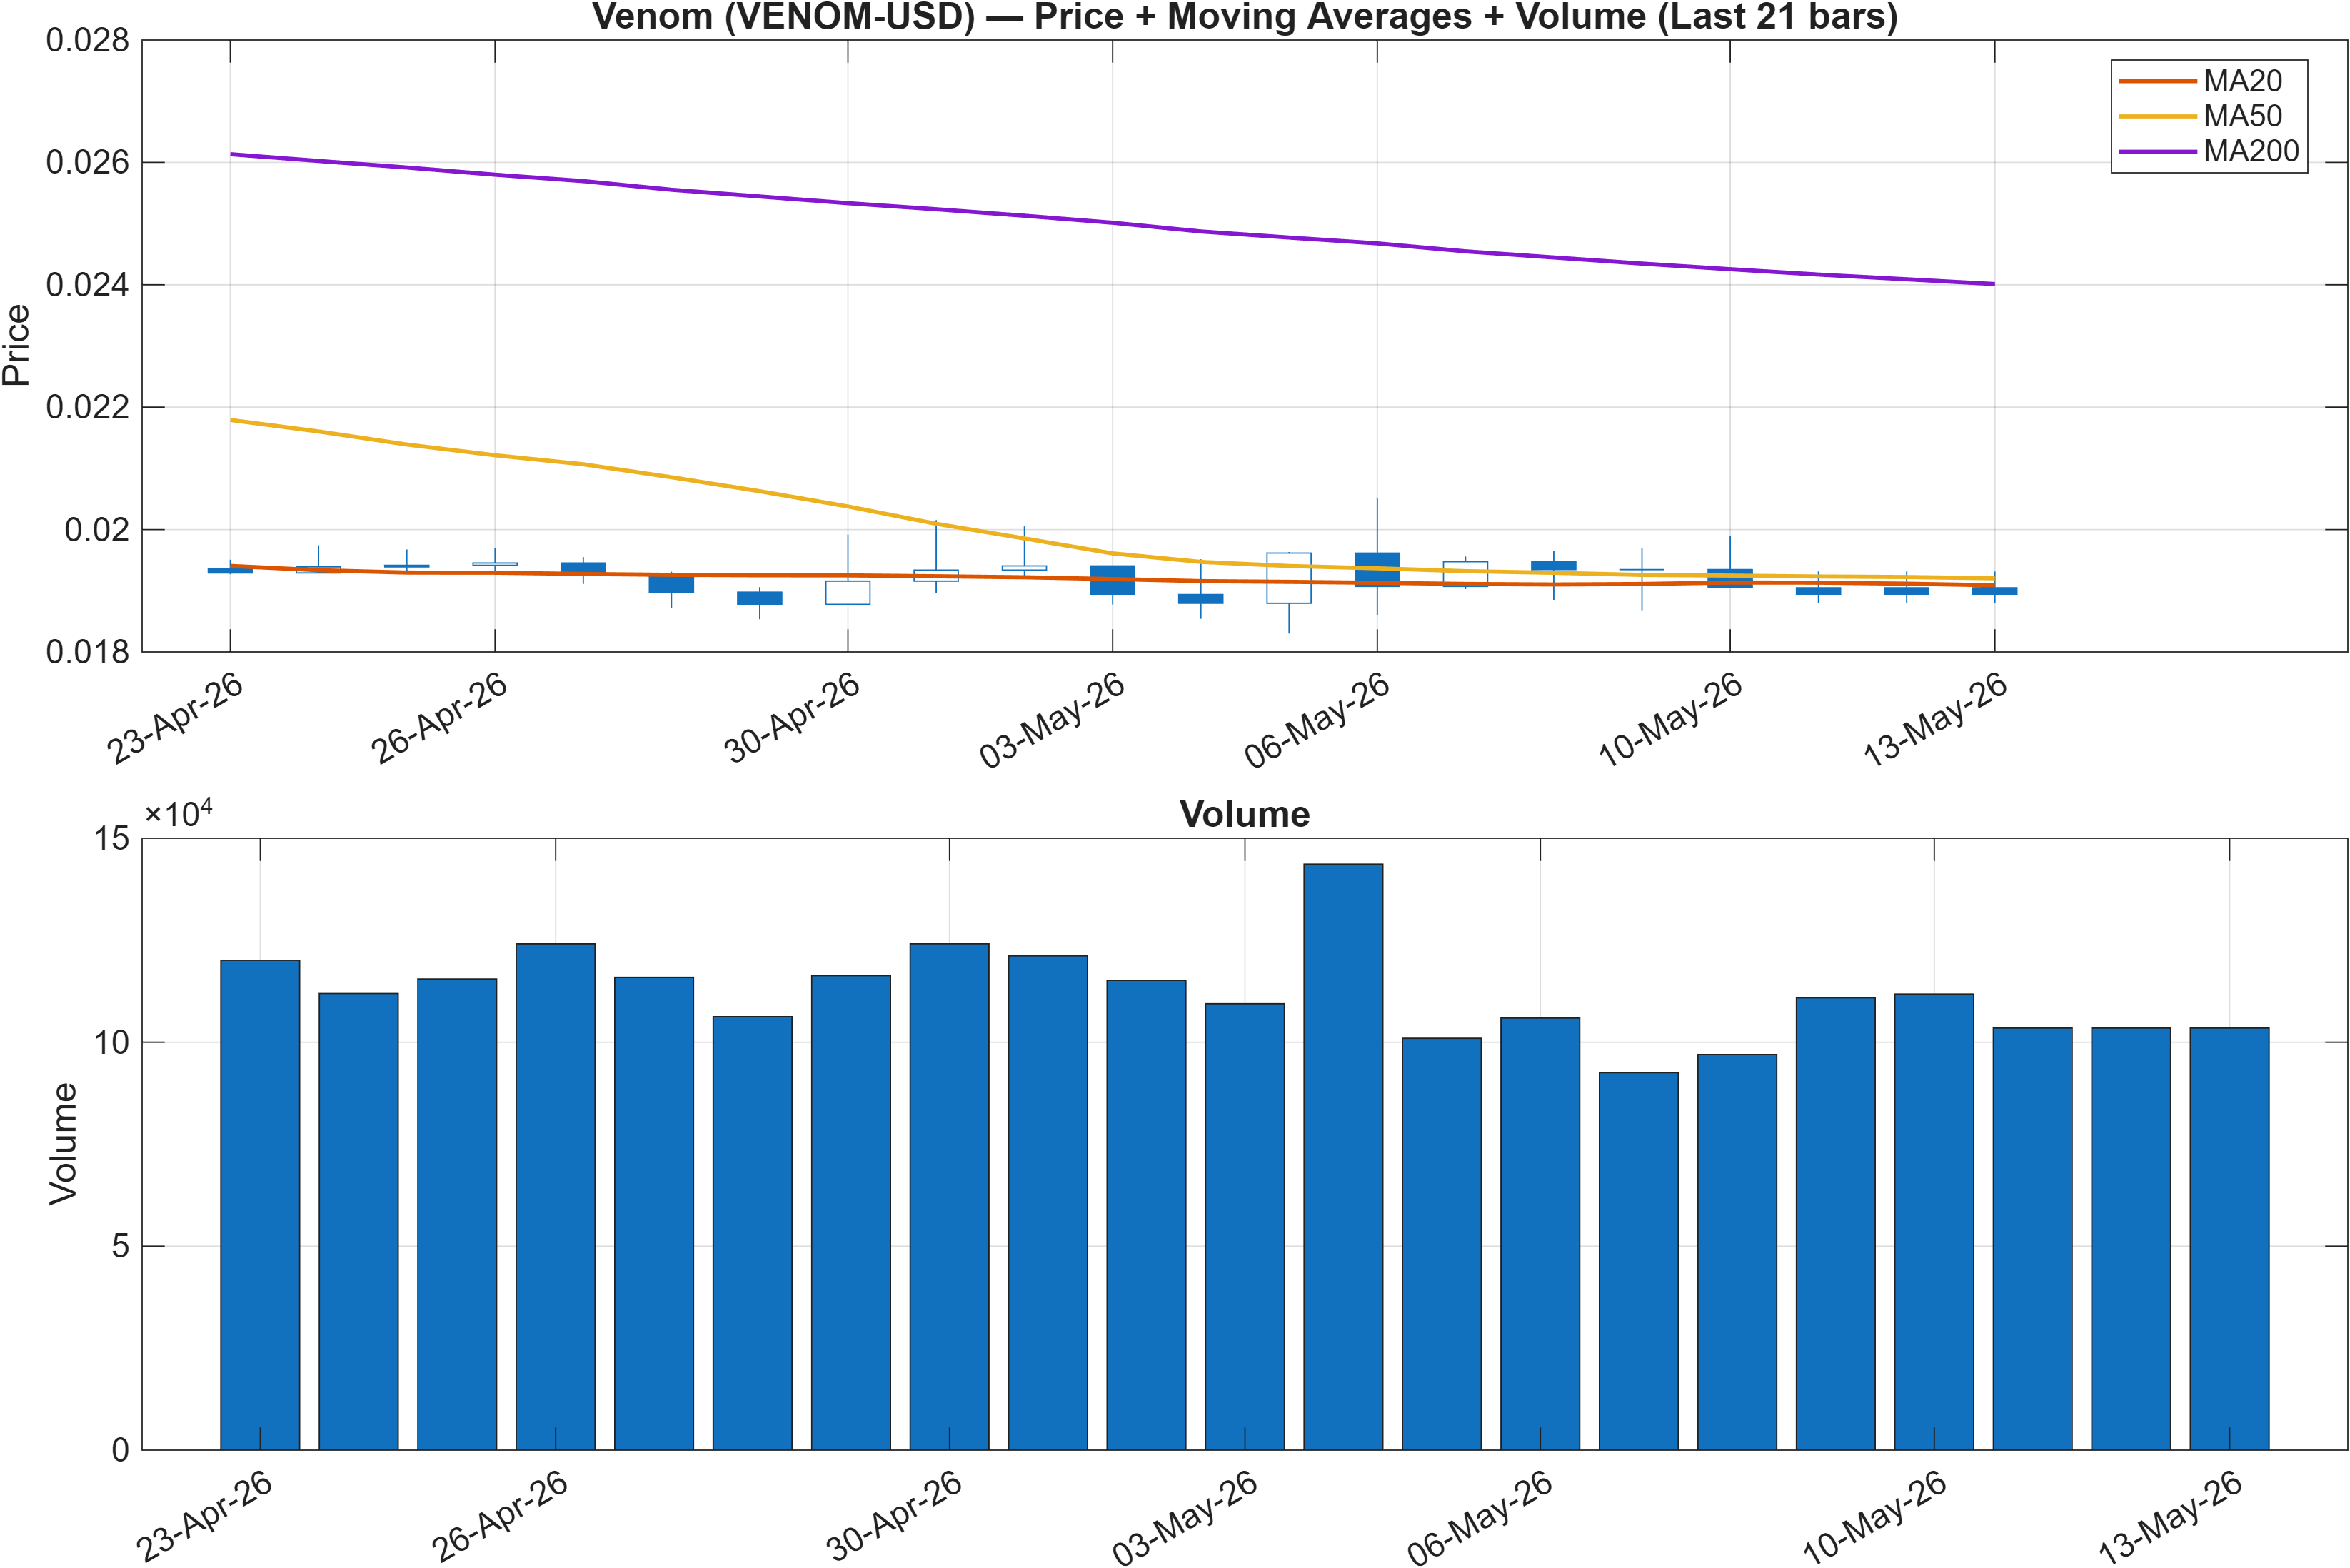
Trend structure: bearish stack, but requiring fresh downside follow-through
The trend model remains unambiguously defensive: the close is below the MA50 and the MA50 is below the MA200, reinforcing a bearish moving-average “stack.” This structure typically implies that rallies are more likely to be treated as mean-reversion until the short-to-medium average begins to flatten and recover.
What makes this configuration analytically interesting is the coexistence of bearish trend structure with less extreme momentum signals elsewhere in the dashboard. With RSI bias labeled Neutral and RSI(14) at 47.95, VENOM-USD is not presenting as oversold on the 14-day lens. That tends to reduce the probability of an immediate snapback being “forced” by stretched conditions; instead, any stabilization would likely need to be earned through incremental higher lows and improving participation.
The rank backdrop supports this interpretation: daily and weekly ranks remain poor (#674 and #670), while the monthly rank (#615) suggests pressure may be moderating rather than accelerating. Taken together, this points to a regime where the trend is still bearish, but trend persistence may be increasingly dependent on whether price can remain below decision zones and whether volume confirms directional intent.
3) Momentum & volatility dashboard
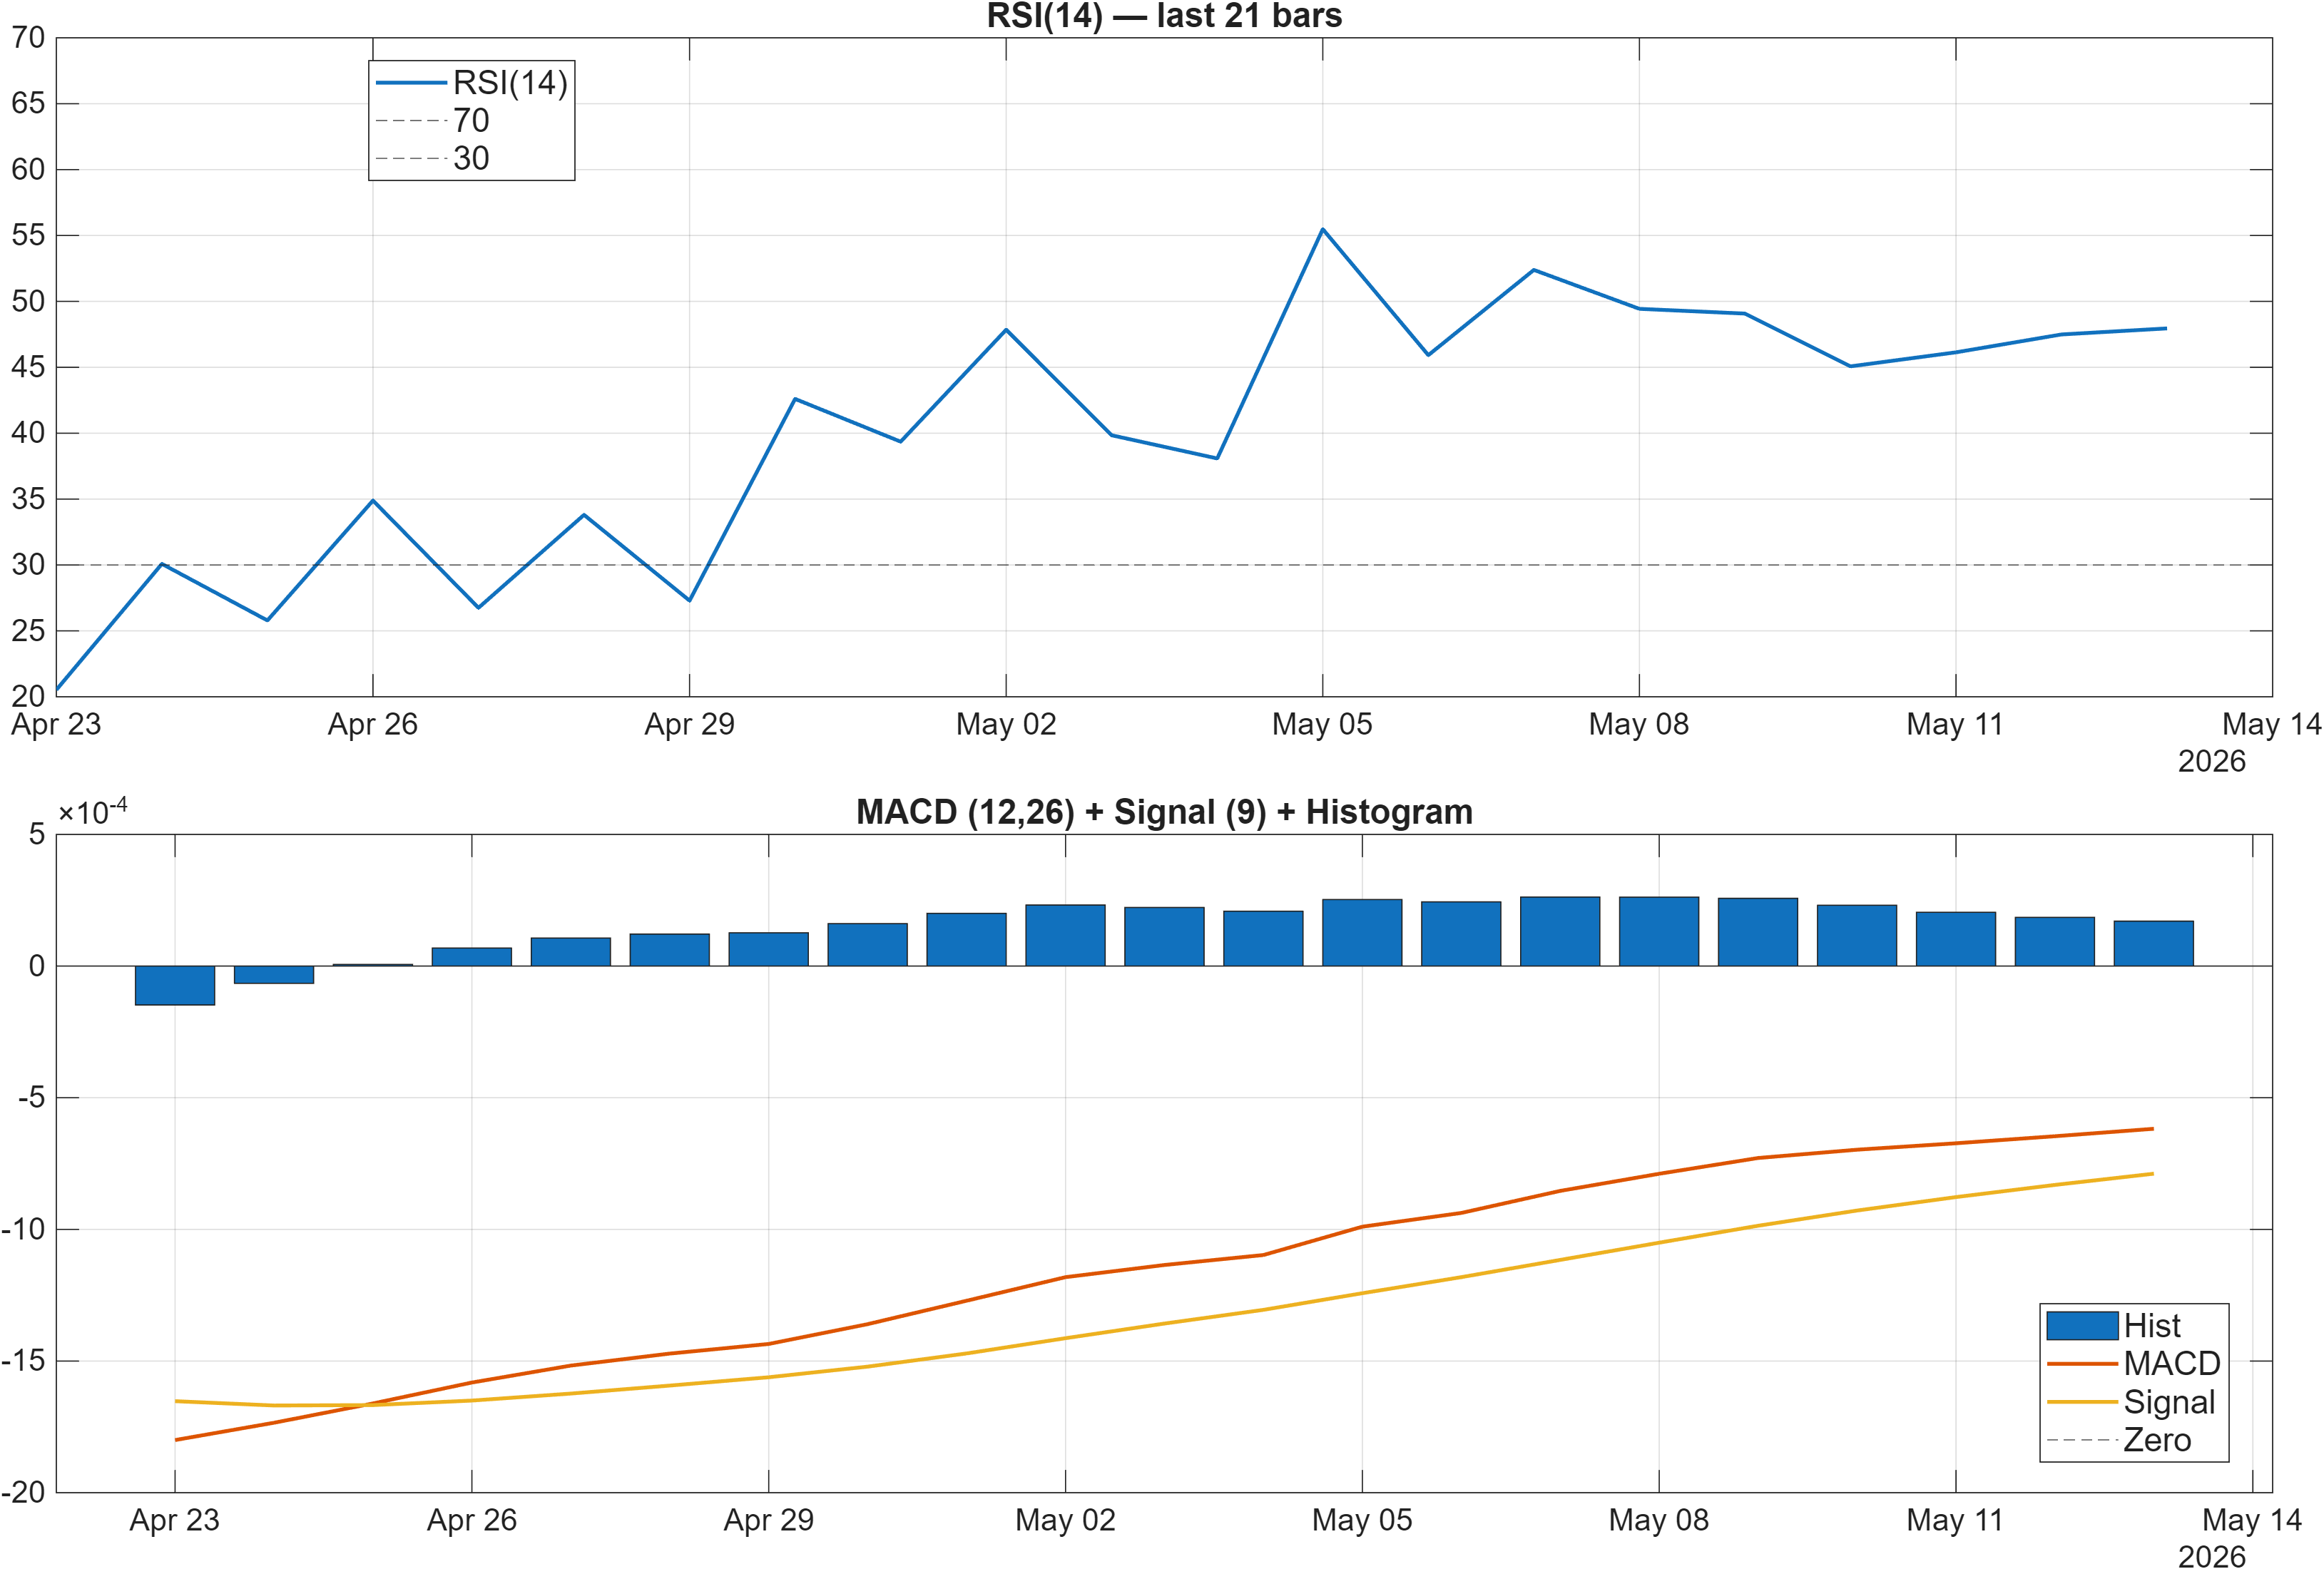
Interpretation: RSI bias = Neutral, MACD hist = 0.0002.
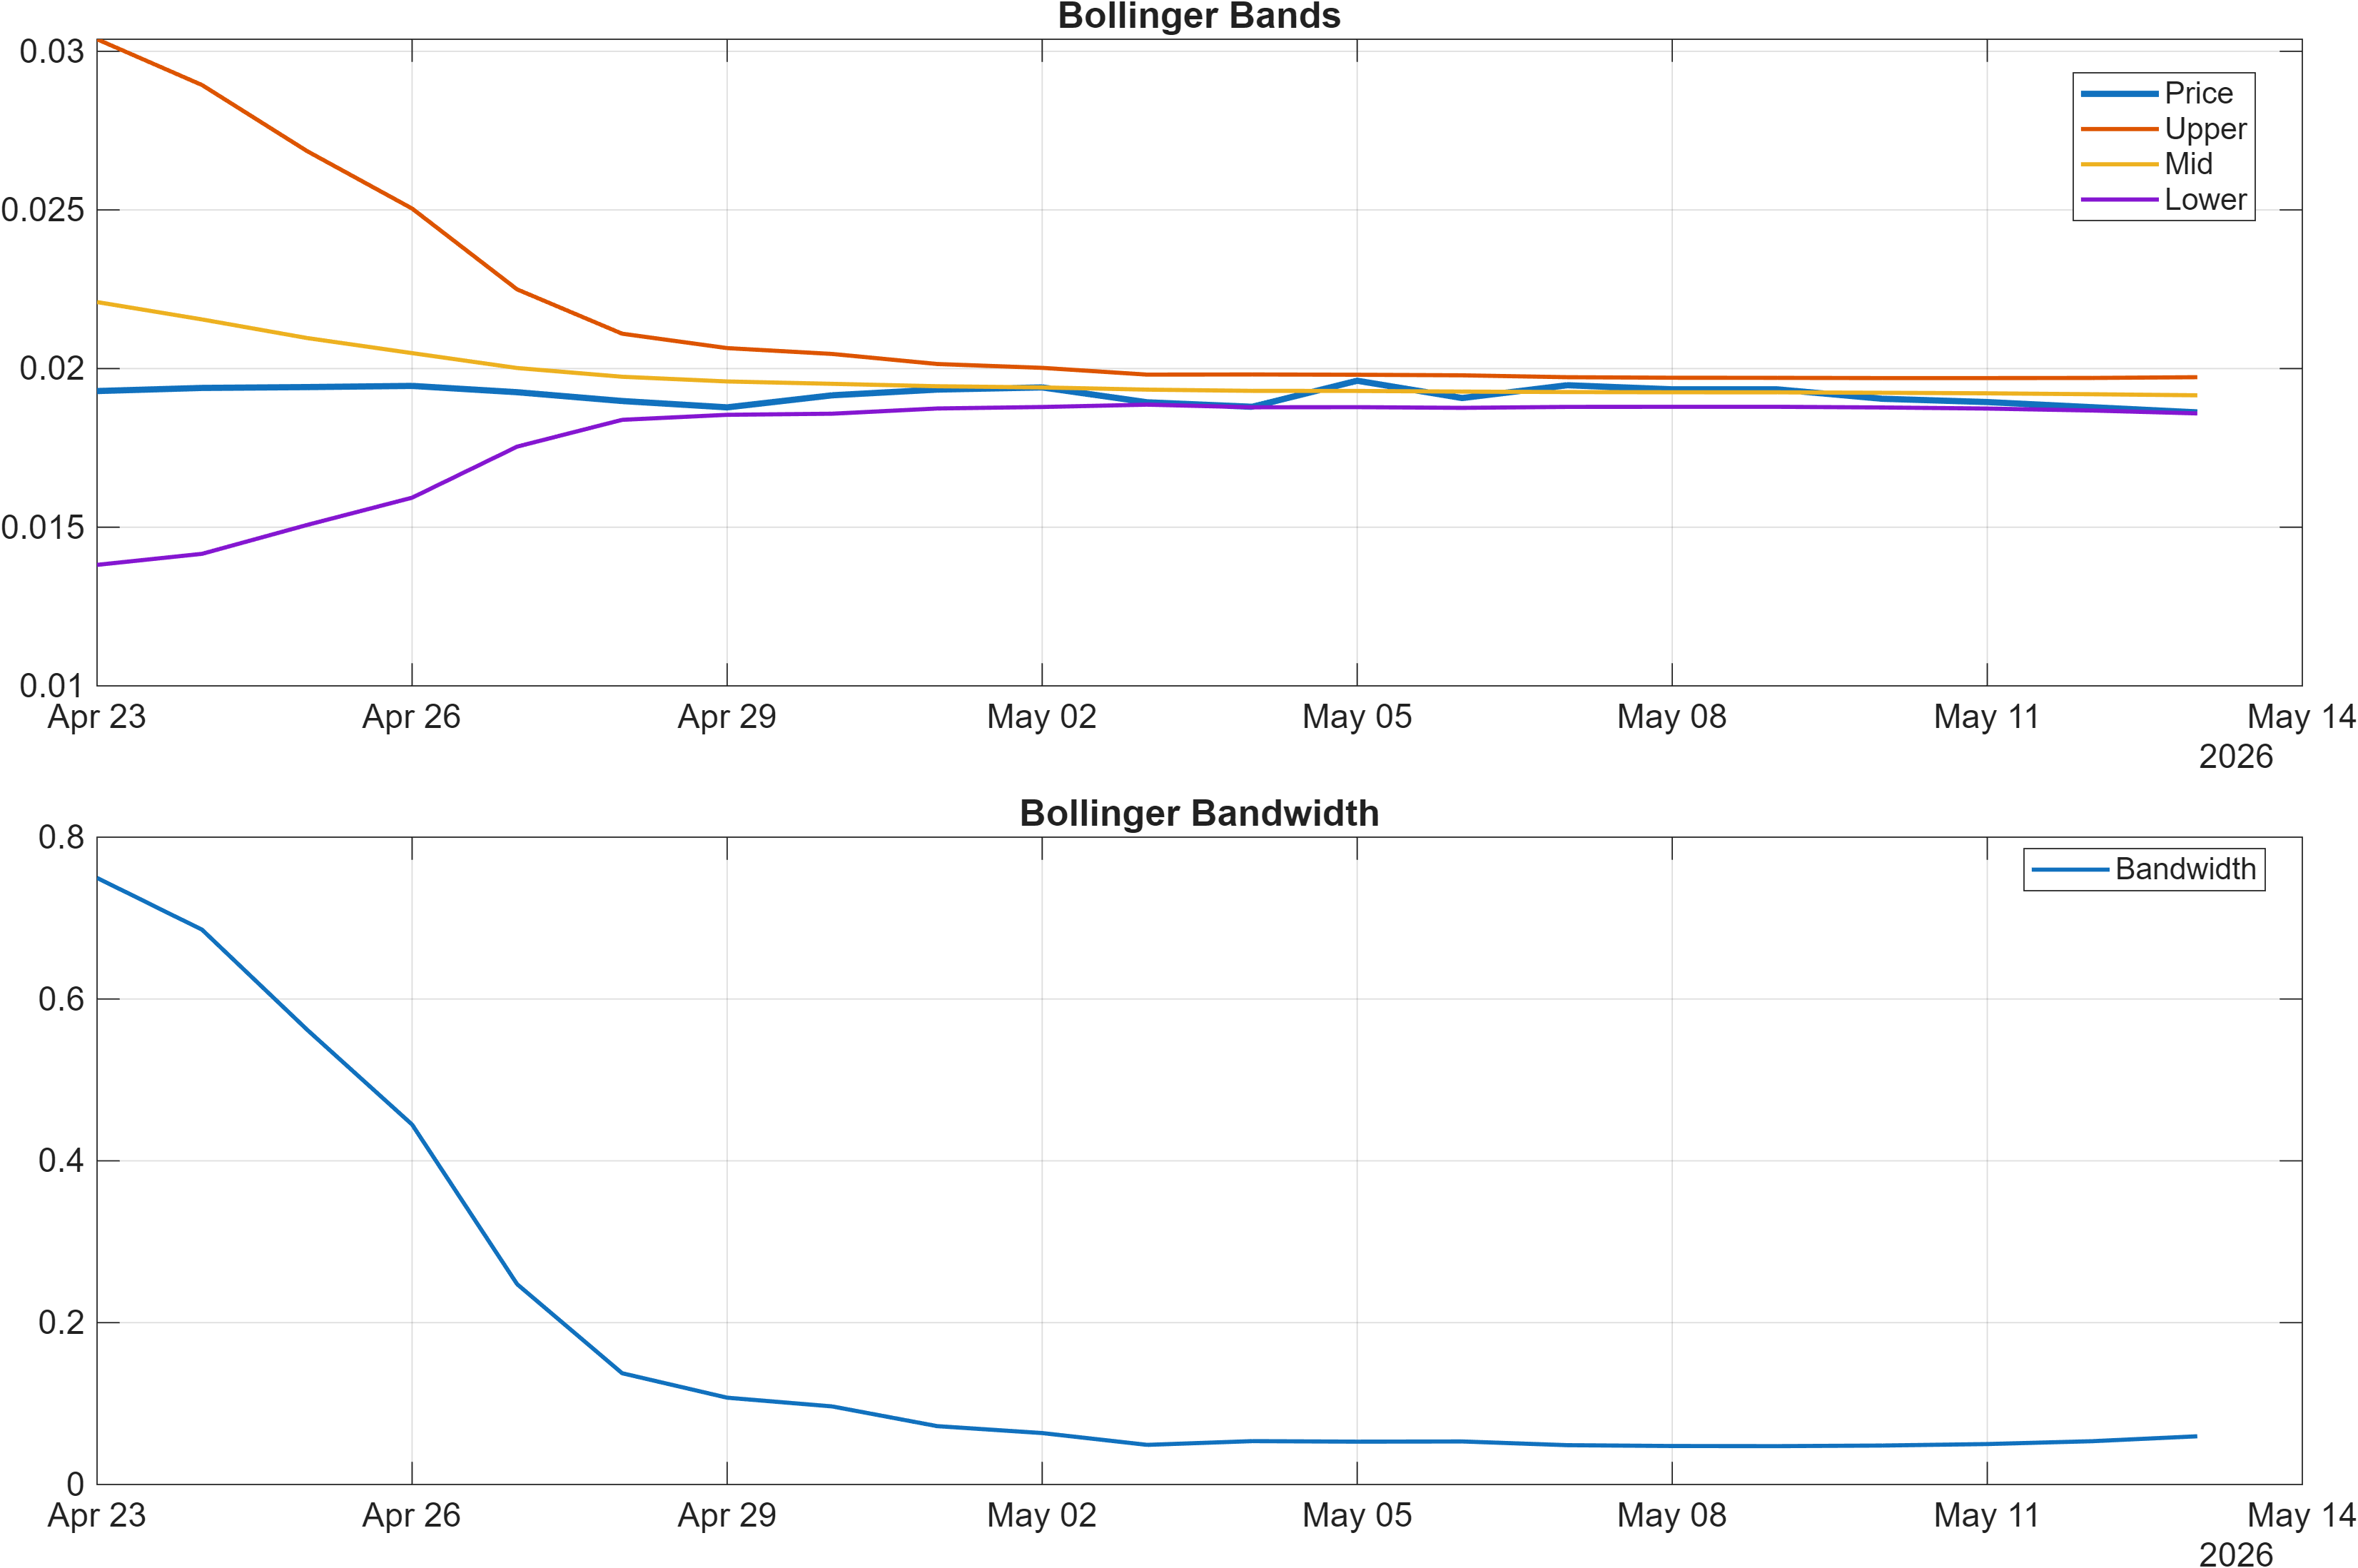
Interpretation: Bandwidth (volatility regime) latest = 0.0596.
Momentum divergence: mild positive MACD vs neutral RSI, within compressed volatility
Momentum diagnostics are not fully aligned with the bearish moving-average structure. The MACD histogram is positive (0.0001706 in the signal table; 0.0002 in the figure interpretation), which can indicate early bottoming behavior or simply a slowing of negative momentum. Meanwhile, RSI(14) at 47.95 remains neutral, consistent with a market that is neither stretched nor strongly trending from an oscillator perspective.
Volatility is also comparatively contained: Bollinger bandwidth at 0.0596 (and BB Width 0.05959 in the signal table) supports a compressed regime. In such regimes, signal quality often shifts from “oscillator reads” toward “level-based confirmation,” where breaks of well-defined support/resistance tend to carry more informational value than marginal improvements in momentum.
The internal signal mix hints at selective stabilization but not broad confirmation. For example, TS Accel is Bullish at 0.01131, while ROC(20) is Bearish at -3.976 and TS Mom(20) is Bearish at -0.0004454, a combination consistent with decelerating downside rather than a fully reversed impulse. This is one reason the confluence score remains neutral even while the blended overlay leans bearish (see Section 5).
4) Support / Resistance zones
Support ~ 0.0187 | Resistance ~ 0.0310
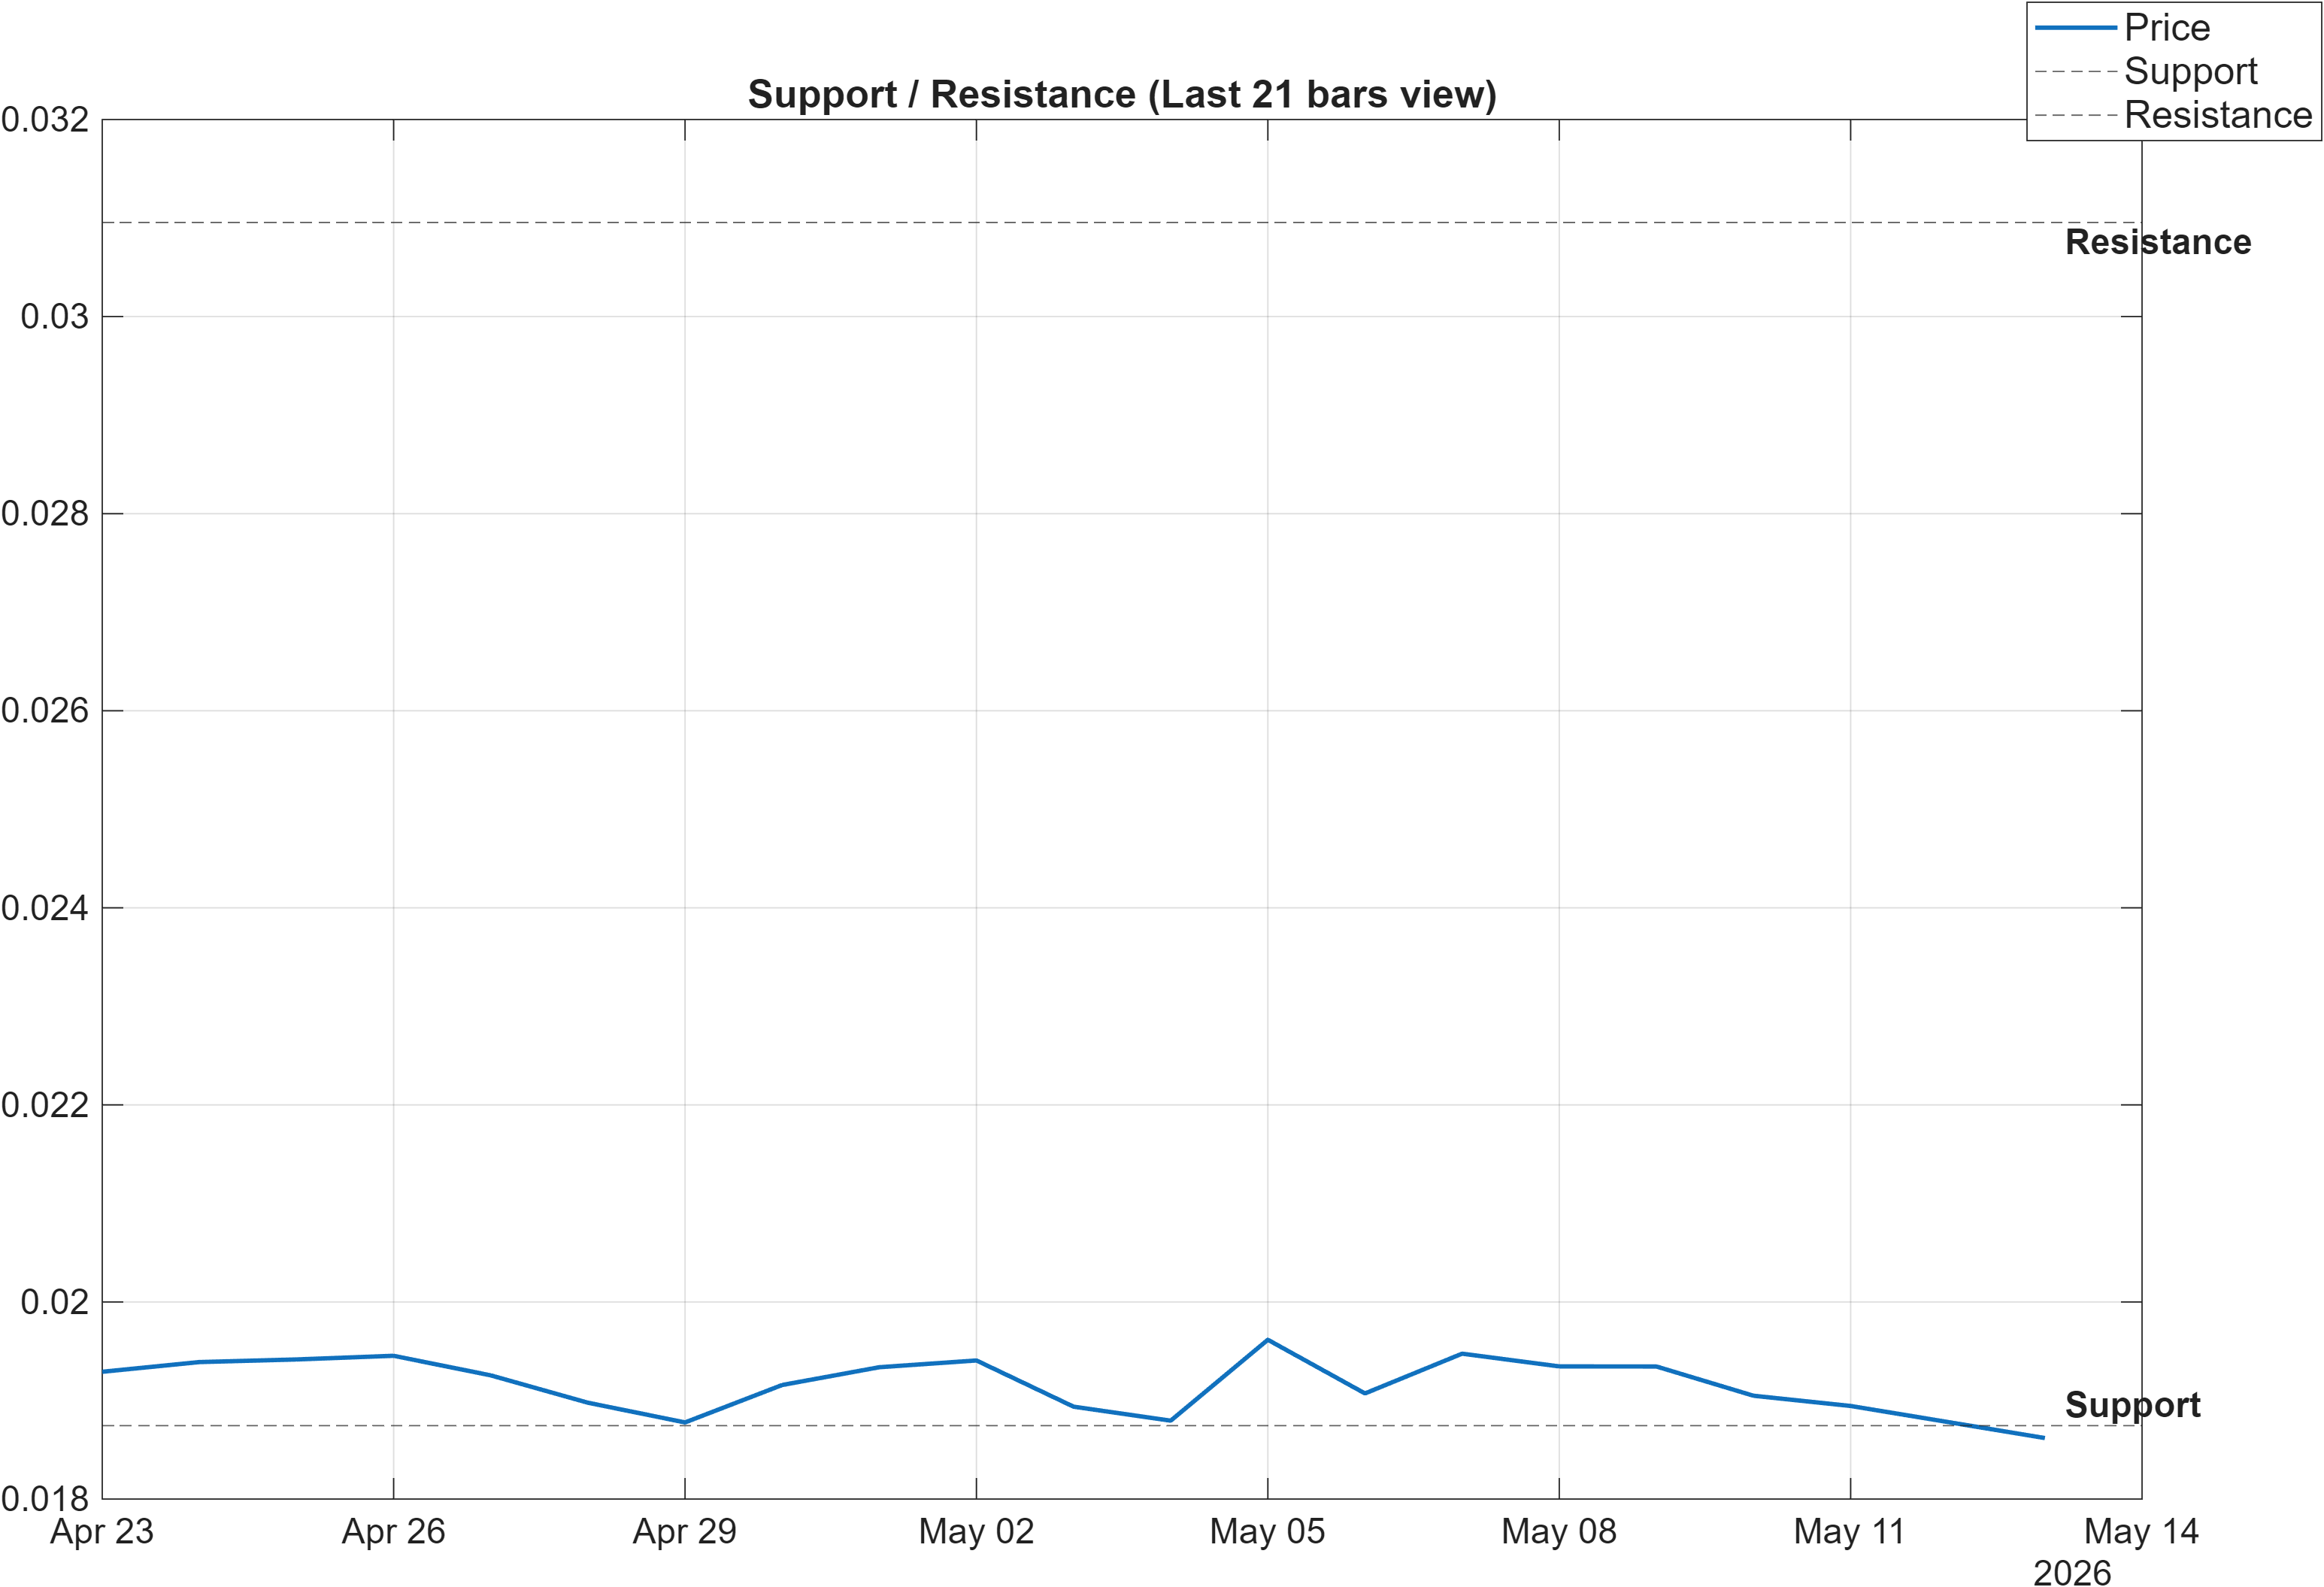
Decision zones: mapping confirmation around 0.0187 and 0.0310
With volatility relatively compressed (bandwidth 0.0596) and momentum mixed (RSI(14) 47.95 neutral alongside a slightly positive MACD histogram), the support/resistance framework becomes the primary organizing structure for risk. The current map defines a clear lower boundary at 0.0187 and an upper decision zone at 0.0310.
The scenario logic is straightforward but analytically useful. A break above 0.0310 with volume would represent a regime test: in a market where the close is below the MA50 and the MA50 is below the MA200, upside confirmation typically requires both price acceptance above resistance and improving participation to challenge the prevailing bearish stack. Conversely, a close below 0.0187 would be consistent with the weaker short-horizon ranks (#674 daily; #670 weekly) reasserting dominance and would increase the probability that “stabilization” signals in momentum were only temporary.
The signal table provides additional context for why these zones matter. The MedPx vs Support input is 0.0003137 and labeled bullish, suggesting price is not far from a support-referenced anchor, while multiple volume/flow slopes are bearish (e.g., OBV slope(10) and PVT slope(10) both bearish). That mix tends to produce sharper outcomes when levels are resolved—either a sustained hold and rotation higher, or a breakdown that is reinforced by weak participation metrics.
5) Quant Technical Dashboard (18 Signals)
KGNAI AI Technical Analysis Score (Deep Reinforcement Learning): Rank #743 out of 800 (Rank 1 represents the strongest technical positioning and a higher probability of favorable price behavior. As ranks increase toward the maximum, the probability of favorable outcomes weakens and bearish positioning becomes more dominant.) | Label: Bearish | Score: -0.857
18-Signal Technical Confluence Score: -0.167 (Neutral)
Overall Technical Score (18-signal confluence + DRL rank blend): -0.374 (Bearish)
Note: The blended score reflects signal strength weighted against broader AI technical ranking, which may temporarily diverge.
Blended technical score breakdown: -0.374 (Bearish | Bull 5 / Bear 8 / Neutral 5)
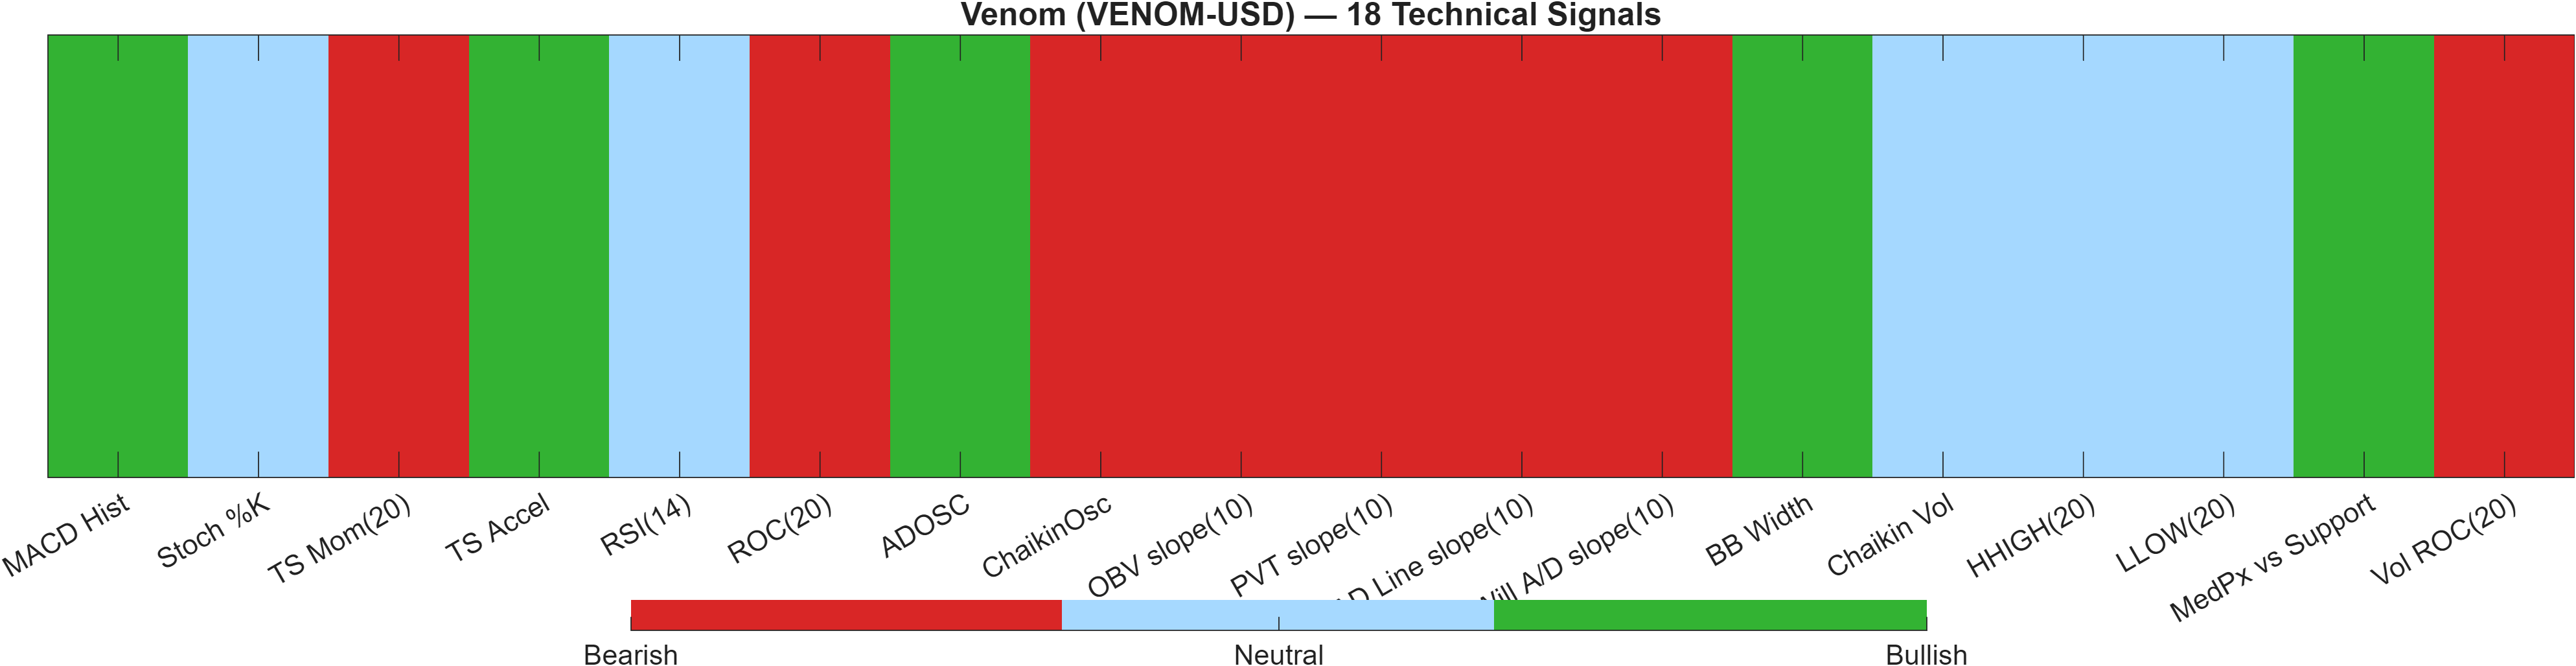
Confluence vs model rank: neutral signals, bearish cross-sectional weighting
VENOM-USD shows a notable split between indicator confluence and model-weighted ranking. The 18-signal confluence score is -0.167 and labeled Neutral, suggesting that, on balance, the standard toolkit (momentum, trend proxies, volatility, and volume/flow) is not unanimously bearish. However, the Deep Reinforcement Learning technical rank is #743 out of 800 with a score of -0.857, pushing the overall technical score to -0.374 and a Bearish label.
This divergence often appears when “classic” indicators begin to stabilize but the broader pattern library (learned from cross-asset behavior) still classifies the setup as fragile. The breakdown counts reinforce that the tape is not one-sided: Bull 5 / Bear 8 / Neutral 5. In the signal table, the bullish MACD Hist (0.0001706) and bullish ADOSC (39.84) contrast with bearish participation slopes such as ChaikinOsc (-9.308e+04) and bearish Vol ROC(20) (-7.568).
The practical implication is that near-term improvements should be evaluated as potential inflections rather than confirmed trend reversals. Until the blended score improves from -0.374 and the trend structure (close vs MA50; MA50 vs MA200) stops reading bearish, risk remains skewed toward false starts—especially in a compressed volatility regime where breakouts require follow-through.
Signal table (Bull/Bear/Neutral)
| Indicator | Value | Signal |
|---|---|---|
| MACD Hist | 0.0001706 | Bullish |
| Stoch %K | 28.99 | Neutral |
| TS Mom(20) | -0.0004454 | Bearish |
| TS Accel | 0.01131 | Bullish |
| RSI(14) | 47.95 | Neutral |
| ROC(20) | -3.976 | Bearish |
| ADOSC | 39.84 | Bullish |
| ChaikinOsc | -9.308e+04 | Bearish |
| OBV slope(10) | -4.792e+05 | Bearish |
| PVT slope(10) | -578.1 | Bearish |
| AD Line slope(10) | -1.535e+05 | Bearish |
| Will A/D slope(10) | -0.002279 | Bearish |
| BB Width | 0.05959 | Bullish |
| Chaikin Vol | -7.551 | Neutral |
| HHIGH(20) | 0.02052 | Neutral |
| LLOW(20) | 0.0183 | Neutral |
| MedPx vs Support | 0.0003137 | Bullish |
| Vol ROC(20) | -7.568 | Bearish |
Interpretation: Indicator-level signals form the base confluence, which is then adjusted using a separate AI-driven technical ranking model. The final technical score summarizes this combined view.
6) News sentiment + extractive gist
Note: Instrument-specific news matches were not found, so the digest includes broader market/sector headlines. Links are provided for verification.
Sentiment score (avg): 0.042 | Positive: 12% | Neutral: 81% | Negative: 6%
KGNAI AI News Sentiment Score (normalized -1 to +1): Not available (as of —) | Label: Not available | Overall news score: 0.04
Positive Developments
Recent coverage across major financial outlets indicates a generally constructive tone around parts of the digital-asset complex, with attention on areas such as institutional product flows, on-chain financial services initiatives, and infrastructure-oriented adoption narratives. In a market context where VENOM-USD’s technical picture is mixed—neutral RSI (47.95) with a slightly positive MACD histogram (0.0002 / 0.0001706)—a modestly positive sector tape can help stabilize high-beta assets even when their own trend structure remains bearish (close below MA50; MA50 below MA200). Importantly, the news mix here is not described as token-specific; it functions as a broader backdrop that can influence risk appetite. The data supports that interpretation: headline sentiment is dominated by neutral items (81%), but the presence of some positive coverage (Positive 12%, avg sentiment 0.042) implies that the information environment is not uniformly risk-off.
Neutral / Mixed Developments
The digest is largely informational and policy-adjacent, which aligns with the sentiment distribution skewing heavily neutral (81%). When sector commentary is centered on market structure, regulatory process, or macro-policy personnel, price impact is often indirect—expressed through volatility and correlations rather than immediate idiosyncratic repricing. That matters for VENOM-USD because volatility is currently contained (bandwidth 0.0596), and compressed regimes can be sensitive to external “risk-on/risk-off” shifts without providing clear directional cues in advance. In that setting, neutral news flow can still matter by keeping participants focused on levels rather than narratives, reinforcing the role of nearby decision zones at 0.0187 and 0.0310. With the overall news score around 0.04, the bias remains mild and context-setting rather than dominant.
Negative / Risk Signals
Risk-oriented coverage across major outlets highlights that macro and geopolitical uncertainty can surface abruptly and transmit into crypto through cross-asset volatility rather than token-specific fundamentals. For an asset already displaying weaker cross-sectional technical standing—daily rank #674, weekly rank #670, and DRL technical rank #743—a negative macro impulse can be problematic because it tends to punish the weaker tails of the universe first. The sentiment data does not suggest acute negativity (Negative 6%, avg 0.042), but the presence of risk flags is consistent with why confirmation should be sought at price levels, not inferred from small oscillator changes. In practical terms, a macro-driven volatility uptick would make a close below 0.0187 more consequential, while a sustained break above 0.0310 would require stronger evidence of participation to offset the bearish trend stack.
- Whether price can reclaim 0.0310 with volume while MA structure remains bearish.
- Any volatility expansion from 0.0596 bandwidth that coincides with a level break.
- Whether sentiment stays predominantly neutral (81%) or shifts toward a more directional skew.
Sources referenced: Reuters, Bloomberg, Yahoo Finance, MarketWatch, Investing.com
7) Sources
- Bermuda to transition ‘key’ financial services to Stellar blockchain — https://cointelegraph.com/news/bermuda-financial-services-stellar?utm_source=rss_feed&utm_medium=rss&utm_campaign=rss_partner_inbound
- Senate confirms Kevin Warsh as Federal Reserve governor, with chair vote expected — https://cointelegraph.com/news/kevin-warsh-fed-governor-confirmation-us-senate?utm_source=rss_feed&utm_medium=rss&utm_campaign=rss_partner_inbound
- DTCC to use Chainlink to power 24/7 collateral management network — https://cointelegraph.com/news/dtcc-to-use-chainlink-to-power-247-collateral-management-network?utm_source=rss_feed&utm_medium=rss&utm_campaign=rss_partner_inbound
- WAIB Summit Monaco 2026 returns: the world’s most exclusive gathering for digital assets & AI — https://cointelegraph.com/press-releases/waib-summit-monaco-2026-returns-the-worlds-most-exclusive-gathering-for-digital-assets-ai?utm_source=rss_feed&utm_medium=rss&utm_campaign=rss_partner_inbound
- Latest version of crypto market structure bill raises eyebrows ahead of Senate markup — https://cointelegraph.com/news/us-senate-banking-committee-draft-crypto-market-structure-bill-markup?utm_source=rss_feed&utm_medium=rss&utm_campaign=rss_partner_inbound
- XRP traders say bullishness ‘growing’ as ETFs log largest inflow since January — https://cointelegraph.com/markets/xrp-traders-bullishness-growing-etfs-log-largest-inflow-since-january?utm_source=rss_feed&utm_medium=rss&utm_campaign=rss_partner_inbound
- Ethereum derivatives unfazed by DeFi hacks: Can ETH hit $2.6K next? — https://cointelegraph.com/markets/eth-derivatives-unfazed-defi-hacks-eth-hit-2600-next?utm_source=rss_feed&utm_medium=rss&utm_campaign=rss_partner_inbound
- Here’s what happened in crypto today — https://cointelegraph.com/news/what-happened-in-crypto-today?utm_source=rss_feed&utm_medium=rss&utm_campaign=rss_partner_inbound
You may also like: How KGNAI AI ranks instruments across global markets
Disclaimer: KGNAI provides AI-generated analytics and educational market commentary only. This is not financial advice. Markets involve risk. Always do your own research.