
PYR-USD (Vulcan Forged PYR) Technical & Rank Outlook — 17-May-2026 | Mid/Long Constructive, Near-Term Fragile
Vulcan Forged PYR (PYR-USD) shows a notable time-horizon split in the KGNAI framework as of 17-May-2026. Cross-sectional ranks lean constructive on the weekly and longer windows (weekly #125, monthly #27, 3-monthly #48 out of 800), while the daily rank remains weaker (#577), aligning with a more fragile near-term tape. That divergence is reinforced by the technical stack: moving-average positioning is bearish (Close vs MA50 bearish; MA50 vs MA200 bearish) and momentum indicators remain soft, with RSI(14) at 39.63 and a negative MACD histogram (-0.001841). Volatility conditions appear contained rather than expanding, with Bollinger bandwidth at 0.1214, implying the next directional move may require a clearer catalyst or volume confirmation. Key decision zones are tightly defined with support near 0.2510 and resistance near 0.3013, framing the market’s current negotiation range.
- Rank stance: Short-term Neutral (daily #577); Mid-term Bullish (weekly #125); Long-term Bullish (monthly #27 / 3-monthly #48).
- Technical confluence: Bearish (18-signal confluence -0.389; overall technical -0.342).
- Key levels: Support ~ 0.2510 | Resistance ~ 0.3013.
- News sentiment bias: Neutral (avg 0.037; 88% neutral; overall news score 0.04).
- Confirmation / invalidation: A sustained break above 0.3013 with volume supports continuation; a close below 0.2510 increases deterioration risk.
KGNAI evaluates assets using large cross-sectional datasets built from millions of structured data points. Inputs incorporate fundamental metrics, technical structures, and systematically processed news sentiment. Statistical models, machine learning, and AI frameworks are used to assess relative positioning, signal alignment, and probabilistic behavior across broad universes.
- Ranks are comparative across the tracked universe, not absolute price targets.
- Confluence reflects alignment among independent signal groups.
- Support/resistance levels are probabilistic decision zones, not guarantees.
- Sentiment provides contextual bias within the broader analytical framework.
1) KGNAI AI Analysis
Region: CRYPTO
Total universe size: 800 ranked instruments
- Daily rank: #577 out of 800 — Neutral
- Weekly rank: #125 out of 800 — Bullish
- Monthly rank: #27 out of 800 — Bullish
- 3-Monthly rank: #48 out of 800 — Bullish
PYR-USD is characterized by a rank regime mismatch: near-term placement is in the lower portion of the universe (daily #577), while the weekly and longer windows sit in the upper quartile to top decile (weekly #125; monthly #27; 3-monthly #48). In a cross-sectional framework, this typically points to a market that is struggling with short-horizon stability while still retaining favorable longer-horizon relative characteristics versus peers.
The term view formalizes this split (Short-term: Neutral; Mid-term: Bullish; Long-term: Bullish). Analytically, that configuration often appears when a drawdown, consolidation, or momentum fade is occurring within a broader structure that remains comparatively resilient. The key is whether the daily weakness resolves through stabilization and improvement in short-window ranking, or whether the softness persists long enough to pressure the longer-window placements.
Because ranks are probabilistic and relative, the most decision-relevant element is persistence: a daily rank in the high hundreds can be tolerated if weekly/monthly ranks remain anchored near #125 and #27, but a prolonged short-term lag frequently precedes a drift in the weekly placement. For PYR-USD, the current read is best described as mid/long constructive with near-term fragility, and subsequent sections (trend, momentum, and confluence) help verify whether the short-window weakness is merely tactical or evolving into a broader transition.
KGNAI ranks each instrument across large universes using multiple proprietary AI tests and statistical models (millions of data points). Lower ranks generally indicate stronger probability of favorable performance behavior, while higher ranks indicate weaker probability and more bearish positioning.
Term view: Short-term: Neutral. Mid-term: Bullish. Long-term: Bullish.
Want the full universe and complete rank tables? Unlock full access on KGNAI: https://www.kgnai.com/pricing
2) Price & trend overview
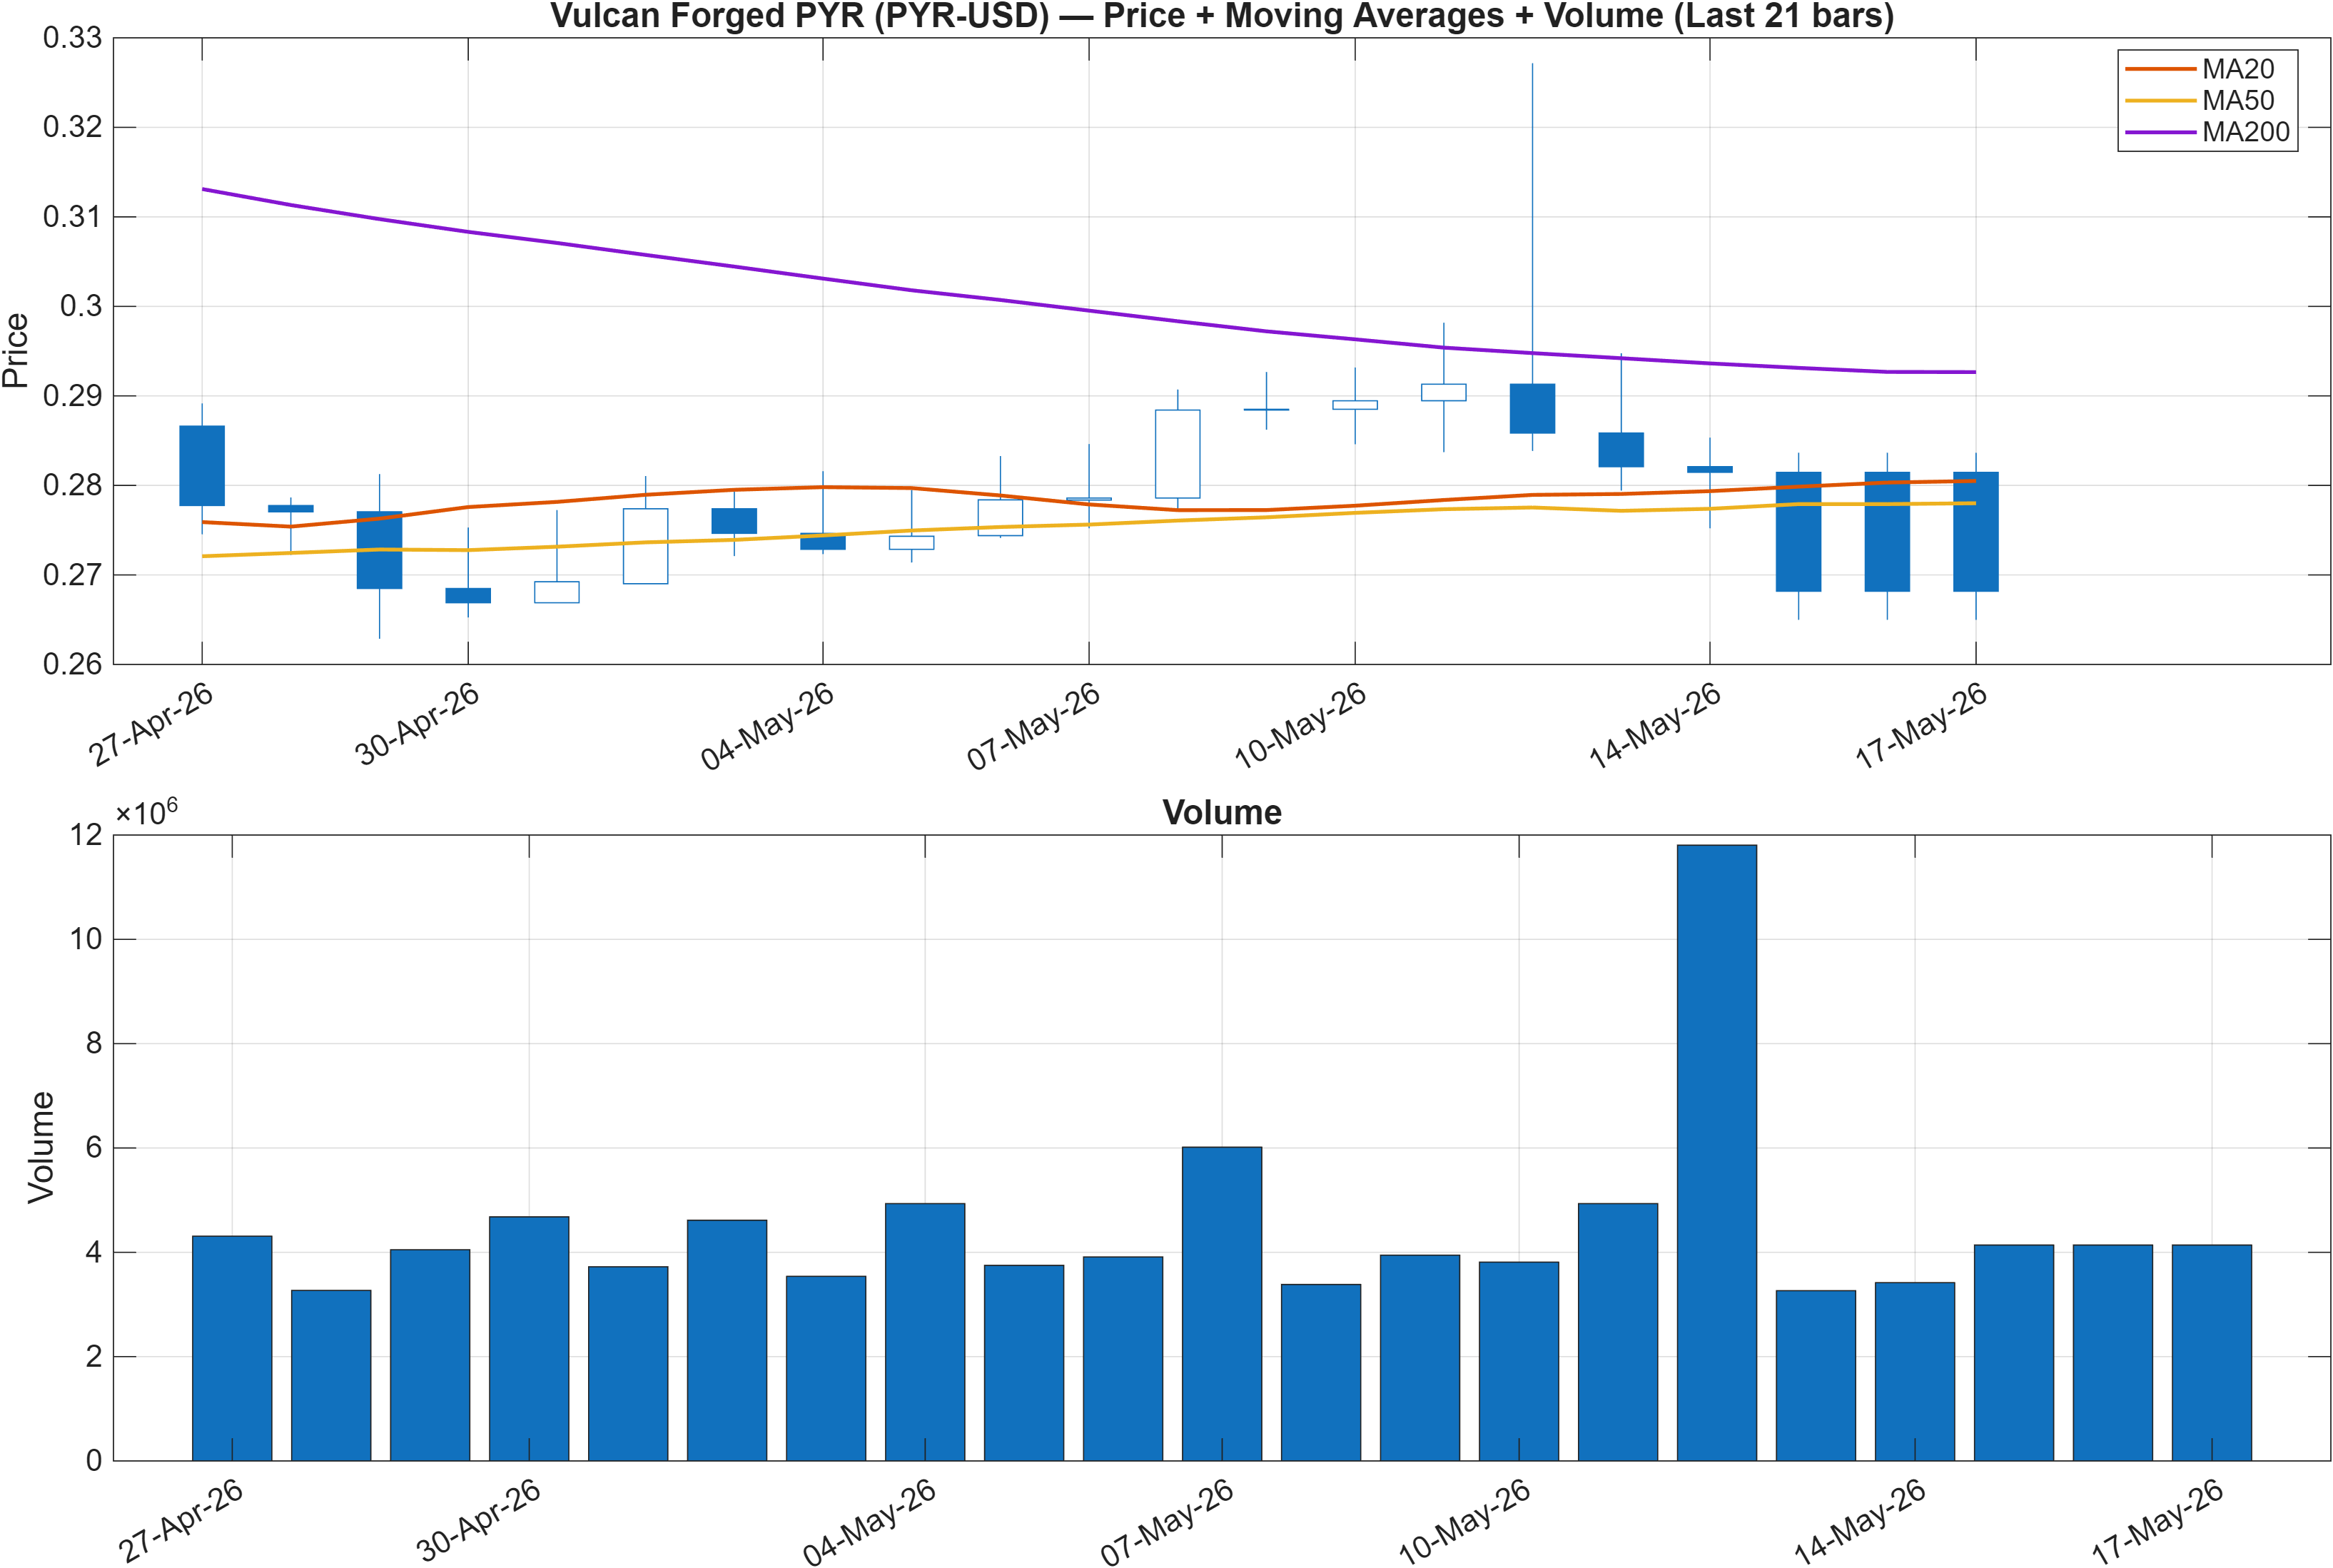
Trend conditions remain technically cautious despite the stronger medium/long-horizon ranks. The moving-average read is bearish on both comparisons: Close vs MA50 = Bearish and MA50 vs MA200 = Bearish. In market-structure terms, that typically signals that recent price action is still being absorbed within a downward-sloping intermediate trend, and that longer-cycle trend confirmation has not yet reasserted itself.
The key interpretive tension is the difference between cross-sectional rank strength (monthly #27; 3-monthly #48) and the trend stack still pointing lower. When ranks are strong but moving averages remain bearish, it often suggests that the asset has held up better than peers during a weak phase, but has not yet produced the price/MA evidence that systematic trend-following models typically require.
This is where the identified price zones become decisive. With support around 0.2510 and resistance around 0.3013, the market appears bracketed in a range where trend confirmation needs to be earned. A move that can reclaim and hold above resistance tends to improve the probability that the MA50 begins to flatten and eventually turn, while repeated failure below the MA50 keeps the “bearish stack” intact.
Volume context (as visualized in Figure 1) matters primarily as a confirmation layer: trend transitions that occur without meaningful participation often fail, while break attempts that arrive with stronger engagement tend to be more durable. For PYR-USD, the current read is less about calling direction and more about identifying whether the next impulse resolves the rank/price mismatch.
Interpretation: Close vs MA50 = Bearish, MA50 vs MA200 = Bearish.
3) Momentum & volatility dashboard
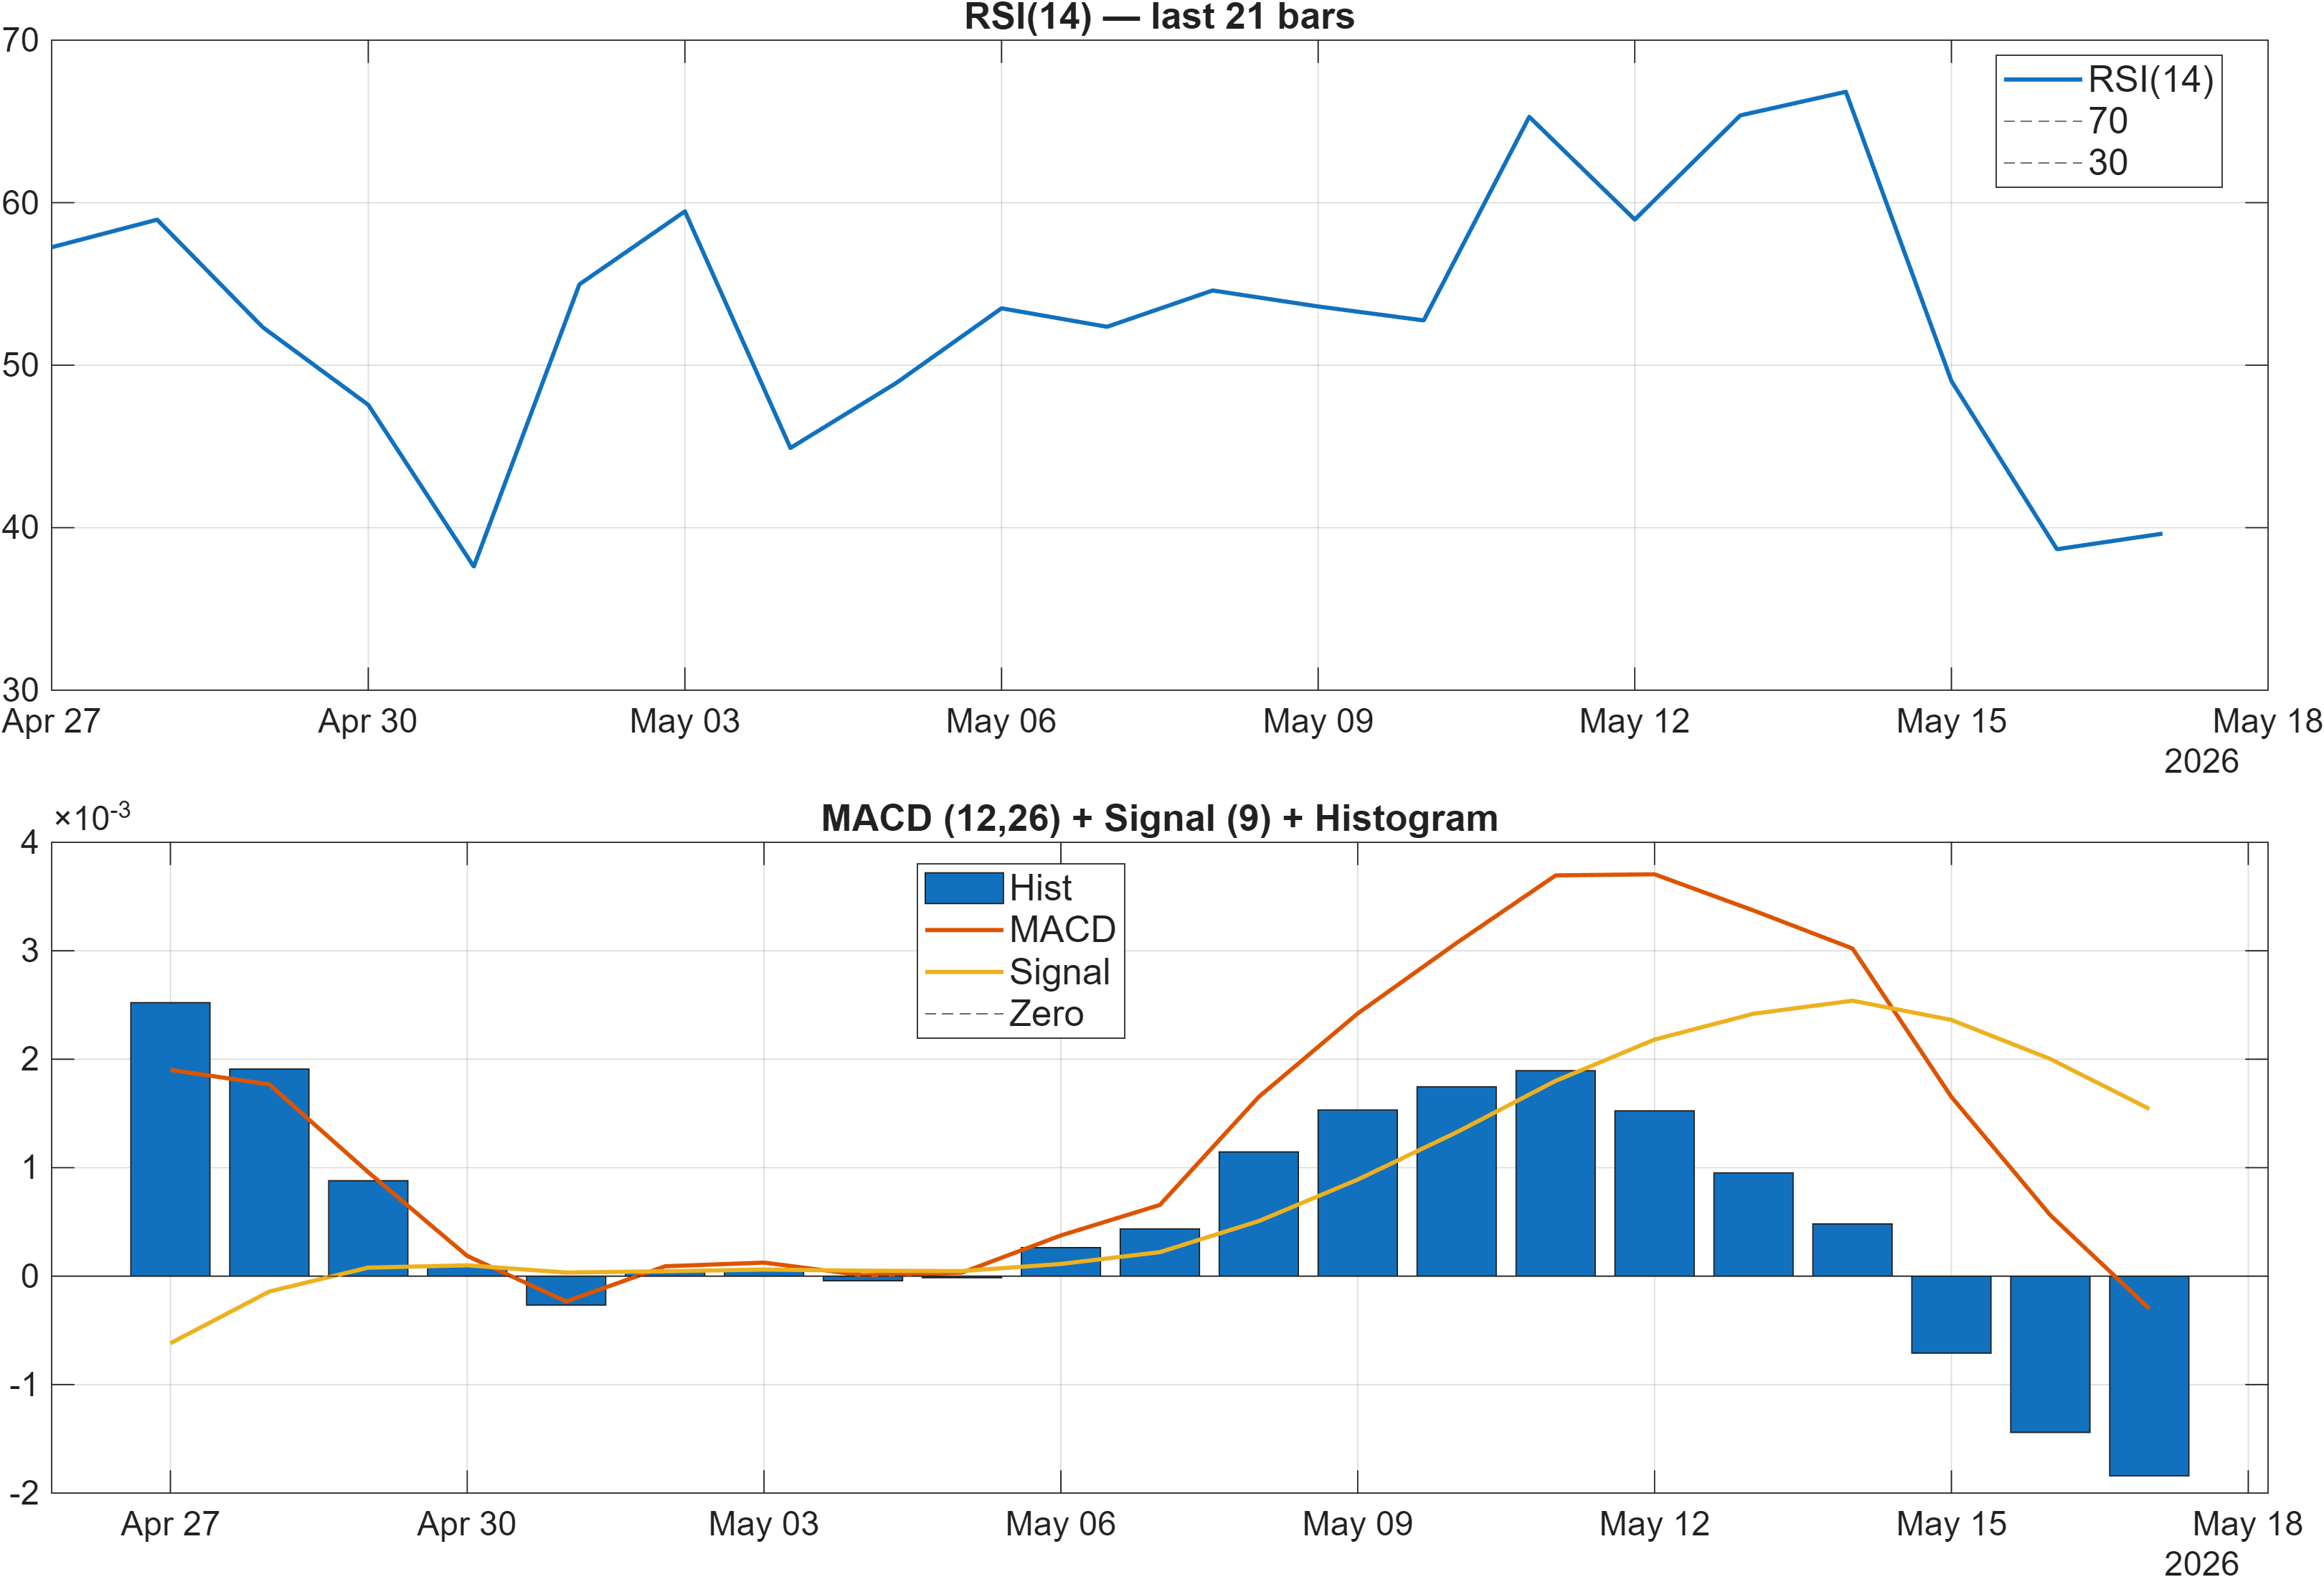
Momentum evidence remains tilted to the downside, consistent with the bearish moving-average structure. The dashboard flags RSI bias = Bearish, with RSI(14) at 39.63, which sits below the neutral 50 line and often corresponds to weaker impulse demand. At the same time, the MACD histogram is negative (-0.0018), indicating that downside momentum has not fully reset.
There is, however, a nuance in the underlying signal mix: the broader technical table shows Stoch %K at 5.15 as bullish, which can occur in oversold conditions even while trend and MACD remain weak. This combination is frequently observed during late-downmove stabilization attempts—a market can be oversold tactically without yet delivering a trend reversal. The analytical challenge is distinguishing between a short-lived bounce and a transition that meaningfully changes the medium-term path.
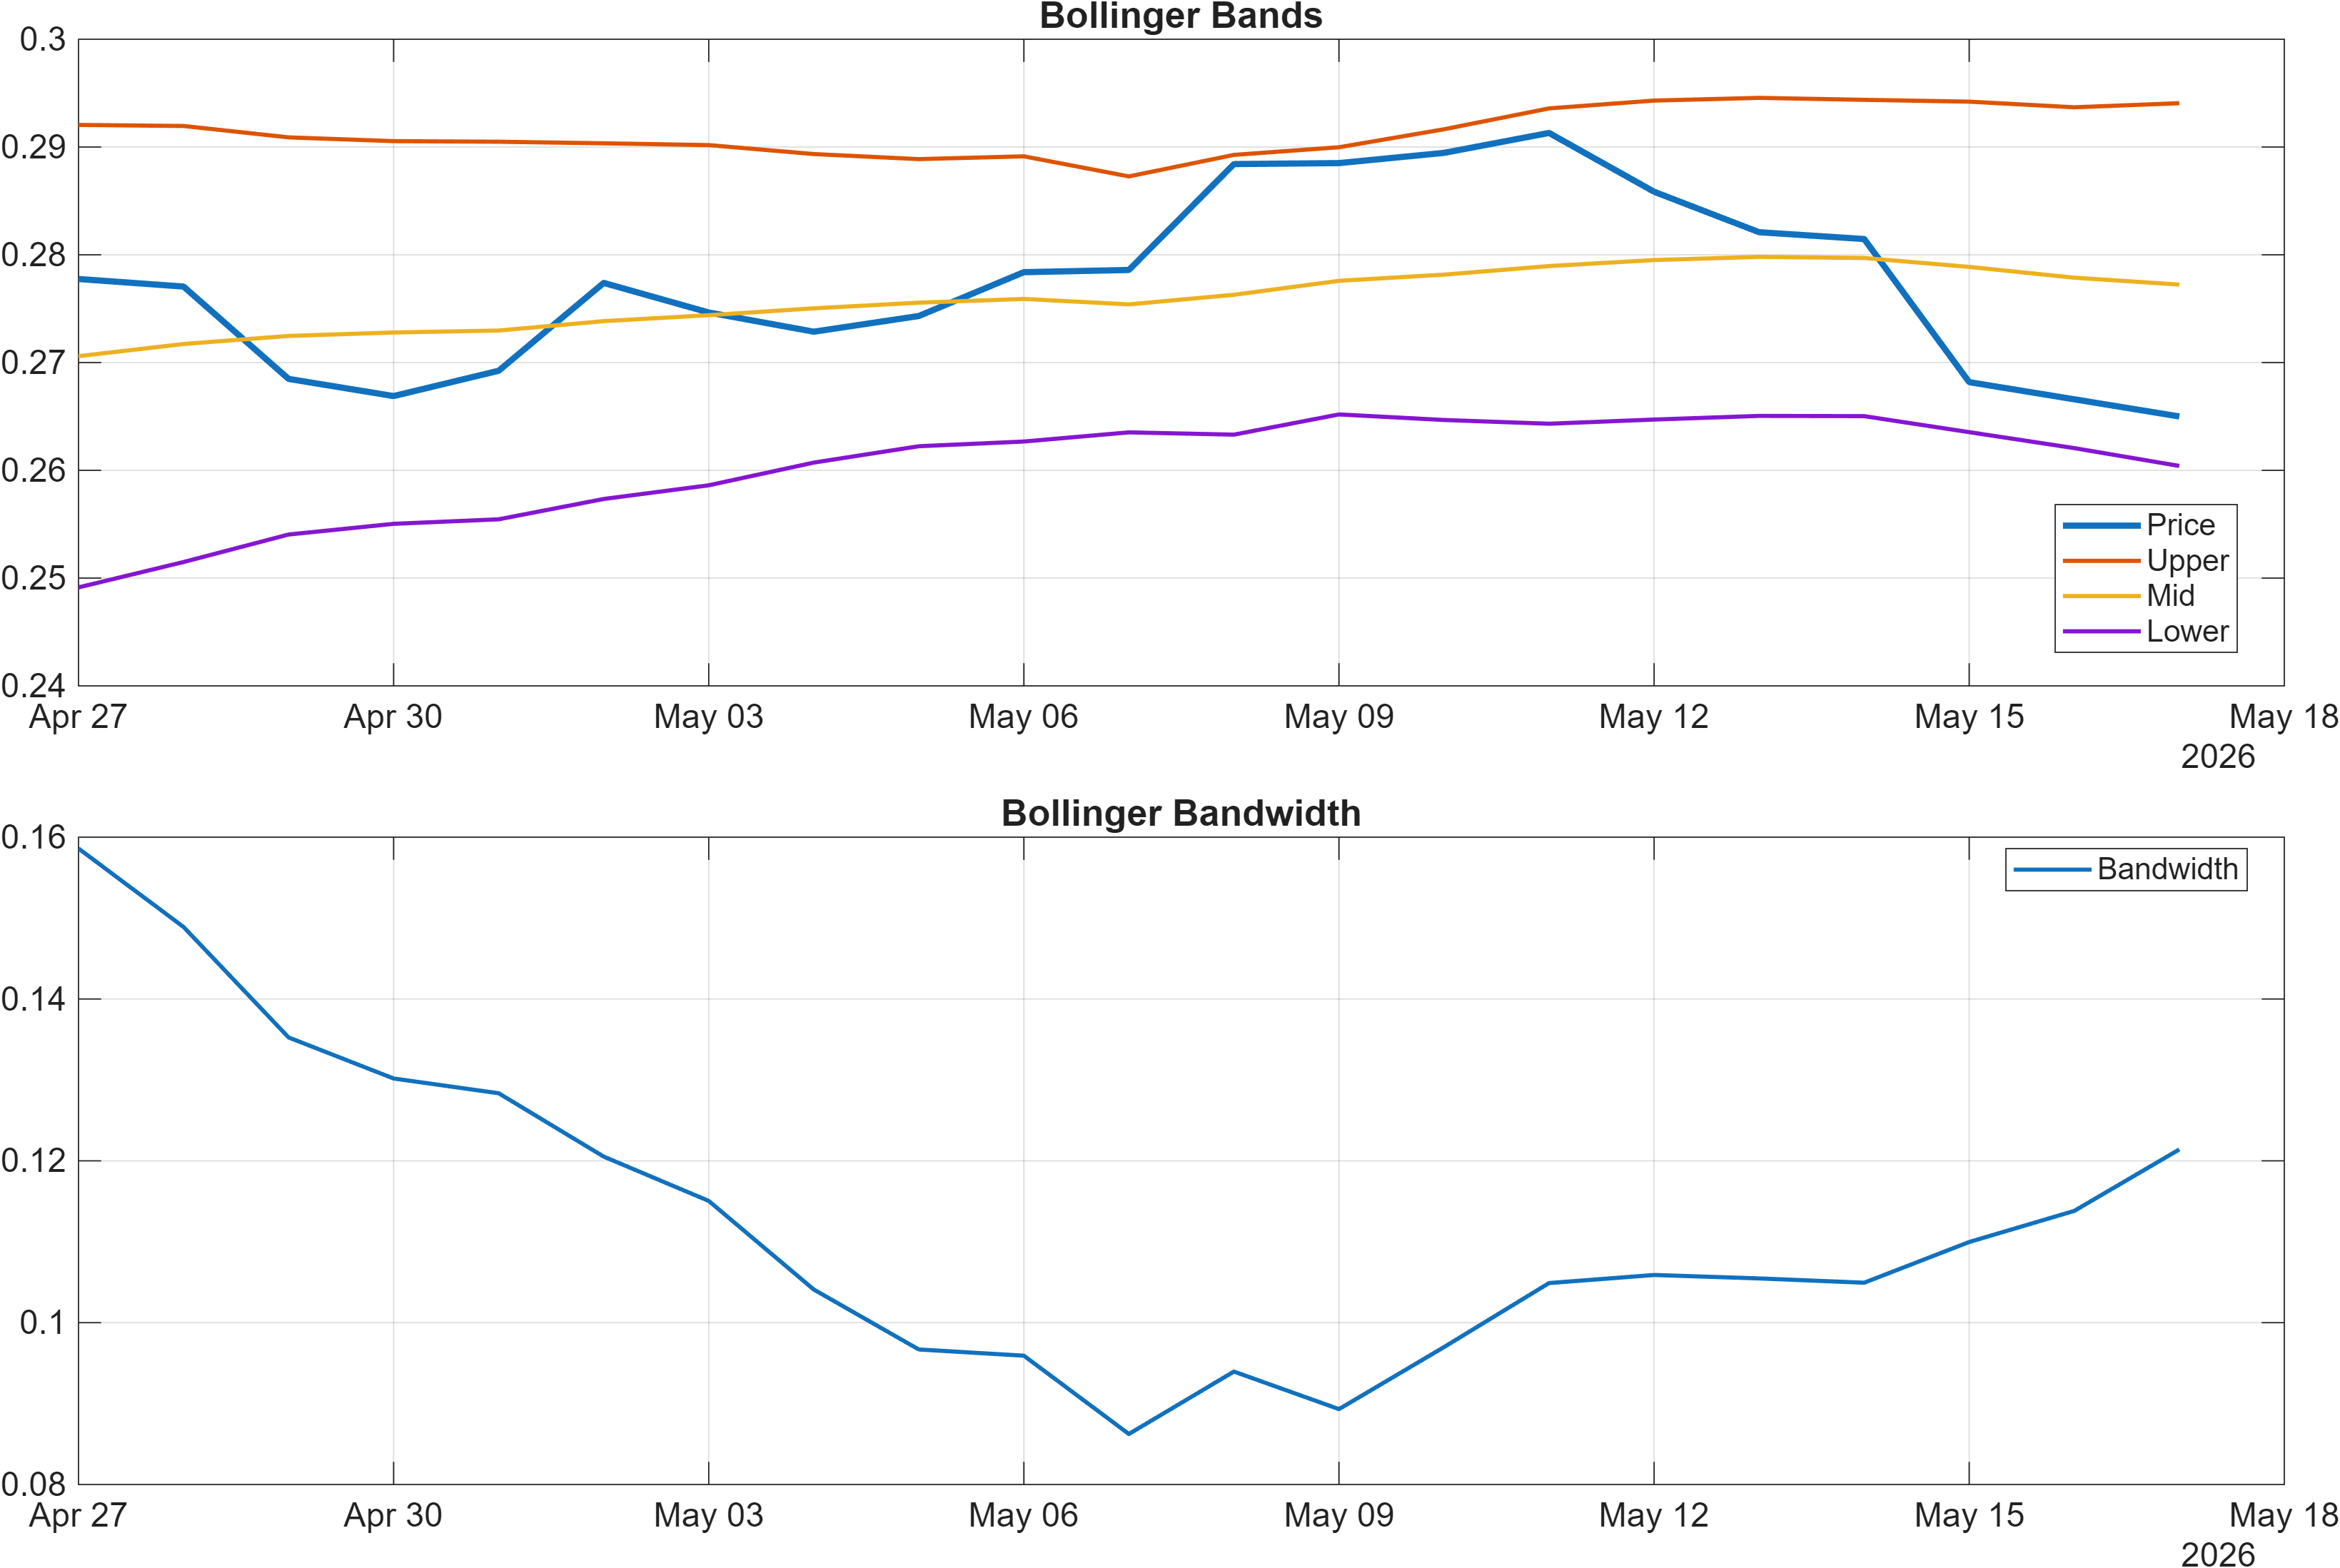
Volatility conditions appear comparatively restrained. Bollinger bandwidth at 0.1214 points to a regime that is not currently in a volatility expansion phase. Practically, this can mean price is compressing within a range, making level-based confirmation (support/resistance) more important than extrapolating from single momentum prints.
If momentum improves while volatility remains contained, breakouts can be prone to reversals. Conversely, if momentum turns up and bandwidth begins to widen, that tends to support a higher-conviction move. For PYR-USD, the present configuration argues for monitoring whether bearish momentum (RSI 39.63; MACD hist -0.0018) can normalize before the market tests key levels again.
Interpretation: RSI bias = Bearish, MACD hist = -0.0018.
Interpretation: Bandwidth (volatility regime) latest = 0.1214.
4) Support / Resistance zones
Support ~ 0.2510 | Resistance ~ 0.3013
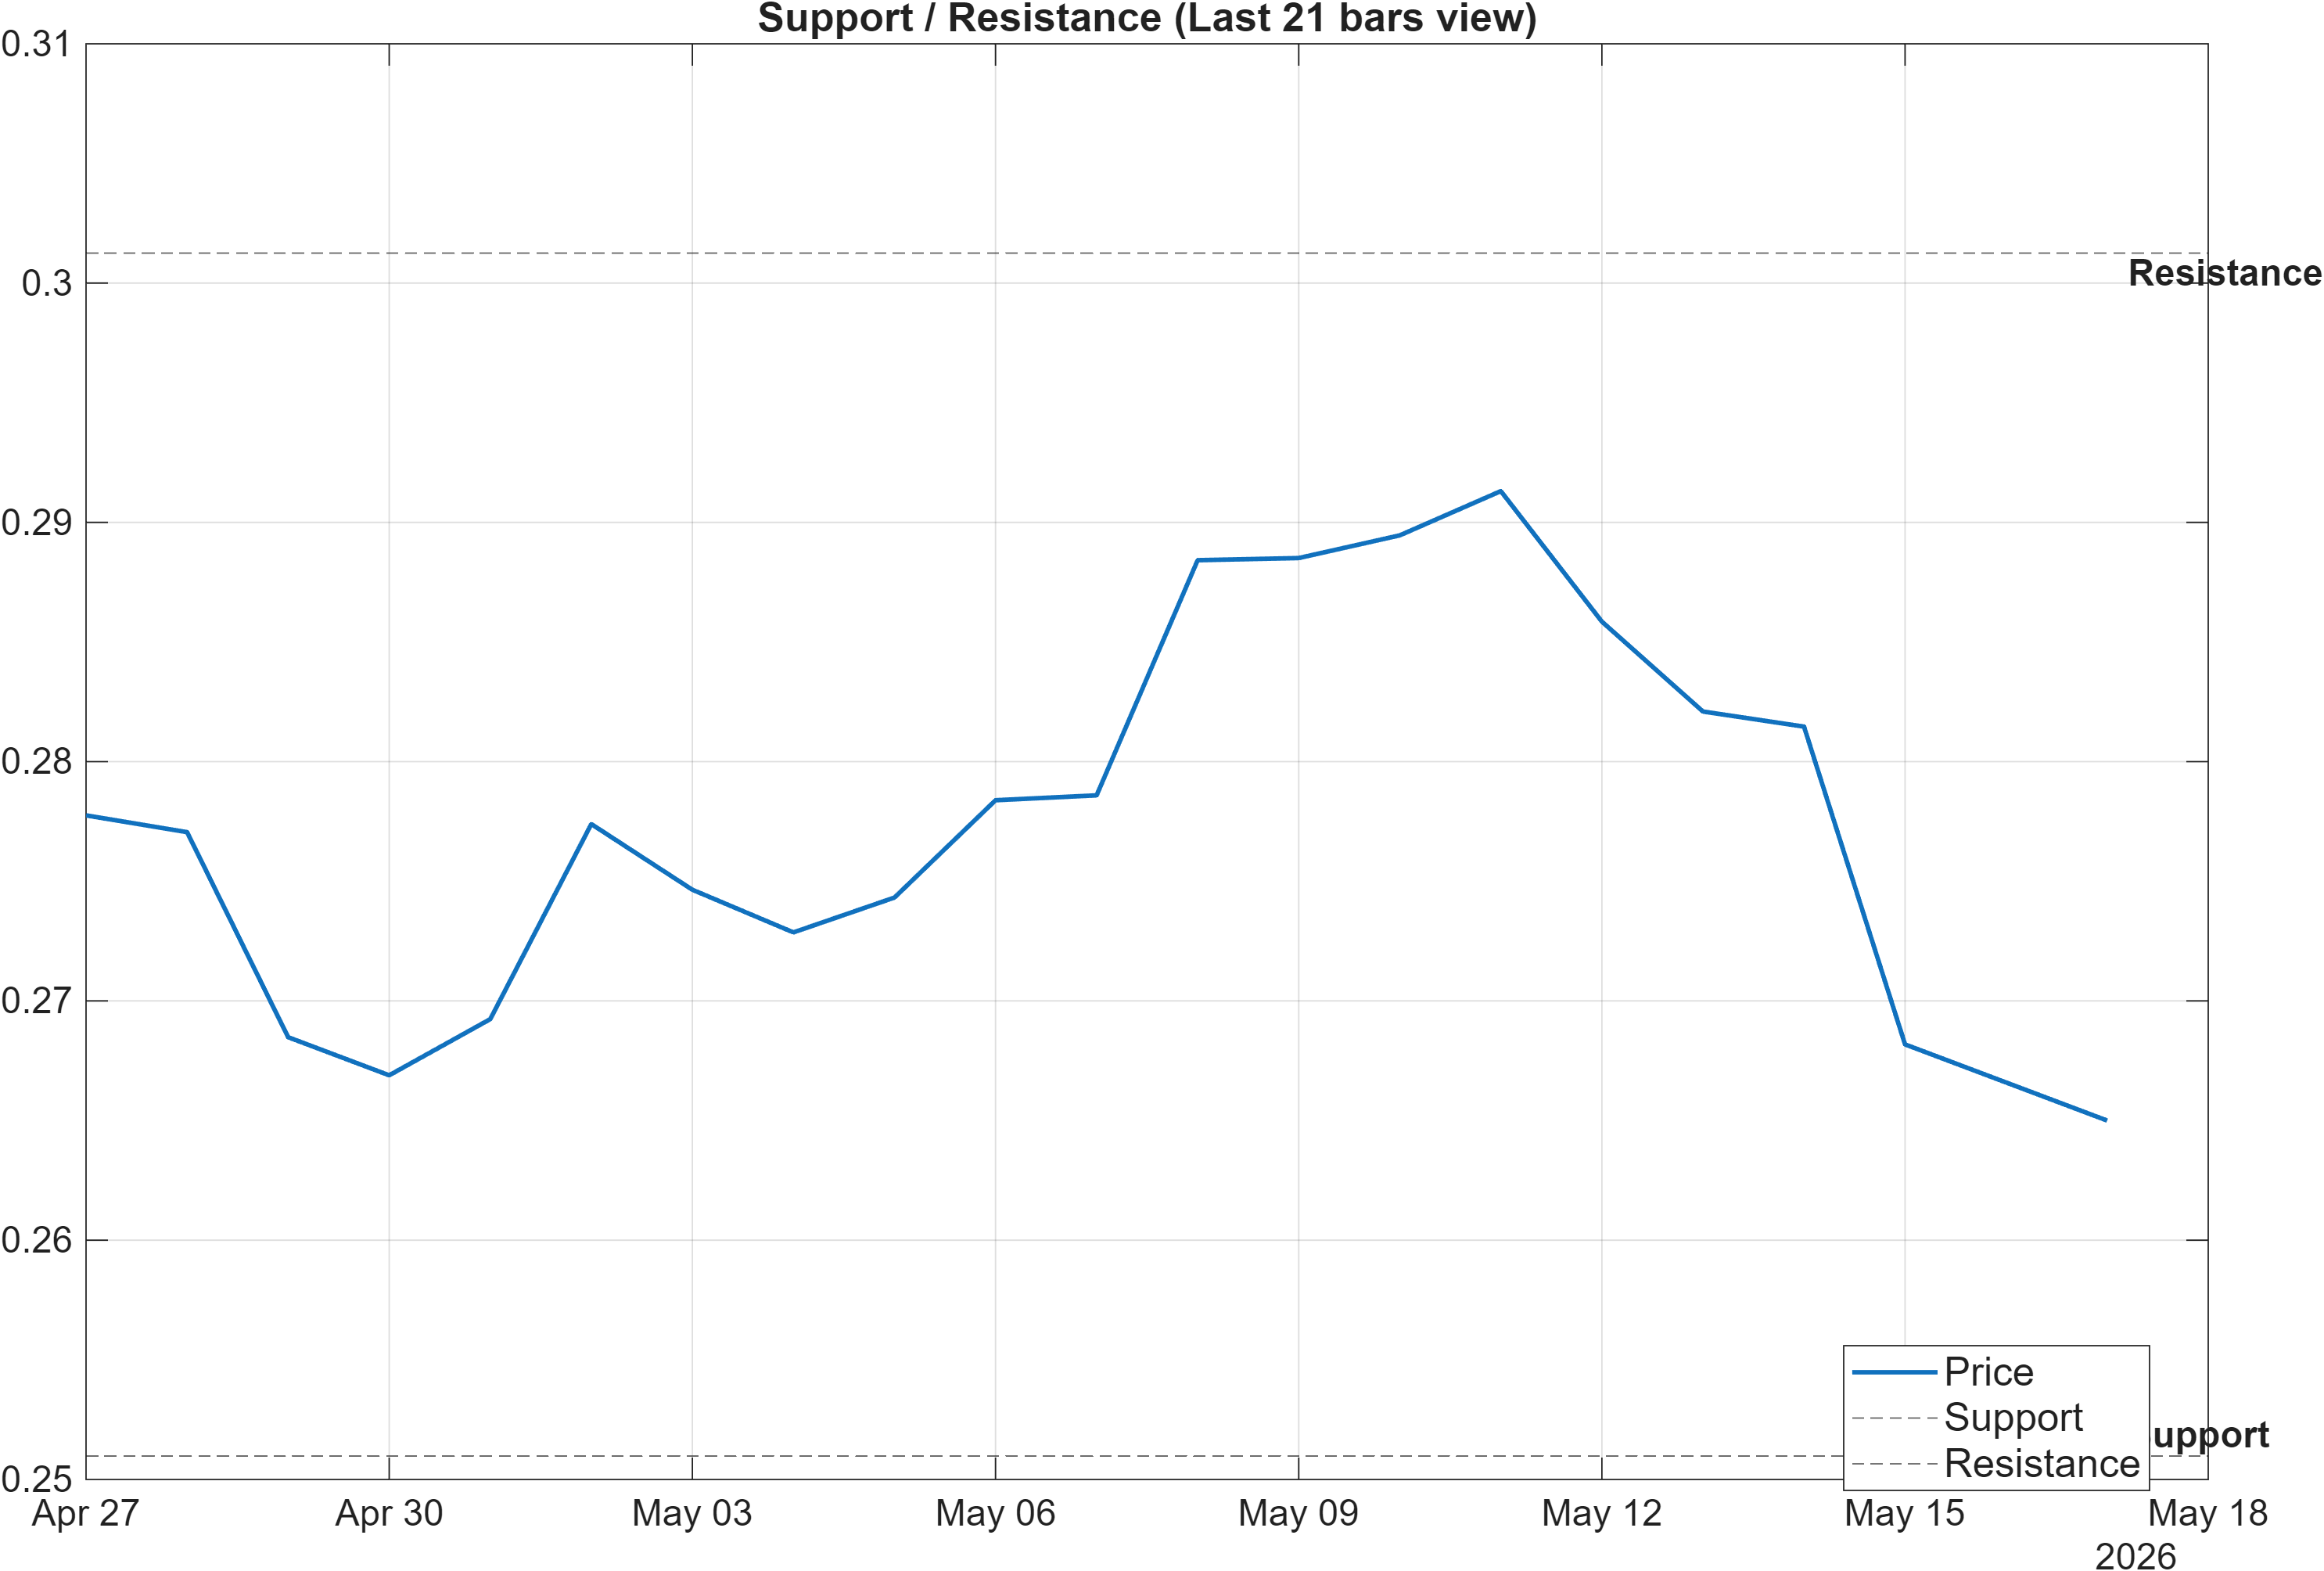
PYR-USD is currently framed by a tight decision band: support near 0.2510 and resistance near 0.3013. With the moving-average stack bearish and momentum readings still soft (RSI(14) 39.63; MACD histogram -0.0018), these levels function less as simple “lines” and more as probabilistic validation zones for whether the market can transition out of weakness.
The resistance zone is important because it can serve as the boundary between a range-bound rebound and a more durable trend repair. A break above 0.3013 that is supported by participation would be consistent with the scenario described in the chart notes (continuation on a break with volume). It would also better align the mid/long-horizon ranks (monthly #27; 3-monthly #48) with observable price structure—reducing the current divergence between ranks and technical confluence.
On the downside, the support zone near 0.2510 carries asymmetric informational value. A close below support is explicitly flagged as deterioration risk, and it would likely reinforce the bearish confluence already visible in the 18-signal blend (-0.342 overall). In that case, the daily rank weakness (#577) would appear less “tactical” and more consistent with a broader downtrend continuation.
Given the moderate bandwidth (0.1214), the market may spend time probing these boundaries without immediate follow-through. The more reliable read comes from whether closes are accepted above resistance or below support, rather than intraday breaches.
Scenario view: Break above resistance with volume → continuation. Close below support → signal deterioration risk.
5) Quant Technical Dashboard (18 Signals)
KGNAI AI Technical Analysis Score (Deep Reinforcement Learning): Rank #493 out of 800 (Rank 1 represents the strongest technical positioning and a higher probability of favorable price behavior. As ranks increase toward the maximum, the probability of favorable outcomes weakens and bearish positioning becomes more dominant.) | Label: Neutral | Score: -0.232
18-Signal Technical Confluence Score: -0.389 (Bearish)
Overall Technical Score (18-signal confluence + DRL rank blend): -0.342 (Bearish)
Note: The blended score reflects signal strength weighted against broader AI technical ranking, which may temporarily diverge.
Blended technical score breakdown: -0.342 (Bearish | Bull 4 / Bear 11 / Neutral 3)
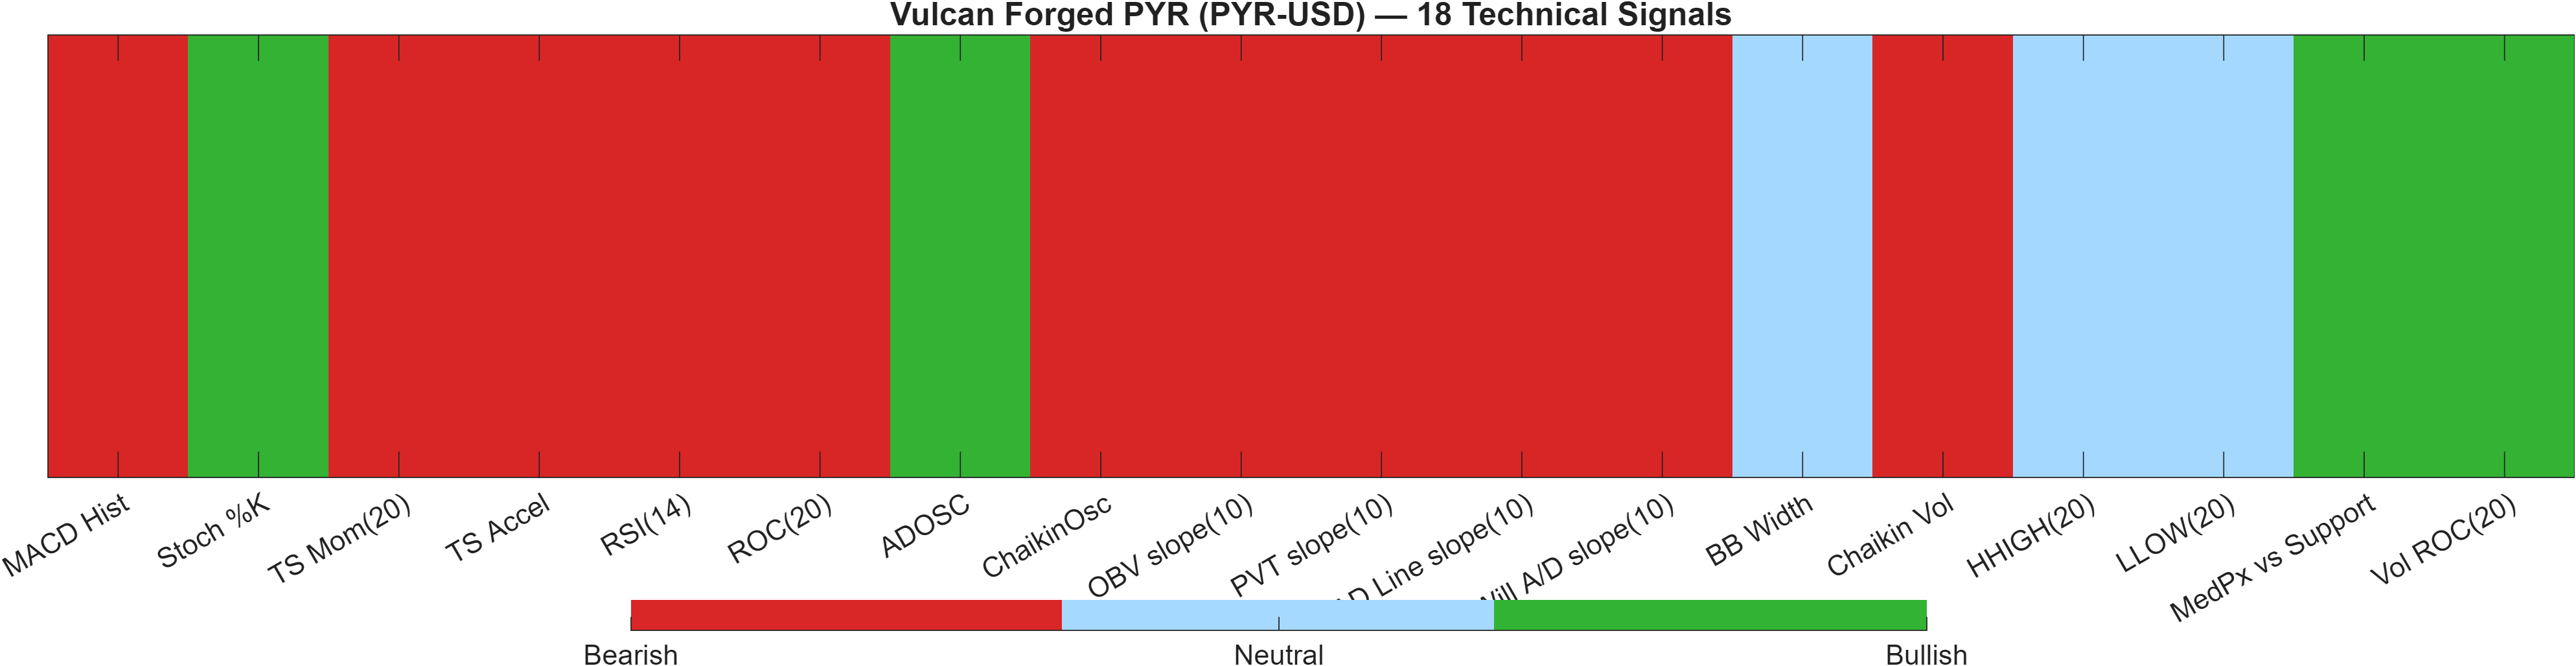
The technical layer is broadly bearish by aggregation, even though the DRL technical rank is labeled neutral. The 18-signal confluence score is -0.389 (Bearish) and the blended overall technical score is -0.342 (Bearish), with a distribution of Bear 11 / Bull 4 / Neutral 3. This indicates the bearishness is not coming from a single indicator, but from a multi-cluster agreement across trend, momentum, and several volume/accumulation measures.
The DRL component adds a useful contrast: Rank #493 out of 800 with a score of -0.232 sits closer to “middle of the pack” than the confluence score might suggest. That kind of divergence can occur when an AI ranking model detects patterns that historically stabilize despite weak spot readings—yet the indicator stack has not confirmed the stabilization in a classical technical sense. For research readers, the practical implication is to treat the current state as low-to-moderate conviction until level-based confirmation arrives.
Signal table (Bull/Bear/Neutral)
| Indicator | Value | Signal |
|---|---|---|
| MACD Hist | -0.001841 | Bearish |
| Stoch %K | 5.15 | Bullish |
| TS Mom(20) | -0.008871 | Bearish |
| TS Accel | -0.03239 | Bearish |
| RSI(14) | 39.63 | Bearish |
| ROC(20) | -4.351 | Bearish |
| ADOSC | 14.42 | Bullish |
| ChaikinOsc | -7.145e+06 | Bearish |
| OBV slope(10) | -6.554e+06 | Bearish |
| PVT slope(10) | -3.023e+05 | Bearish |
| AD Line slope(10) | -1.837e+07 | Bearish |
| Will A/D slope(10) | -0.04751 | Bearish |
| BB Width | 0.1214 | Neutral |
| Chaikin Vol | 51.75 | Bearish |
| HHIGH(20) | 0.3272 | Neutral |
| LLOW(20) | 0.2629 | Neutral |
| MedPx vs Support | 0.02333 | Bullish |
| Vol ROC(20) | 26.59 | Bullish |
A few signal interactions stand out. Momentum and rate-of-change are broadly negative (RSI 39.63; ROC(20) -4.351; TS Mom(20) -0.008871), consistent with a market still repairing. At the same time, selective positives (ADOSC 14.42; Vol ROC(20) 26.59; MedPx vs Support 0.02333) can be interpreted as localized stabilization/participation near support—an early ingredient for reversal attempts, but not sufficient on its own given the heavier bearish count.
Interpretation: Indicator-level signals form the base confluence, which is then adjusted using a separate AI-driven technical ranking model. The final technical score summarizes this combined view.
6) News sentiment + extractive gist
Note: Instrument-specific news matches were not found, so the digest includes broader market/sector headlines. Links are provided for verification.
Sentiment score (avg): 0.037 | Positive: 12% | Neutral: 88% | Negative: 0%
KGNAI AI News Sentiment Score (normalized -1 to +1): Not available (as of —) | Label: Not available | Overall news score: 0.04
Positive Developments
Recent coverage across major financial outlets indicates a mildly constructive tone for crypto markets, but with the emphasis more on context than on asset-specific catalysts for PYR-USD. The sentiment mix is skewed neutral (88%) with a small positive allocation (12%), consistent with a market narrative that is not decisively risk-on. Mentions of policy and regulatory developments (including references to legislative progress) can support background confidence, particularly when paired with the stronger longer-horizon ranks for PYR-USD (monthly #27; 3-monthly #48). In parallel, discussion of potential catalysts for larger-cap crypto assets may contribute to broader sector attention, which can indirectly influence smaller instruments through liquidity and correlation channels. Still, this is best treated as supportive backdrop rather than a driver, especially while technical confluence remains bearish (-0.342 overall).
Neutral / Mixed Developments
The dominant feature of the sentiment read is low polarity: an average score of 0.037 and overall news score of 0.04 are consistent with “wait-and-see” positioning. Coverage themes lean toward macro-financial mechanics—liquidity conditions, rate dynamics, and positioning—rather than project-level updates (not available in the provided data for PYR-USD). In practice, that kind of narrative environment often results in range behavior where price action becomes more sensitive to technical levels such as support ~0.2510 and resistance ~0.3013. For readers, the most useful takeaway is that news flow is not currently providing a strong directional impulse; therefore, confirmation should come primarily from price/volume behavior and whether bearish momentum indicators (RSI 39.63; MACD hist -0.0018) begin to normalize.
Negative / Risk Signals
Risk framing in the broader crypto news cycle remains present, primarily through references to drawdowns in benchmark assets and the influence of tighter liquidity conditions. Even with 0% negative in the provided sentiment split, the extracted themes include stress signals such as dislocation risk discussions and renewed downside testing in major crypto prices. For PYR-USD, these macro-linked narratives matter because they can amplify the existing bearish technical posture (11 bearish signals; close vs MA50 bearish; MA50 vs MA200 bearish), especially if correlation rises during selloffs. The main risk is that a weak tape turns the defined support zone (~0.2510) into a failure point, which would align short-horizon weakness (daily #577) with a more persistent downtrend. In that environment, a resistance reclaim near 0.3013 becomes harder without a clear improvement in participation.
What to monitor next
- Whether broader liquidity/rate narratives coincide with a volatility pickup (BB Width 0.1214) that confirms a directional move.
- Whether benchmark-crypto weakness translates into a decisive test of support ~0.2510.
- Whether policy/regulatory tone improves risk appetite enough to support a break above ~0.3013 with volume.
Sources referenced: Reuters, Bloomberg, Yahoo Finance, MarketWatch, Investing.com
Snapshot: AI Rank (Short–Mid–Long): Mixed (Bullish tilt) (Neutral–Bullish–Bullish) · Technical Confluence: Bearish · Key Levels: Support ~0.25 | Resistance ~0.30 · News Sentiment: Neutral
7) Sources
Instrument-specific news matches were not found in the provided data; the sentiment digest reflects broader market/sector coverage. Original source links were present in the draft but are not reproduced here.
You may also like: How KGNAI AI ranks instruments across global markets
Disclaimer: KGNAI provides AI-generated analytics and educational market commentary only. This is not financial advice. Markets involve risk. Always do your own research.