
ARPA-USD (ARPA Chain) Technical & Rank Update — Mixed Alignment with Neutral-Biased Structure (22-Feb-2026)
ARPA-USD enters this snapshot with rank strength skewed toward the mid-to-long horizon, while shorter-term market structure remains more conflicted. Within the 800-instrument crypto universe, ARPA-USD holds a Daily rank of #56 (upper decile) and a 3-Monthly rank of #28, yet the Weekly rank at #200 signals consolidation rather than uniform trend follow-through. Technically, the blended view is Neutral (Overall Technical Score -0.118) despite a distinctly weak DRL technical rank (#661)—a divergence that often appears when indicator-level signals improve before broader trend models confirm. Momentum tools are not extended (RSI(14) 47.97), while the volatility regime (Bollinger bandwidth 0.1532) suggests conditions where a directional move can reassert once price resolves key zones. The nearby decision levels remain support ~0.0096 and resistance ~0.0151.
- Rank stance: Short Neutral | Mid Bullish | Long Bullish (Daily #56, Monthly #69, 3-Monthly #28; Weekly #200)
- Technical confluence label: Neutral (18-signal score 0.111; blended -0.118) with DRL model divergence (Rank #661, Score -0.653)
- Key levels: Support ~ 0.0096 | Resistance ~ 0.0151
- News sentiment bias: Neutral (avg 0.037; normalized -0.05; Negative 0%)
- Confirmation / invalidation: Continuation bias improves on a break above 0.0151 with volume; deterioration risk increases on a close below 0.0096.
KGNAI evaluates assets using large cross-sectional datasets built from millions of structured data points. Inputs incorporate fundamental metrics, technical structures, and systematically processed news sentiment. Statistical models, machine learning, and AI frameworks are used to assess relative positioning, signal alignment, and probabilistic behavior across broad universes.
- Ranks are comparative across the tracked universe, not absolute price targets.
- Confluence reflects alignment among independent signal groups.
- Support/resistance levels are probabilistic decision zones, not guarantees.
- Sentiment provides contextual bias within the broader analytical framework.
1) KGNAI AI Analysis
ARPA-USD is evaluated within the CRYPTO region against a total universe size of 800 ranked instruments. The rank stack is notable for timeframe asymmetry: the Daily rank (#56) and 3-Monthly rank (#28) sit in stronger territory, while the Weekly rank (#200) falls closer to the middle of the distribution. This configuration often reflects an instrument attempting to stabilize or rotate after a prior move, where shorter horizon signals improve sooner than weekly aggregation confirms.
- Daily rank: #56 out of 800 — Bullish
- Weekly rank: #200 out of 800 — Neutral
- Monthly rank: #69 out of 800 — Bullish
- 3-Monthly rank: #28 out of 800 — Bullish
The term view supplied in the snapshot (Short-term: Neutral; Mid-term: Bullish; Long-term: Bullish) is consistent with that uneven rank gradient. Practically, the strongest signal is not “one direction across all horizons,” but rather a probabilistic tilt toward better behavior as the lookback extends—provided near-term structure does not break.
From a portfolio-construction perspective, this kind of profile typically warrants tighter process discipline: the rank system suggests ARPA-USD is not in the lower third where persistent weakness is more common, but the weekly neutrality implies confirmation still matters. That is particularly relevant given later sections show a Neutral blended technical score (-0.118) alongside a weak AI technical rank (#661), reinforcing that the rank edge is present, but not yet fully corroborated by broader trend modeling.
2) Price & trend overview
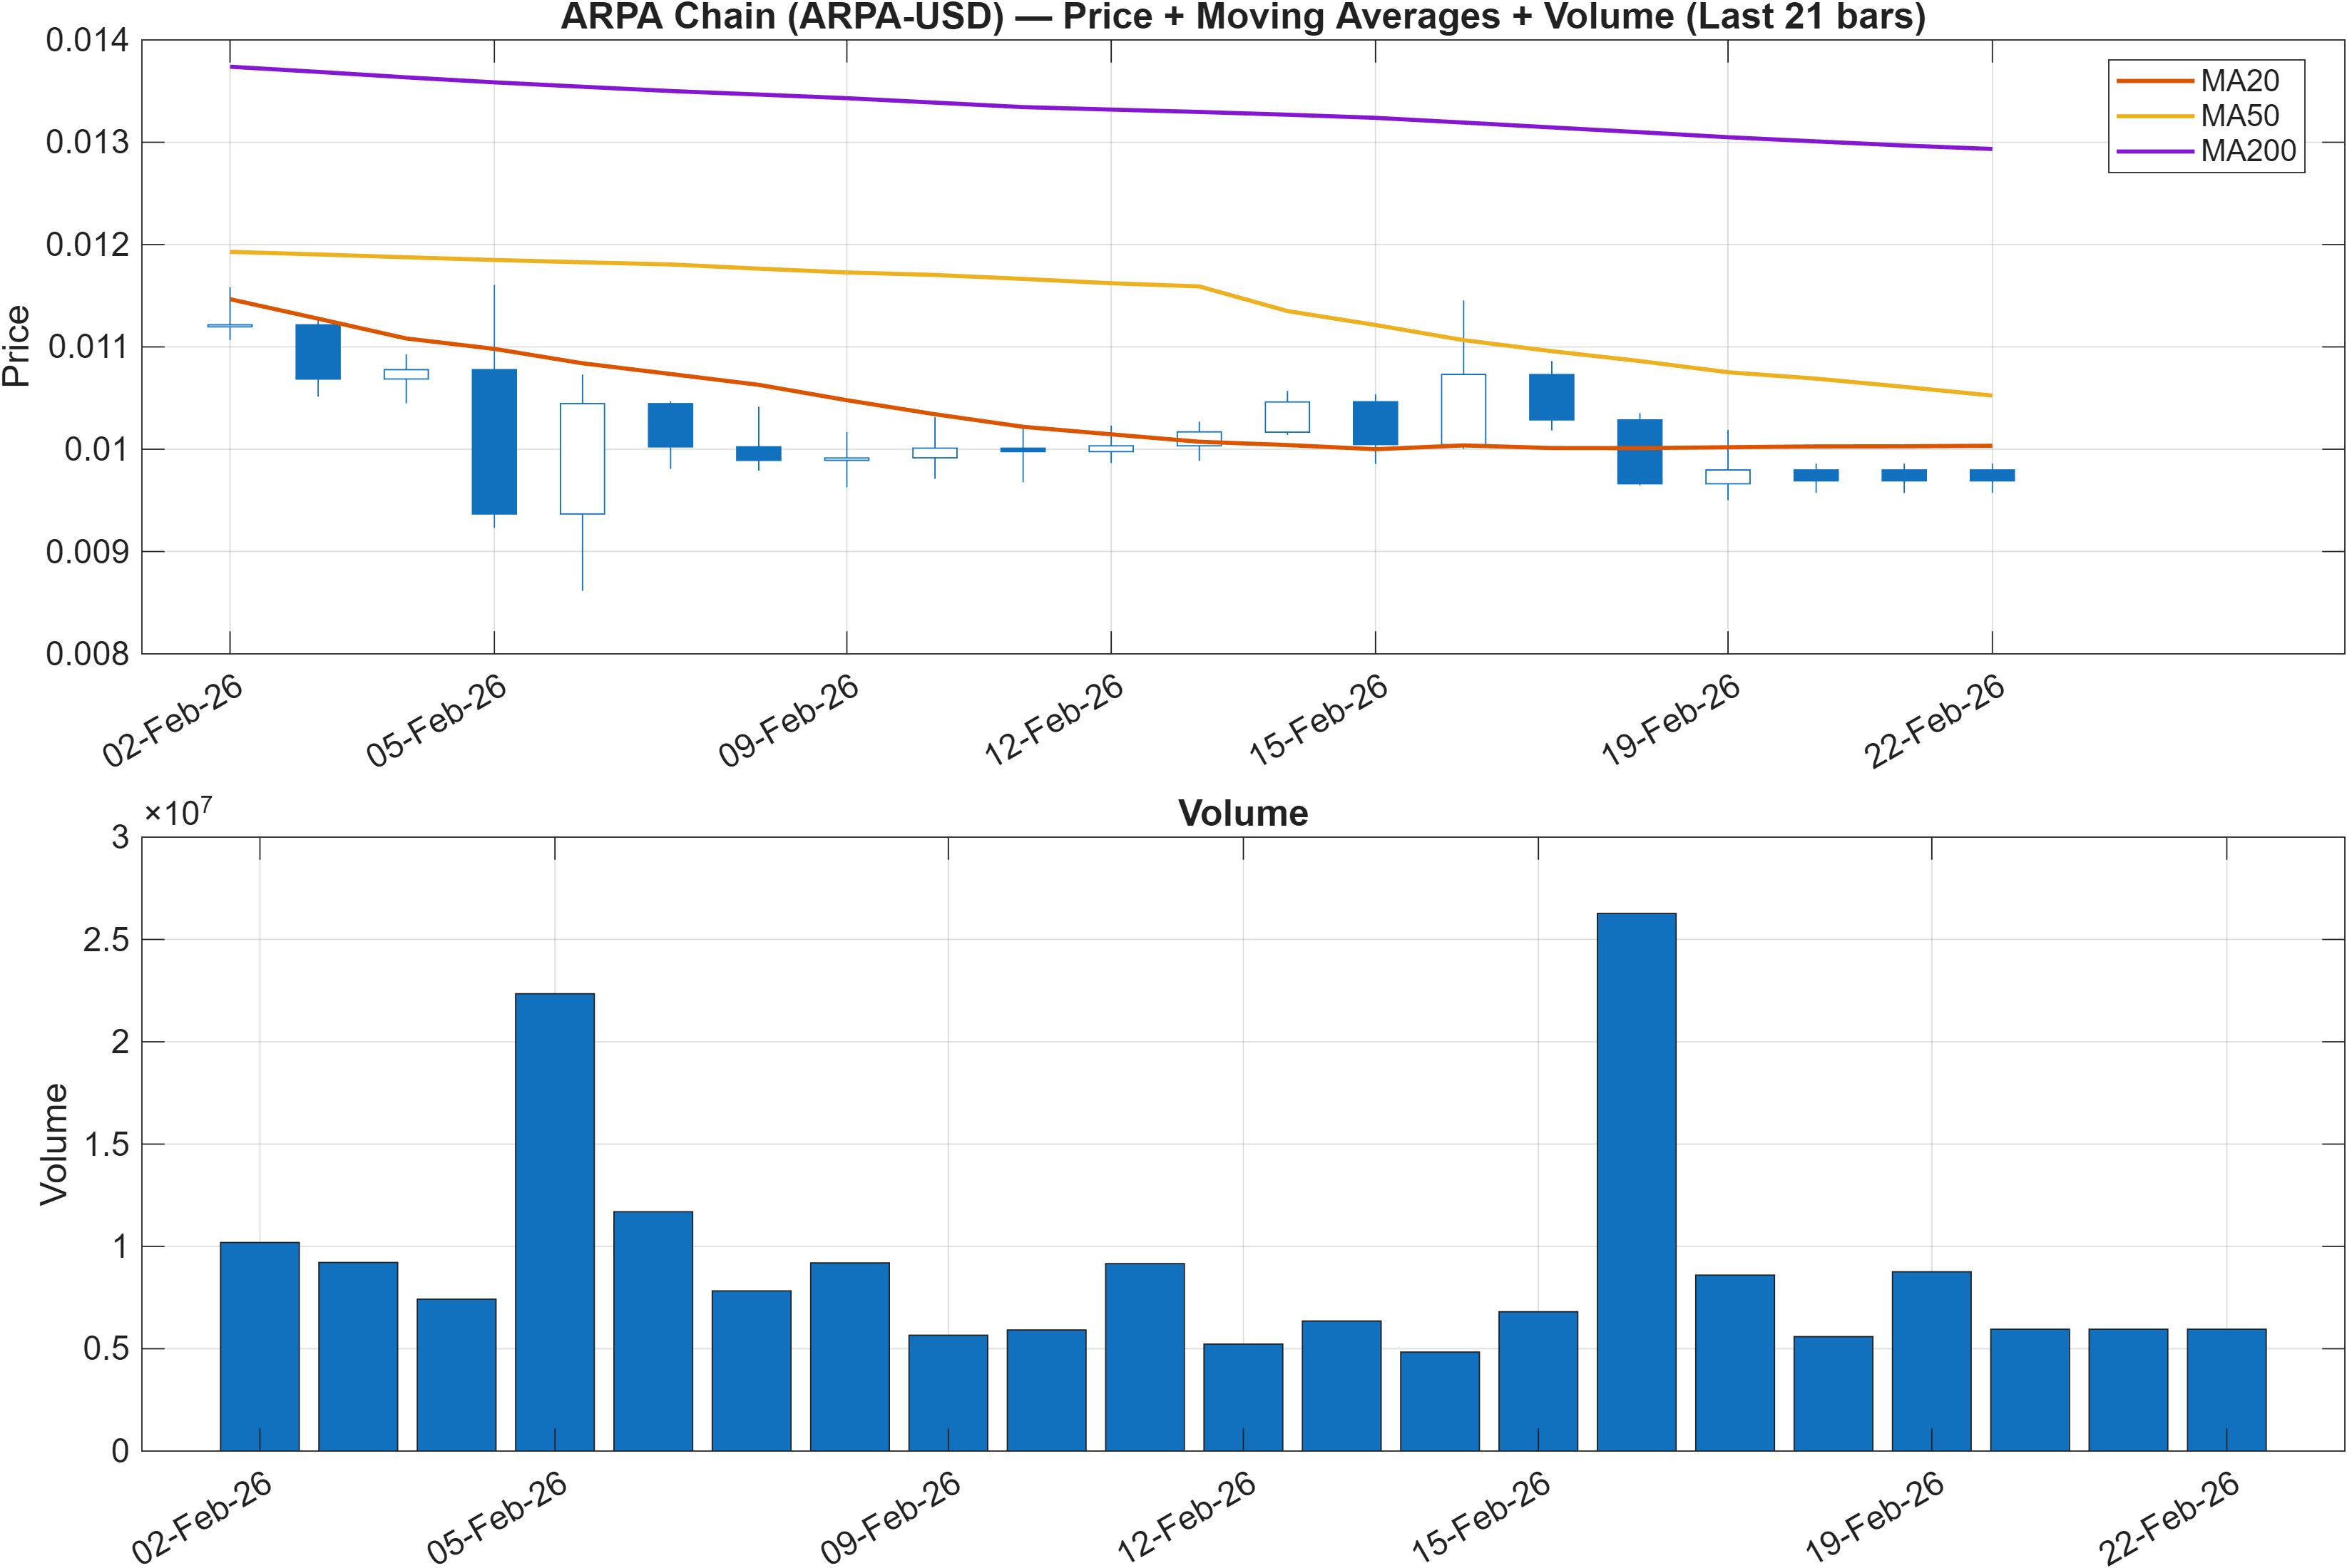
The trend read is explicitly bearish on moving-average structure: Close vs MA50 = Bearish and MA50 vs MA200 = Bearish. This places the current tape in a regime where rallies can face friction until the shorter average reclaims the longer-term directionality, or at least until price re-establishes above the medium-term reference line.
That bearish MA alignment creates a productive tension with the rank picture: the Daily rank #56 and 3-Monthly rank #28 imply improving relative behavior, yet the trend backbone still leans defensive. When ranks strengthen into the upper decile while MA structure remains bearish, the market is often in a transition state—either early stabilization (where follow-through is possible) or a counter-trend bounce that fails under structural resistance.
This is where participation measures later in the dashboard become relevant. The signal table includes volume/flow proxies that lean constructive (for example, OBV slope(10) and PVT slope(10) are marked Bullish), while Vol ROC(20) -35.39 is Bearish. That mix often indicates price attempting to build a base with inconsistent volume acceleration.
Until the MA framing improves, ARPA-USD remains best treated as a market where breakout confirmation (relative to the nearby resistance band) is more informative than assuming persistence from ranks alone.
3) Momentum & volatility dashboard
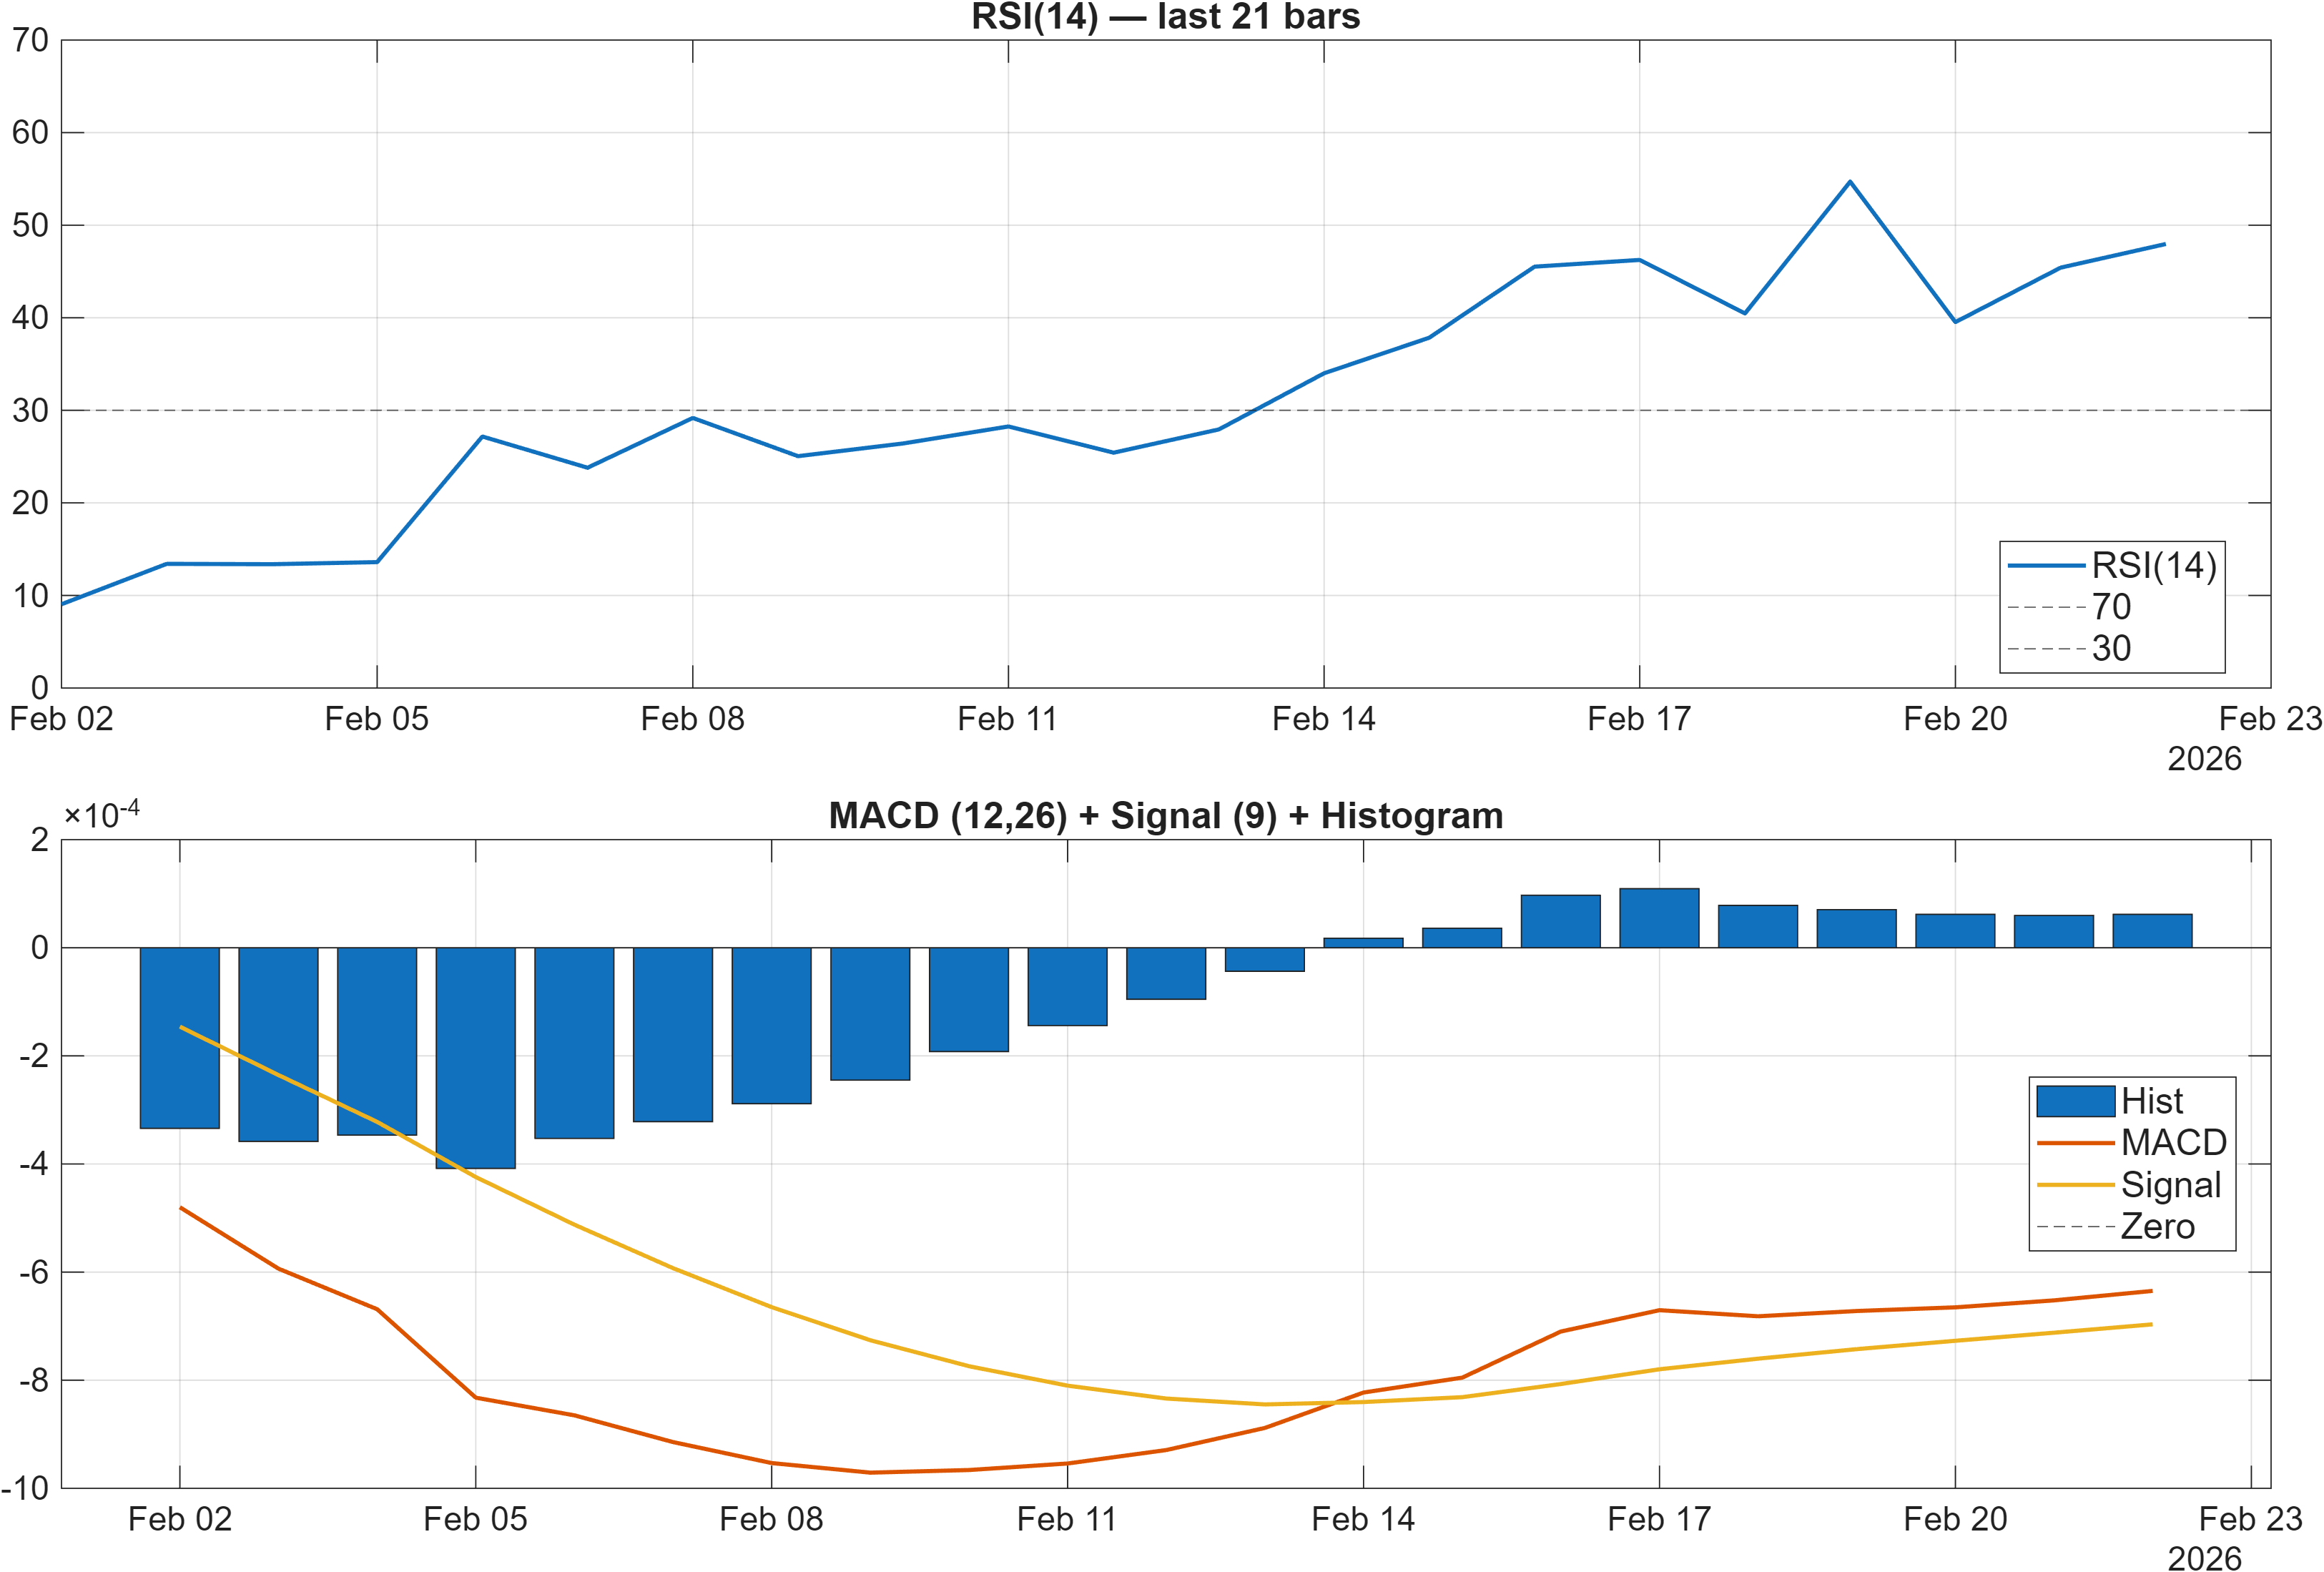
Momentum is currently non-committal rather than stretched. The snapshot flags RSI bias = Neutral, with RSI(14) at 47.97, which typically corresponds to a market not yet in overbought/oversold territory. In transitional regimes, a neutral RSI can be helpful: it leaves room for either a trend resumption or a failure, and it reduces the likelihood that a reversal signal is merely a mean-reversion from an extreme.
MACD is marginally constructive at the histogram level (MACD hist = 0.0001; and the signal table shows MACD Hist 6.186e-05 as Bullish). However, other momentum/ROC lenses are less supportive, including ROC(20) -8.621 and TS Mom(20) -0.0009951 (both Bearish). That combination often reflects early improvement in short-cycle momentum while the intermediate window still prices prior weakness.
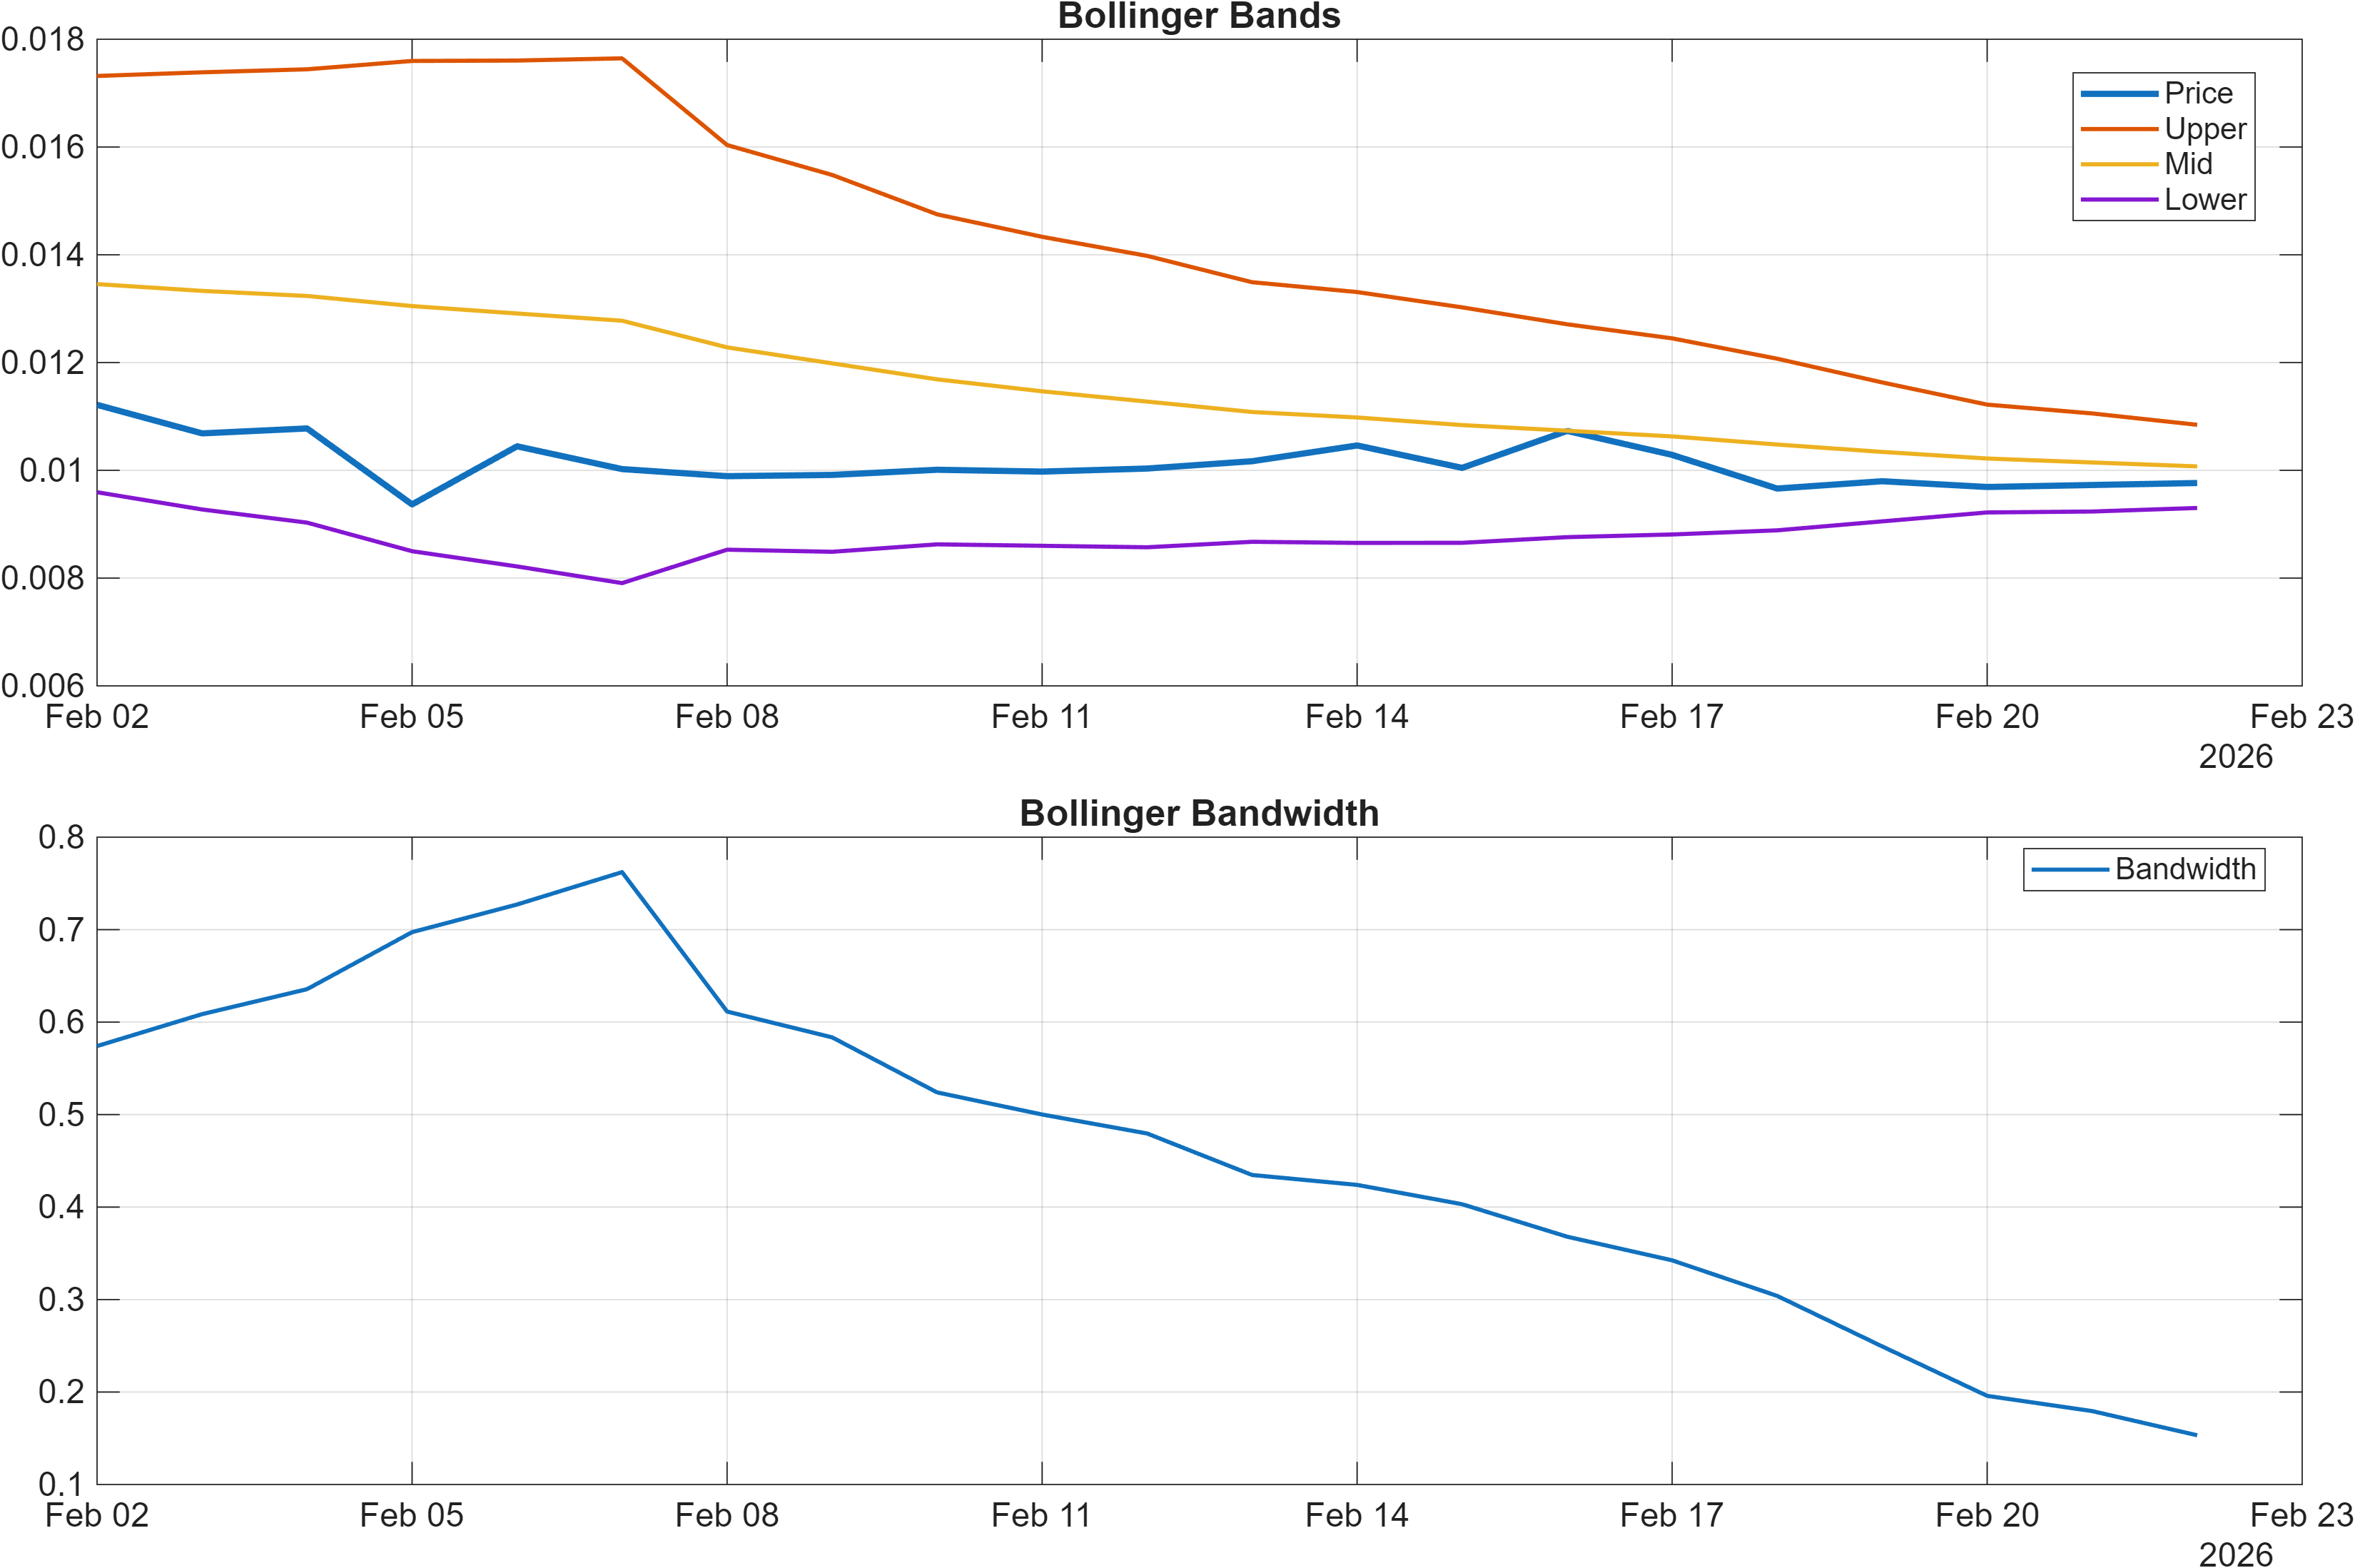
Volatility conditions add important context. Bollinger bandwidth is 0.1532, and the dashboard interpretation ties it to the current volatility regime. In practice, bandwidth levels are less about direction and more about compression vs expansion: when volatility is not extreme and momentum is mixed, price can become sensitive to threshold breaks (support/resistance) because incremental order flow can move the market more efficiently.
Overall, the momentum-volatility stack looks like a market waiting on confirmation: modest positive MACD tone, neutral RSI, and a bandwidth regime where resolution tends to matter more than oscillator “readings” in isolation.
4) Support / Resistance zones
The primary decision zones are clearly defined: Support ~ 0.0096 and Resistance ~ 0.0151. With the moving-average structure still bearish (Close vs MA50 bearish; MA50 vs MA200 bearish), these levels function less like static lines and more like stress tests for whether the market is transitioning into a stronger regime.
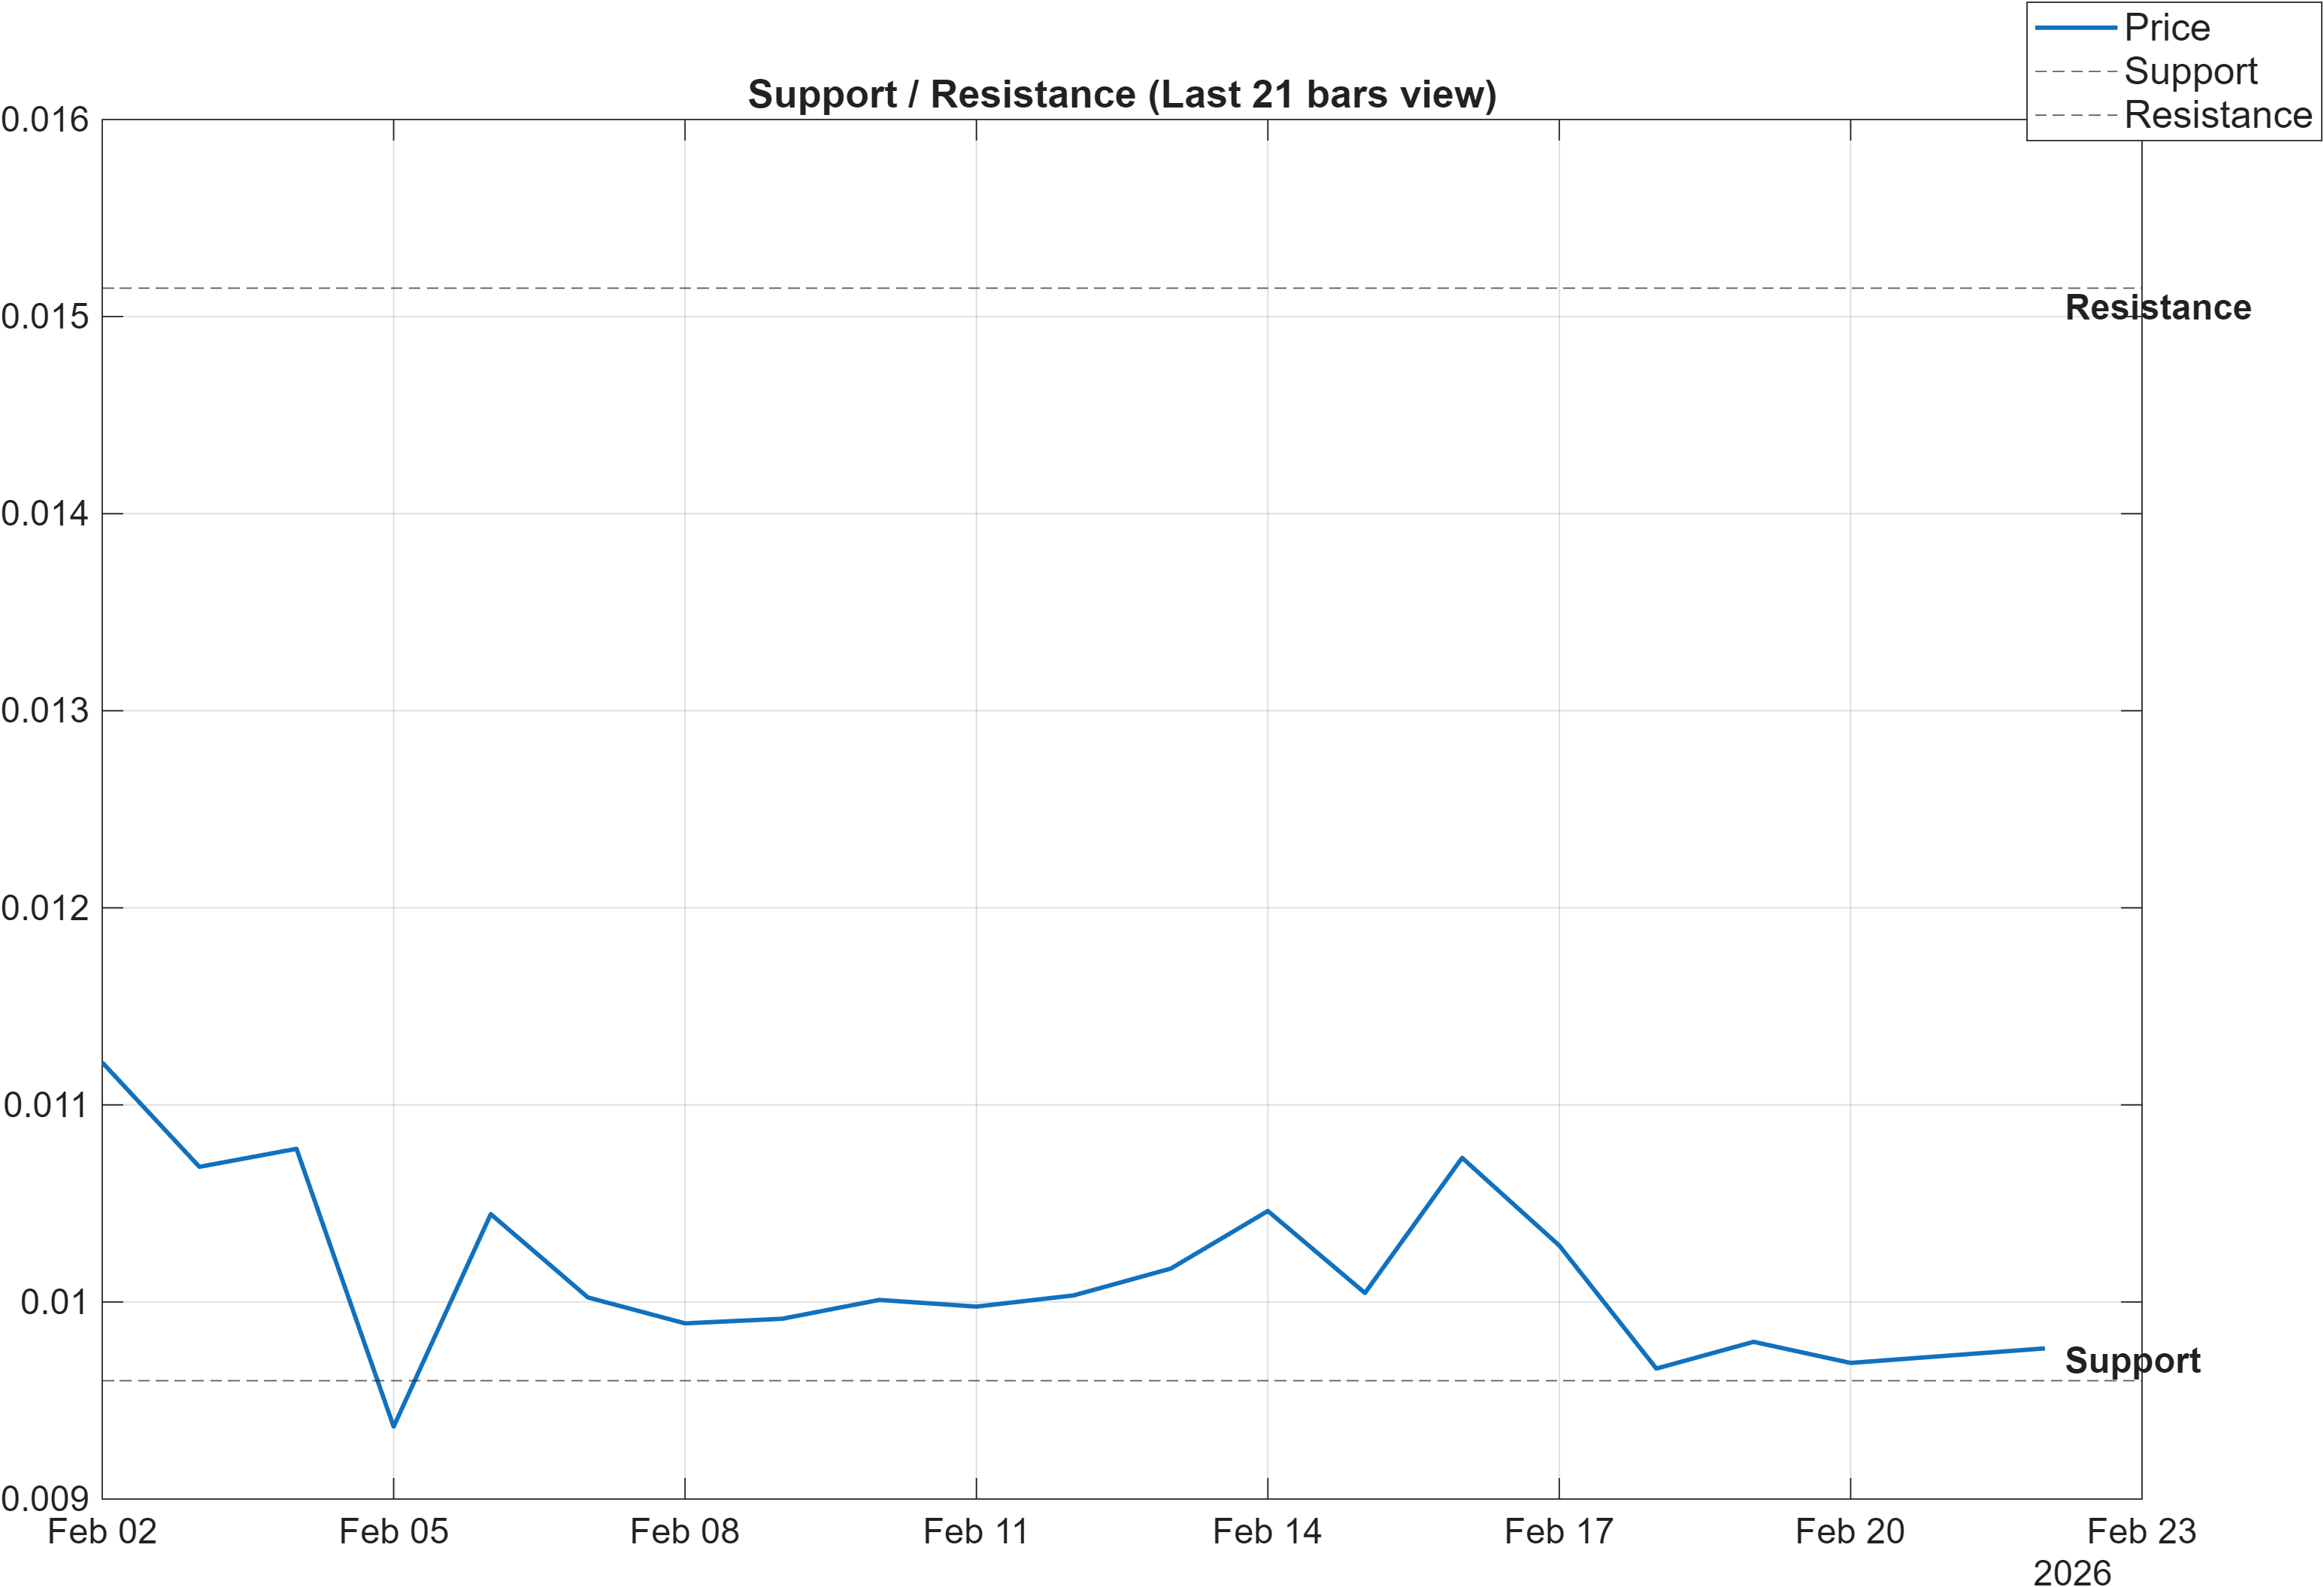
The scenario framing provided is appropriately conditional: break above resistance with volume → continuation, while a close below support → signal deterioration risk. This aligns with the dashboard’s internal split—several participation/flow measures are constructive (e.g., Bullish signals on OBV slope and PVT slope), but volume acceleration is weak (Vol ROC(20) -35.39, Bearish). In that environment, a break that is not accompanied by participation can be more prone to reversal.
There is also a micro-structure hint in the signal table: MedPx vs Support 0.0001156 is Bullish, which supports the idea that price is not currently behaving as if the support zone is being persistently lost. At the same time, the 20-day high/low references (HHIGH(20) 0.01161, LLOW(20) 0.008615, both neutral) imply the market may still be working through a range rather than trending cleanly.
Net: these levels are the operational map. The closer price trades to 0.0151 without rejection, the more likely the neutral technical stance can improve; a failure through 0.0096 would bring the weak trend framework back to the foreground.
5) Quant Technical Dashboard (18 Signals)
KGNAI AI Technical Analysis Score (Deep Reinforcement Learning): Rank #661 out of 800 (Rank 1 represents the strongest technical positioning and a higher probability of favorable price behavior. As ranks increase toward the maximum, the probability of favorable outcomes weakens and bearish positioning becomes more dominant.) | Label: Bearish | Score: -0.653
18-Signal Technical Confluence Score: 0.111 (Neutral)
Overall Technical Score (18-signal confluence + DRL rank blend): -0.118 (Neutral)
Note: The blended score reflects signal strength weighted against broader AI technical ranking, which may temporarily diverge.
Blended technical score breakdown: -0.118 (Neutral | Bull 8 / Bear 6 / Neutral 4)
The most informative feature of this dashboard is the model divergence. The 18-signal confluence is 0.111 (Neutral) and the blended overall score is -0.118 (Neutral), yet the DRL technical rank is deeply weak at #661 with a -0.653 score and a Bearish label. When confluence and DRL disagree, it often means the indicator layer is seeing incremental improvement while the broader regime model still prices the prevailing downtrend structure.
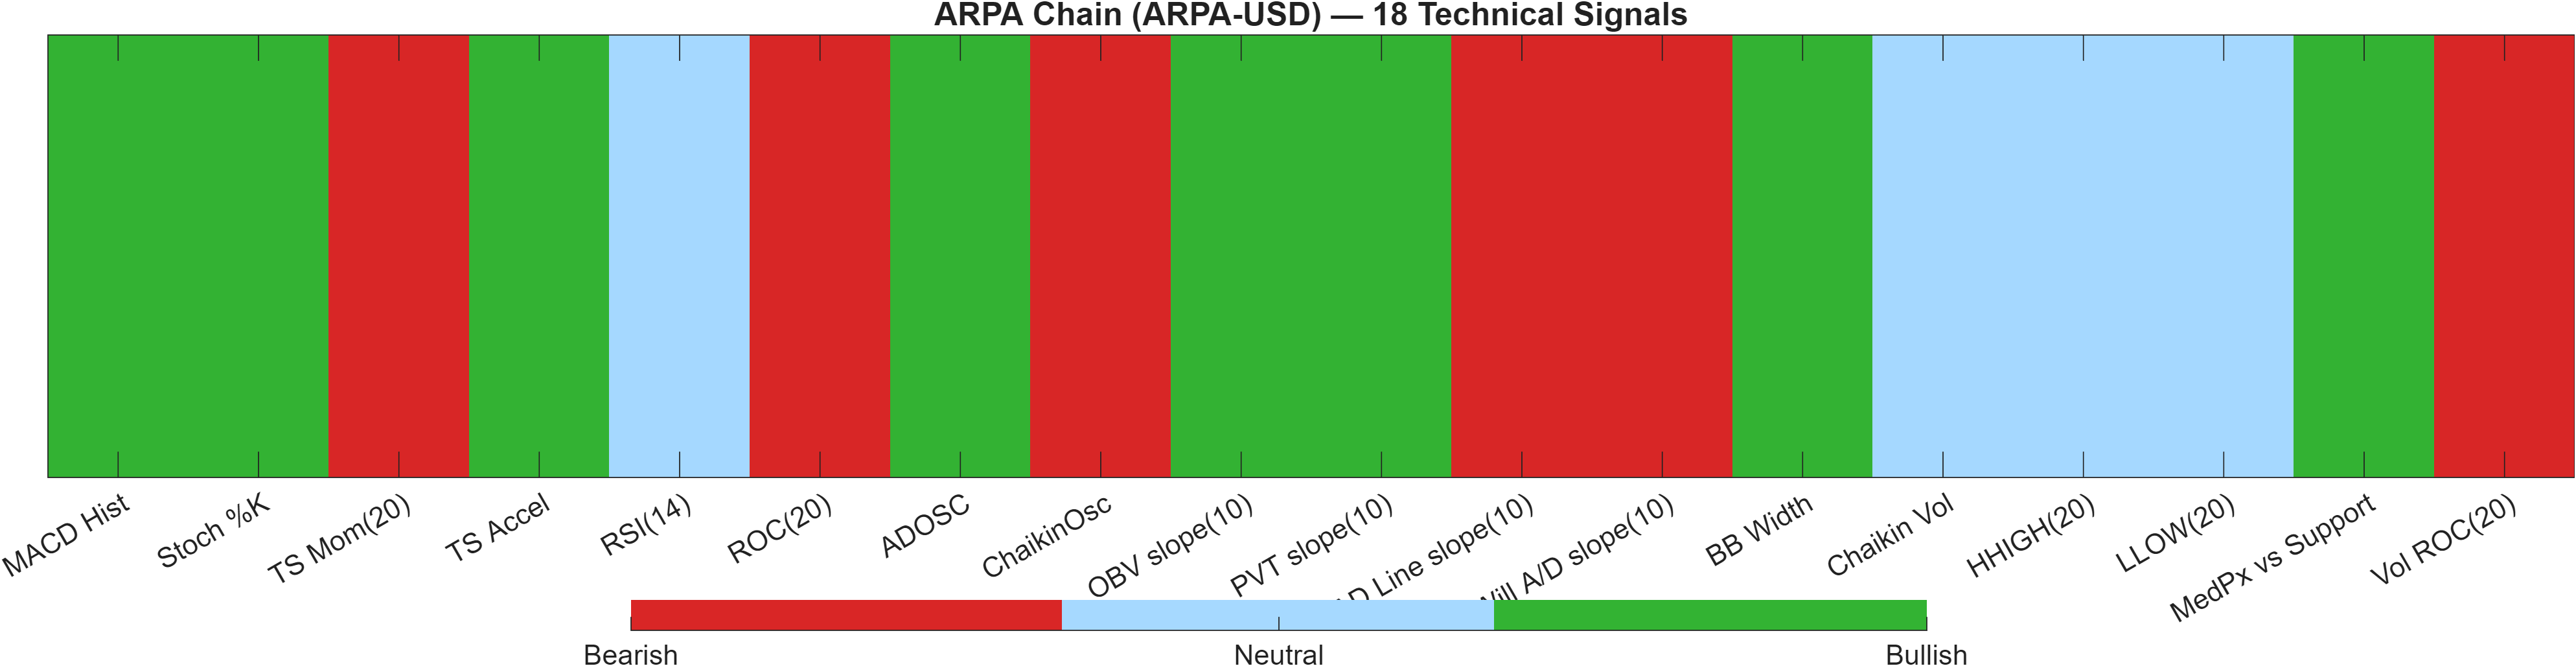
Signal-level alignment: participation strength vs rate-of-change drag
The internal composition helps explain why the confluence is neutral rather than bearish. Several flow/participation measures are constructive—ADOSC 31.31 is Bullish, and OBV slope(10) 1.927e+07 and PVT slope(10) 1.11e+06 are also Bullish. This pattern is consistent with accumulation attempts or at least improving transactional balance.
Offsetting that, rate-of-change and trend-persistence measures remain a headwind: ROC(20) -8.621 and TS Mom(20) -0.0009951 are Bearish, and Vol ROC(20) -35.39 is also Bearish. So while some “who is participating” signals are improving, the “how strongly has price been moving” layer has not repaired.
Signal table (Bull/Bear/Neutral)
| Indicator | Value | Signal |
|---|---|---|
| MACD Hist | 6.186e-05 | Bullish |
| Stoch %K | 9.678 | Bullish |
| TS Mom(20) | -0.0009951 | Bearish |
| TS Accel | 0.0009801 | Bullish |
| RSI(14) | 47.97 | Neutral |
| ROC(20) | -8.621 | Bearish |
| ADOSC | 31.31 | Bullish |
| ChaikinOsc | -6.558e+06 | Bearish |
| OBV slope(10) | 1.927e+07 | Bullish |
| PVT slope(10) | 1.11e+06 | Bullish |
| AD Line slope(10) | -1.315e+07 | Bearish |
| Will A/D slope(10) | -0.0002971 | Bearish |
| BB Width | 0.1532 | Bullish |
| Chaikin Vol | -27.49 | Neutral |
| HHIGH(20) | 0.01161 | Neutral |
| LLOW(20) | 0.008615 | Neutral |
| MedPx vs Support | 0.0001156 | Bullish |
| Vol ROC(20) | -35.39 | Bearish |
Taken together, the dashboard reads as neutral with a bullish-leaning internal mix (Bull 8 / Bear 6 / Neutral 4) that still requires structural confirmation to overcome the DRL model’s bearish regime classification.
6) News sentiment + extractive gist
Recent coverage across major financial outlets indicates the digest is being driven by broader crypto market narratives rather than ARPA-USD–specific reporting (instrument-specific matches were not found in the provided data). The aggregate news mix is largely non-directional: Positive 12%, Neutral 88%, Negative 0%, with an average sentiment score of 0.037. KGNAI’s normalized news signal is also Neutral at -0.05 (as of 2026-02-09), alongside an overall news score of 0.02. In market terms, this implies news flow is unlikely to be the primary catalyst for near-term trend resolution; instead, it may act as background context that amplifies technical breaks when they occur.
Positive Developments
The constructive portion of the tape has focused on market-structure themes within major crypto benchmarks rather than project-level catalysts. Coverage highlights stress and adjustment dynamics in the Bitcoin ecosystem (including mining economics and institutional positioning) that can, at times, precede periods of improved risk appetite across liquid altcoin segments. Even when the signal is indirect, a steadier backdrop in benchmark assets can support rotation into smaller tokens if liquidity conditions stabilize. Importantly, the sentiment distribution shows no measured negative share (0%) in the provided sample, which reduces the chance that ARPA-USD is trading under an active adverse headline overhang at this moment. With ARPA-USD’s technical profile already neutral (18-signal score 0.111), a calm macro-news backdrop can matter by allowing price to respond more cleanly to levels—particularly the 0.0151 resistance zone.
Neutral / Mixed Developments
The neutral majority (88%) reflects “state of the market” reporting and commentary where outcomes are debated and time horizons vary. This matters because it often coincides with range-bound price discovery, where traders defer commitment until volatility expands or a trend reasserts. The technicals echo that ambiguity: RSI(14) 47.97 sits near the midpoint, and MACD is only marginally positive (0.0001 histogram interpretation). In this kind of information regime, markets can become more sensitive to mechanical triggers—support/resistance breaks and volume confirmation—rather than interpretive narratives. For ARPA-USD, that suggests the most decision-relevant inputs remain price behavior around 0.0096 and 0.0151, not headline density.
Negative / Risk Signals
While the quantified news sample shows 0% negative, the risk layer in the digest is better understood as macro and policy uncertainty that can intermittently affect crypto risk premia. Broad-market narratives can tighten liquidity conditions or shift positioning in benchmark assets, which then propagates to altcoins. That interacts with ARPA-USD’s internal divergence: the DRL technical rank remains weak (#661, score -0.653), implying the broader regime model is not yet aligned with upside persistence. In a risk-off impulse, assets with bearish trend structure (Close vs MA50 bearish; MA50 vs MA200 bearish) can revert quickly toward support. Accordingly, the key “risk signal” is less about a single headline and more about how price responds if external volatility rises—particularly whether 0.0096 holds on a closing basis.
- Whether a move through 0.0151 is accompanied by participation consistent with the continuation condition (“with volume”).
- Whether RSI(14) 47.97 and MACD histogram (0.0001) improve together—alignment tends to matter more than either alone.
- Any shift in the normalized news signal (-0.05 as of 2026-02-09) away from Neutral during a volatility pickup (bandwidth 0.1532).
Sources referenced: Reuters, Bloomberg, Yahoo Finance, MarketWatch, Investing.com
7) Sources
Not available in the provided data.
You may also like: How KGNAI AI ranks instruments across global markets
Disclaimer: KGNAI provides AI-generated analytics and educational market commentary only. This is not financial advice. Markets involve risk. Always do your own research.