
FARM-USD (Harvest Finance) Technical & Sentiment Snapshot — 20-Feb-2026 | Neutral Rank, Bearish Trend Bias
Harvest Finance (FARM-USD) currently sits in a neutral relative rank zone across KGNAI’s short-, mid-, and long-horizon comparisons, while the underlying tape shows a more cautious technical posture. The moving-average structure is bearish (Close vs MA50 = Bearish; MA50 vs MA200 = Bearish), and momentum remains soft with RSI(14) at 32.11, consistent with downside-biased conditions. At the same time, select participation and turn indicators lean constructive, including a positive MACD histogram (0.1047) and a very low Stoch %K (8.691), which can coincide with late-stage selling pressure rather than early trend recovery. Volatility is not extreme—Bollinger Bandwidth at 0.2822—leaving the next directional resolution highly dependent on price behavior at the primary decision zones: Support ~ 11.9916 and Resistance ~ 19.9480.
Key Takeaways
- Rank stance (Short / Mid / Long): Neutral / Neutral / Neutral (Daily #325, Weekly #371, Monthly #167 out of 800)
- Technical confluence: Neutral (18-signal confluence score -0.111; overall technical score -0.278)
- Key levels: Support ~ 11.9916 | Resistance ~ 19.9480
- News sentiment bias: Neutral (avg -0.026; Positive 12% / Neutral 63% / Negative 25%)
- Confirmation / invalidation condition: A break above 19.9480 with volume supports continuation; a close below 11.9916 elevates deterioration risk
What KGNAI Measures
KGNAI ranks instruments by relative positioning inside a large comparative universe, emphasizing alignment across multiple independent tests rather than any single indicator. Outputs are designed to highlight where signal agreement tends to cluster and where outcomes are historically more probabilistic. Price/volume behavior is used as a reality check on whether directional pressure is being supported by participation.
How to Read This Report
- Ranks are comparative, not absolute—they reflect positioning vs 800 instruments.
- Confluence reflects signal agreement across the 18-indicator dashboard and the separate AI technical rank.
- Support/resistance are decision zones where confirmation matters more than single-candle moves.
- Sentiment adds context and can amplify or conflict with technical conditions.
1) KGNAI AI Analysis
Region: CRYPTO
Total universe size: 800 ranked instruments
- Daily rank: #325 out of 800 — Neutral
- Weekly rank: #371 out of 800 — Neutral
- Monthly rank: #167 out of 800 — Neutral
- 3-Monthly rank: #346 out of 800 — Neutral
FARM-USD’s rank profile is best described as mid-pack with mild long-horizon strength. The Monthly rank at #167 places FARM-USD closer to the upper quartile of the 800-instrument universe, while the Daily (#325), Weekly (#371), and 3-Monthly (#346) readings sit nearer the middle. That combination often appears when an asset is transitioning between regimes: longer-horizon behavior remains comparatively resilient, but nearer-term conditions have not re-validated a durable trend.
Interpreting this alongside the technical layer matters because ranks are not a direct forecast; they are a probabilistic filter for where evidence tends to cluster across a large sample. With all term views tagged Neutral, the framework is effectively saying: the tape does not yet justify a high-conviction directional bias. This is consistent with a market that may be waiting for confirmation at clear thresholds—particularly the 11.9916 support and 19.9480 resistance identified later.
The practical implication is that FARM-USD is not currently screening as a pronounced leader or laggard. Instead, it sits in a zone where incremental confirmation (trend repair, participation, and momentum recovery) would be required to shift from neutral ranking into stronger relative positioning.
Term view: Short-term: Neutral. Mid-term: Neutral. Long-term: Neutral.
Want the full universe and complete rank tables? Unlock full access on KGNAI: https://www.kgnai.com/pricing
2) Price & trend overview
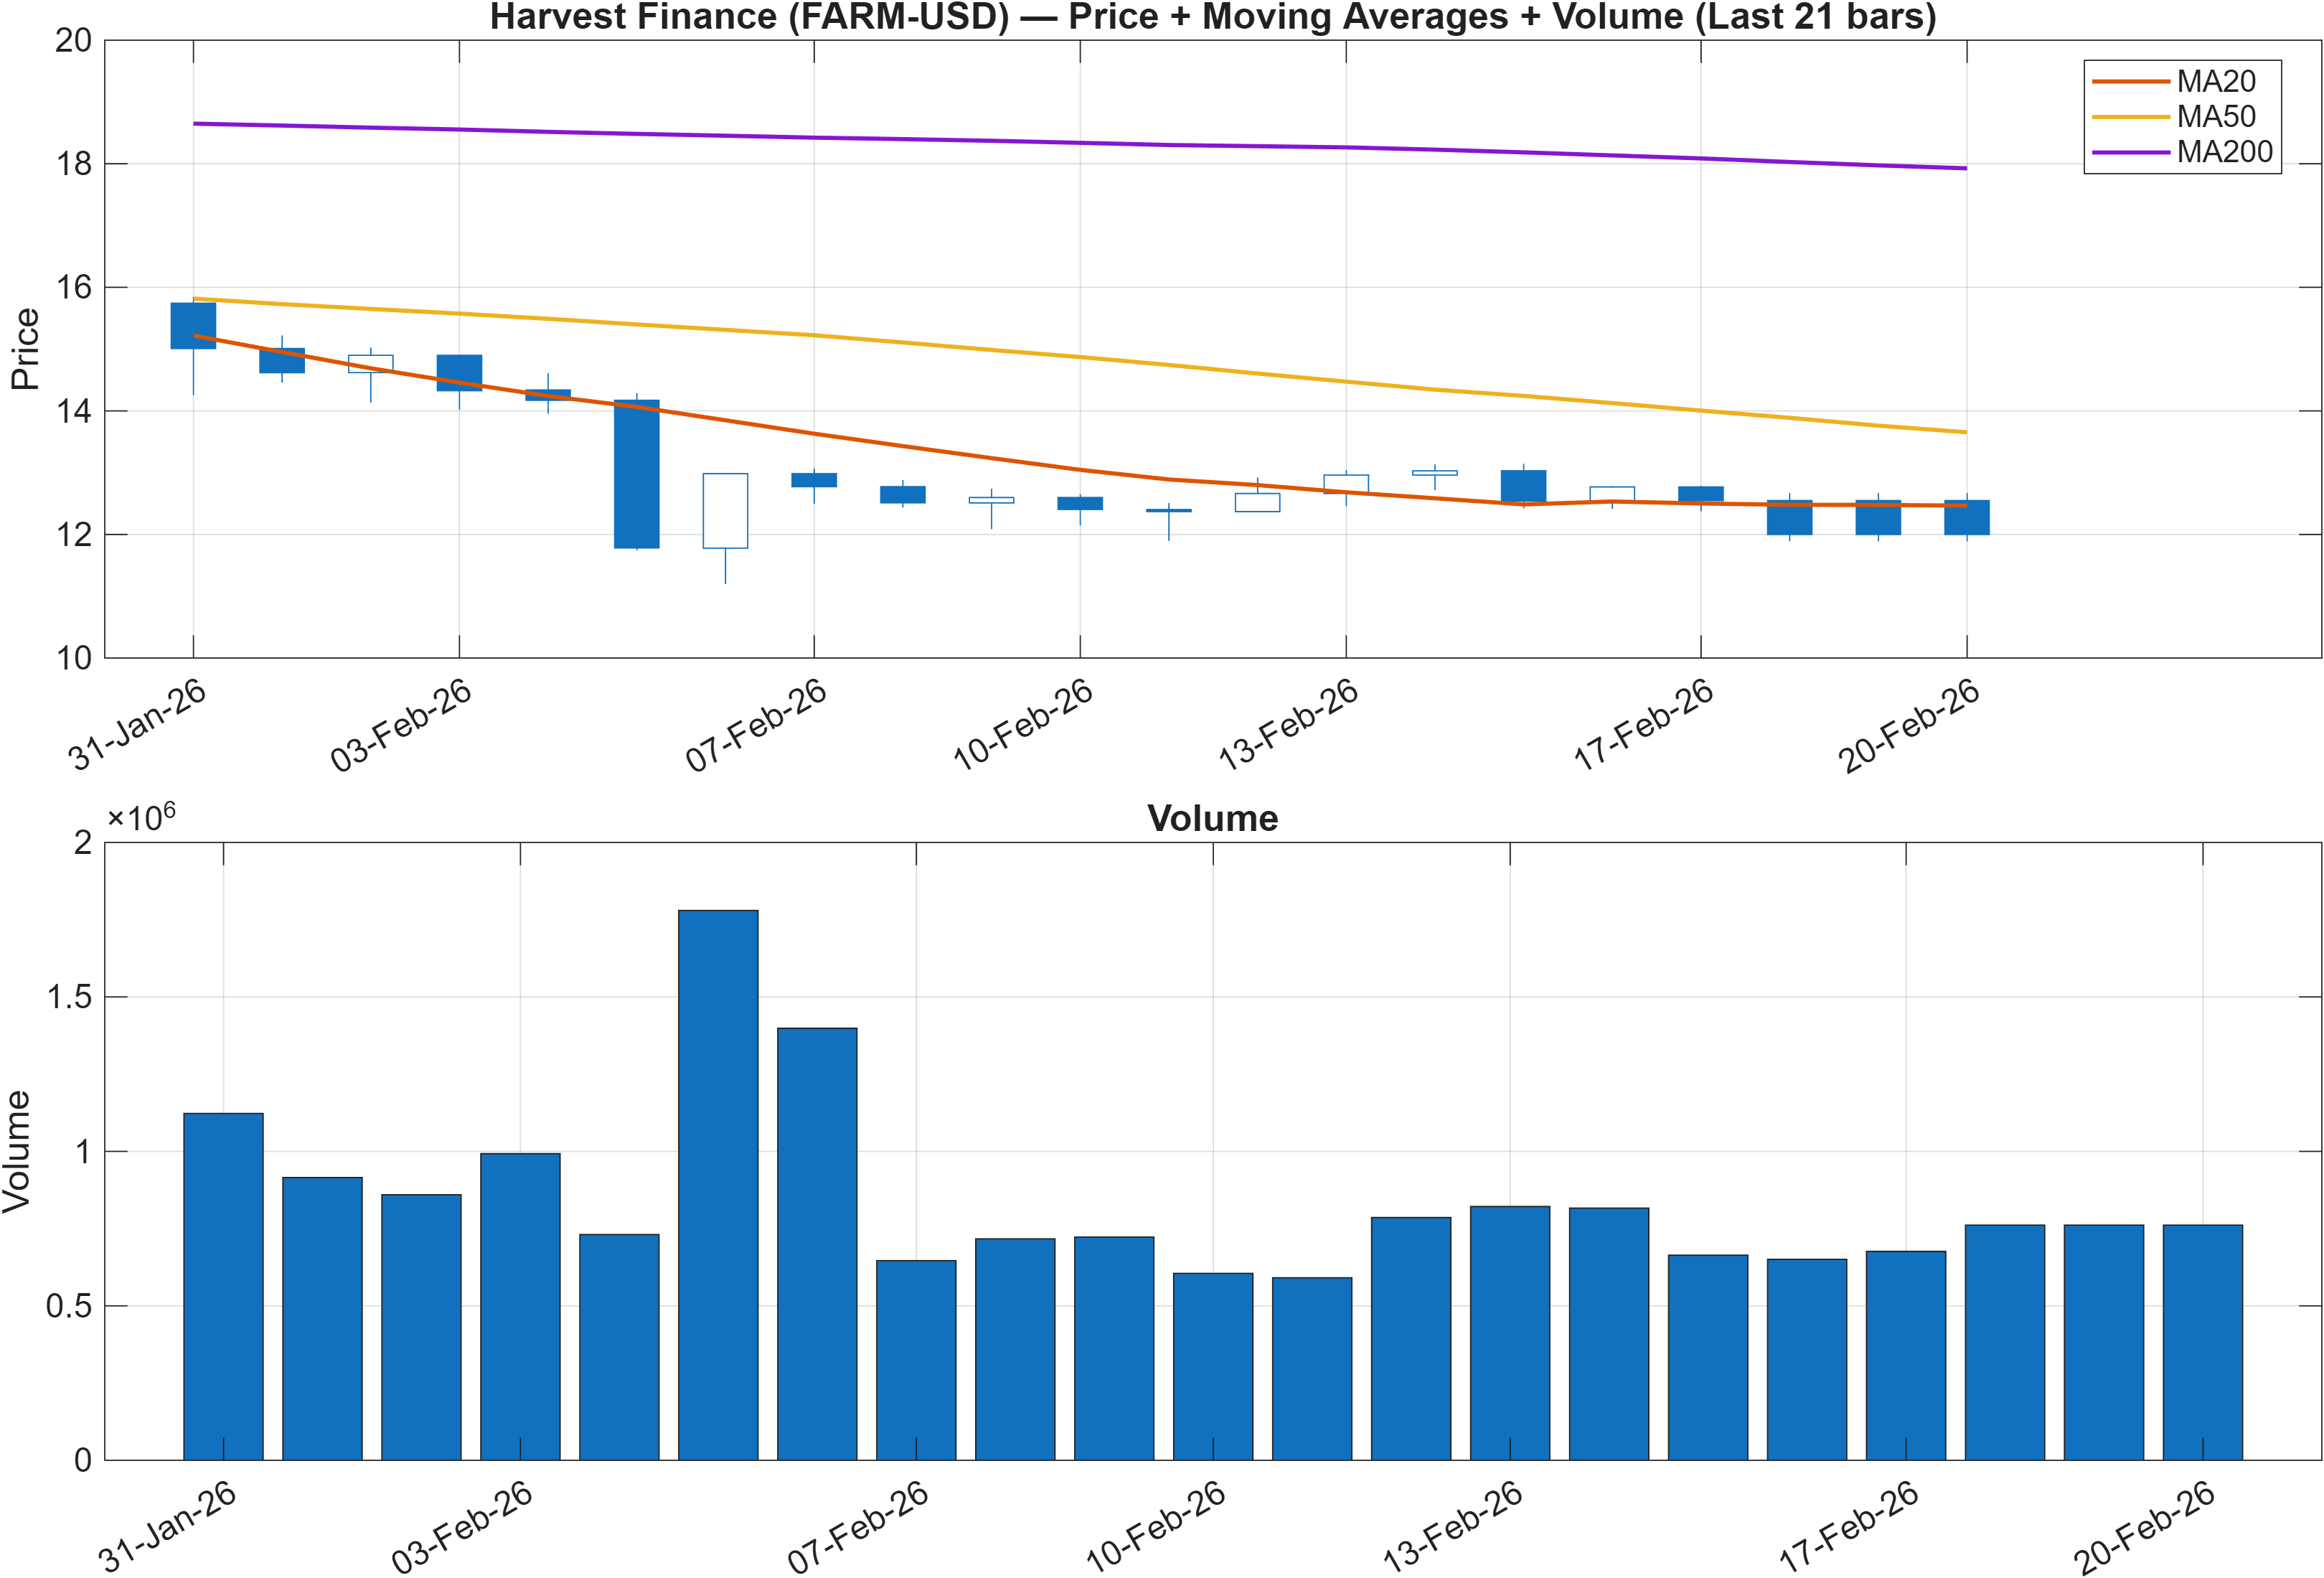
Trend structure is currently defined by a bearish moving-average stack. The snapshot explicitly flags Close vs MA50 = Bearish and MA50 vs MA200 = Bearish, a combination that typically reflects persistent downside pressure and a market still trading below commonly watched dynamic resistance. In this configuration, rallies often need follow-through to prove they are more than mean reversion.
What keeps the stance from becoming outright one-sided is the broader context: KGNAI ranks remain Neutral across horizons (Daily #325, Weekly #371, Monthly #167). That divergence—neutral relative ranking alongside a bearish trend overlay—often appears when an asset is stabilizing after drawdown or when the trend has weakened but the instrument is not underperforming its peers as sharply as the chart alone might suggest.
From a market-structure perspective, the relevant question is whether the market can rebuild above decision zones without losing participation. Later sections show mixed volume-flow inputs (for example, OBV slope(10) 3.823e+05 bullish against Vol ROC(20) -16.82 bearish), which supports a cautious interpretation: participation is present in some measures, but it is not uniformly reinforcing trend repair.
Until the price/MA relationship improves, trend-following frameworks will typically treat strength as counter-trend unless accompanied by a breakout sequence toward 19.9480.
3) Momentum & volatility dashboard
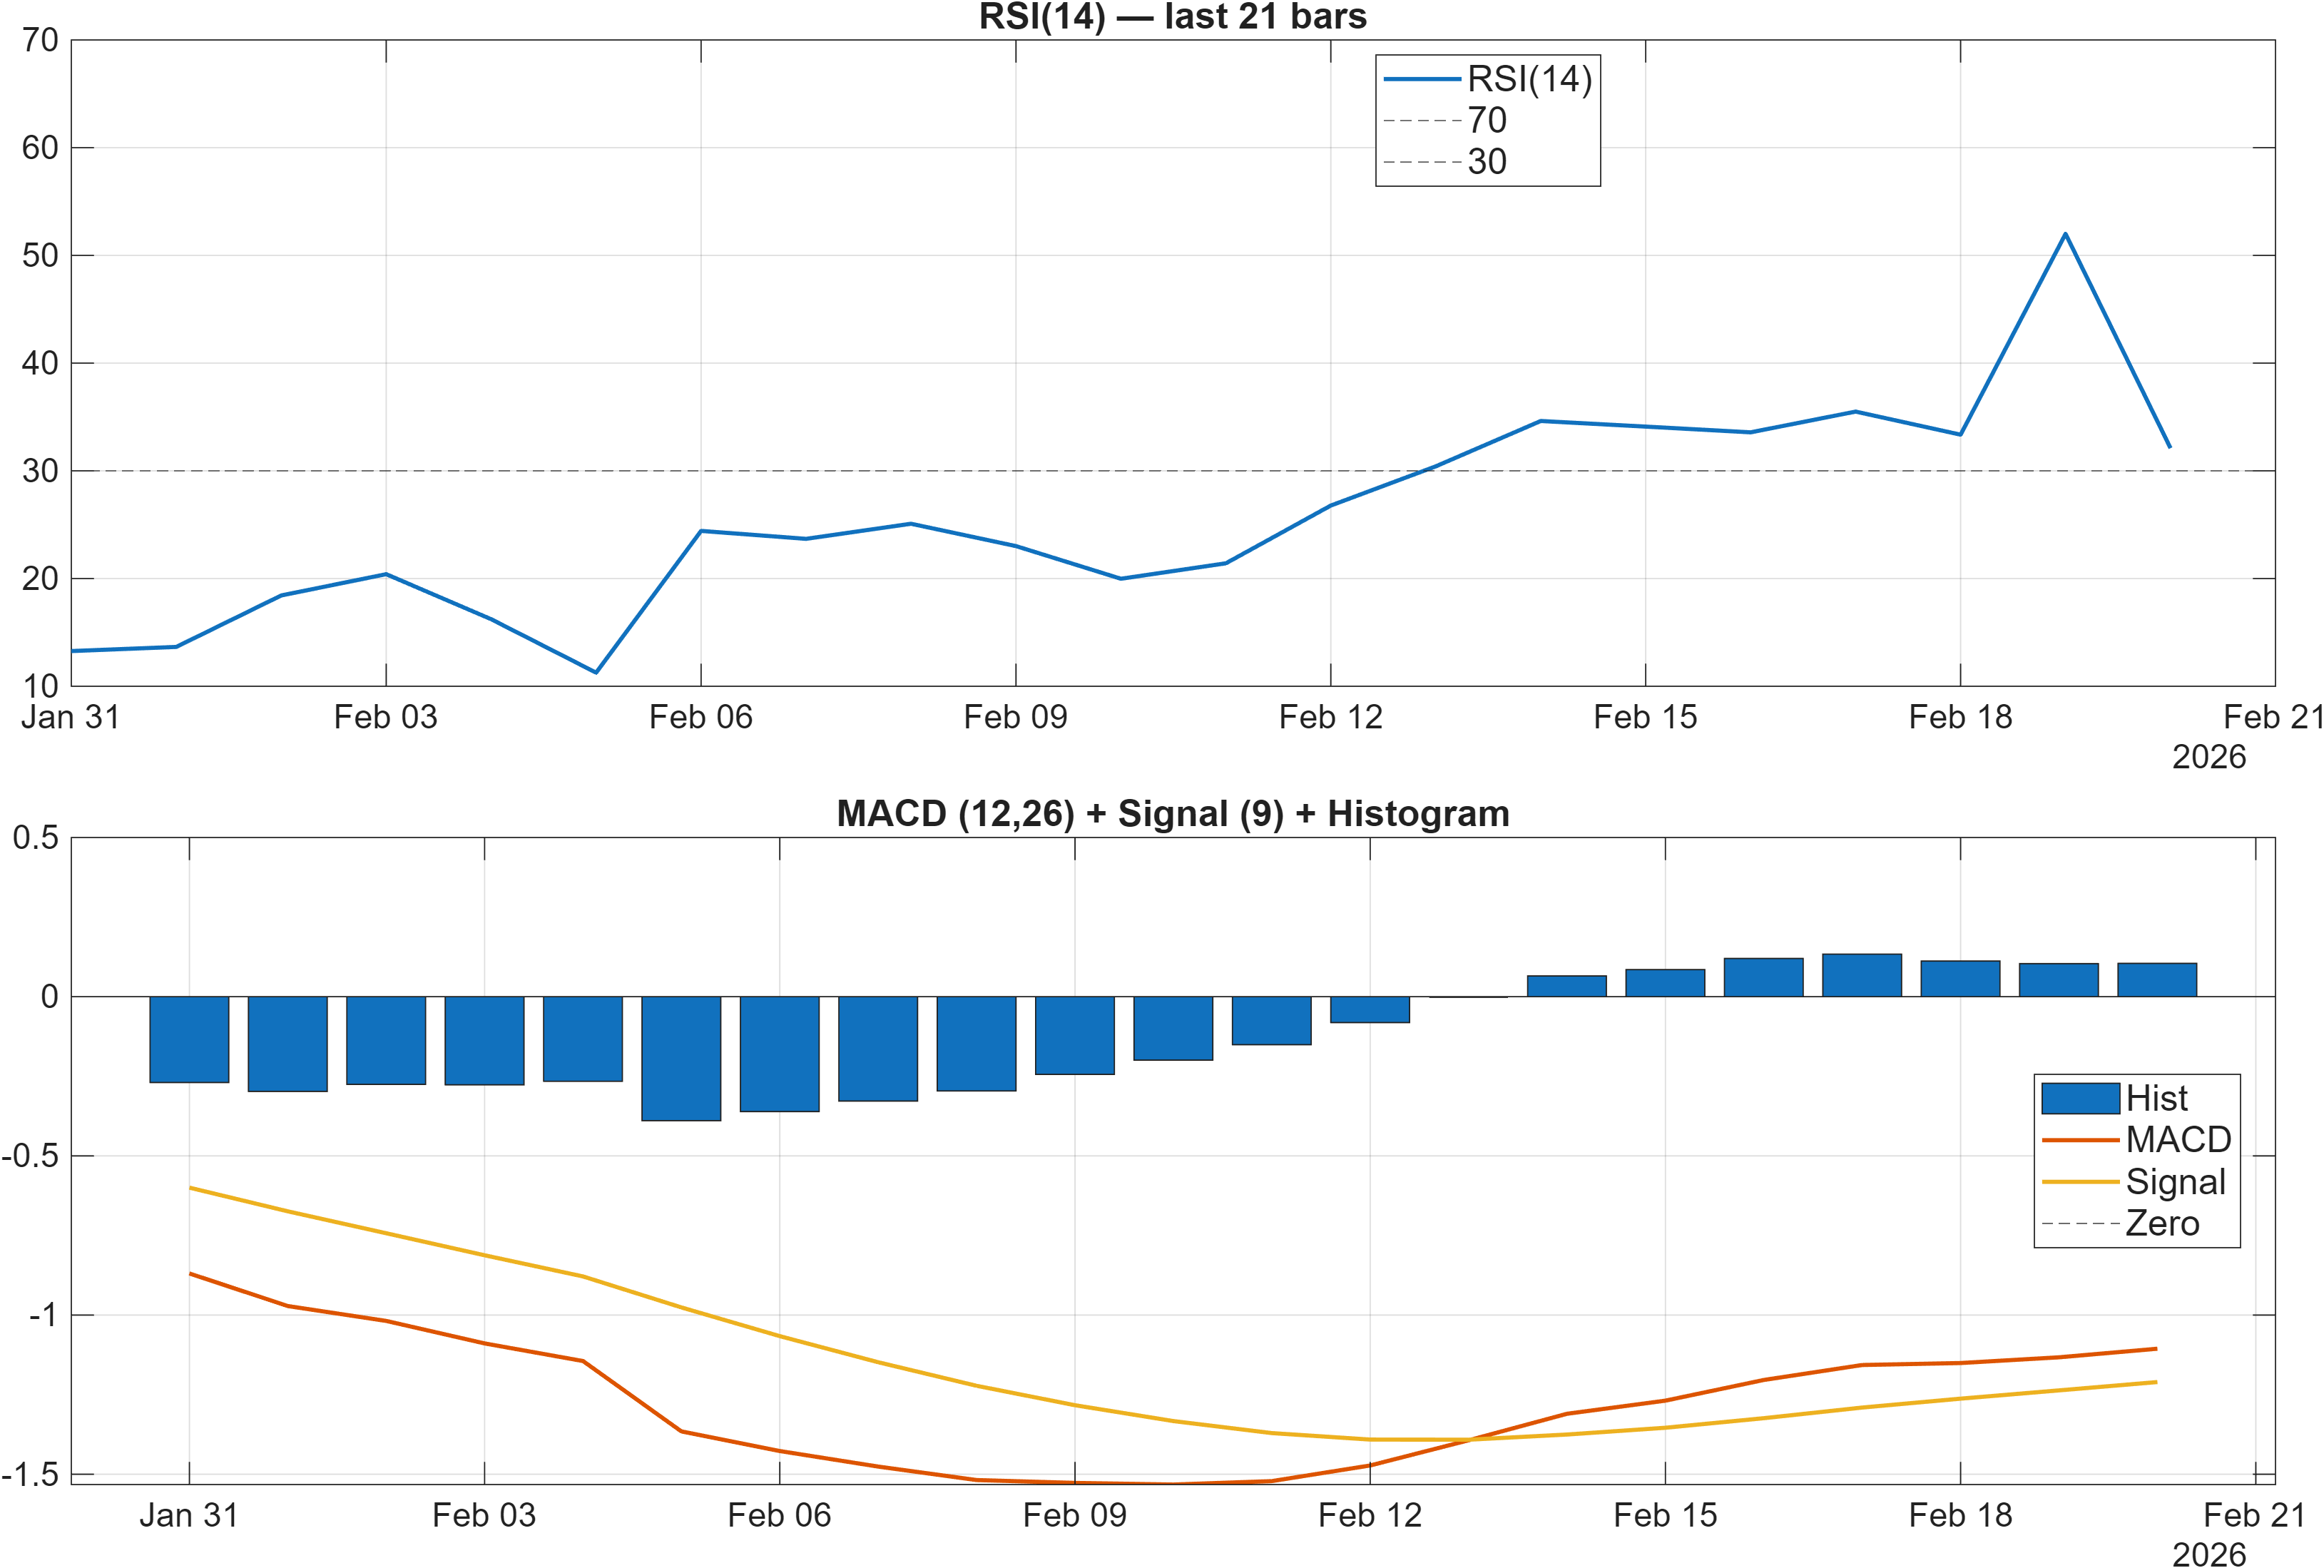
Momentum is split across oscillators in a way that fits a late-downtrend / early-base possibility without confirming it. The dashboard interpretation states RSI bias = Bearish, and the signal table shows RSI(14) at 32.11, which is consistent with weak demand and limited upside traction. Complementing that, the rate-of-change complex remains negative—ROC(20) -18.61 and TS Mom(20) -2.619 are both bearish—suggesting the prior impulse is still influencing the tape.
Offsetting those softer readings, the MACD component is not uniformly negative: MACD Hist 0.1047 is flagged bullish. When MACD histogram turns positive while RSI remains depressed, it can indicate that downside momentum is fading (deceleration) even if price has not yet transitioned into an uptrend. This is broadly consistent with TS Accel 2.45 showing bullish acceleration in the multi-signal table.
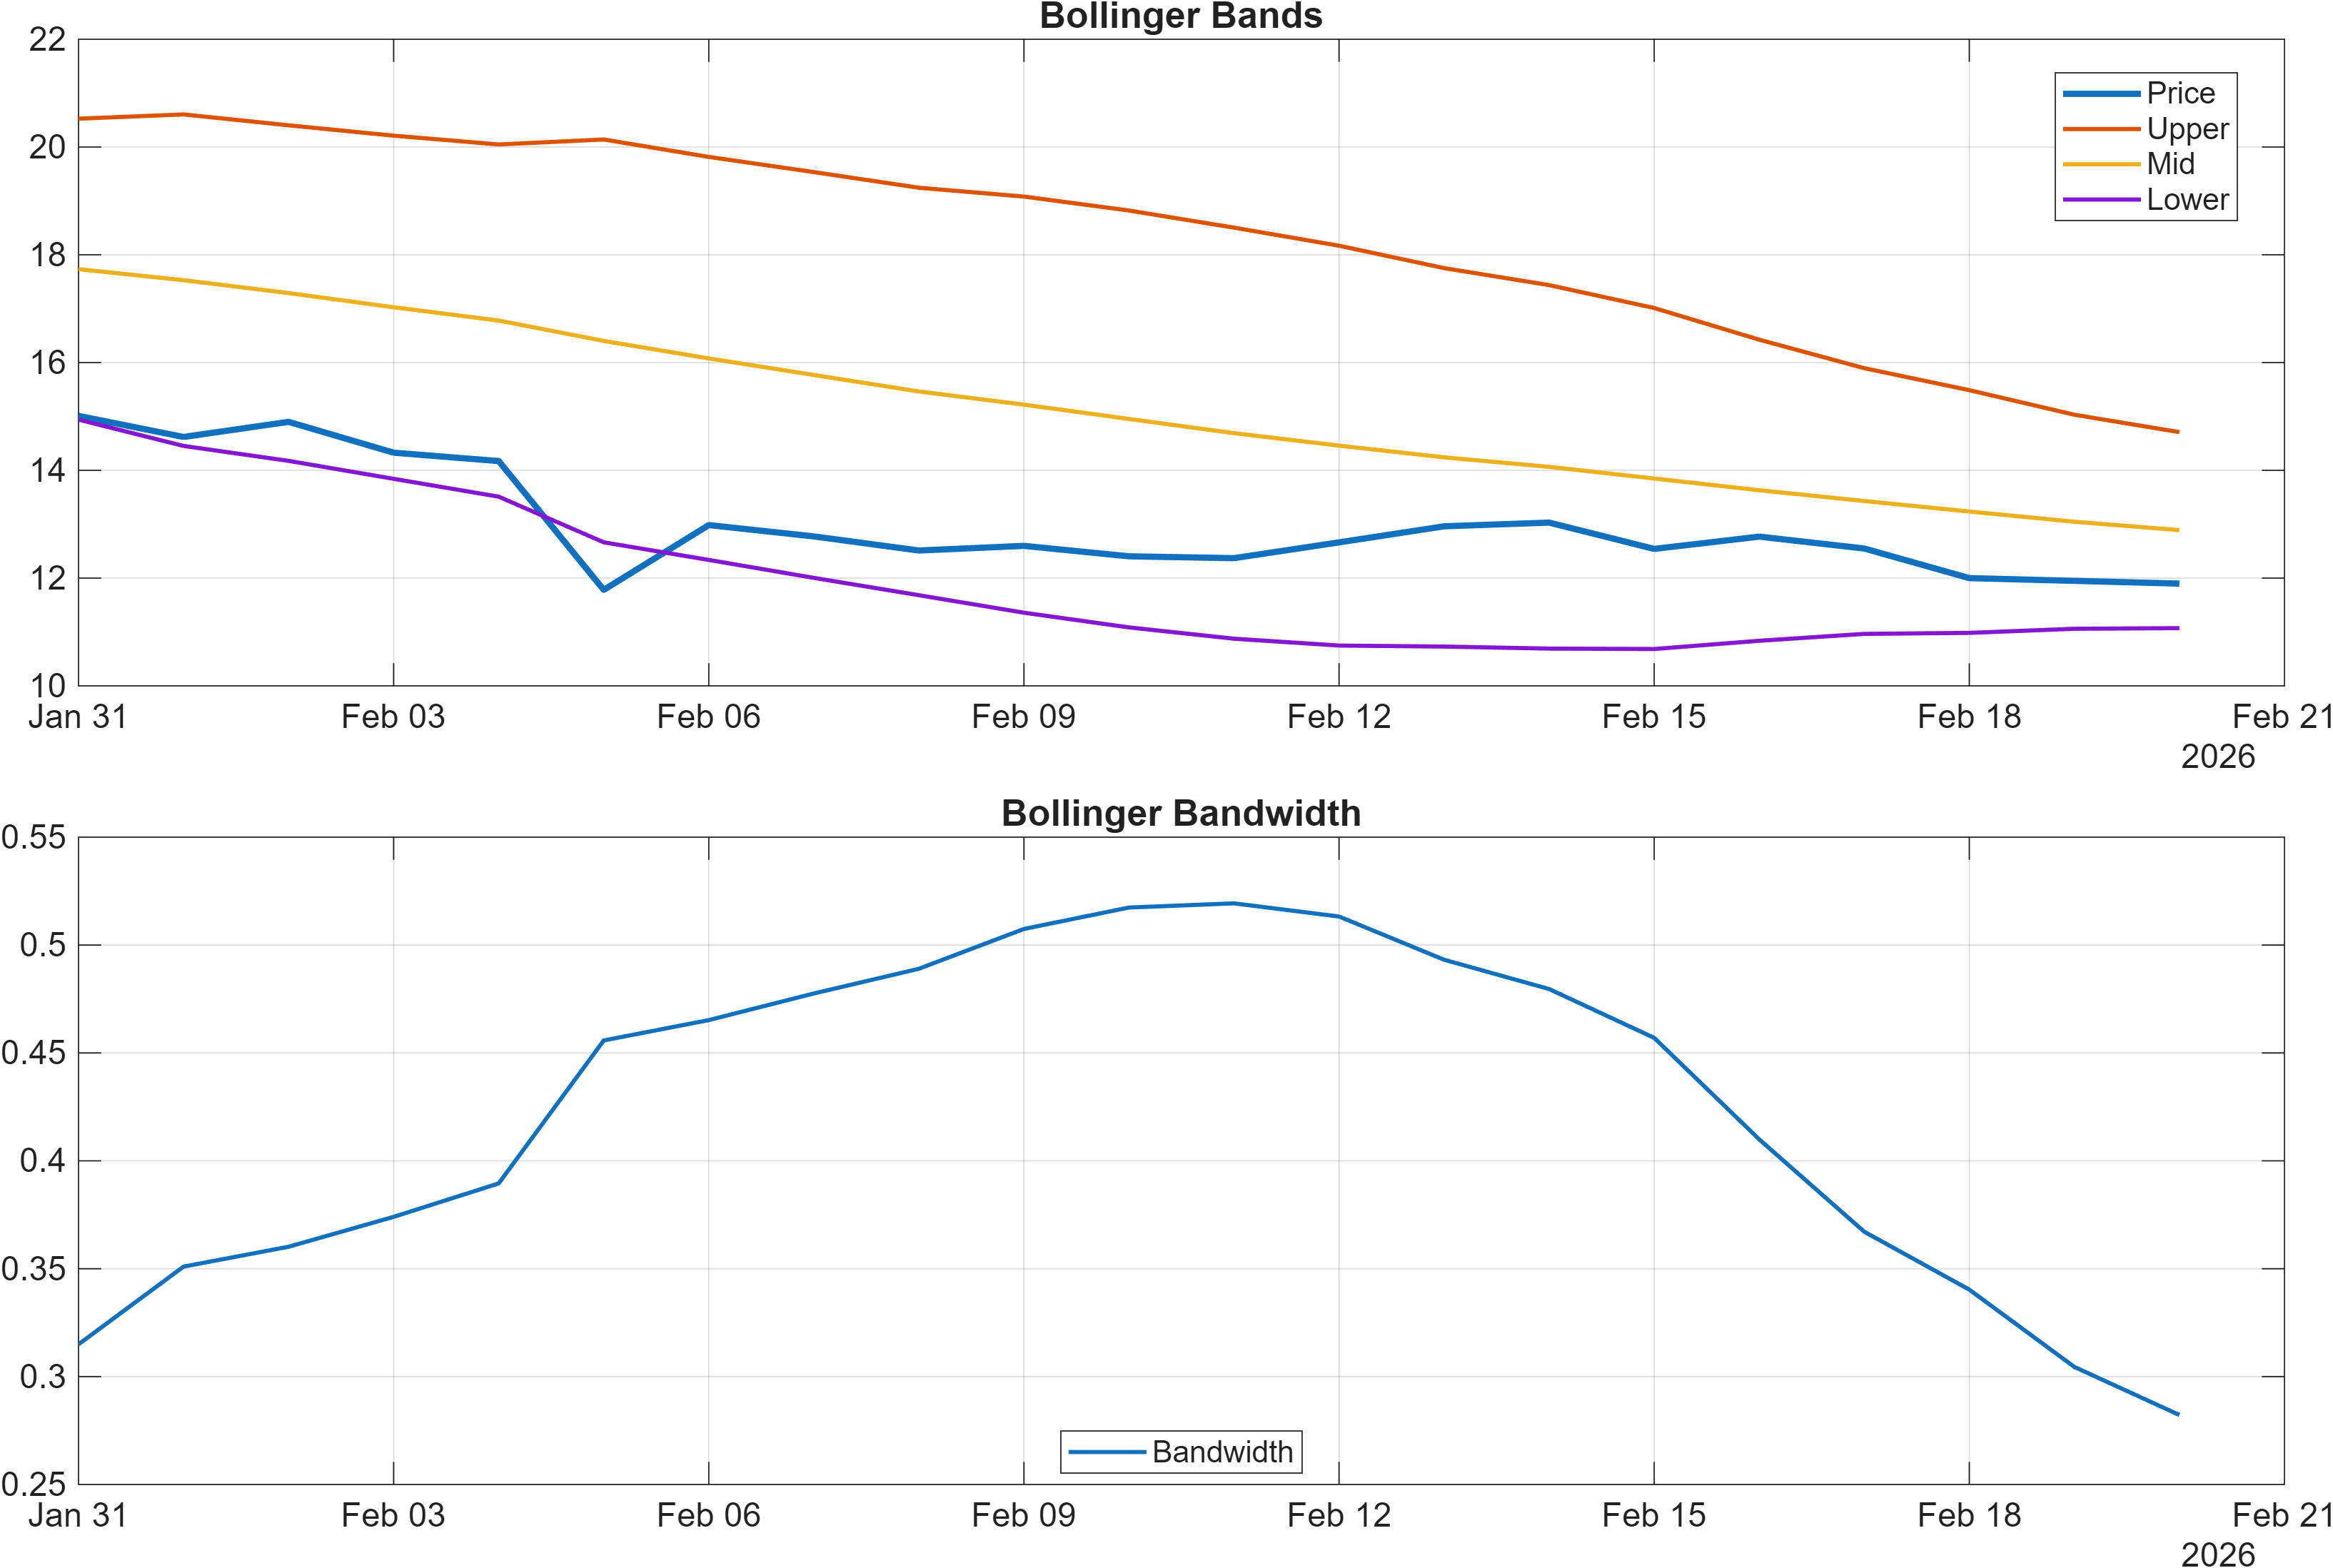
Volatility conditions appear contained rather than extreme: Bollinger Bandwidth 0.2822 is read as Neutral. That reduces the probability that price is already in a fully expanded trend phase; instead, it frames the next move as more likely to be confirmation-driven. With Stoch %K at 8.691 (bullish in the table), the market is also registering deeply oversold behavior—useful as a setup input, but not sufficient on its own without follow-through near resistance.
4) Support / Resistance zones
Support ~ 11.9916 | Resistance ~ 19.9480
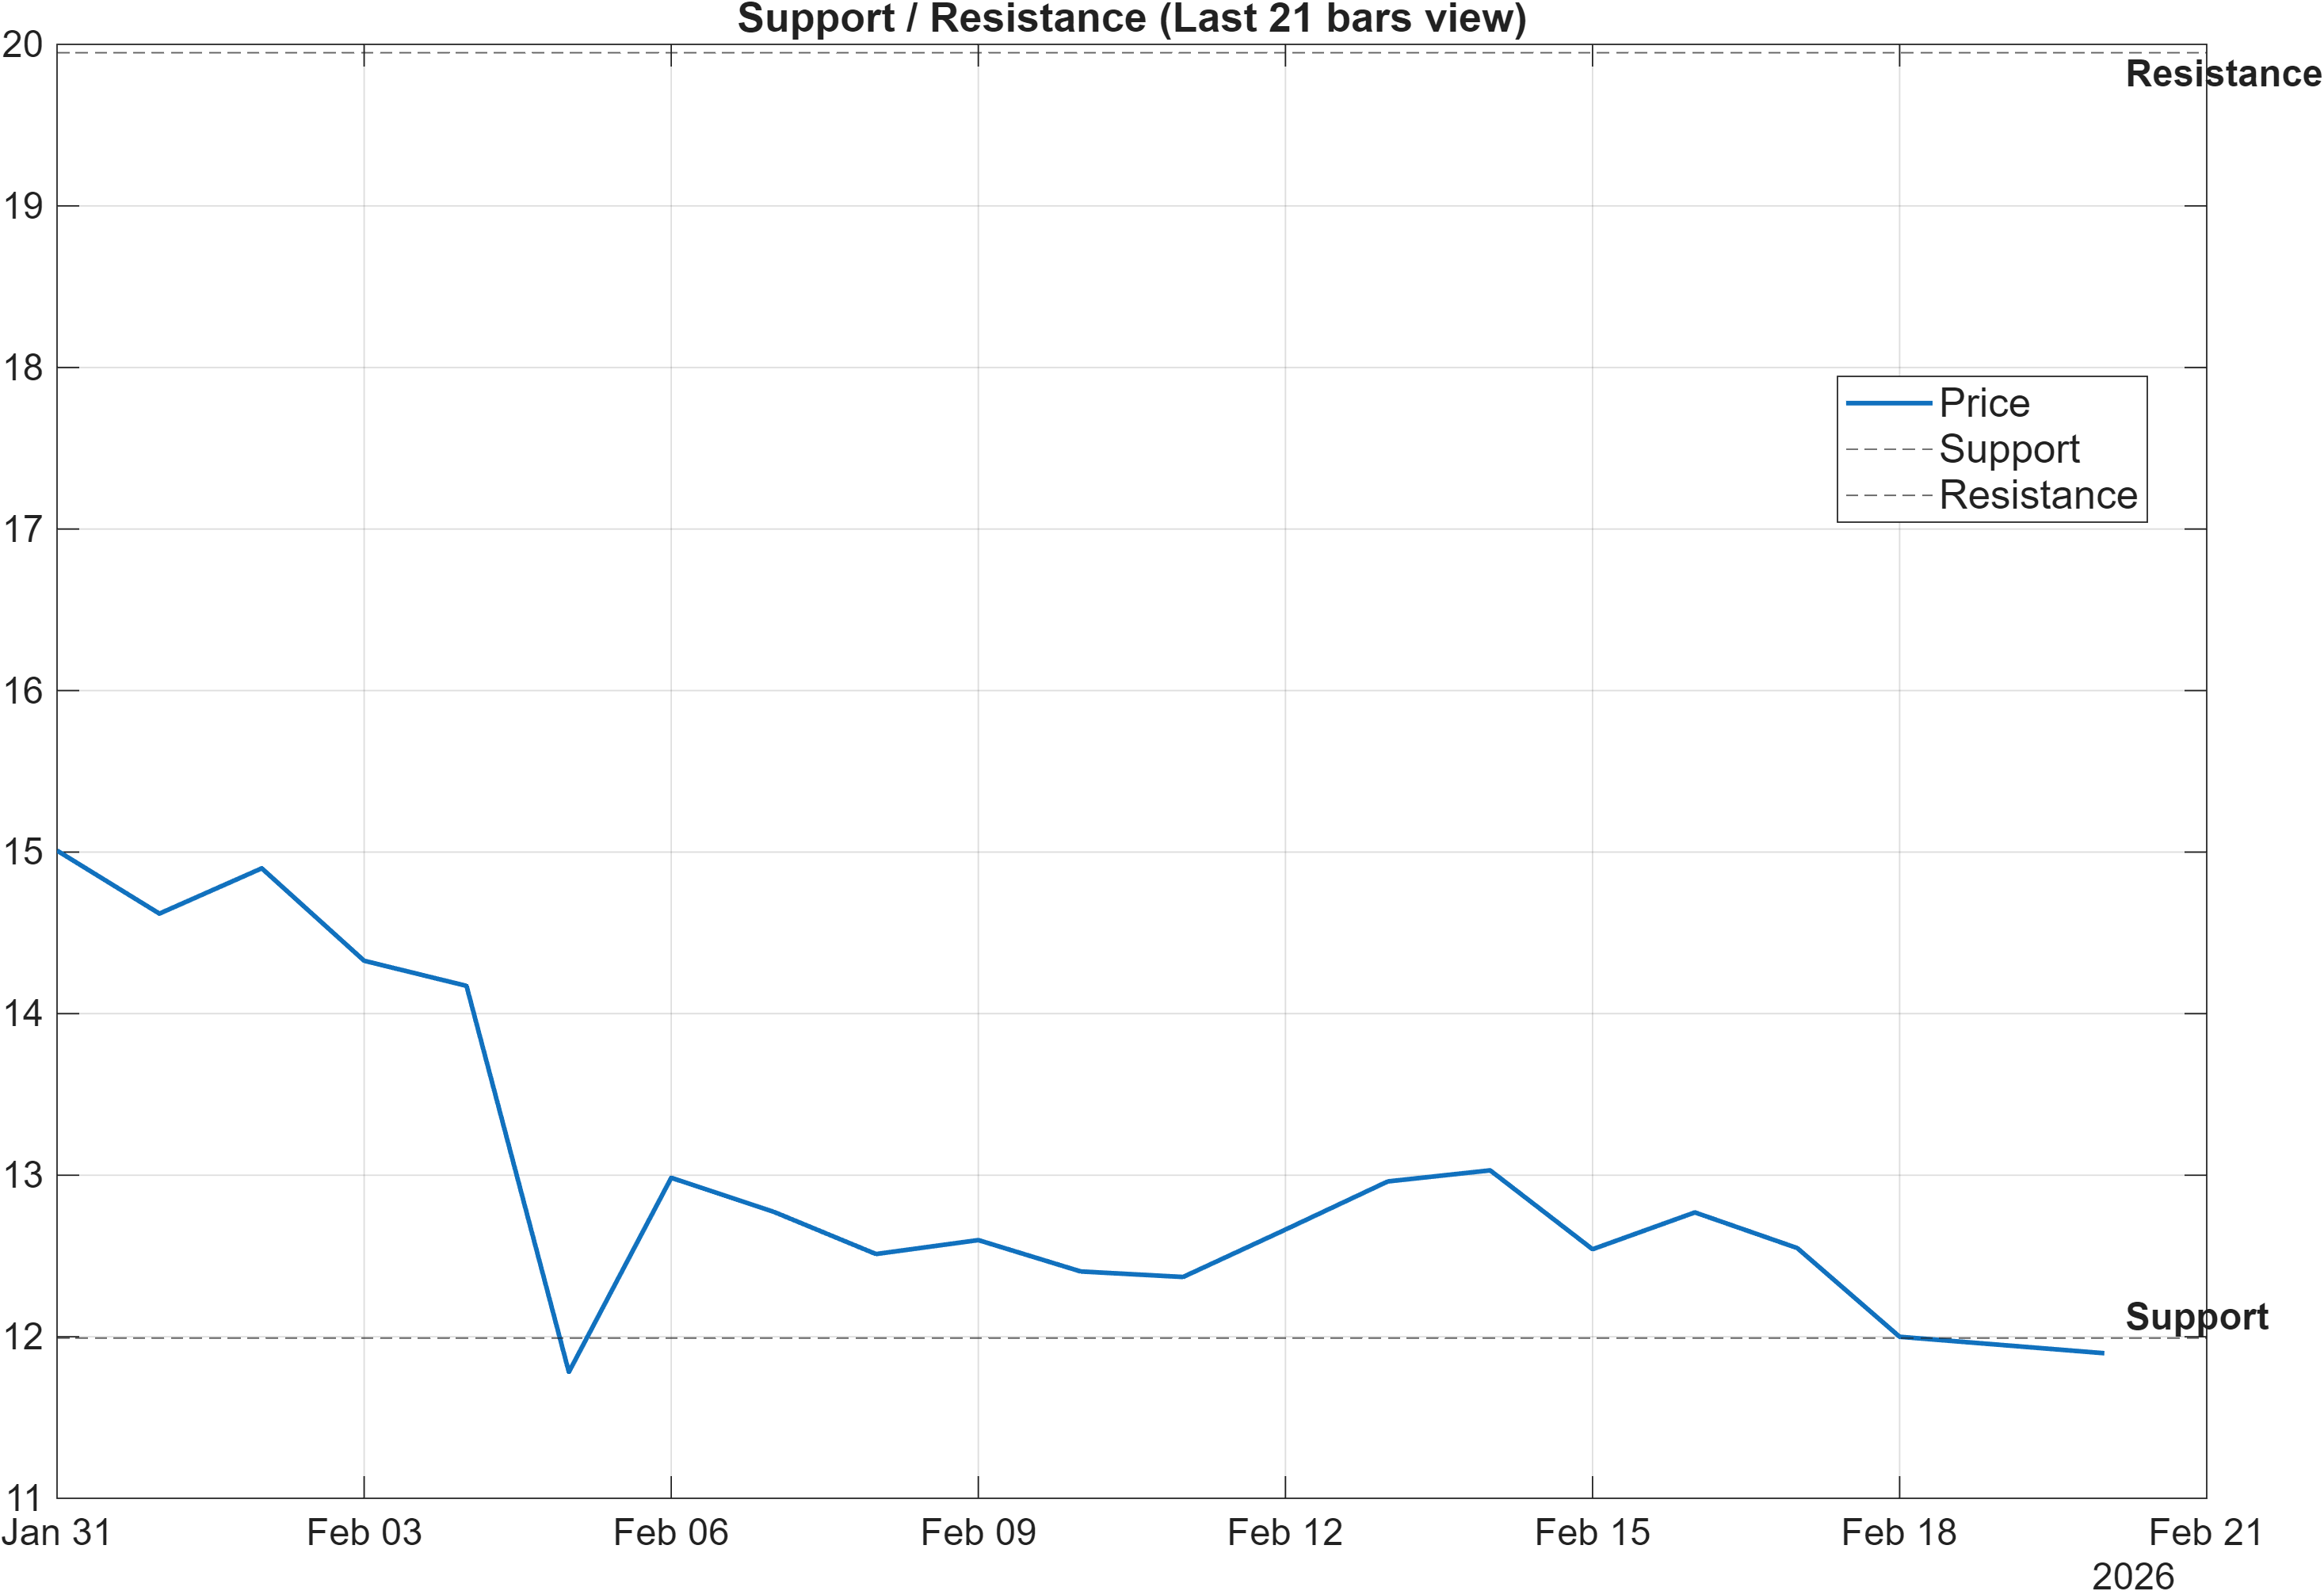
The current setup is cleanly organized around a two-level decision framework: 11.9916 acts as the primary downside reference, while 19.9480 anchors the upside test. With the trend overlay bearish (Close vs MA50 and MA50 vs MA200 both bearish), resistance levels tend to matter more than usual because failed retests can reinforce trend continuation. Conversely, when neutral ranking persists (Daily #325, Monthly #167), a breakout can rapidly improve comparative positioning if it arrives with confirming participation.
The signal table provides a subtle clue that the market is aware of support: MedPx vs Support = 0.2906 is marked bullish, which can occur when price is behaving in a way that is consistent with defending a reference zone. That said, other participation proxies remain mixed—ADOSC 14.89 bullish versus PVT slope(10) -1.74e+04 bearish—so a single “support defense” cue should be treated as conditional rather than decisive.
The scenario logic is therefore straightforward: the upside case requires acceptance above 19.9480 with supportive volume/flow; the downside case is a close below 11.9916, which would likely align the level structure with the already bearish moving-average posture and could pressure the broader technical blend.
Scenario view: Break above resistance with volume → continuation. Close below support → signal deterioration risk.
5) Quant Technical Dashboard (18 Signals)
KGNAI AI Technical Analysis Score (Deep Reinforcement Learning): Rank #667 out of 800 (Rank 1 represents the strongest technical positioning and a higher probability of favorable price behavior. As ranks increase toward the maximum, the probability of favorable outcomes weakens and bearish positioning becomes more dominant.) | Label: Bearish | Score: -0.667
18-Signal Technical Confluence Score: -0.111 (Neutral)
Overall Technical Score (18-signal confluence + DRL rank blend): -0.278 (Neutral)
Note: The blended score reflects signal strength weighted against broader AI technical ranking, which may temporarily diverge.
Blended technical score breakdown: -0.278 (Neutral | Bull 6 / Bear 8 / Neutral 4)
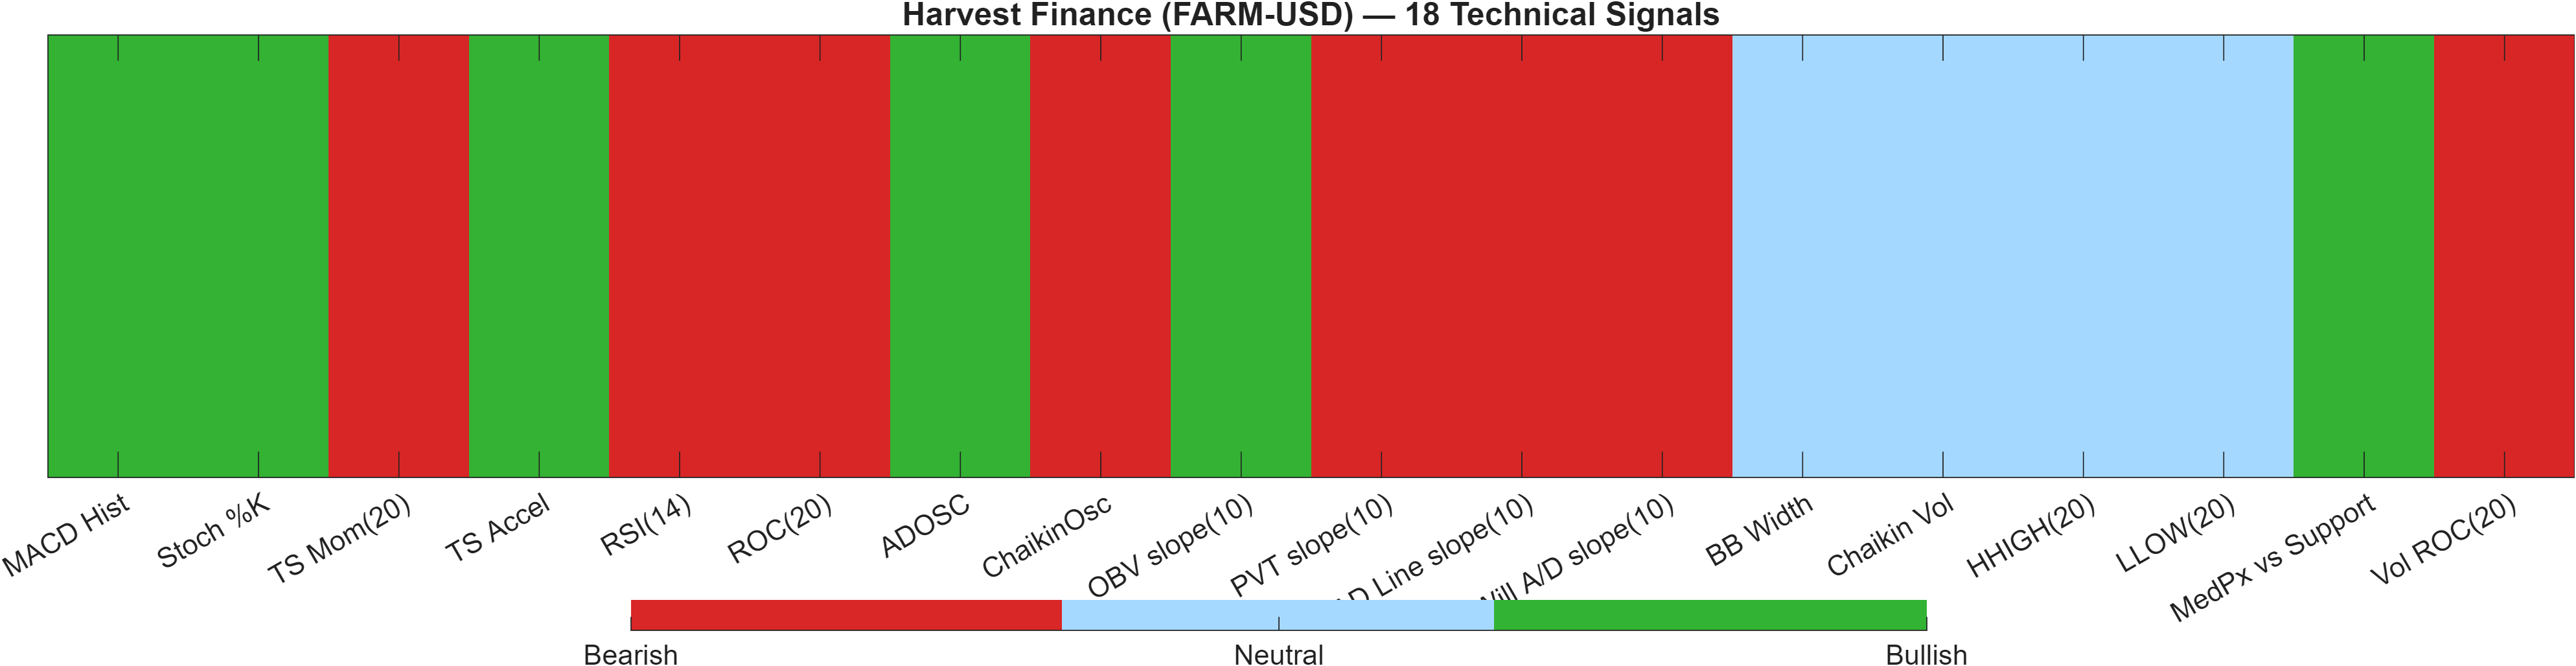
The quant dashboard is defined by neutral confluence with a bearish AI technical rank acting as a drag. On one side, the 18-signal confluence score of -0.111 (Neutral) indicates the indicator set is not in unanimous agreement. On the other, the DRL technical rank at #667 out of 800 (Bearish; score -0.667) implies that, relative to the broader universe, FARM-USD’s technical state maps to a weaker historical outcome bucket at the moment.
The blended output reconciles these differences into an Overall Technical Score of -0.278 (Neutral), with the internal count showing Bull 6 / Bear 8 / Neutral 4. The distribution matters: bears outnumber bulls, but not by a margin that typically produces a high-confidence bearish label in the blended read. This matches the earlier observation that trend structure is negative while some momentum/flow measures are attempting to stabilize.
Within the signal set, the strongest “repair” cues come from MACD Hist 0.1047 (Bullish) and TS Accel 2.45 (Bullish), while the strongest “damage” cues come from ROC(20) -18.61 and RSI(14) 32.11 (both Bearish). Participation is similarly split: OBV slope(10) 3.823e+05 is bullish, yet AD Line slope(10) -2.086e+05 is bearish, signaling that accumulation-type measures are not uniformly aligned.
Signal table (Bull/Bear/Neutral)
| Indicator | Value | Signal |
|---|---|---|
| MACD Hist | 0.1047 | Bullish |
| Stoch %K | 8.691 | Bullish |
| TS Mom(20) | -2.619 | Bearish |
| TS Accel | 2.45 | Bullish |
| RSI(14) | 32.11 | Bearish |
| ROC(20) | -18.61 | Bearish |
| ADOSC | 14.89 | Bullish |
| ChaikinOsc | -3.632e+05 | Bearish |
| OBV slope(10) | 3.823e+05 | Bullish |
| PVT slope(10) | -1.74e+04 | Bearish |
| AD Line slope(10) | -2.086e+05 | Bearish |
| Will A/D slope(10) | -0.1793 | Bearish |
| BB Width | 0.2822 | Neutral |
| Chaikin Vol | -16.91 | Neutral |
| HHIGH(20) | 15.22 | Neutral |
| LLOW(20) | 11.2 | Neutral |
| MedPx vs Support | 0.2906 | Bullish |
| Vol ROC(20) | -16.82 | Bearish |
Interpretation: Indicator-level signals form the base confluence, which is then adjusted using a separate AI-driven technical ranking model. The final technical score summarizes this combined view.
6) News sentiment + extractive gist
Note: Instrument-specific news matches were not found, so the digest includes broader market/sector headlines. Links are provided for verification.
Sentiment score (avg): -0.026 | Positive: 12% | Neutral: 63% | Negative: 25%
KGNAI AI News Sentiment Score (normalized -1 to +1): Not available (as of —) | Label: Not available | Overall news score: -0.03
Positive Developments
Recent coverage across major financial outlets indicates that risk appetite within parts of crypto remains selective rather than broadly risk-on. Flows and positioning narratives have periodically favored specific large-cap themes and pockets of institutional allocation, which can support liquidity conditions even when the wider market is choppy. For FARM-USD, this matters less as a direct catalyst (instrument-specific items were not found) and more as a backdrop: when capital rotation is active, secondary tokens can benefit if technical levels confirm. Against a bearish trend overlay (Close vs MA50 and MA50 vs MA200 both bearish), any improvement in the macro-crypto tone would still require follow-through in price—particularly around 19.9480—to translate sentiment into an actionable shift. The current sentiment distribution (12% positive, 63% neutral) suggests the media tape is not aggressively euphoric, which can reduce the probability of emotionally driven spikes and keep attention on technical confirmation.
Neutral / Mixed Developments
The dominant theme in the digest is mixed: ongoing industry activity, funding stories, and market-structure discussions are balanced by continued volatility and uneven performance across segments. That aligns with the computed sentiment average of -0.026 and the high neutral share (63%), implying that headlines are more descriptive than directive. In that environment, technical state tends to carry more weight than narrative. FARM-USD’s mixed momentum set—MACD hist 0.1047 bullish alongside RSI(14) 32.11 bearish—fits a market that can oscillate without establishing a clean trend. With volatility regime readings like BB Width 0.2822 neutral, price may stay range-sensitive until a breakout or breakdown is confirmed.
Negative / Risk Signals
Recent coverage across major financial outlets also highlights recurring risk themes: operational errors, regulatory scrutiny, and macro-sensitive risk-off triggers that can spill into crypto pricing. These dynamics can tighten liquidity and increase correlation during stress windows, which is notable for an asset already carrying a bearish trend configuration. The news tone is not deeply negative (25% negative; overall news score -0.03), but it is sufficient to keep downside scenarios credible if price loses key levels. For FARM-USD, the most practical risk framing is technical: a close below 11.9916 would likely align risk headlines with an already cautious indicator set (e.g., ROC(20) -18.61, Vol ROC(20) -16.82). In short, external risk signals appear capable of accelerating moves, but they are not currently overwhelming the broader neutral media bias.
- Whether price action confirms 19.9480 as acceptance (break/hold) or rejection.
- Any shift in aggregate crypto risk tone that changes the negative share from 25% materially higher.
- Follow-through in participation proxies (e.g., divergence between OBV slope(10) 3.823e+05 and Vol ROC(20) -16.82).
Snapshot: AI Rank (Short–Mid–Long): Neutral (Neutral–Neutral–Neutral) · Technical Confluence: Neutral · Key Levels: Support ~11.99 | Resistance ~19.95 · News Sentiment: Neutral
Sources referenced: Reuters, Bloomberg, Yahoo Finance, MarketWatch, Investing.com
7) Sources
Not available in the provided data.
You may also like: How KGNAI AI ranks instruments across global markets
Disclaimer: KGNAI provides AI-generated analytics and educational market commentary only. This is not financial advice. Markets involve risk. Always do your own research.