
ETHW-USD (ETHPoW USD) — 25-Feb-2026 Neutral Ranks with Bearish Confluence and Mixed Momentum
ETHPoW USD (ETHW-USD) screens as neutral on KGNAI’s cross-sectional ranks across short, mid, and long horizons, while the internal technical stack leans cautiously negative. The 18-signal confluence score of -0.333 (Bearish) contrasts with a blended overall technical score of -0.249 (Neutral), indicating partial disagreement between indicator-level pressure and the broader AI technical ranking. Trend framing remains soft with the interpretation showing Close vs MA50 = Bearish and MA50 vs MA200 = Bearish, while momentum is not decisively one-sided: RSI(14) is 41.96 (bearish bias) but MACD histogram is 0.003028 (marginally constructive). Volatility is moderate rather than compressed, with Bollinger bandwidth at 0.1970. Key decision zones remain support ~0.3136 and resistance ~0.5903, with sector-level news sentiment slightly negative (-0.032) but dominated by neutral coverage.
- Rank stance: Short Neutral | Mid Neutral | Long Neutral (universe size: 800)
- Technical confluence label: Bearish (18-signal confluence -0.333) with Neutral blended score (-0.249)
- Key levels: Support ~ 0.3136 | Resistance ~ 0.5903
- News sentiment bias: Slightly negative-to-neutral (avg -0.032; 69% neutral)
- Confirmation / invalidation: A break above 0.5903 with volume supports continuation; a close below 0.3136 increases deterioration risk
KGNAI evaluates assets using large cross-sectional datasets built from millions of structured data points. Inputs incorporate fundamental metrics, technical structures, and systematically processed news sentiment. Statistical models, machine learning, and AI frameworks are used to assess relative positioning, signal alignment, and probabilistic behavior across broad universes.
- Ranks are comparative across the tracked universe, not absolute price targets.
- Confluence reflects alignment among independent signal groups.
- Support/resistance levels are probabilistic decision zones, not guarantees.
- Sentiment provides contextual bias within the broader analytical framework.
KGNAI Signal + Technical Snapshot + News Sentiment Digest
As of: 25-Feb-2026
Ticker: ETHW-USD
1) KGNAI AI Analysis
Region: CRYPTO
Total universe size: 800 ranked instruments
- Daily rank: #584 out of 800 — Neutral
- Weekly rank: #601 out of 800 — Neutral
- Monthly rank: #629 out of 800 — Neutral
- 3-Monthly rank: #522 out of 800 — Neutral
ETHW-USD sits in the lower third of the ranked universe across the daily, weekly, and monthly snapshots, with the monthly rank (#629 out of 800) the weakest of the set. The 3-month ranking improves to #522, suggesting that the longer window is less negative than the short cycle, but still not in leadership. This is consistent with an instrument that is not displaying sustained cross-sectional strength versus peer crypto assets tracked in the same 800-instrument universe.
The term view remains explicitly Neutral for short-, mid-, and long-term horizons. In practical positioning terms, this “neutral” label should be read as non-committal rather than supportive because the ranks are already in the weaker half of the universe. When the rank cluster remains elevated (e.g., #584 and #601), it typically implies that any bullish case needs confirmation from either trend repair or a clear momentum shift, rather than relying on mean reversion alone.
The most actionable takeaway from the rank stack is the time-horizon asymmetry: the 3-month window (#522) is less weak than the monthly (#629), implying that recent pressure may be more acute than the broader quarter’s context. That type of pattern often precedes a regime decision—either stabilization that lifts short-horizon ranks toward the longer-horizon reading, or continued deterioration that drags the 3-month rank higher over time.
KGNAI ranks each instrument across large universes using multiple proprietary AI tests and statistical models (millions of data points). Lower ranks generally indicate stronger probability of favorable performance behavior, while higher ranks indicate weaker probability and more bearish positioning.
Term view: Short-term: Neutral. Mid-term: Neutral. Long-term: Neutral.
Want the full universe and complete rank tables? Unlock full access on KGNAI: https://www.kgnai.com/pricing
2) Price & trend overview
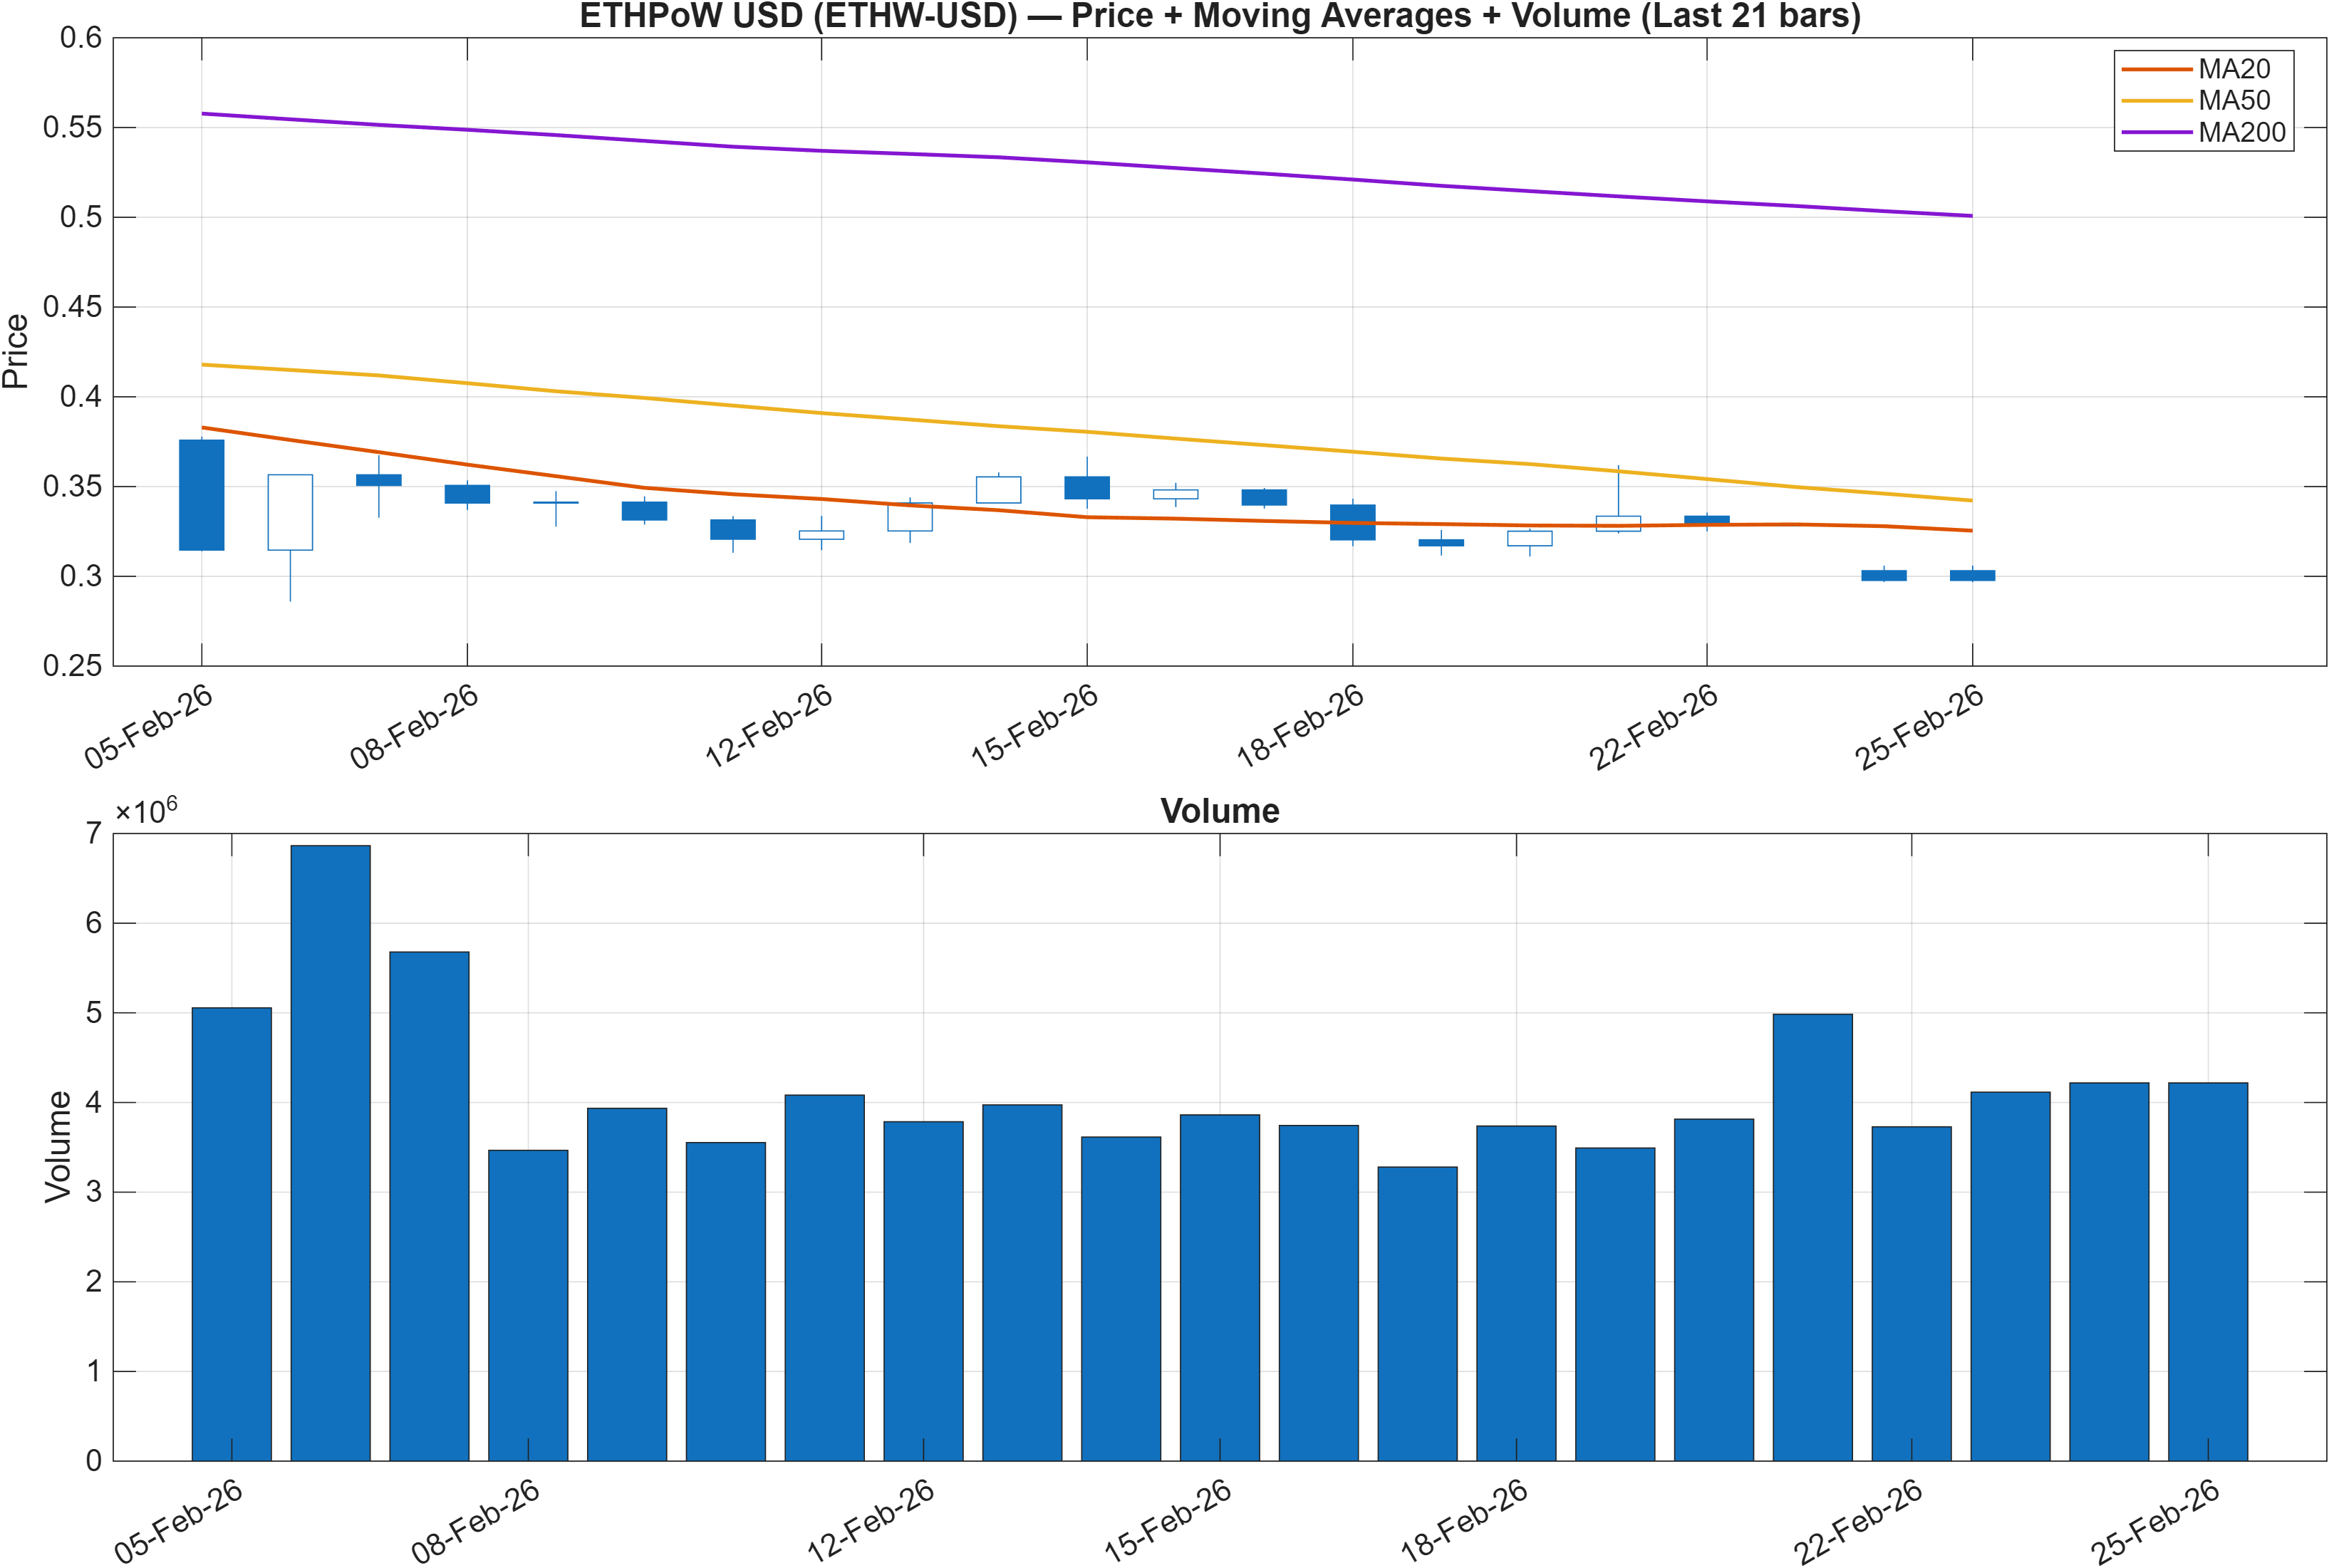
The trend lens is defined by a two-layer bearish alignment: Close vs MA50 = Bearish indicates price remains below the intermediate trend reference, and MA50 vs MA200 = Bearish keeps the longer-cycle slope configuration pointed down. When both conditions are simultaneously negative, the market is typically operating in a “repair” phase where upside attempts often face overhead supply unless the MA50 begins to flatten and the close can reclaim it.
This trend setup helps explain why cross-sectional ranks remain neutral-to-weak rather than improving: trend-following filters usually require a reclaim of the MA50 (and ideally a transition in MA50 vs MA200) before systematic strength shows up in the short horizon. In this context, a neutral rank stance does not contradict bearish trend structure—it often signals that selling pressure is present but not accelerating enough to register as strongly bearish across all models at once.
The practical implication is that ETHW-USD is currently more sensitive to failed rallies than to breakouts until trend conditions change. This is consistent with the key level map later in the report: resistance is materially above support (0.5903 versus 0.3136), so the market’s path back to trend normalization typically requires multiple confirmations rather than a single up-day.
Interpretation: Close vs MA50 = Bearish, MA50 vs MA200 = Bearish.
3) Momentum & volatility dashboard
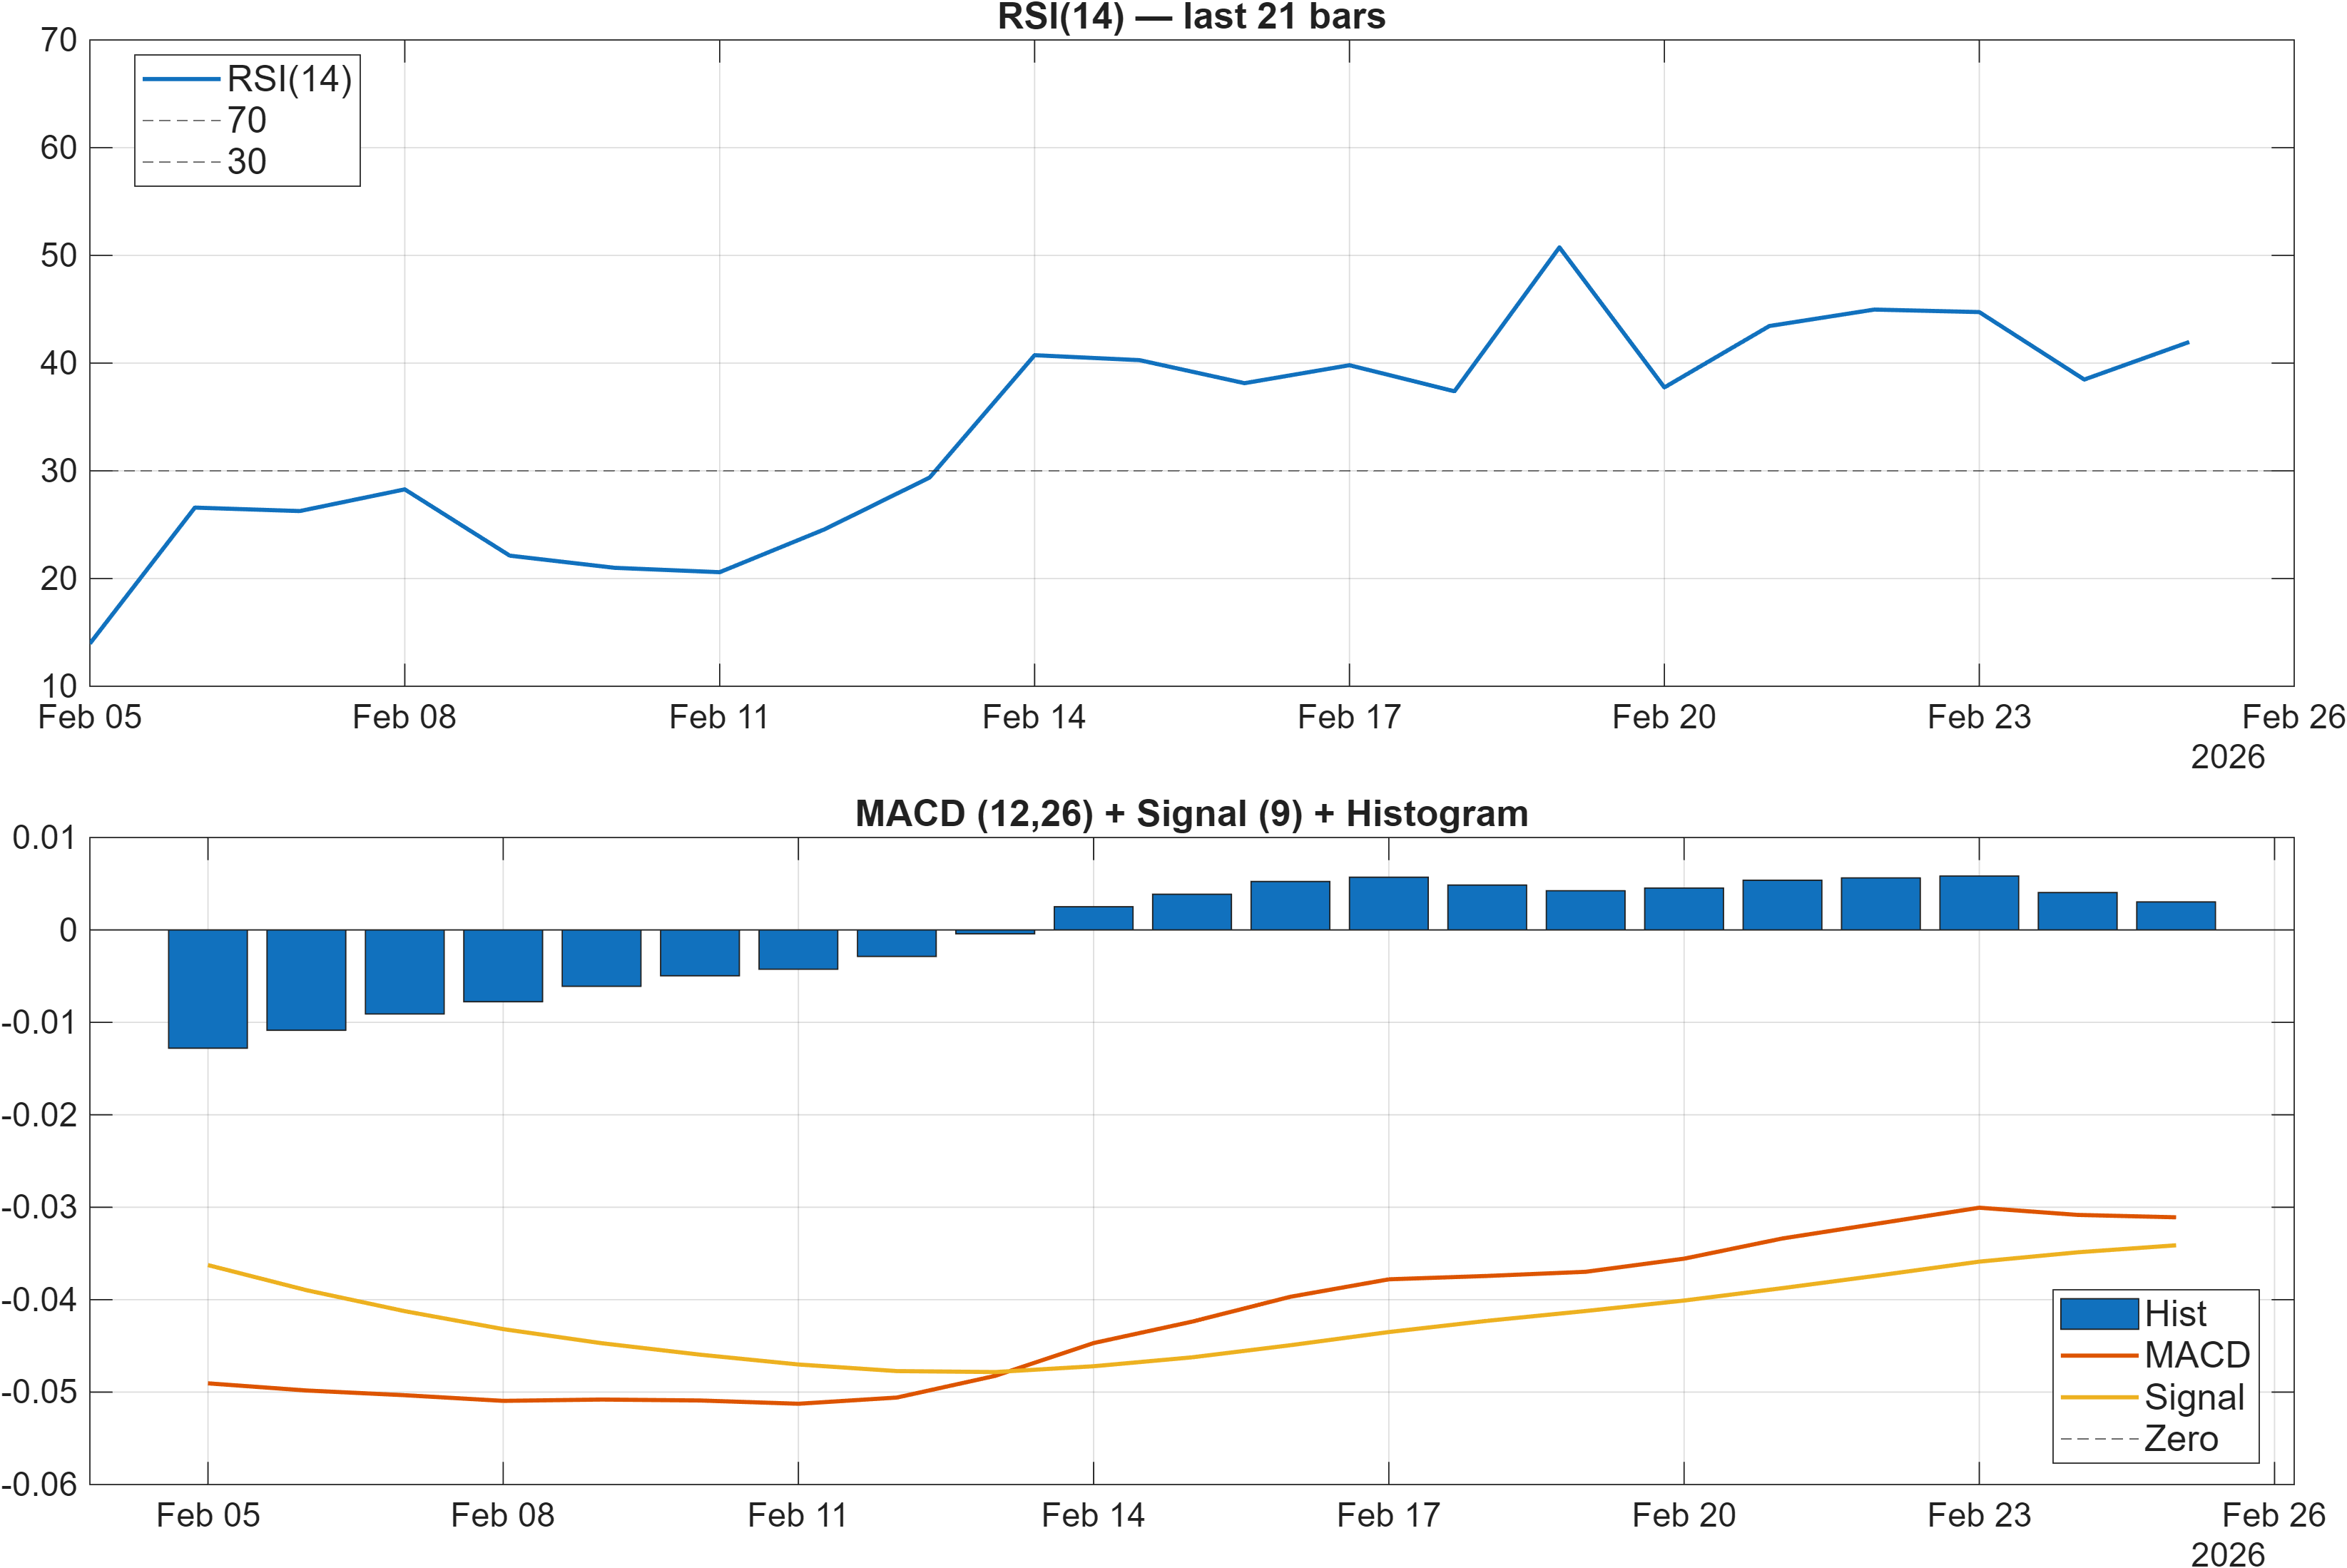
Momentum signals show a constructive-vs-defensive split. RSI bias is labeled neutral in the dashboard context, yet the signal table flags RSI(14) at 41.96 as Bearish, consistent with weaker-than-average momentum but not a deeply oversold regime. Meanwhile, the MACD histogram at 0.003028 is marginally positive, pointing to early stabilization in rate-of-change dynamics even while the broader trend structure remains bearish.
This combination often appears during transition attempts: MACD can improve first as downside momentum decelerates, while RSI remains suppressed until price can sustain closes above nearer-term averages. The presence of a bullish Stoch %K reading of 1.436 reinforces the idea that the market may be probing for a short-cycle turn, but this is not the same as trend reversal—especially when trend filters (MA50/MA200) remain negative.
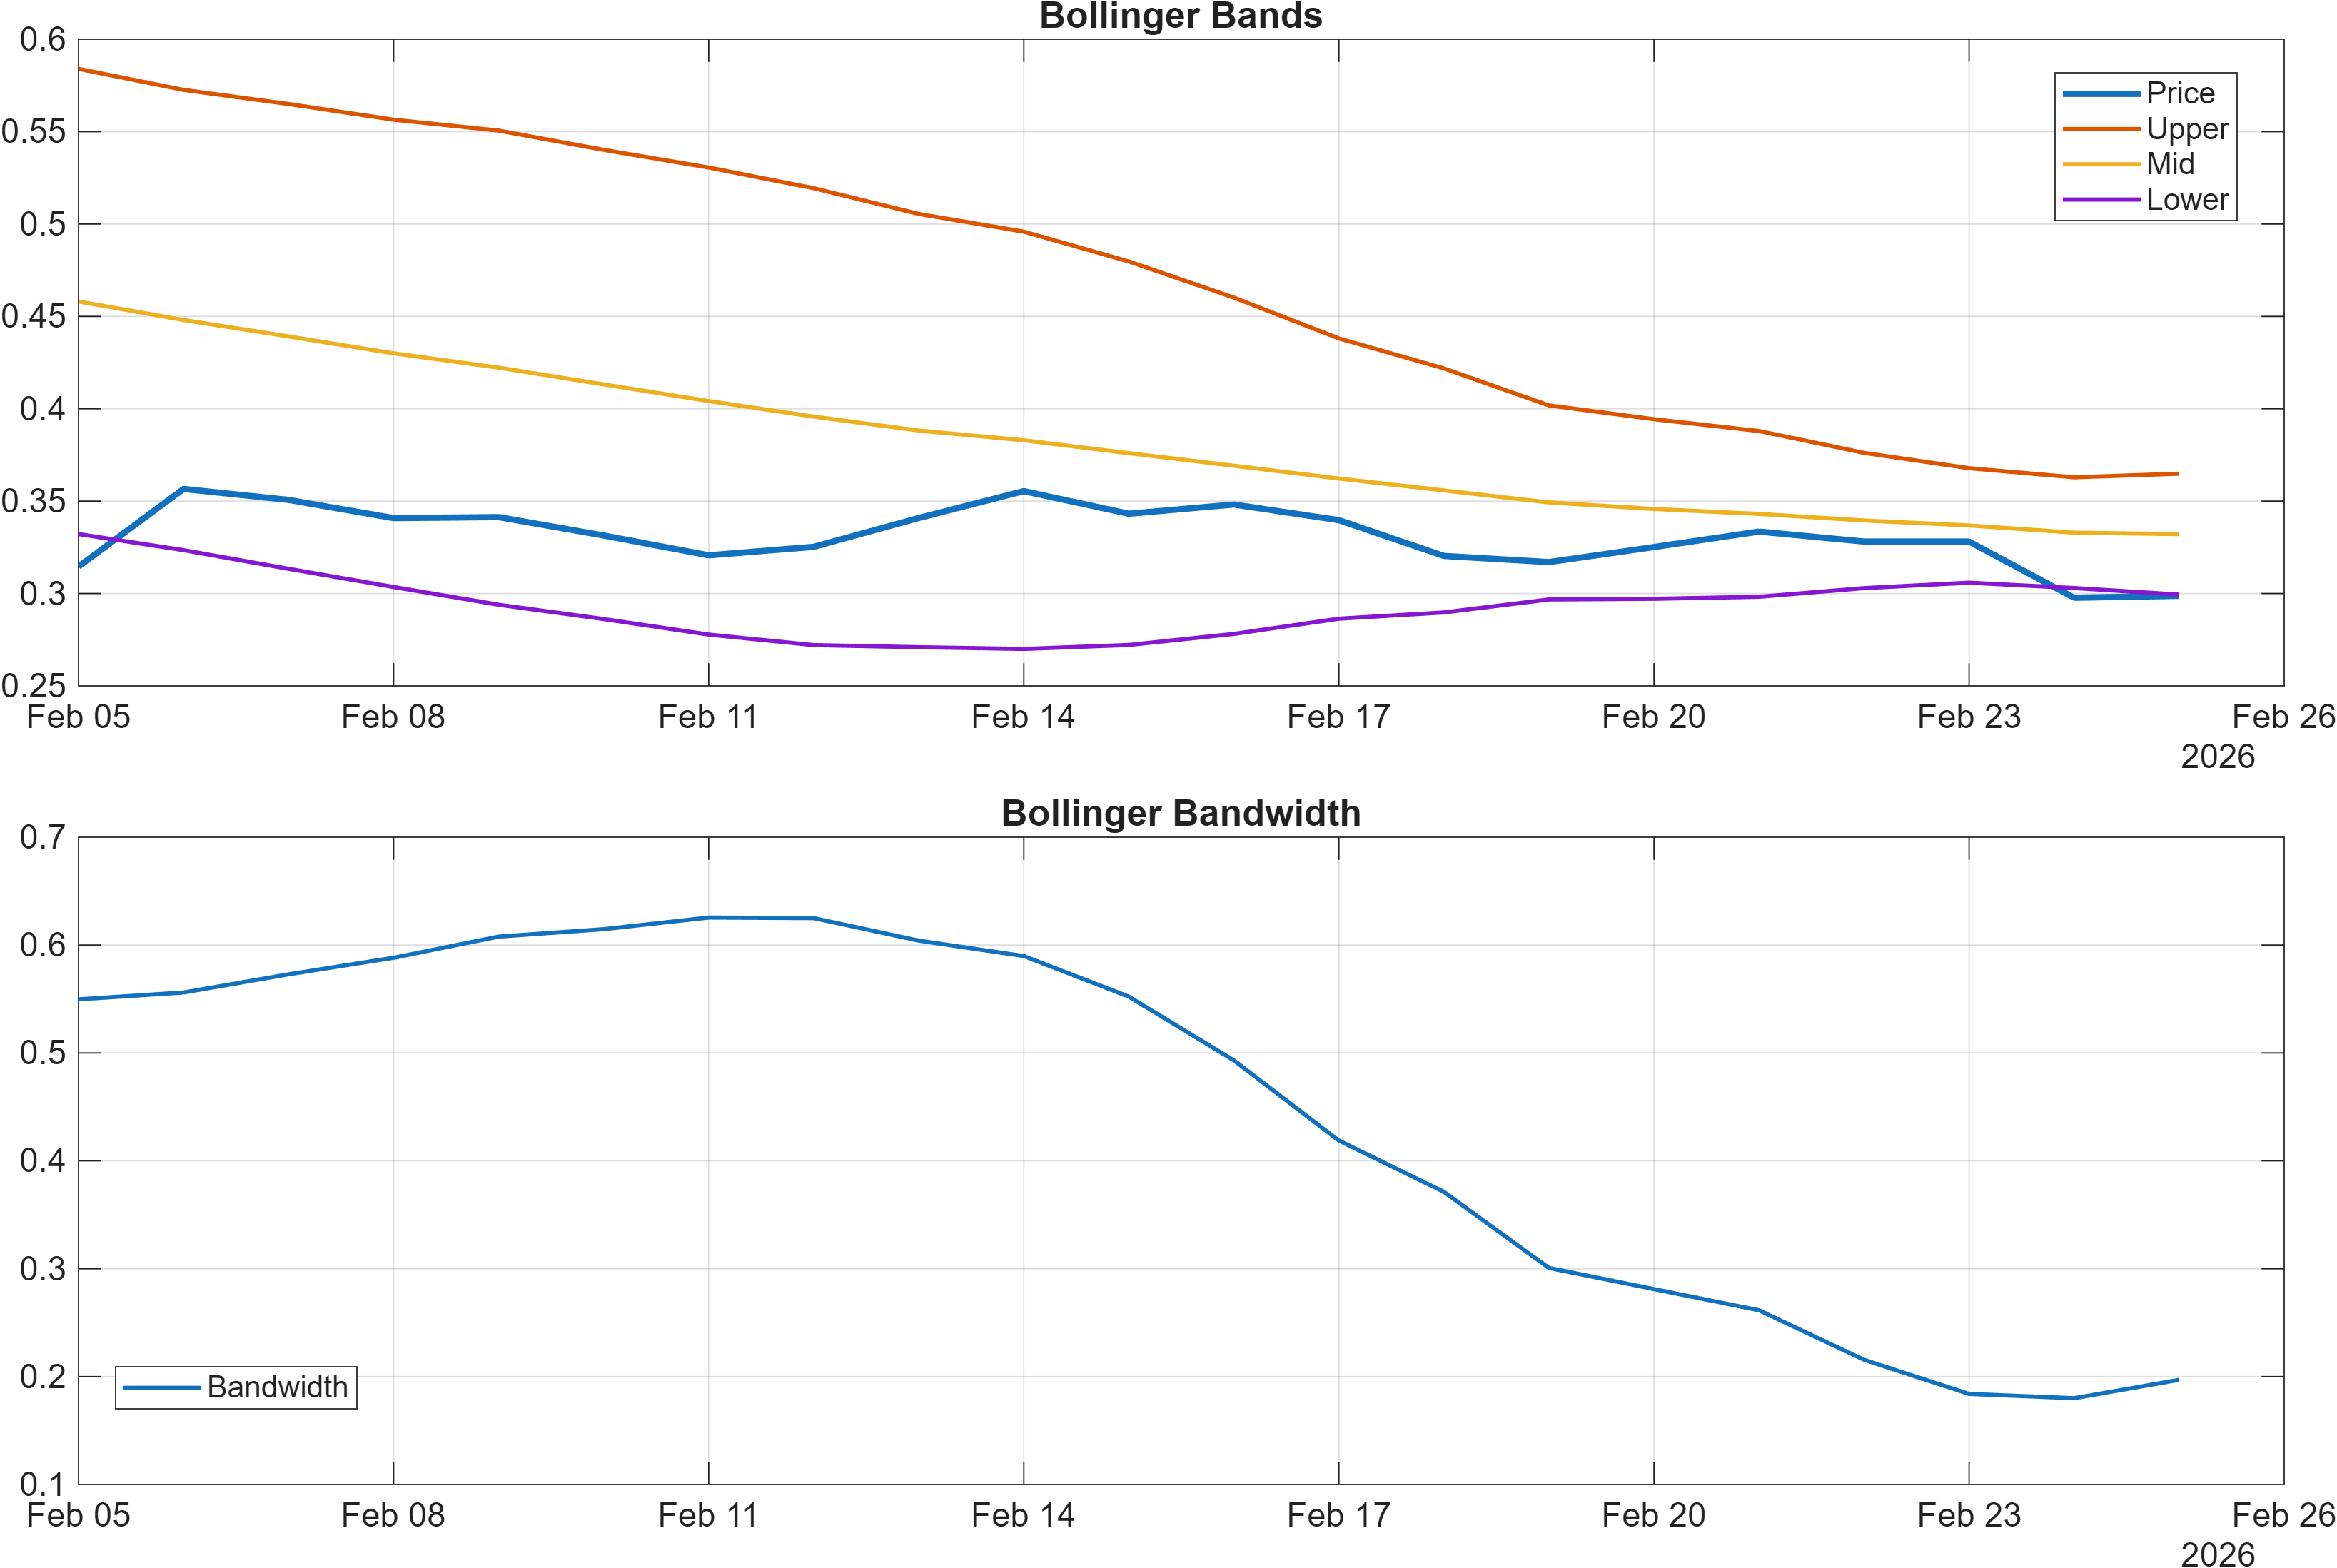
Volatility is not signaling an extreme squeeze: Bollinger bandwidth at 0.1970 suggests a moderate regime, which can support both follow-through moves and extended range trading depending on directional confirmation. In moderately wide regimes, false starts are common when participation metrics are weak—an issue hinted at later by multiple bearish volume/flow slopes in the 18-signal dashboard. Net, momentum is attempting to improve, but the surrounding structure still requires confirmation from trend repair and participation.
Interpretation: RSI bias = Neutral, MACD hist = 0.0030.
Interpretation: Bandwidth (volatility regime) latest = 0.1970.
4) Support / Resistance zones
ETHW-USD’s immediate risk framework is clearly defined by support ~0.3136 and resistance ~0.5903. With the trend model still bearish (close below MA50 and MA50 below MA200), resistance becomes more than a price line; it functions as a validation threshold for any attempted trend transition. Conversely, support is the level where existing bearish structure can shift from “controlled weakness” to more acute deterioration if breaks persist.
The wide separation between support and resistance highlights a market that may be trading with large decision bandwidth, where mid-range price action can remain ambiguous. This matters because momentum indicators are mixed: a slightly positive MACD histogram (0.003028) can coexist with bearish RSI (41.96) without forcing an immediate directional resolution. In that environment, level discipline typically dominates indicator interpretation: reactions near 0.3136 carry more information than signals printed in the middle of the range.
The scenario logic provided aligns with institutional level-trading practice: a break above resistance with volume is the condition for continuation, while a close below support increases downside risk. Given that multiple participation/flow measures in the signal set are bearish (e.g., OBV slope and AD line slope), a breakout signal is more credible when it arrives with visible volume confirmation rather than price-only movement.
Support ~ 0.3136 | Resistance ~ 0.5903
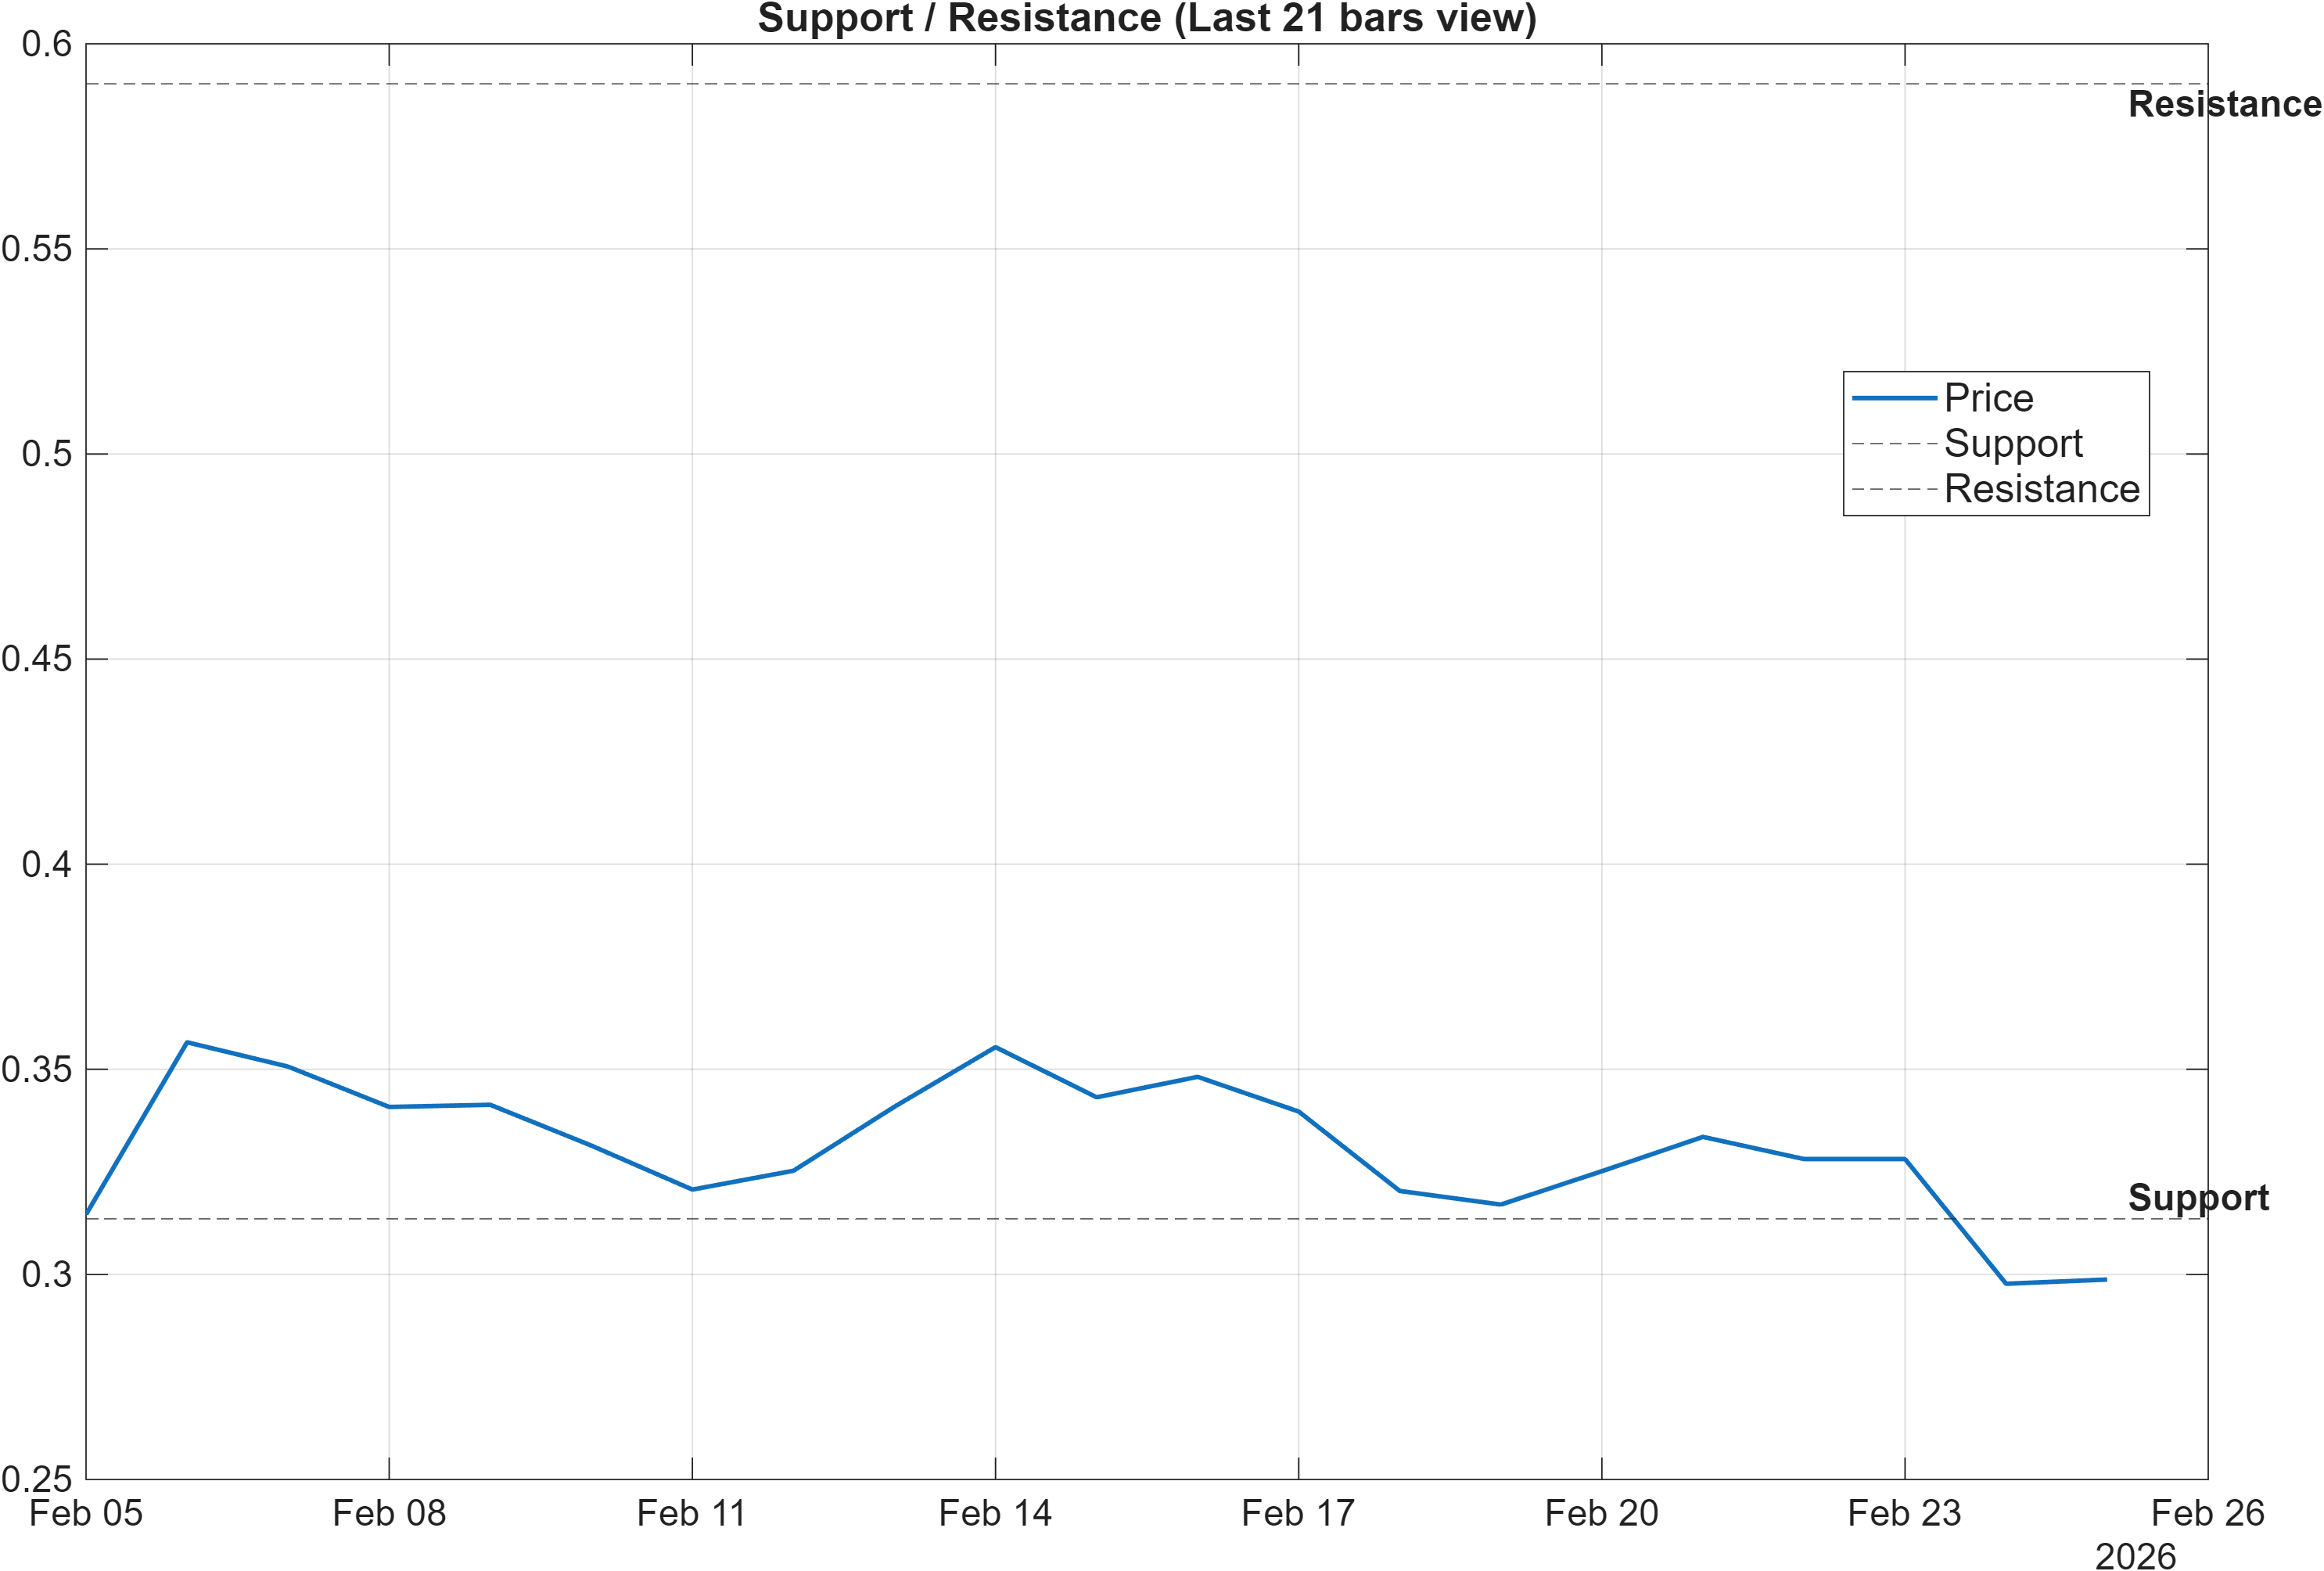
Scenario view: Break above resistance with volume → continuation. Close below support → signal deterioration risk.
5) Quant Technical Dashboard (18 Signals)
KGNAI AI Technical Analysis Score (Deep Reinforcement Learning): Rank #421 out of 800 (Rank 1 represents the strongest technical positioning and a higher probability of favorable price behavior. As ranks increase toward the maximum, the probability of favorable outcomes weakens and bearish positioning becomes more dominant.) | Label: Neutral | Score: -0.052
18-Signal Technical Confluence Score: -0.333 (Bearish)
Overall Technical Score (18-signal confluence + DRL rank blend): -0.249 (Neutral)
Note: The blended score reflects signal strength weighted against broader AI technical ranking, which may temporarily diverge.
Blended technical score breakdown: -0.249 (Neutral | Bull 4 / Bear 10 / Neutral 4)
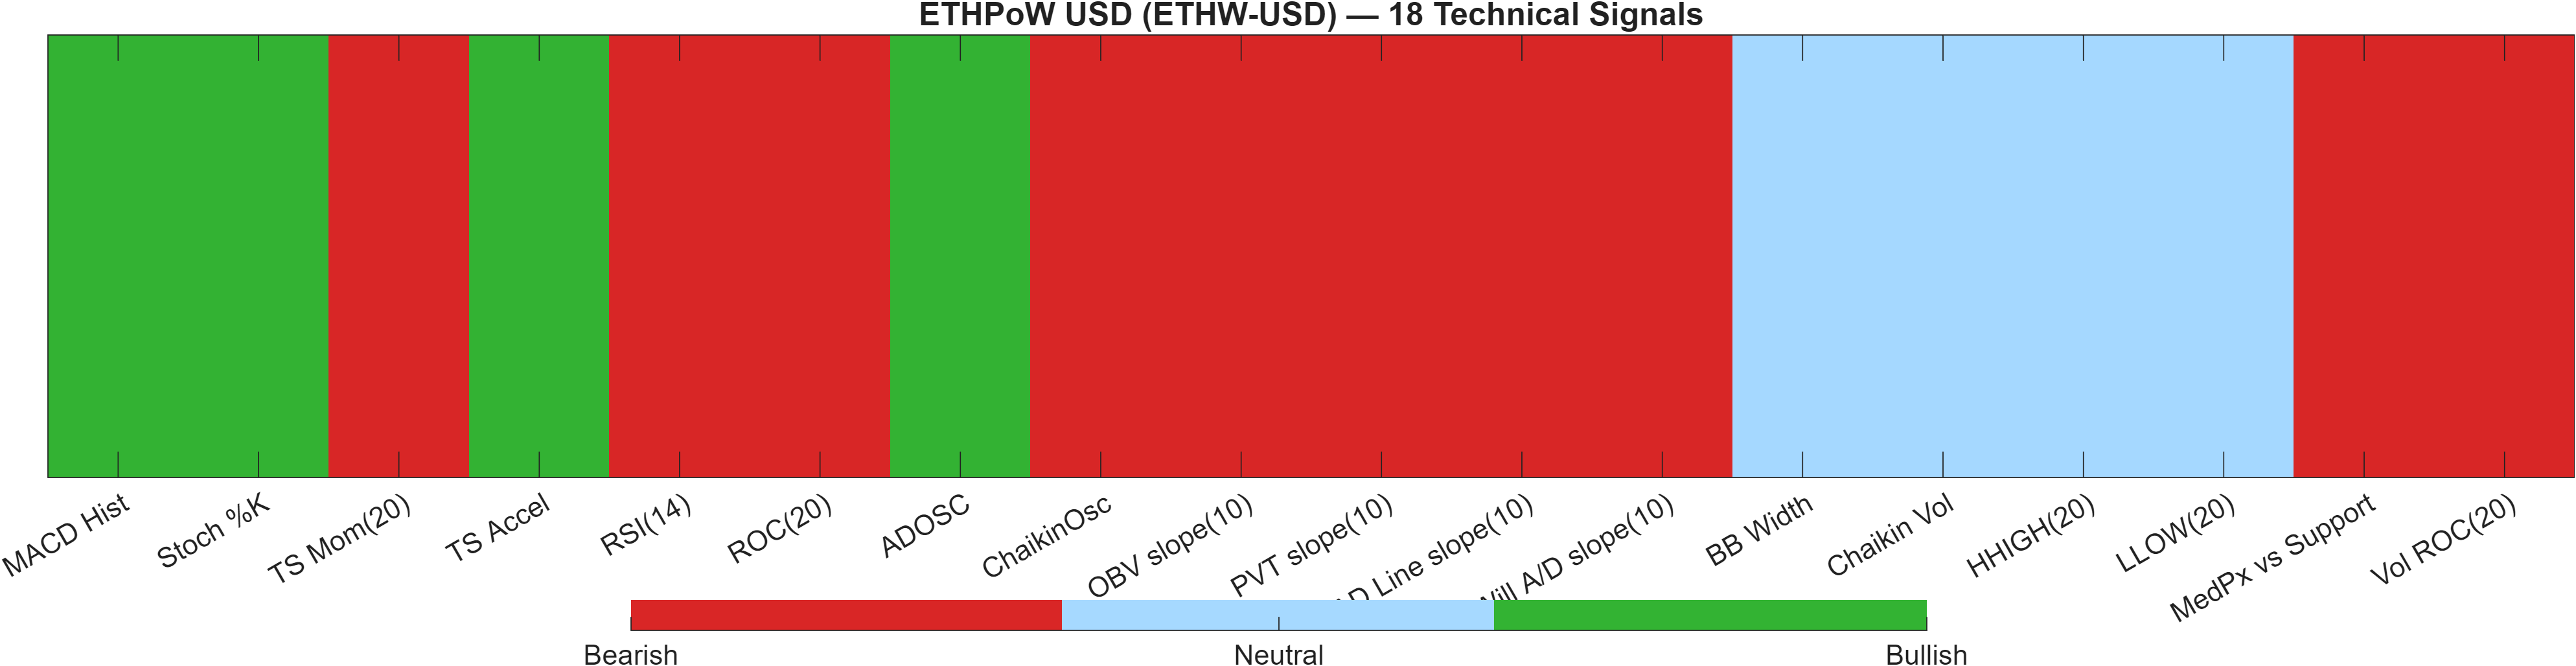
The technical layer is best described as bearish at the micro-signal level but tempered by the AI ranking blend. The confluence score of -0.333 (Bearish) reflects a 10-to-4 imbalance in Bear versus Bull signals (with 4 Neutral), while the Deep Reinforcement Learning technical rank is #421 out of 800 with a score of -0.052, keeping the blended output at -0.249 (Neutral). That gap is analytically meaningful: it indicates the indicator stack is currently printing more downside pressure than the broader pattern-recognition model is willing to classify as decisively weak.
Looking across signal families, the divergence is clear. Momentum shows a small constructive pocket (e.g., MACD histogram bullish at 0.003028 and TS Accel bullish at 0.1129), but it is outweighed by broader weakness in trend/momentum carry (e.g., TS Mom(20) at -0.05887 and ROC(20) at -16.22, both bearish). Participation and flow are also a central drag: bearish slopes in OBV and the AD Line imply that price moves are not being supported by improving accumulation dynamics in the recent window.
Volatility is not providing an obvious “reset” signal. With BB Width at 0.197 marked Neutral and Chaikin Vol at -38.52 also Neutral, the dashboard is not flagging an extreme compression that would force a near-term breakout. In that setting, the blended neutrality can be read as a caution against over-interpreting the bearish confluence as a one-way trade: the model blend suggests the bearish condition may be persistent but not accelerating, and therefore most sensitive to level-based confirmation around 0.3136 and 0.5903.
Signal table (Bull/Bear/Neutral)
| Indicator | Value | Signal |
|---|---|---|
| MACD Hist | 0.003028 | Bullish |
| Stoch %K | 1.436 | Bullish |
| TS Mom(20) | -0.05887 | Bearish |
| TS Accel | 0.1129 | Bullish |
| RSI(14) | 41.96 | Bearish |
| ROC(20) | -16.22 | Bearish |
| ADOSC | 20.49 | Bullish |
| ChaikinOsc | -3.986e+06 | Bearish |
| OBV slope(10) | -5.915e+06 | Bearish |
| PVT slope(10) | -4.996e+05 | Bearish |
| AD Line slope(10) | -1.182e+07 | Bearish |
| Will A/D slope(10) | -0.04594 | Bearish |
| BB Width | 0.197 | Neutral |
| Chaikin Vol | -38.52 | Neutral |
| HHIGH(20) | 0.3675 | Neutral |
| LLOW(20) | 0.2859 | Neutral |
| MedPx vs Support | -0.01217 | Bearish |
| Vol ROC(20) | -38.55 | Bearish |
Interpretation: Indicator-level signals form the base confluence, which is then adjusted using a separate AI-driven technical ranking model. The final technical score summarizes this combined view.
6) News sentiment + extractive gist
Note: Instrument-specific news matches were not found, so the digest includes broader market/sector headlines. Links are provided for verification.
Sentiment score (avg): -0.032 | Positive: 6% | Neutral: 69% | Negative: 25%
KGNAI AI News Sentiment Score (normalized -1 to +1): Not available (as of —) | Label: Not available | Overall news score: -0.03
Positive Developments
Recent coverage across major financial outlets indicates selective support from market-structure and product-expansion narratives in the broader crypto ecosystem. Exchange-led initiatives—such as broader access to multi-asset trading and the expansion of derivatives-style offerings—can improve participation channels and reduce friction for certain cohorts, which can be constructive for sector liquidity conditions. From a positioning perspective, these themes tend to align with the report’s “neutral” AI posture: they are not a direct catalyst for ETHW-USD specifically (instrument-level matches were not found), but they can contribute to a more stable background bid when risk appetite improves. In the current technical context—where MACD histogram is slightly positive (0.003028) despite a bearish trend configuration—incremental improvements in sector tone may matter most if they coincide with price holding above support ~0.3136 and volatility remaining orderly (bandwidth 0.1970).
Neutral / Mixed Developments
The dominant signal in the news mix is neutrality: 69% of the coverage is classified as neutral, and the average sentiment score is close to flat at -0.032. That profile typically reflects an information-heavy tape where product updates, regulatory discussion, and market plumbing topics circulate without a single unifying driver. For ETHW-USD, this aligns with the broader analytical picture of a market that is searching for direction—momentum is mixed (RSI 41.96 versus modestly positive MACD), and the blended technical score remains Neutral (-0.249) even as confluence is bearish. In neutral news regimes, technical levels often do more work than narratives, making the 0.5903 resistance and 0.3136 support zones more relevant as decision points than day-to-day headlines.
Negative / Risk Signals
Risk coverage across major financial outlets emphasizes two pressure points: fragility in broader crypto price conditions and tightening scrutiny around complex derivatives constructs. These themes can be indirectly relevant for ETHW-USD because they often impact liquidity and risk limits across the sector, even when a specific token is not named. With 25% of coverage classified as negative and the average score slightly below zero (-0.032), the bias is consistent with the technical dashboard’s internal tilt: the 18-signal set is Bearish (-0.333) and includes multiple bearish participation/flow measures. In such an environment, downside risk tends to express through failed rebounds and weak volume follow-through; the report’s scenario marker—close below 0.3136—is the clearest risk trigger, while upside requires stronger confirmation (a break above 0.5903 with volume).
- Whether price can remain above 0.3136 as momentum attempts to stabilize (MACD hist 0.003028).
- Any sustained improvement in participation proxies (e.g., OBV/AD slope behavior) that would support a move toward 0.5903.
- Whether sentiment composition shifts materially from the current 69% neutral baseline.
Sources referenced: Reuters, Bloomberg, Yahoo Finance, MarketWatch, Investing.com
Snapshot: AI Rank (Short–Mid–Long): Neutral (Neutral–Neutral–Neutral) · Technical Confluence: Bearish · Key Levels: Support ~0.31 | Resistance ~0.59 · News Sentiment: Neutral
7) Sources
- ETH bounces off $1.8K as multiple Ether price metrics point to prolonged weakness — https://cointelegraph.com/news/eth-bounces-off-1-8k-as-multiple-ether-price-metrics-point-to-prolonged-weakness?utm_source=rss_feed&utm_medium=rss&utm_campaign=rss_partner_inbound
- ESMA warns crypto perpetual derivatives likely fall under CFD rules — https://cointelegraph.com/news/crypto-derivatives-eu-regulations-esma?utm_source=rss_feed&utm_medium=rss&utm_campaign=rss_partner_inbound
- Coinbase opens stock and ETF trading to all US users in multi-asset push — https://cointelegraph.com/news/coinbase-opens-stock-and-etf-trading-to-all-us-users-in-multi-asset-push?utm_source=rss_feed&utm_medium=rss&utm_campaign=rss_partner_inbound
- Kraken debuts tokenized stock perpetual futures for non-US traders — https://cointelegraph.com/news/kraken-launches-regulated-tokenized-equity-perpetual-futures-for-global-traders?utm_source=rss_feed&utm_medium=rss&utm_campaign=rss_partner_inbound
- MoonPay launches ‘Agents,’ giving AI systems wallets and onchain cash flow — https://cointelegraph.com/news/moonpay-launches-agents-giving-ai-systems-wallets-and-onchain-cash-flow?utm_source=rss_feed&utm_medium=rss&utm_campaign=rss_partner_inbound
- Key Bitcoin onchain signal may mark BTC’s next demand revival — https://cointelegraph.com/news/key-bitcoin-onchain-signal-may-mark-btc-s-next-demand-revival?utm_source=rss_feed&utm_medium=rss&utm_campaign=rss_partner_inbound
- Polymarket users favor Meteora in bets over ZachXBT crypto takedown — https://cointelegraph.com/news/polymarket-bets-zachxbt-insider-trading?utm_source=rss_feed&utm_medium=rss&utm_campaign=rss_partner_inbound
- Longest Ether dip since 2022 ignored by whales: What’s next for ETH? — https://cointelegraph.com/news/longest-ether-dip-since-2022-ignored-by-whales-what-s-next-for-eth?utm_source=rss_feed&utm_medium=rss&utm_campaign=rss_partner_inbound
You may also like: How KGNAI AI ranks instruments across global markets
Disclaimer: KGNAI provides AI-generated analytics and educational market commentary only. This is not financial advice. Markets involve risk. Always do your own research.