
Banana Gun USD (BANANA28066-USD) — 27-Feb-2026 Technicals Stay Neutral While Mid/Long Ranks Hold a Bullish Tilt
Banana Gun USD (BANANA28066-USD) presents a split-profile setup: comparative ranks skew constructive beyond the shortest horizon, while the price/indicator layer remains more cautious. In the KGNAI ranking universe of 800 crypto instruments, the weekly view sits near the very top of the distribution, whereas the daily view remains mid-pack. On the chart, the moving-average structure flags bearish alignment (Close vs MA50 = Bearish; MA50 vs MA200 = Bearish), which can act as a drag even when broader positioning improves. Momentum is also conflicted: RSI(14) at 39.07 keeps the bias defensive, but MACD histogram at 0.05932 shows early positive pressure. Volatility conditions appear moderate with Bollinger Bandwidth at 0.1880, suggesting room for expansion around key decision zones: support ~4.2878 and resistance ~7.7497. News sentiment is largely flat with a slightly negative average score.
- Rank stance: Short-term Neutral | Mid-term Bullish | Long-term Bullish
- Technical confluence: Neutral (18-signal confluence -0.111; blended overall -0.135)
- Key levels: Support ~ 4.2878 | Resistance ~ 7.7497
- News sentiment bias: Neutral (avg -0.011; 12% positive / 75% neutral / 12% negative)
- Confirmation / invalidation: Strength is better supported on a break above 7.7497 with volume; risk increases on a close below 4.2878.
KGNAI evaluates assets using large cross-sectional datasets built from millions of structured data points. Inputs incorporate fundamental metrics, technical structures, and systematically processed news sentiment. Statistical models, machine learning, and AI frameworks are used to assess relative positioning, signal alignment, and probabilistic behavior across broad universes.
- Ranks are comparative across the tracked universe, not absolute price targets.
- Confluence reflects alignment among independent signal groups.
- Support/resistance levels are probabilistic decision zones, not guarantees.
- Sentiment provides contextual bias within the broader analytical framework.
1) KGNAI AI Analysis
Region: CRYPTO
Total universe size: 800 ranked instruments
- Daily rank: #412 out of 800 — Neutral
- Weekly rank: #12 out of 800 — Bullish
- Monthly rank: #122 out of 800 — Bullish
- 3-Monthly rank: Not available for this horizon — Not available
BANANA28066-USD is characterized by time-horizon dispersion: the daily rank (#412) sits near the middle of the 800-instrument set, while the weekly rank (#12) is in the top cohort and the monthly rank (#122) remains in the upper portion of the distribution. This pattern often reflects an asset that is improving on intermediate windows even as near-term conditions lag—an alignment issue that can produce choppy price action as short-horizon participants fade moves that longer-horizon signals continue to accumulate.
The term view formalizes that split (Short-term: Neutral; Mid-term: Bullish; Long-term: Bullish). When weekly and monthly rankings lean bullish while the daily stays neutral, follow-through tends to be more dependent on whether spot technical structure can confirm. In this report, that confirmation burden is heightened because the trend layer (moving averages) is not yet supportive, and the blended technical score later in the dashboard is also neutral (not an outright risk-on regime).
The missing 3-month horizon is Not available in the provided data, which limits inference about whether the weekly strength is a transition into a longer-duration regime or a shorter-cycle feature. As a result, the most defensible read is relative positioning: BANANA28066-USD is better ranked on weekly/monthly than on daily, implying that the asset is being treated more constructively in cross-sectional models beyond the immediate window, but has not fully resolved short-term confirmation.
Want the full universe and complete rank tables? Unlock full access on KGNAI: https://www.kgnai.com/pricing
2) Price & trend overview
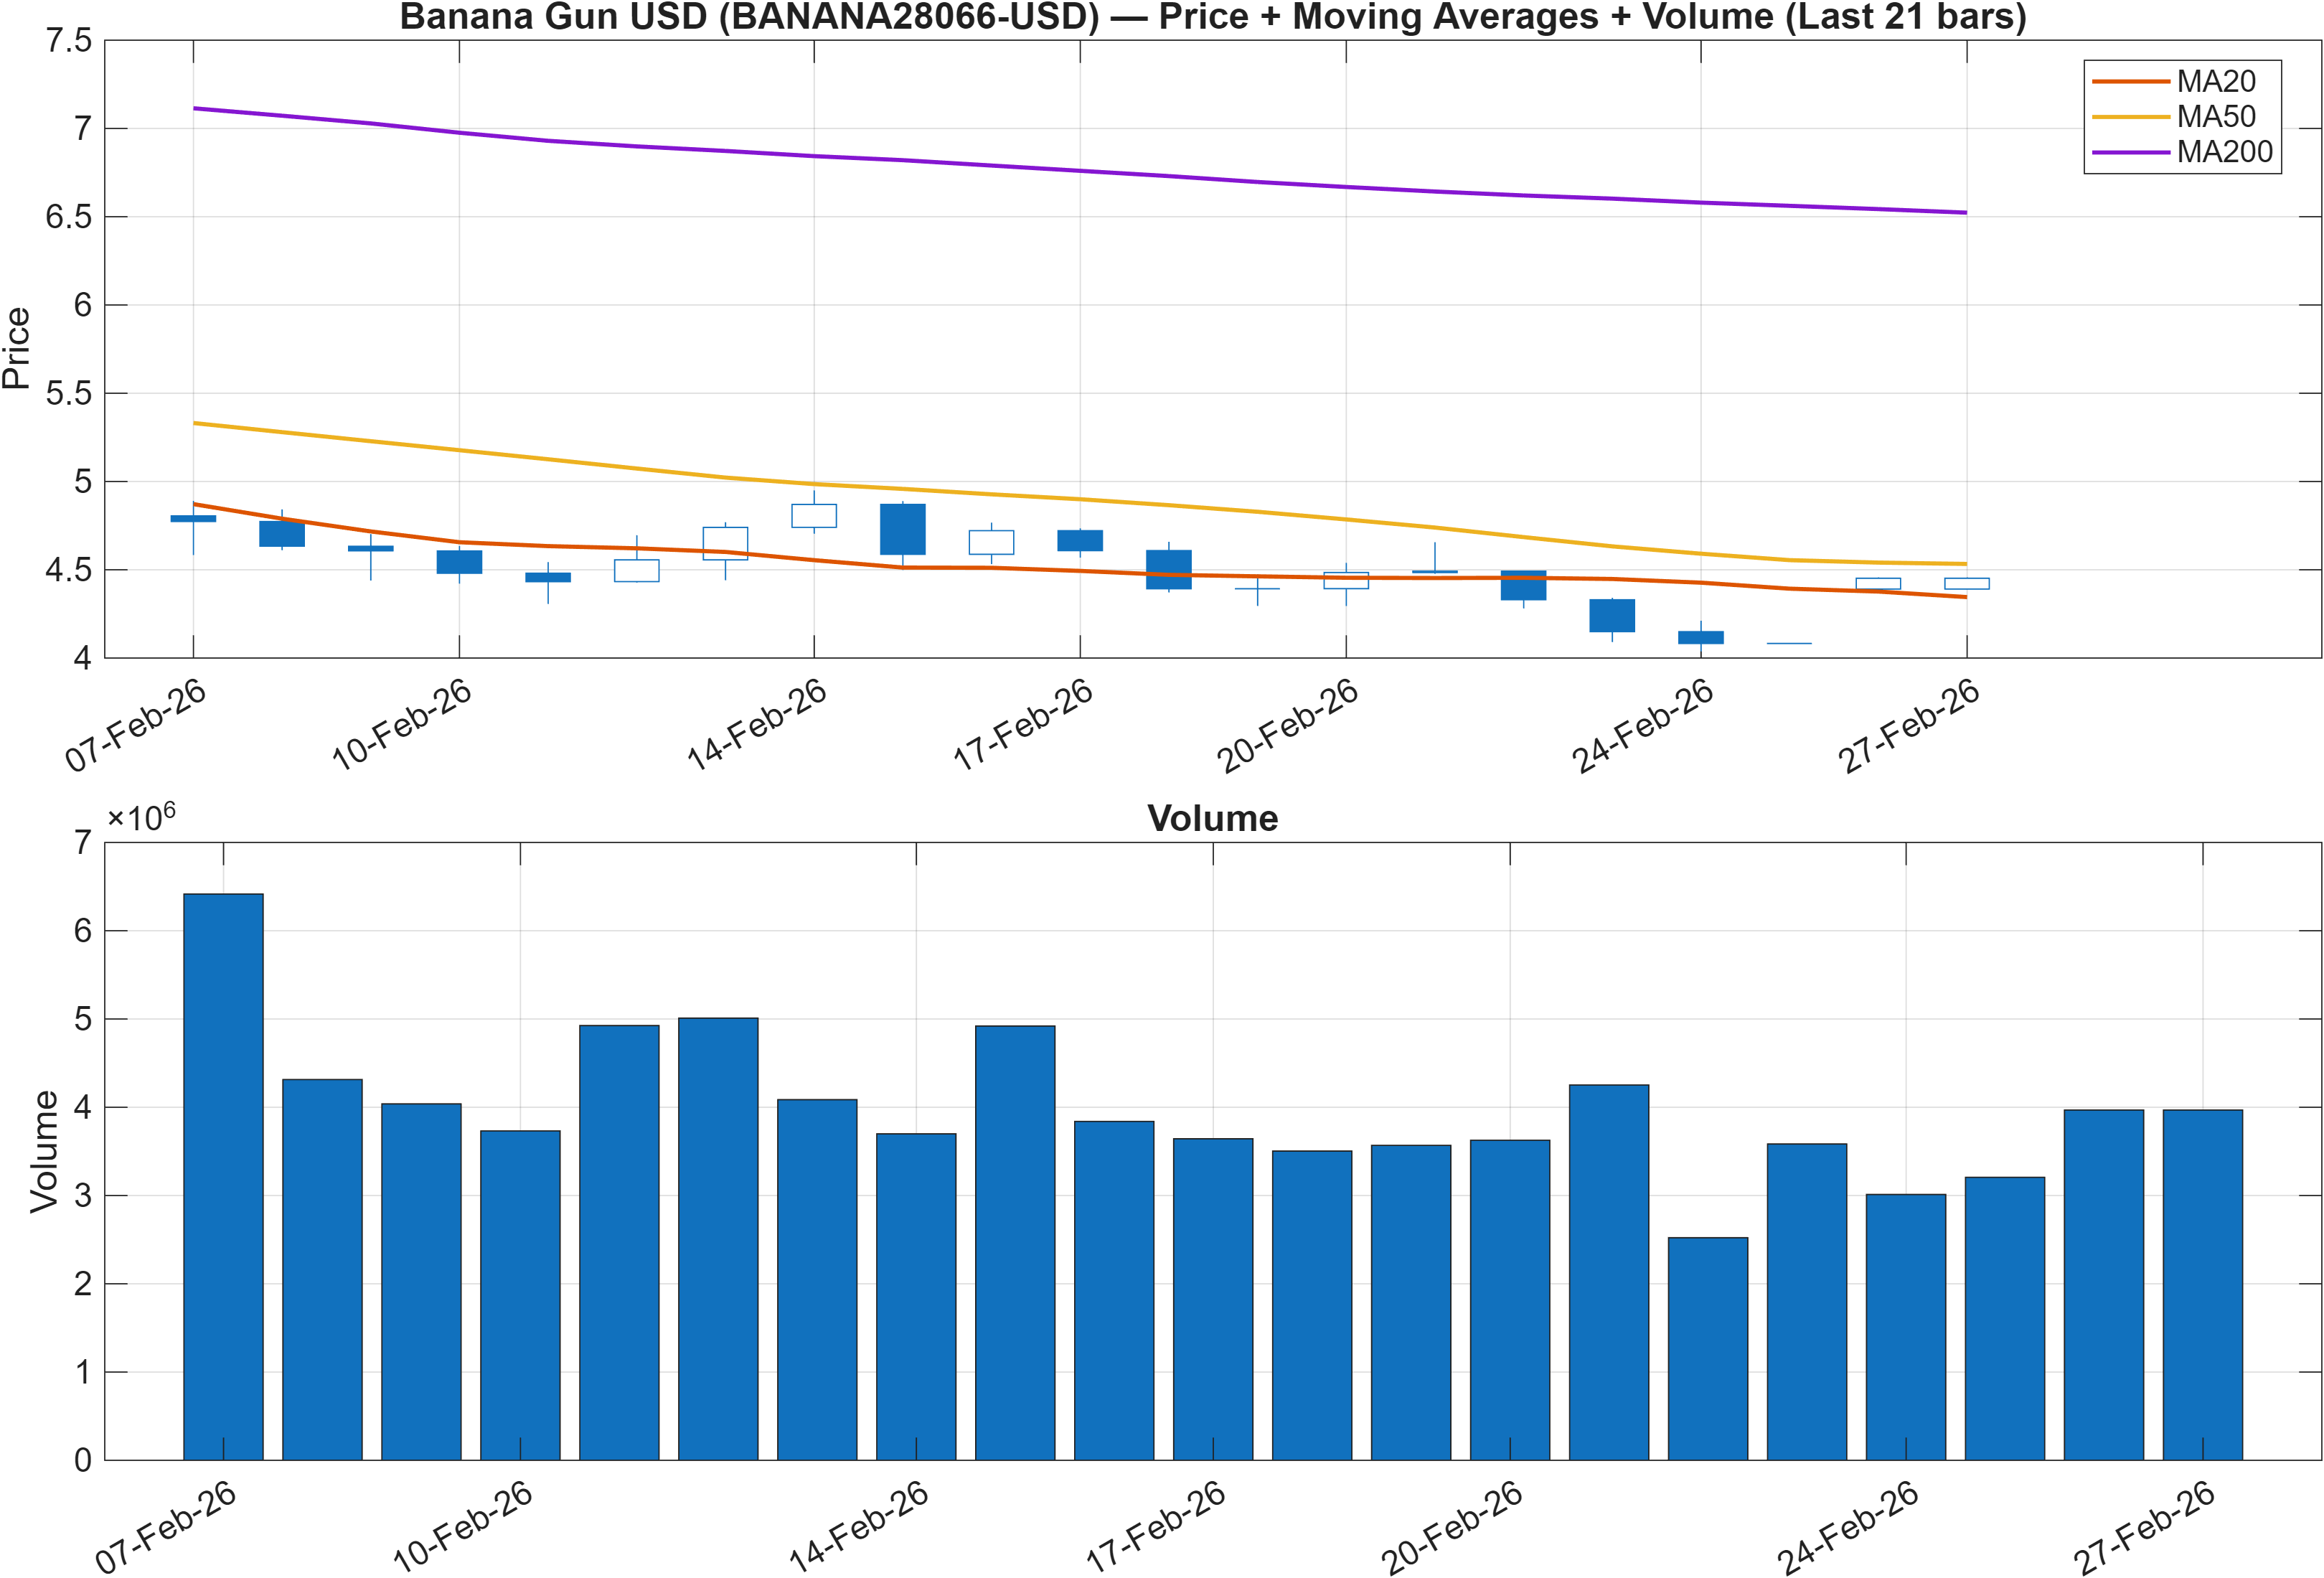
Interpretation: Close vs MA50 = Bearish, MA50 vs MA200 = Bearish.
Trend alignment vs cross-sectional strength
The trend layer is currently a headwind. With Close vs MA50 = Bearish and MA50 vs MA200 = Bearish, the moving-average stack implies the prevailing structure is still consistent with a downtrend or an incomplete base. This matters because, even when the weekly rank is exceptionally strong (#12), trend filters can delay confirmation by keeping systematic exposure constrained until price reclaims key averages.
The more constructive rank profile (weekly #12; monthly #122) therefore reads as potential demand building beneath a still-defensive trend template. In practice, that often shows up as rallies that struggle to persist until overhead supply is absorbed. This is consistent with the later confluence read being neutral rather than bullish (18-signal confluence -0.111; blended overall -0.135), suggesting that trend repair is not yet broadly validated across indicators.
From a market-structure perspective, the key question is whether this bearish MA configuration is late-cycle (lagging confirmation after selling pressure has already decelerated) or early-cycle (signaling further distribution risk). The dashboard provides mixed evidence: momentum is subdued with RSI(14) at 39.07, yet the MACD histogram is marginally positive (0.05932), which can occur during early basing phases. The practical implication is that trend confirmation is likely to be level-dependent, with the support/resistance bands (4.2878 / 7.7497) acting as the primary decision zones.
3) Momentum & volatility dashboard
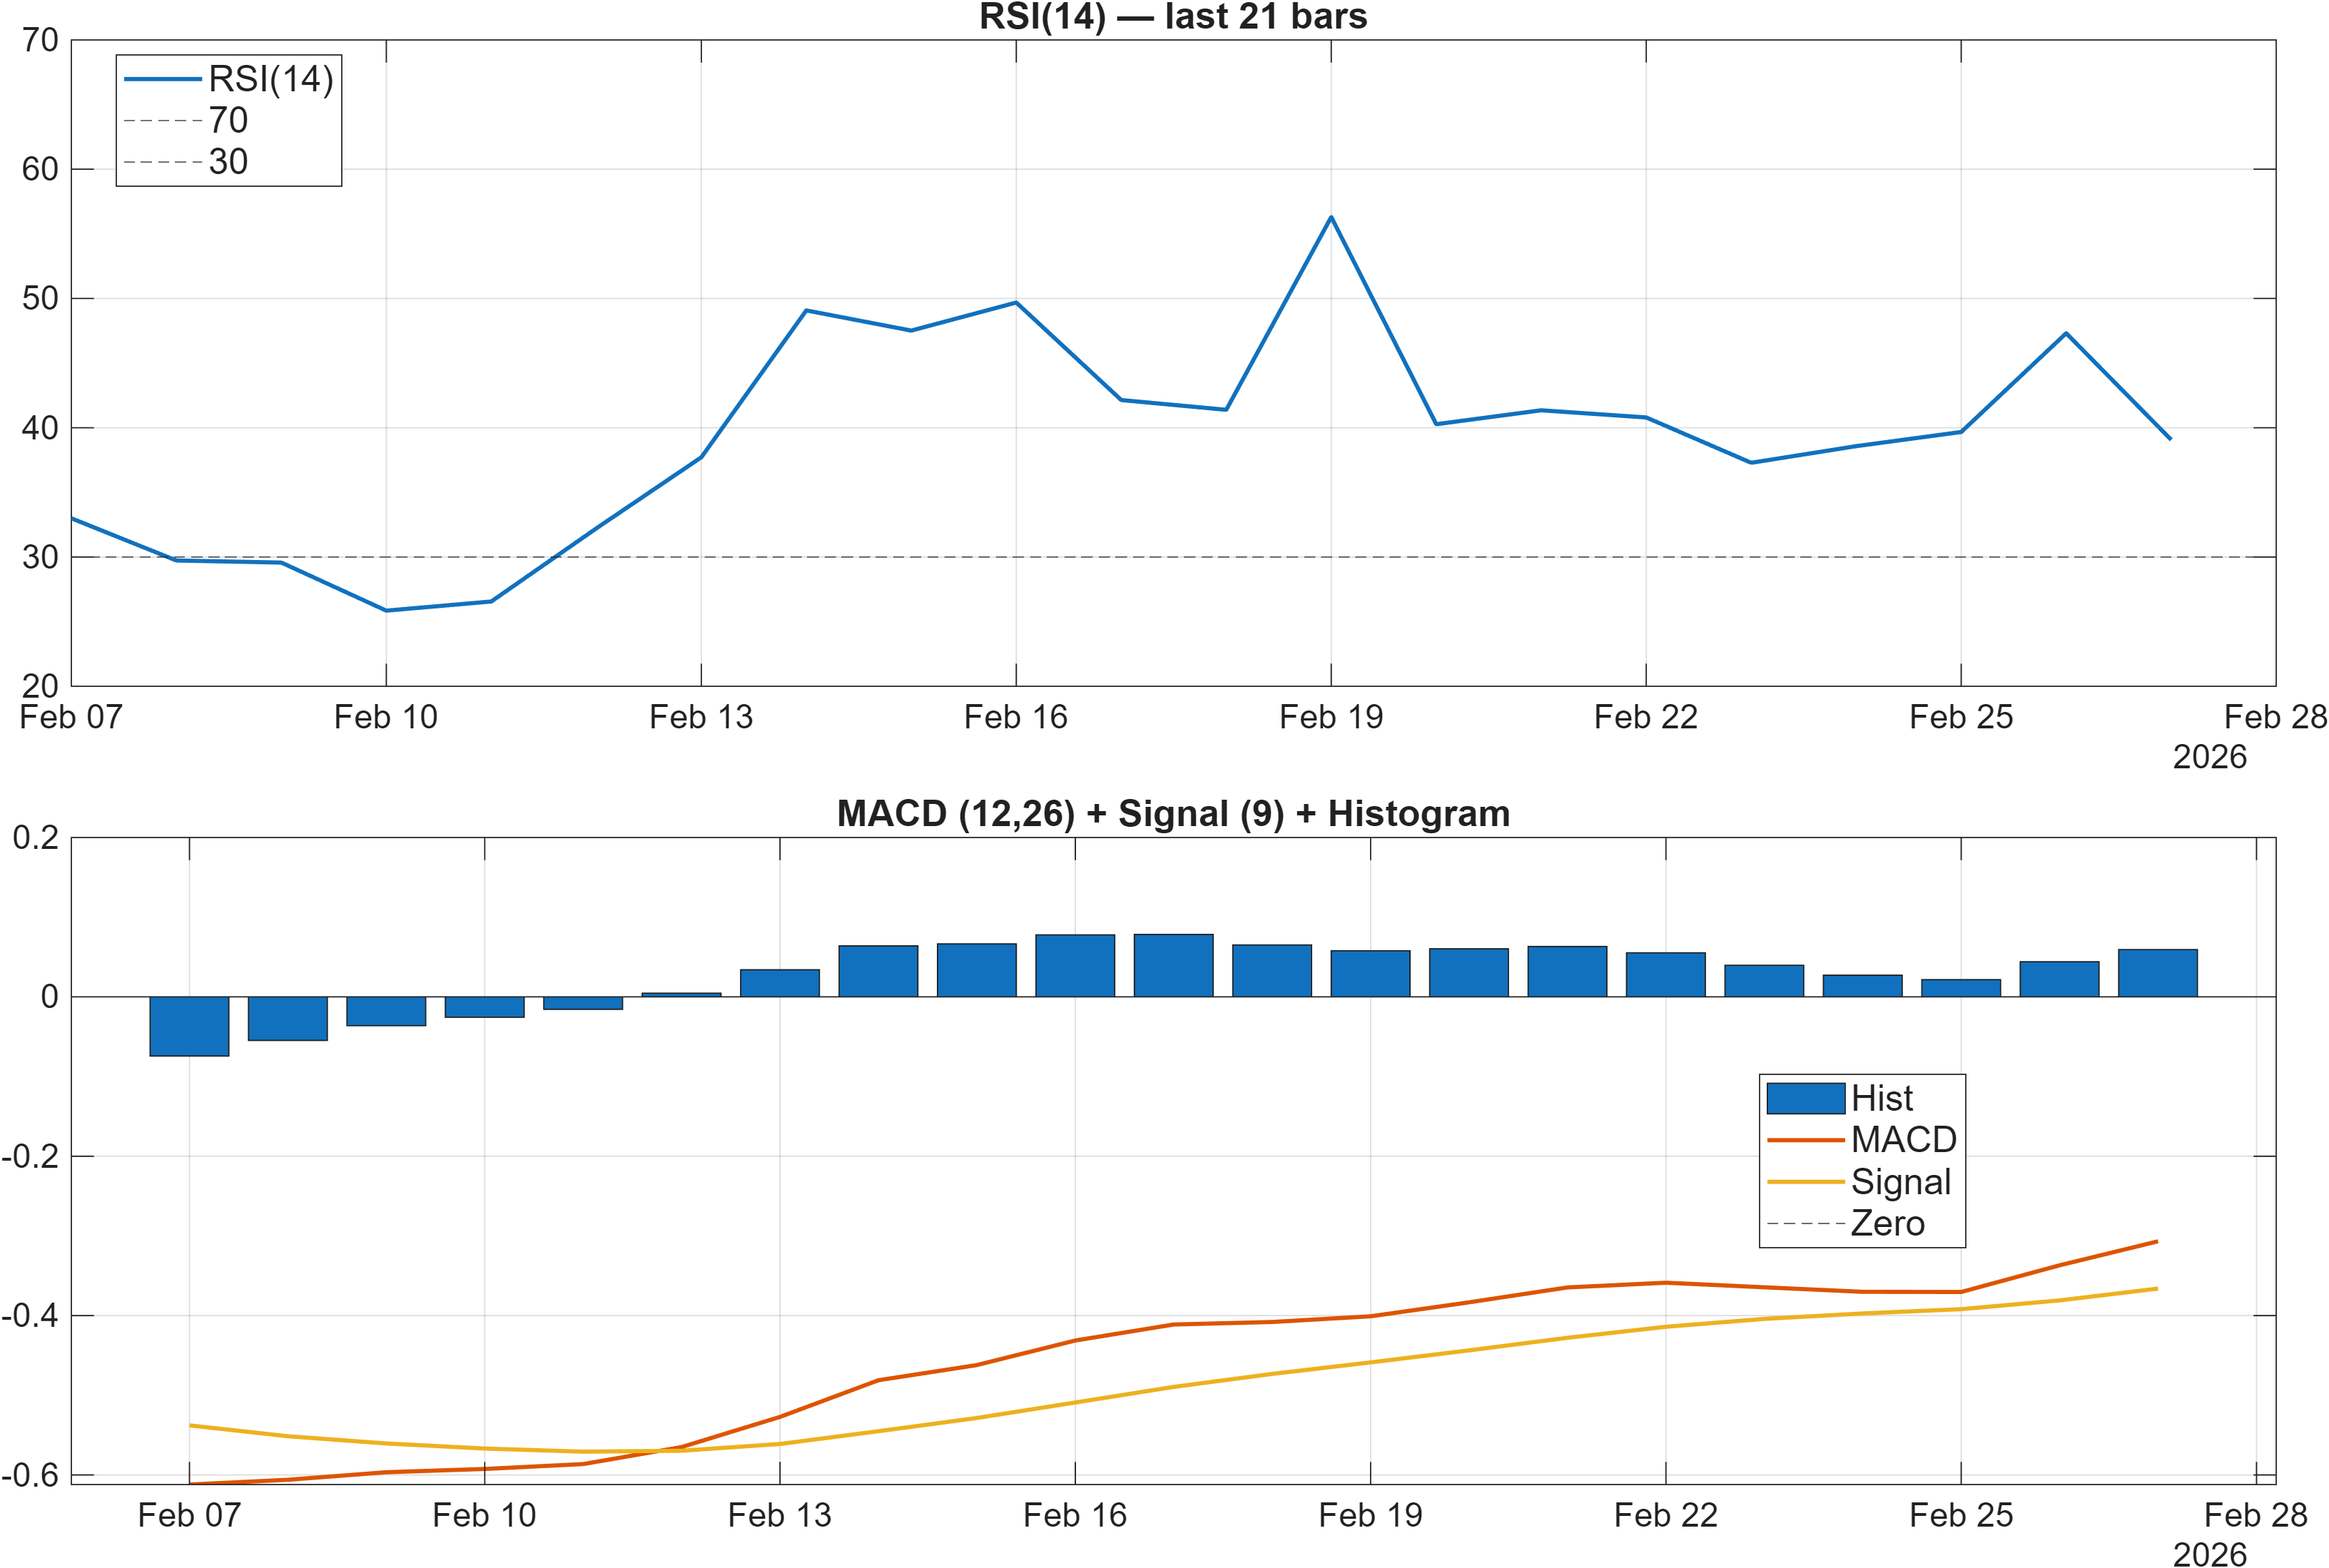
Interpretation: RSI bias = Bearish, MACD hist = 0.0593.
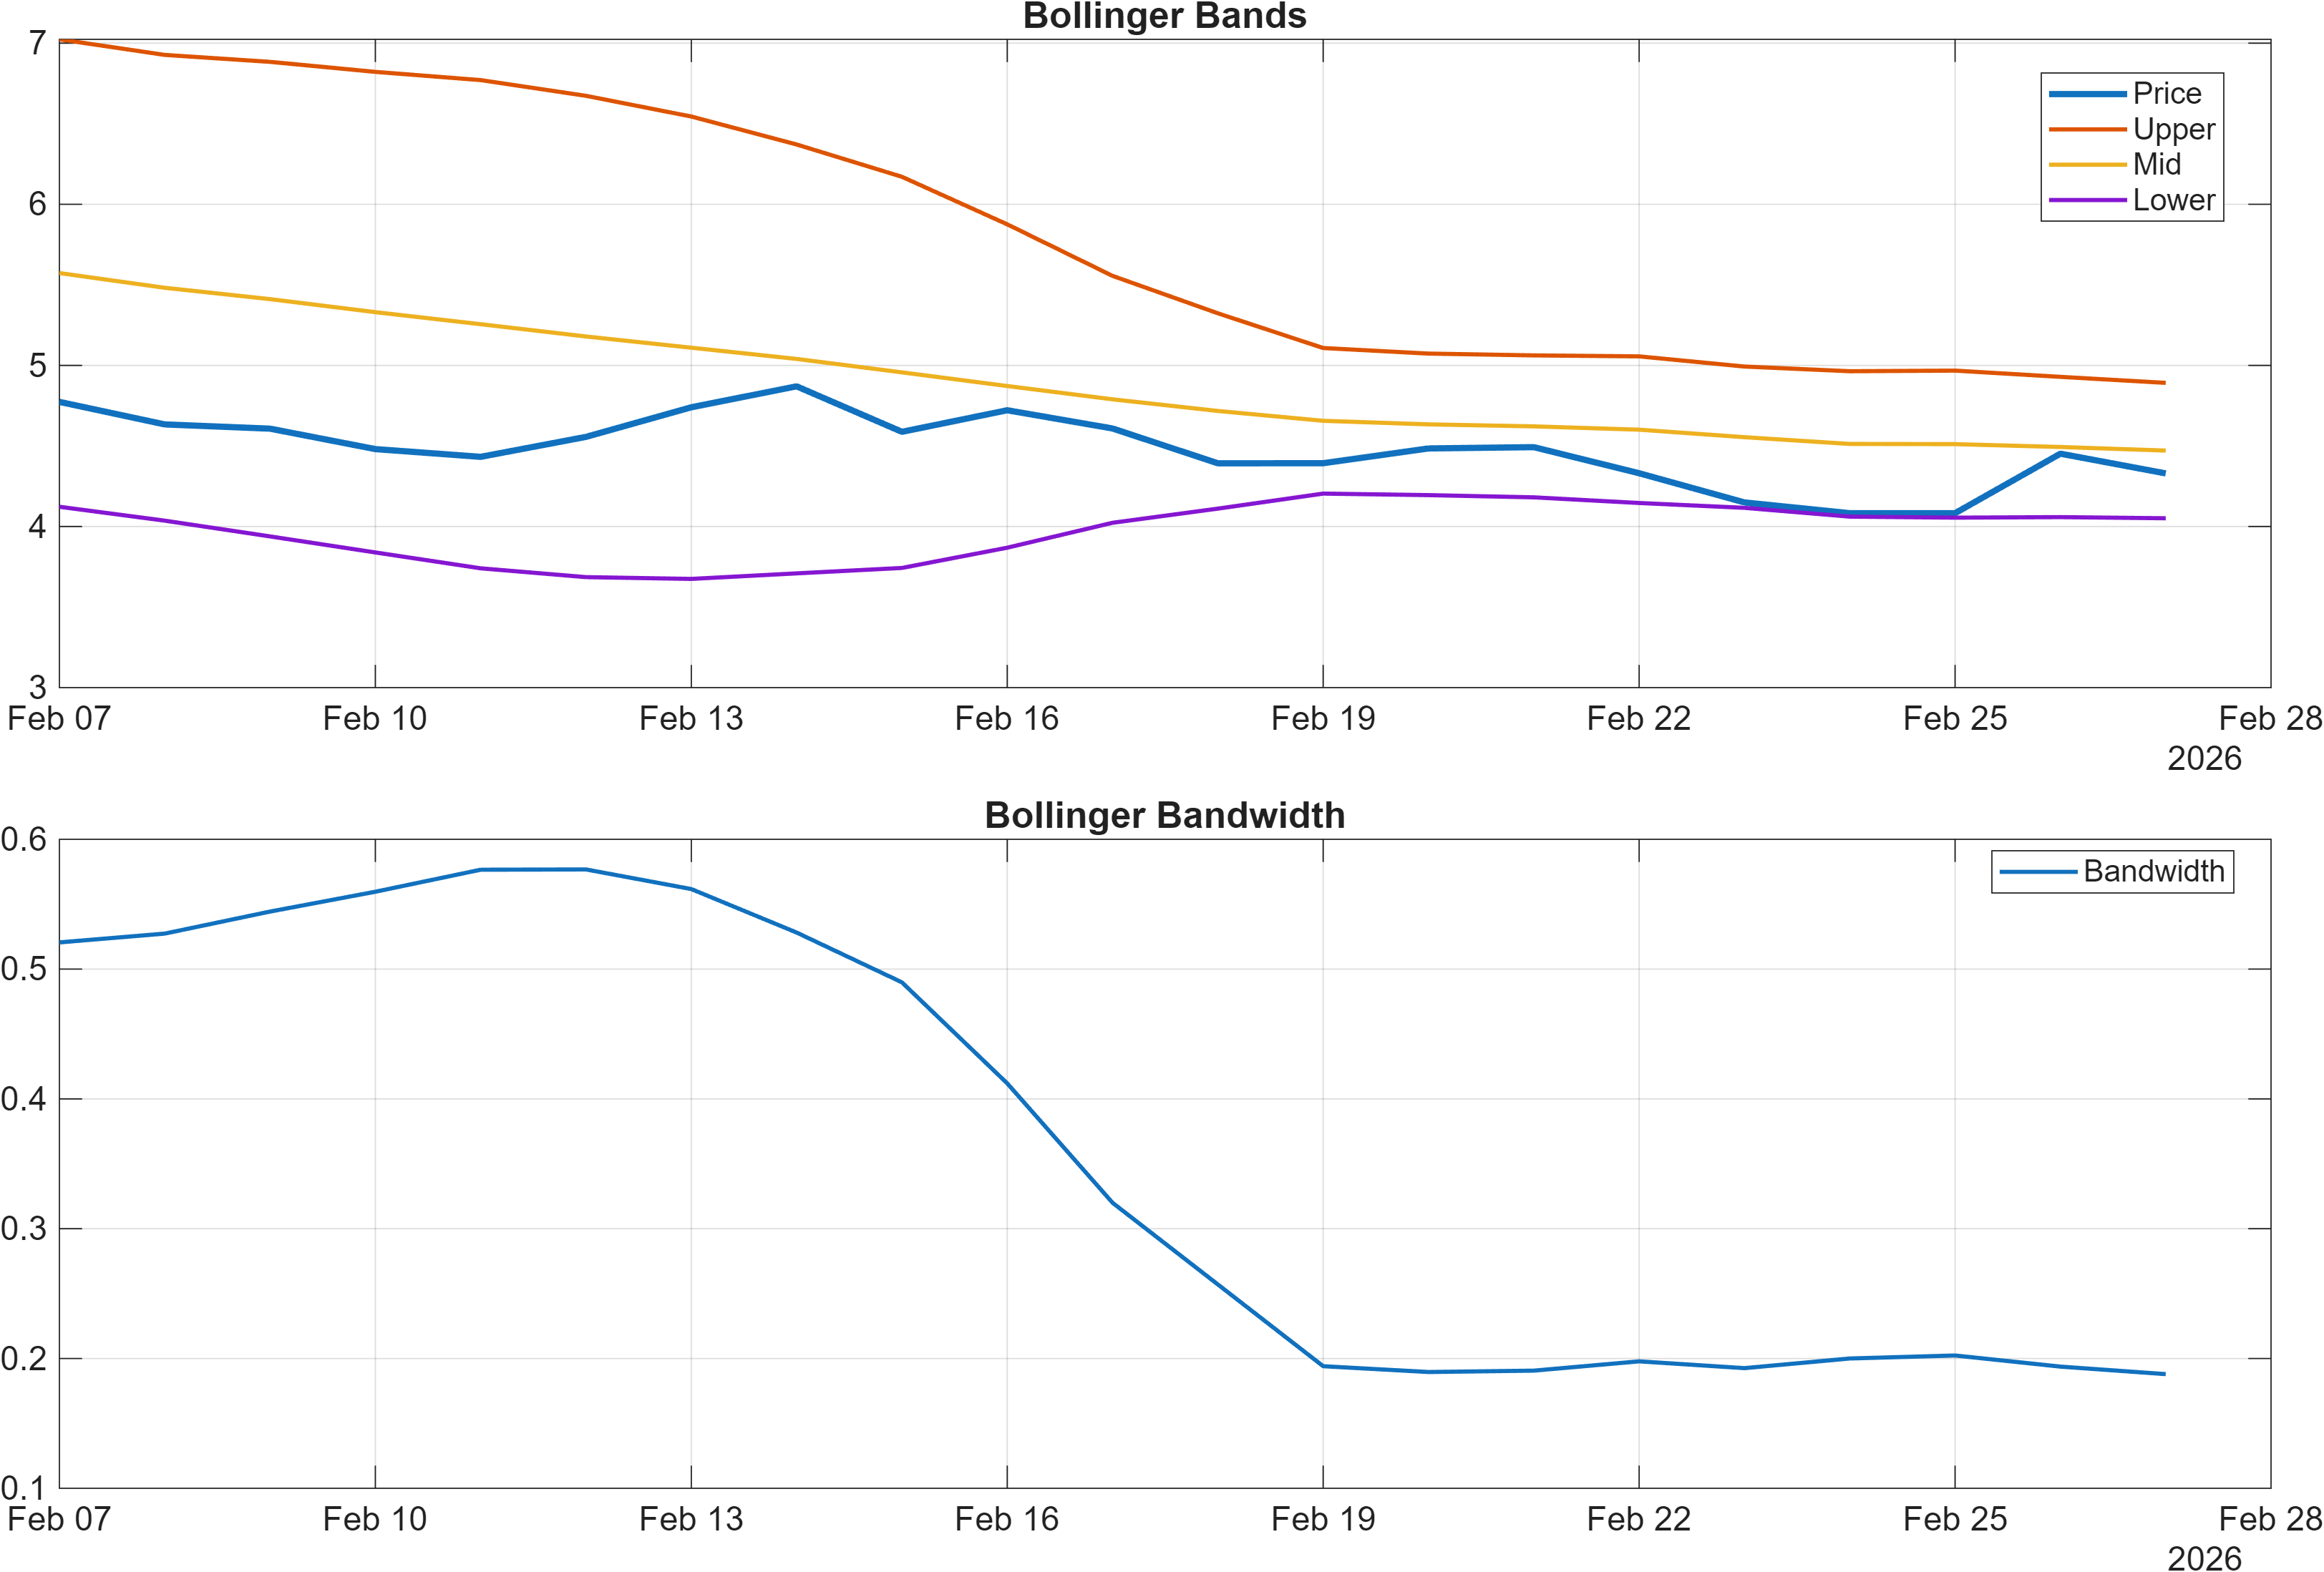
Interpretation: Bandwidth (volatility regime) latest = 0.1880.
Momentum divergence: RSI softness vs MACD stabilization
Momentum reads as divergent rather than directional. The RSI layer is still defensive—RSI(14) at 39.07 and the stated RSI bias as bearish typically align with weak demand follow-through and a tendency for rallies to be sold. At the same time, the MACD histogram at 0.05932 is positive, which can indicate early stabilization even if the broader trend has not fully turned.
The signal table reinforces this mixed momentum picture: ROC(20) at -6.563 and TS Mom(20) at -0.1816 are bearish, while TS Accel at 1.201 is bullish. Conceptually, that combination can be read as negative momentum that is attempting to improve at the margin—a common feature in basing regimes, but also a configuration that can fail if price remains capped by moving averages and resistance.
Volatility regime: moderate bandwidth, potential for expansion near levels
Volatility conditions look neither compressed nor extreme. With Bollinger Bandwidth at 0.1880 (also reflected as BB Width 0.188 in the signal set), the regime suggests the market has room to expand in either direction if a catalyst or liquidity impulse arrives. Because the broader technical confluence is neutral (overall -0.135), volatility expansion would ideally be evaluated in conjunction with the key horizontal levels rather than interpreted as inherently bullish or bearish. In short: momentum is attempting to turn, but it remains unproven until price action validates the shift.
4) Support / Resistance zones
Support ~ 4.2878 | Resistance ~ 7.7497
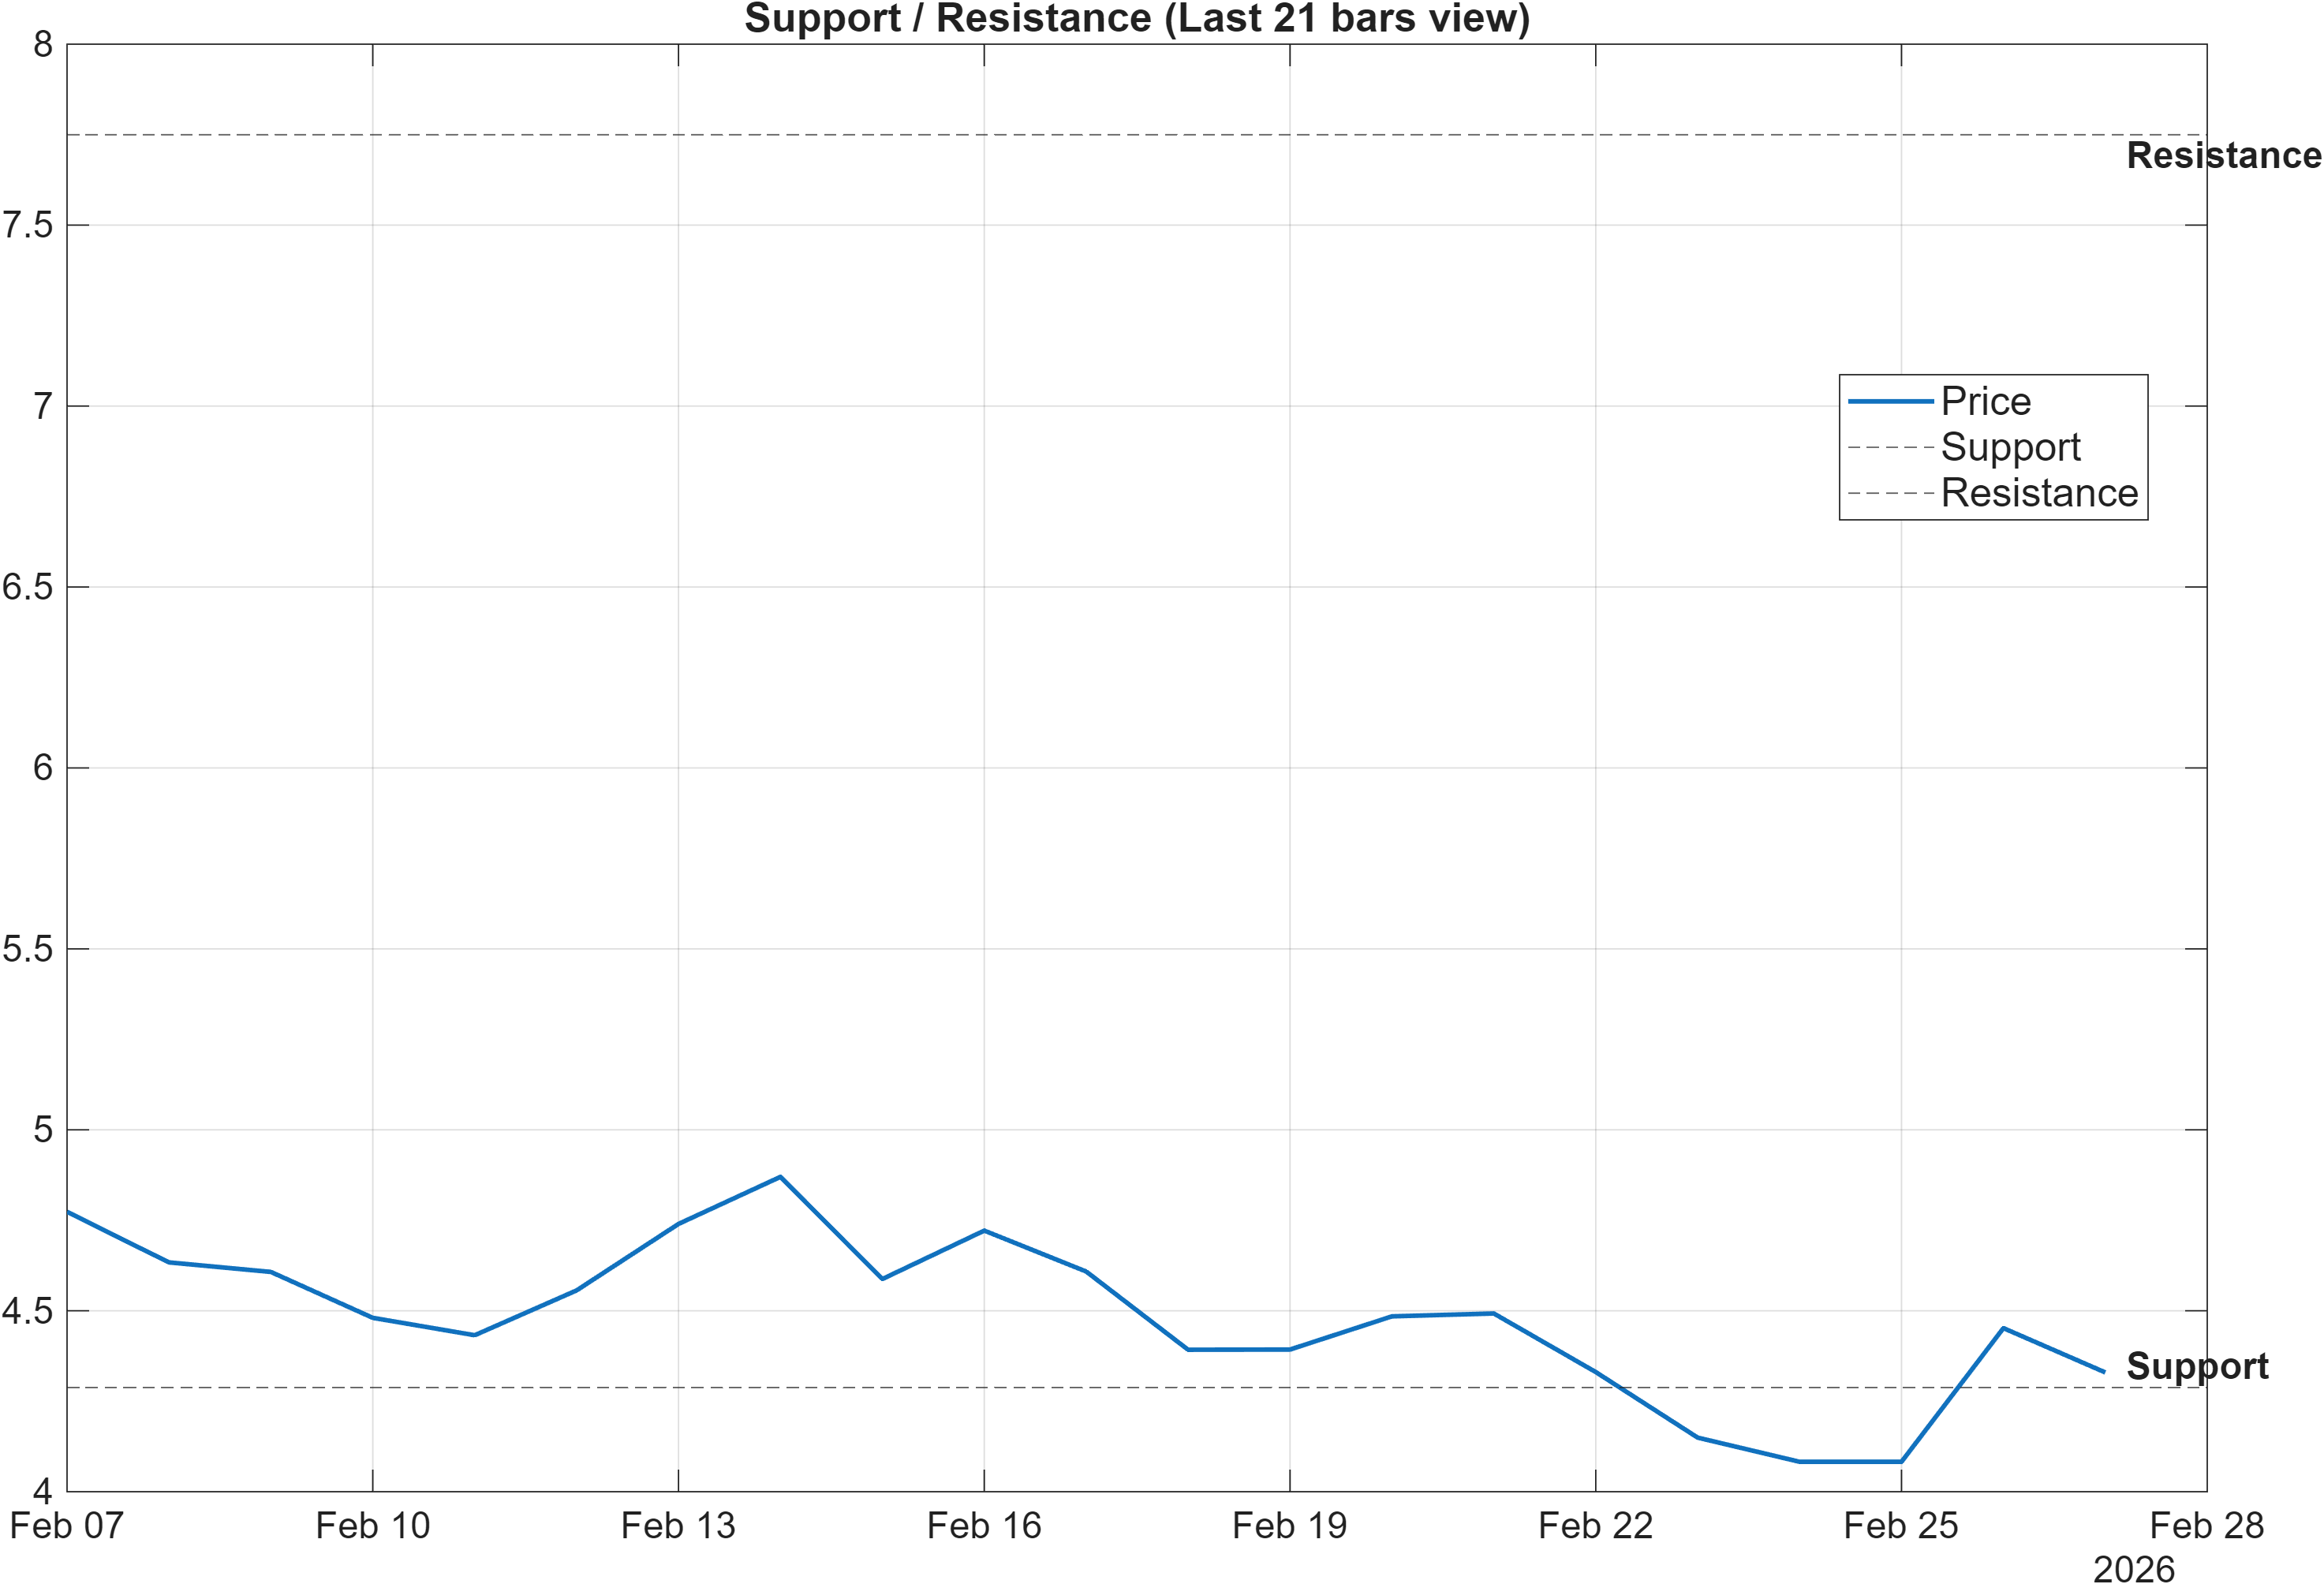
Scenario view: Break above resistance with volume → continuation. Close below support → signal deterioration risk.
Decision zones and regime validation
The technical map is cleanly framed by two probabilistic zones: support near 4.2878 and resistance near 7.7497. With trend indicators still bearish (Close vs MA50 bearish; MA50 vs MA200 bearish) and the technical blend remaining neutral (-0.135), these levels serve less as targets and more as validation gates for whether the improving rank profile can translate into sustained price behavior.
A constructive read requires more than intermittent strength; it typically requires evidence that price can accept above supply. That is consistent with the scenario guidance: a break above 7.7497 with volume would be the clearest market-structure confirmation that demand is absorbing overhead offers. Conversely, a close below 4.2878 would align with the still-soft momentum profile (RSI 39.07; ROC(20) -6.563) and would raise the probability that weekly ranking strength is early or fragile rather than durable.
The indicator mix provides context around these zones. For example, MedPx vs Support at 0.1362 is flagged bullish in the signal set, suggesting some cushion relative to the support framework, while Vol ROC(20) at -8.007 is bearish, implying that participation/turnover is not accelerating alongside price. That combination often produces range-bound testing—support may hold, but resistance can remain sticky until volume dynamics improve. Given the Bollinger Bandwidth of 0.1880, a decisive move is plausible, but the direction is more credibly inferred only once one of these zones is resolved.
5) Quant Technical Dashboard (18 Signals)
KGNAI AI Technical Analysis Score (Deep Reinforcement Learning): Rank #476 out of 800 (Rank 1 represents the strongest technical positioning and a higher probability of favorable price behavior. As ranks increase toward the maximum, the probability of favorable outcomes weakens and bearish positioning becomes more dominant.) | Label: Neutral | Score: -0.190
18-Signal Technical Confluence Score: -0.111 (Neutral)
Overall Technical Score (18-signal confluence + DRL rank blend): -0.135 (Neutral)
Note: The blended score reflects signal strength weighted against broader AI technical ranking, which may temporarily diverge.
Blended technical score breakdown: -0.135 (Neutral | Bull 6 / Bear 8 / Neutral 4)
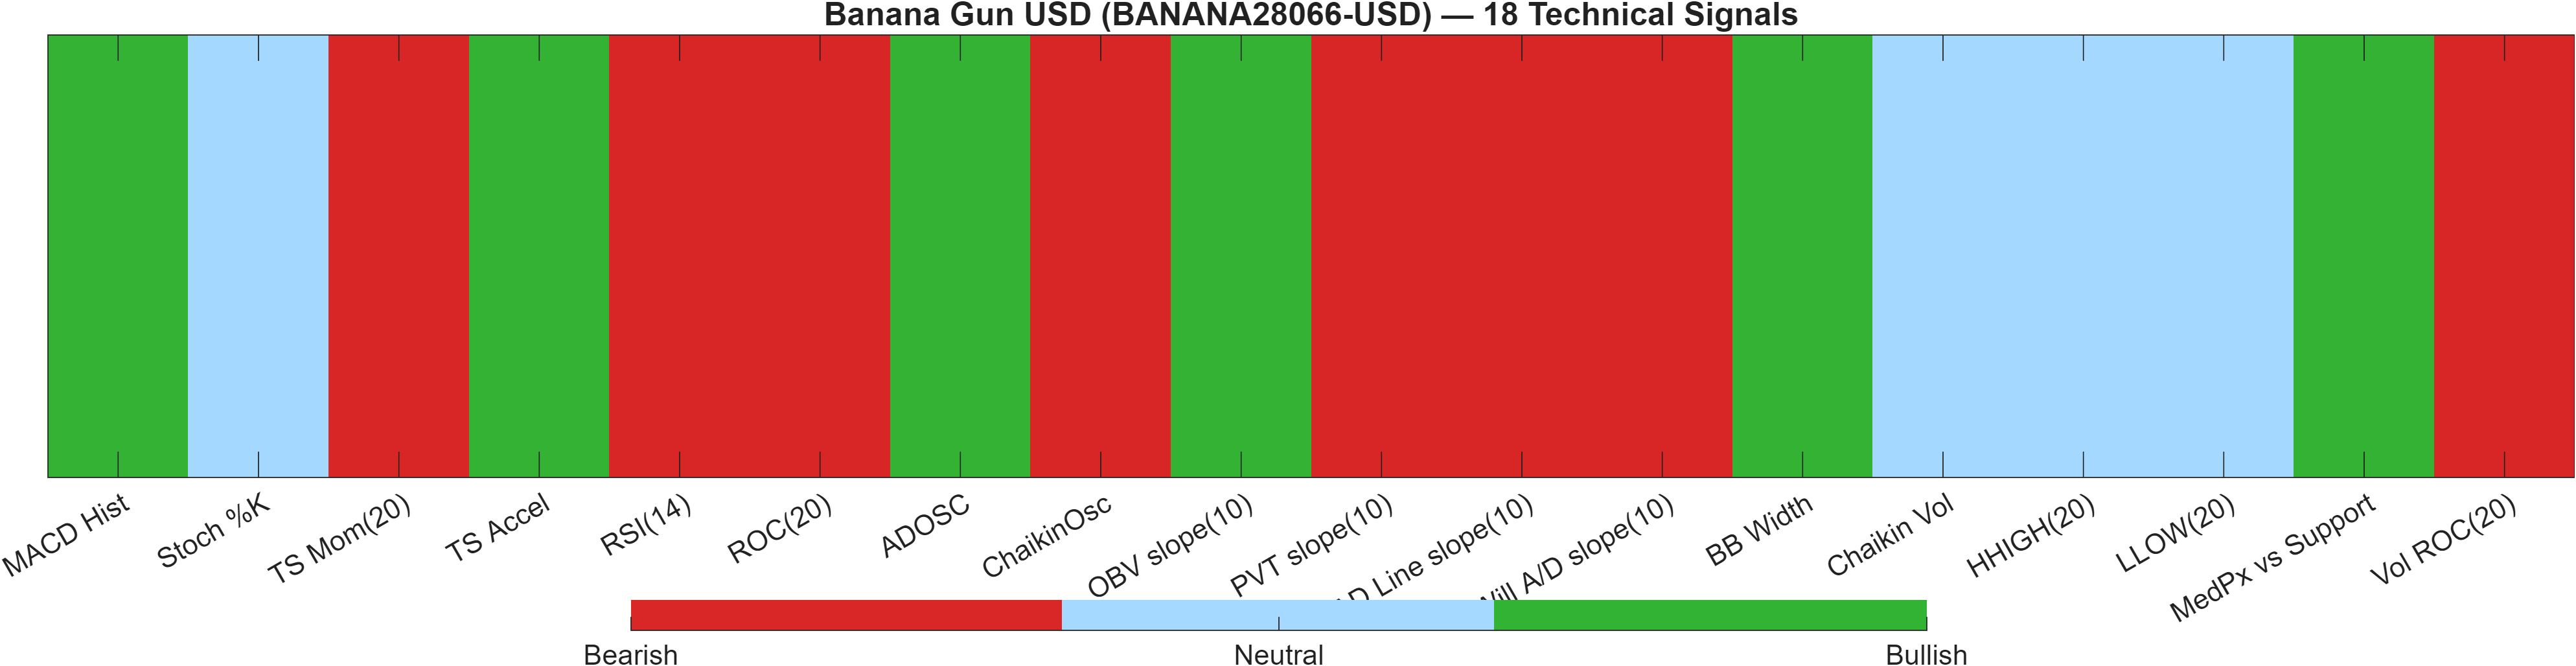
Confluence balance: bearish count leads, but not decisively
The dashboard’s central message is neutrality driven by mixed internal composition. The 18-signal confluence is -0.111 (Neutral) and the blended overall score is -0.135 (Neutral), with the breakdown showing Bear 8 vs Bull 6 and Neutral 4. That distribution is not an aggressive risk-on posture; it indicates that negative signals have a slight edge, but the balance is close enough that regime can shift if a few key components flip.
The DRL technical rank further supports this “not-yet-confirmed” view: rank #476 out of 800 (Neutral) with a score of -0.190 places BANANA28066-USD in the weaker half on this model, contrasting with the much stronger weekly cross-sectional rank (#12). That is a classic alignment gap: the asset can be relatively well-positioned in broader ranking frameworks while still lacking clean technical confirmation in price/flow dynamics.
Where the signals disagree: momentum vs flow
Without repeating the full table, the internal tension is clear. Momentum measures lean defensive (RSI(14) 39.07, ROC(20) -6.563), while selective flow/accumulation proxies show pockets of support (ADOSC 96.04 bullish; OBV slope(10) 2.794e+06 bullish). Offsetting that, other participation/accumulation lines remain bearish (AD Line slope(10) -2.227e+06; PVT slope(10) -1.09e+04).
When flow indicators disagree internally, the more reliable read often comes from whether price can resolve the support/resistance framework (4.2878 / 7.7497) under an expanding volatility regime (bandwidth 0.1880). Until then, the dashboard supports a range-to-transition interpretation rather than a directional thesis.
Signal table (Bull/Bear/Neutral)
| Indicator | Value | Signal |
|---|---|---|
| MACD Hist | 0.05932 | Bullish |
| Stoch %K | 66.75 | Neutral |
| TS Mom(20) | -0.1816 | Bearish |
| TS Accel | 1.201 | Bullish |
| RSI(14) | 39.07 | Bearish |
| ROC(20) | -6.563 | Bearish |
| ADOSC | 96.04 | Bullish |
| ChaikinOsc | -5.251e+05 | Bearish |
| OBV slope(10) | 2.794e+06 | Bullish |
| PVT slope(10) | -1.09e+04 | Bearish |
| AD Line slope(10) | -2.227e+06 | Bearish |
| Will A/D slope(10) | -0.07589 | Bearish |
| BB Width | 0.188 | Bullish |
| Chaikin Vol | -49.93 | Neutral |
| HHIGH(20) | 4.95 | Neutral |
| LLOW(20) | 4.038 | Neutral |
| MedPx vs Support | 0.1362 | Bullish |
| Vol ROC(20) | -8.007 | Bearish |
Interpretation: Indicator-level signals form the base confluence, which is then adjusted using a separate AI-driven technical ranking model. The final technical score summarizes this combined view.
6) News sentiment + extractive gist
Note: Instrument-specific news matches were not found, so the digest includes broader market/sector headlines. Links are provided for verification.
Sentiment score (avg): -0.011 | Positive: 12% | Neutral: 75% | Negative: 12%
KGNAI AI News Sentiment Score (normalized -1 to +1): Not available (as of —) | Label: Not available | Overall news score: -0.01
Positive Developments
Recent coverage across major financial outlets indicates a cautiously constructive backdrop driven more by sector-level dynamics than BANANA28066-USD-specific catalysts. A recurrent positive theme is the idea that broader crypto market structure could improve if large-cap benchmarks regain key levels, which can lift risk appetite across altcoins even when individual charts remain mixed. In that context, BANANA28066-USD’s weekly rank of #12 stands out as a cross-sectional sign of relative interest. The technical layer is not fully aligned (blended score -0.135), yet the presence of a positive MACD histogram (0.05932) alongside pockets of bullish flow indicators (e.g., ADOSC 96.04) can be consistent with early-stage stabilization when market tone firms. Overall, the constructive input is best framed as a tailwind potential: if sector momentum improves, BANANA28066-USD has the relative-rank profile to participate, provided resistance behavior does not cap follow-through.
Neutral / Mixed Developments
The dominant news complexion is neutral, which matches the distribution in the sentiment readout (75% neutral and an average score of -0.011). Much of the flow is informational—policy discussion, derivatives positioning, and broad market commentary—rather than decisive single-asset drivers. This matters because a neutral media backdrop tends to leave price more dependent on internal technicals: the bearish moving-average alignment and RSI(14) at 39.07 can persist longer when there is no clear narrative impulse to force repricing. At the same time, neutral conditions can also allow rank/relative-strength signals (weekly #12; monthly #122) to play out gradually if the asset holds the key support zone at 4.2878. Net: the news flow is not strongly directional; it primarily sets context for why technical confirmation at 7.7497 matters more than headline interpretation.
Negative / Risk Signals
Risk-oriented coverage clusters around broader market stress points: tightening corporate actions, cautious derivatives signals, and attention to crowded trades tied to major crypto-linked equities. Even without being BANANA28066-USD-specific, such themes can affect liquidity and risk tolerance across the crypto complex. In the current setup, the technical layer leaves less margin for sentiment shocks: the moving-average structure is bearish, the DRL technical rank is weaker at #476, and several momentum/participation inputs are still negative (e.g., ROC(20) -6.563, Vol ROC(20) -8.007). That configuration can amplify drawdowns if broader market tone deteriorates, because price has not yet confirmed a trend repair. From a risk-control standpoint, the cleanest invalidation remains mechanical: a close below 4.2878 would better align with the defensive momentum profile and would increase the probability of signal deterioration, regardless of near-term news cadence.
- Whether price can accept above 7.7497 with confirming volume.
- Whether RSI(14) 39.07 improves while MACD histogram remains positive (0.05932).
- Whether price holds 4.2878 as volatility (bandwidth 0.1880) evolves.
Sources referenced: Reuters, Bloomberg, Yahoo Finance, MarketWatch, Investing.com
7) Sources
Not available in the provided data.
You may also like: How KGNAI AI ranks instruments across global markets
Disclaimer: KGNAI provides AI-generated analytics and educational market commentary only. This is not financial advice. Markets involve risk. Always do your own research.