
VELO20435-USD (Velodrome Finance) Technical Outlook — 01-Mar-2026 | Constructive Momentum, Mixed Short-Term Rank
Velodrome Finance (VELO20435-USD) enters 01-Mar-2026 with a notably split profile across horizons: short-term ranks remain Neutral while longer-horizon ranks are decisively stronger, including a Monthly rank of #3 and a 3-Monthly rank of #36 within a 800-instrument crypto universe. On the technical side, the 18-signal framework remains constructive with a 0.556 confluence score and a 0.518 blended technical score (both Bullish), supported by momentum readings such as RSI(14) at 61.69 and a positive MACD histogram (0.0003927; figure annotation notes 0.0004). Volatility context matters: Bollinger Bandwidth at 0.2358 suggests an active regime where follow-through can be faster. Structurally, the key decision zone remains support ~0.0135 versus resistance ~0.0246, with sector-level news sentiment broadly Neutral (avg 0.013; 81% neutral).
Key Takeaways
- Rank stance: Short-term Neutral | Mid-term Bullish | Long-term Bullish
- Technical confluence: Bullish (18-signal 0.556; blended 0.518)
- Key levels: Support ~ 0.0135 | Resistance ~ 0.0246
- News sentiment bias: Neutral (avg 0.013; 12% positive / 81% neutral / 6% negative)
- Confirmation / invalidation: A break above 0.0246 with volume supports continuation conditions; a close below 0.0135 raises deterioration risk per the scenario framework.
What KGNAI Measures
KGNAI evaluates assets using large cross-sectional datasets built from millions of structured data points. Inputs incorporate fundamental metrics, technical structures, and systematically processed news sentiment. Statistical models, machine learning, and AI frameworks are used to assess relative positioning, signal alignment, and probabilistic behavior across broad universes.
How to Read This Report
- Ranks are comparative across the tracked universe, not absolute price targets.
- Confluence reflects alignment among independent signal groups.
- Support/resistance levels are probabilistic decision zones, not guarantees.
- Sentiment provides contextual bias within the broader analytical framework.
1) KGNAI AI Analysis
Region: CRYPTO
Total universe size: 800 ranked instruments
- Daily rank: #543 out of 800 — Neutral
- Weekly rank: #582 out of 800 — Neutral
- Monthly rank: #3 out of 800 — Bullish
- 3-Monthly rank: #36 out of 800 — Bullish
Cross-horizon positioning: strength is concentrated beyond the near term
The rank stack is best read as a time-horizon divergence. Daily (#543) and weekly (#582) sit in the lower portion of the 800-name universe, consistent with a market state that is not broadly favored on very short lookbacks. In contrast, the monthly rank (#3) is effectively top-of-universe and the 3-month rank (#36) sits in the upper tier, indicating stronger behavior when the evaluation window expands.
This split often matters more than any single rank: when longer-horizon ranks are strong but the short-term is neutral, the dominant risk is not an immediate breakdown by default, but timing and path dependency—i.e., the asset can require digestion before re-asserting the higher-timeframe bias. The stated term view aligns with this reading: short-term Neutral versus mid/long Bullish.
The technical layer (detailed in Sections 3 and 5) helps adjudicate whether the neutral short-term ranks reflect early-stage weakening or simply consolidation within a broader constructive state. With the blended technical score still Bullish at 0.518, the overall evidence points to constructive conditions with short-term selectivity rather than outright risk-on or risk-off extremes. Confirmation should come from price behavior around the defined structural levels (support 0.0135; resistance 0.0246) and whether momentum remains supportive (e.g., RSI 61.69; positive MACD histogram).
Access note: https://www.kgnai.com/pricing
2) Price & trend overview
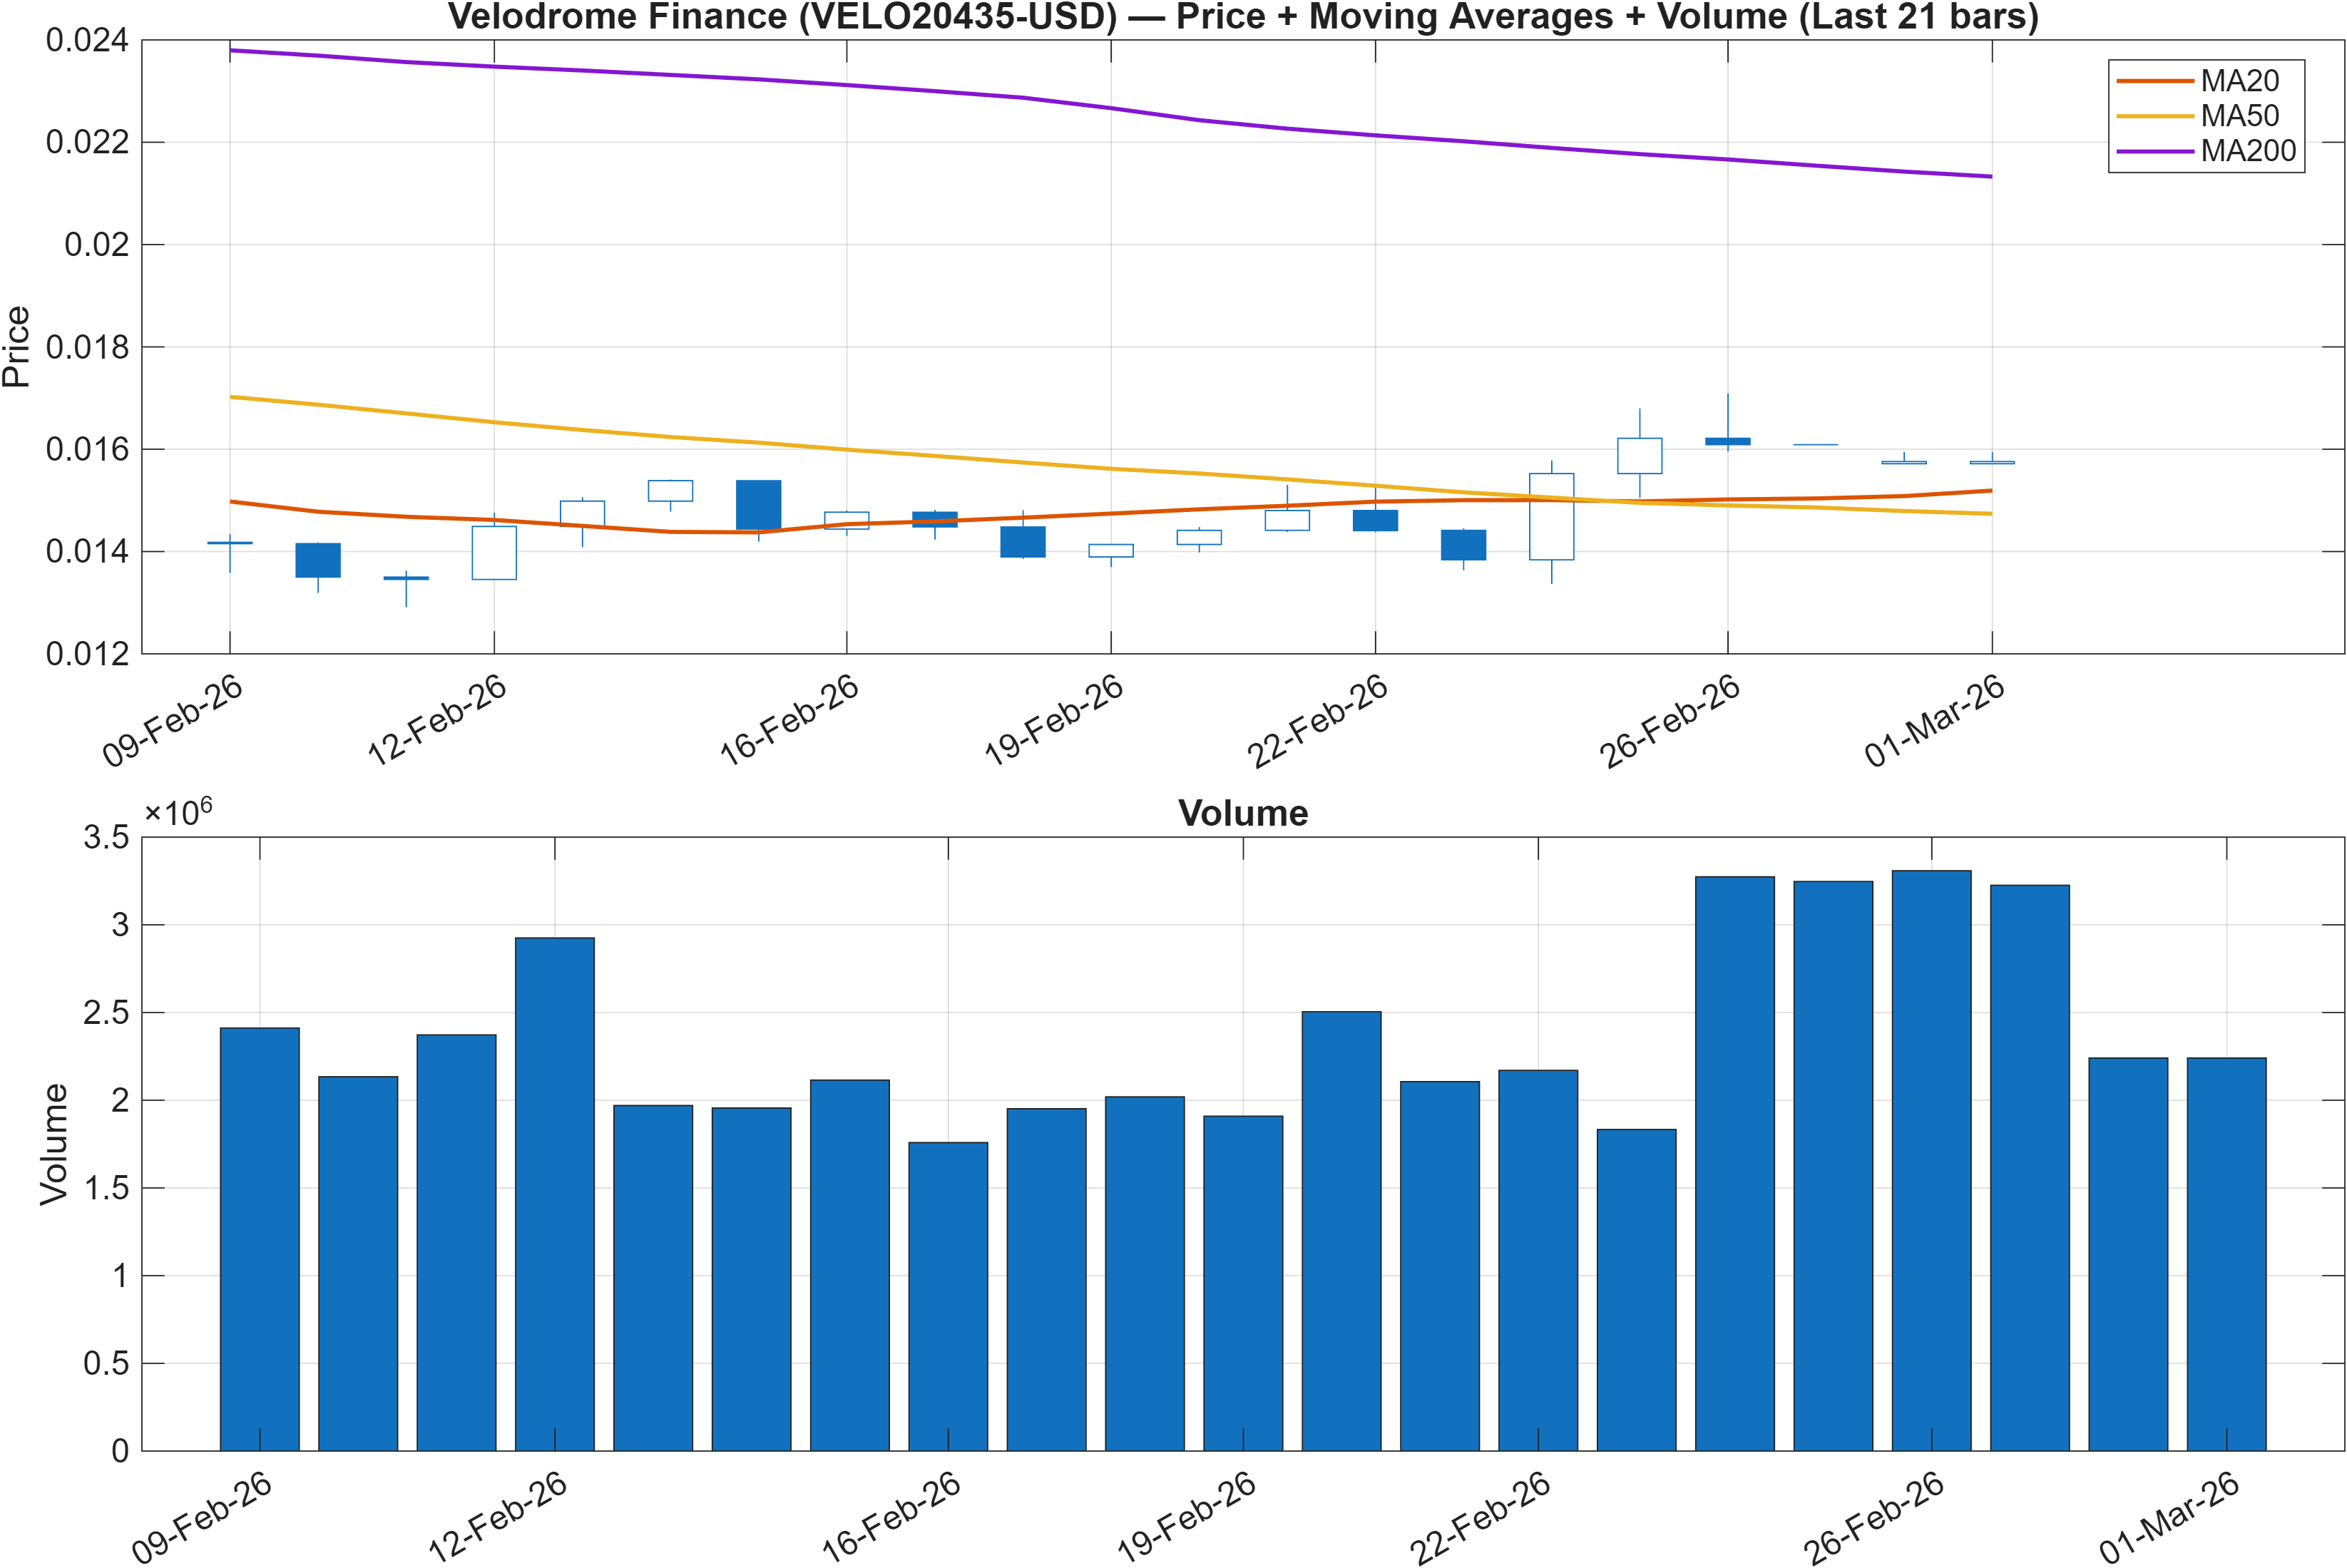
Trend state: constructive price/MA alignment vs longer-term friction
The trend read provided is explicitly conditional: close vs MA50 is Bullish while MA50 vs MA200 is Bearish. That combination typically describes a market where the recent swing has improved relative to intermediate trend, but the longer-term moving average structure has not fully reversed. In practice, that can produce two common behaviors: (1) trend continuation that requires incremental higher highs to keep distance from the MA50, or (2) range formation while the longer-term average catches up.
This is where the time-horizon ranks become informative. The strong monthly rank (#3) alongside a neutral daily (#543) is consistent with an asset that may be in a constructive regime but is not currently exhibiting the broad, persistent strength that drives short-term leadership. It is a configuration that often demands tighter attention to structure and follow-through—particularly around the defined resistance at 0.0246.
Volume is included in Figure 1, and while no discrete volume totals are provided, the scenario framework later specifies “break above resistance with volume” as a continuation condition. That wording places emphasis on participation as the differentiator between a routine test of resistance and a state change. Conversely, loss of structural support at 0.0135 would be a cleaner sign that the improving close/MA50 relationship is failing to persist, aligning more with the weaker short-term rank readings.
3) Momentum & volatility dashboard
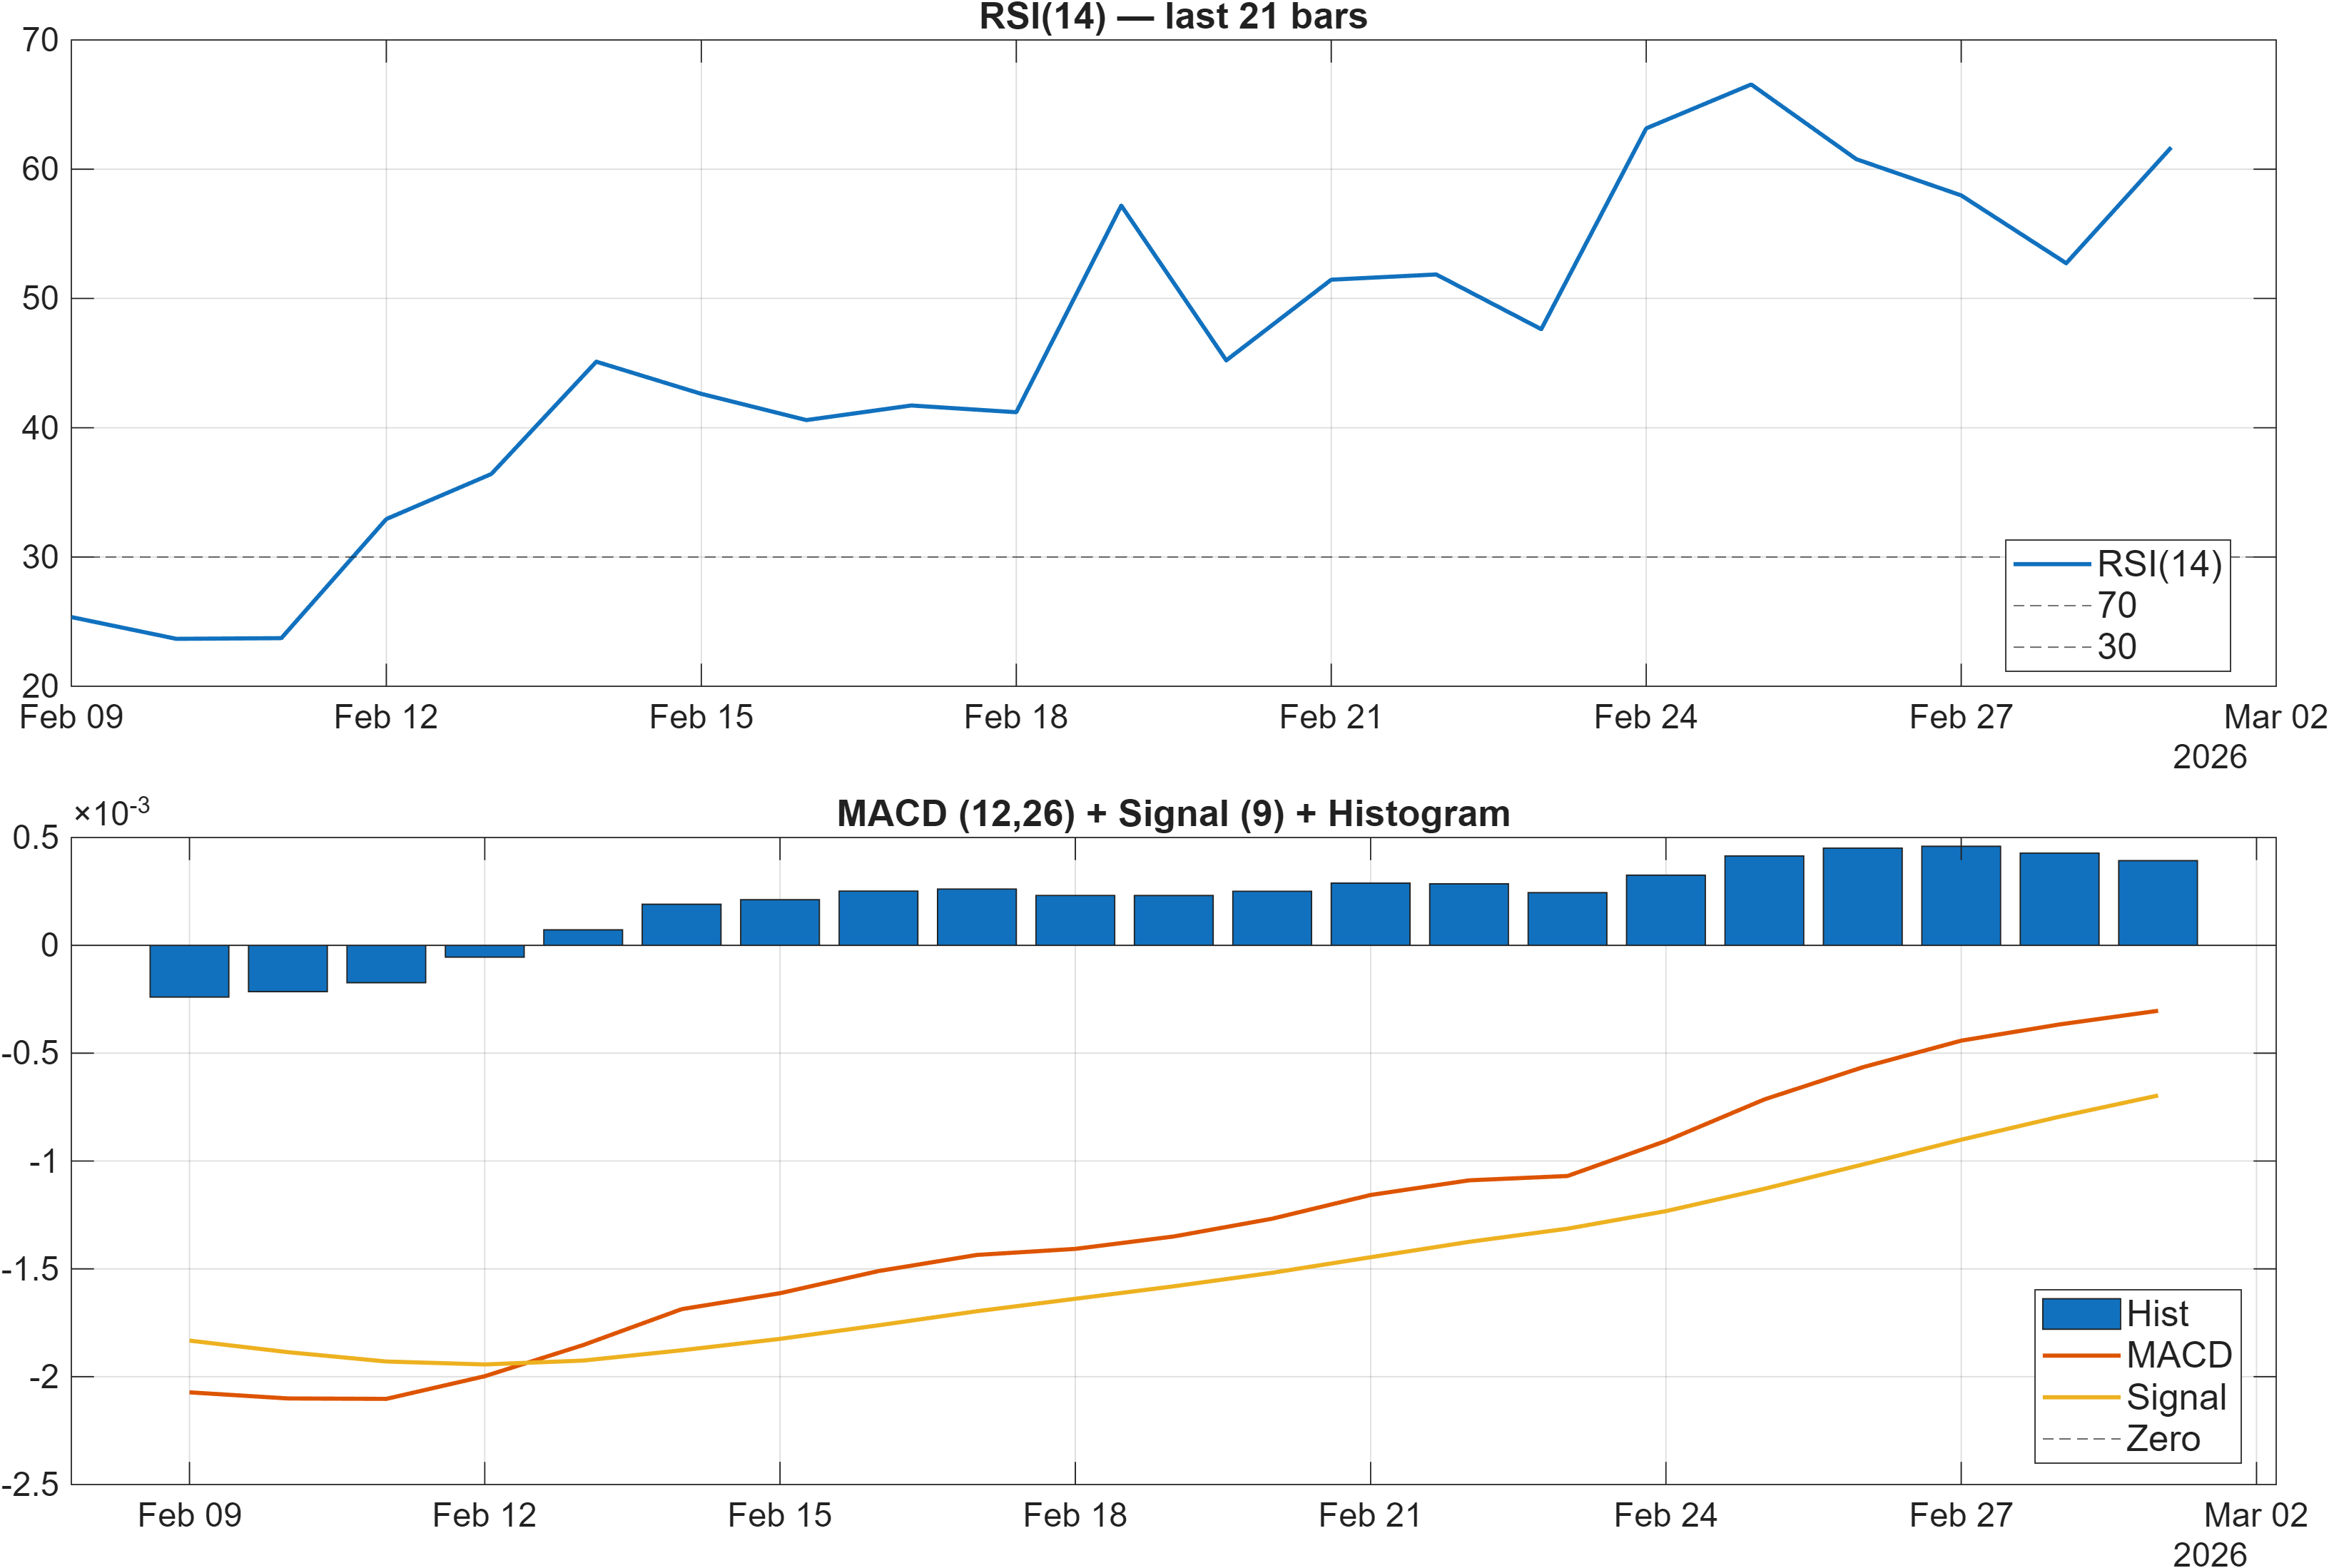
Interpretation: RSI bias = Bullish, MACD hist = 0.0004.
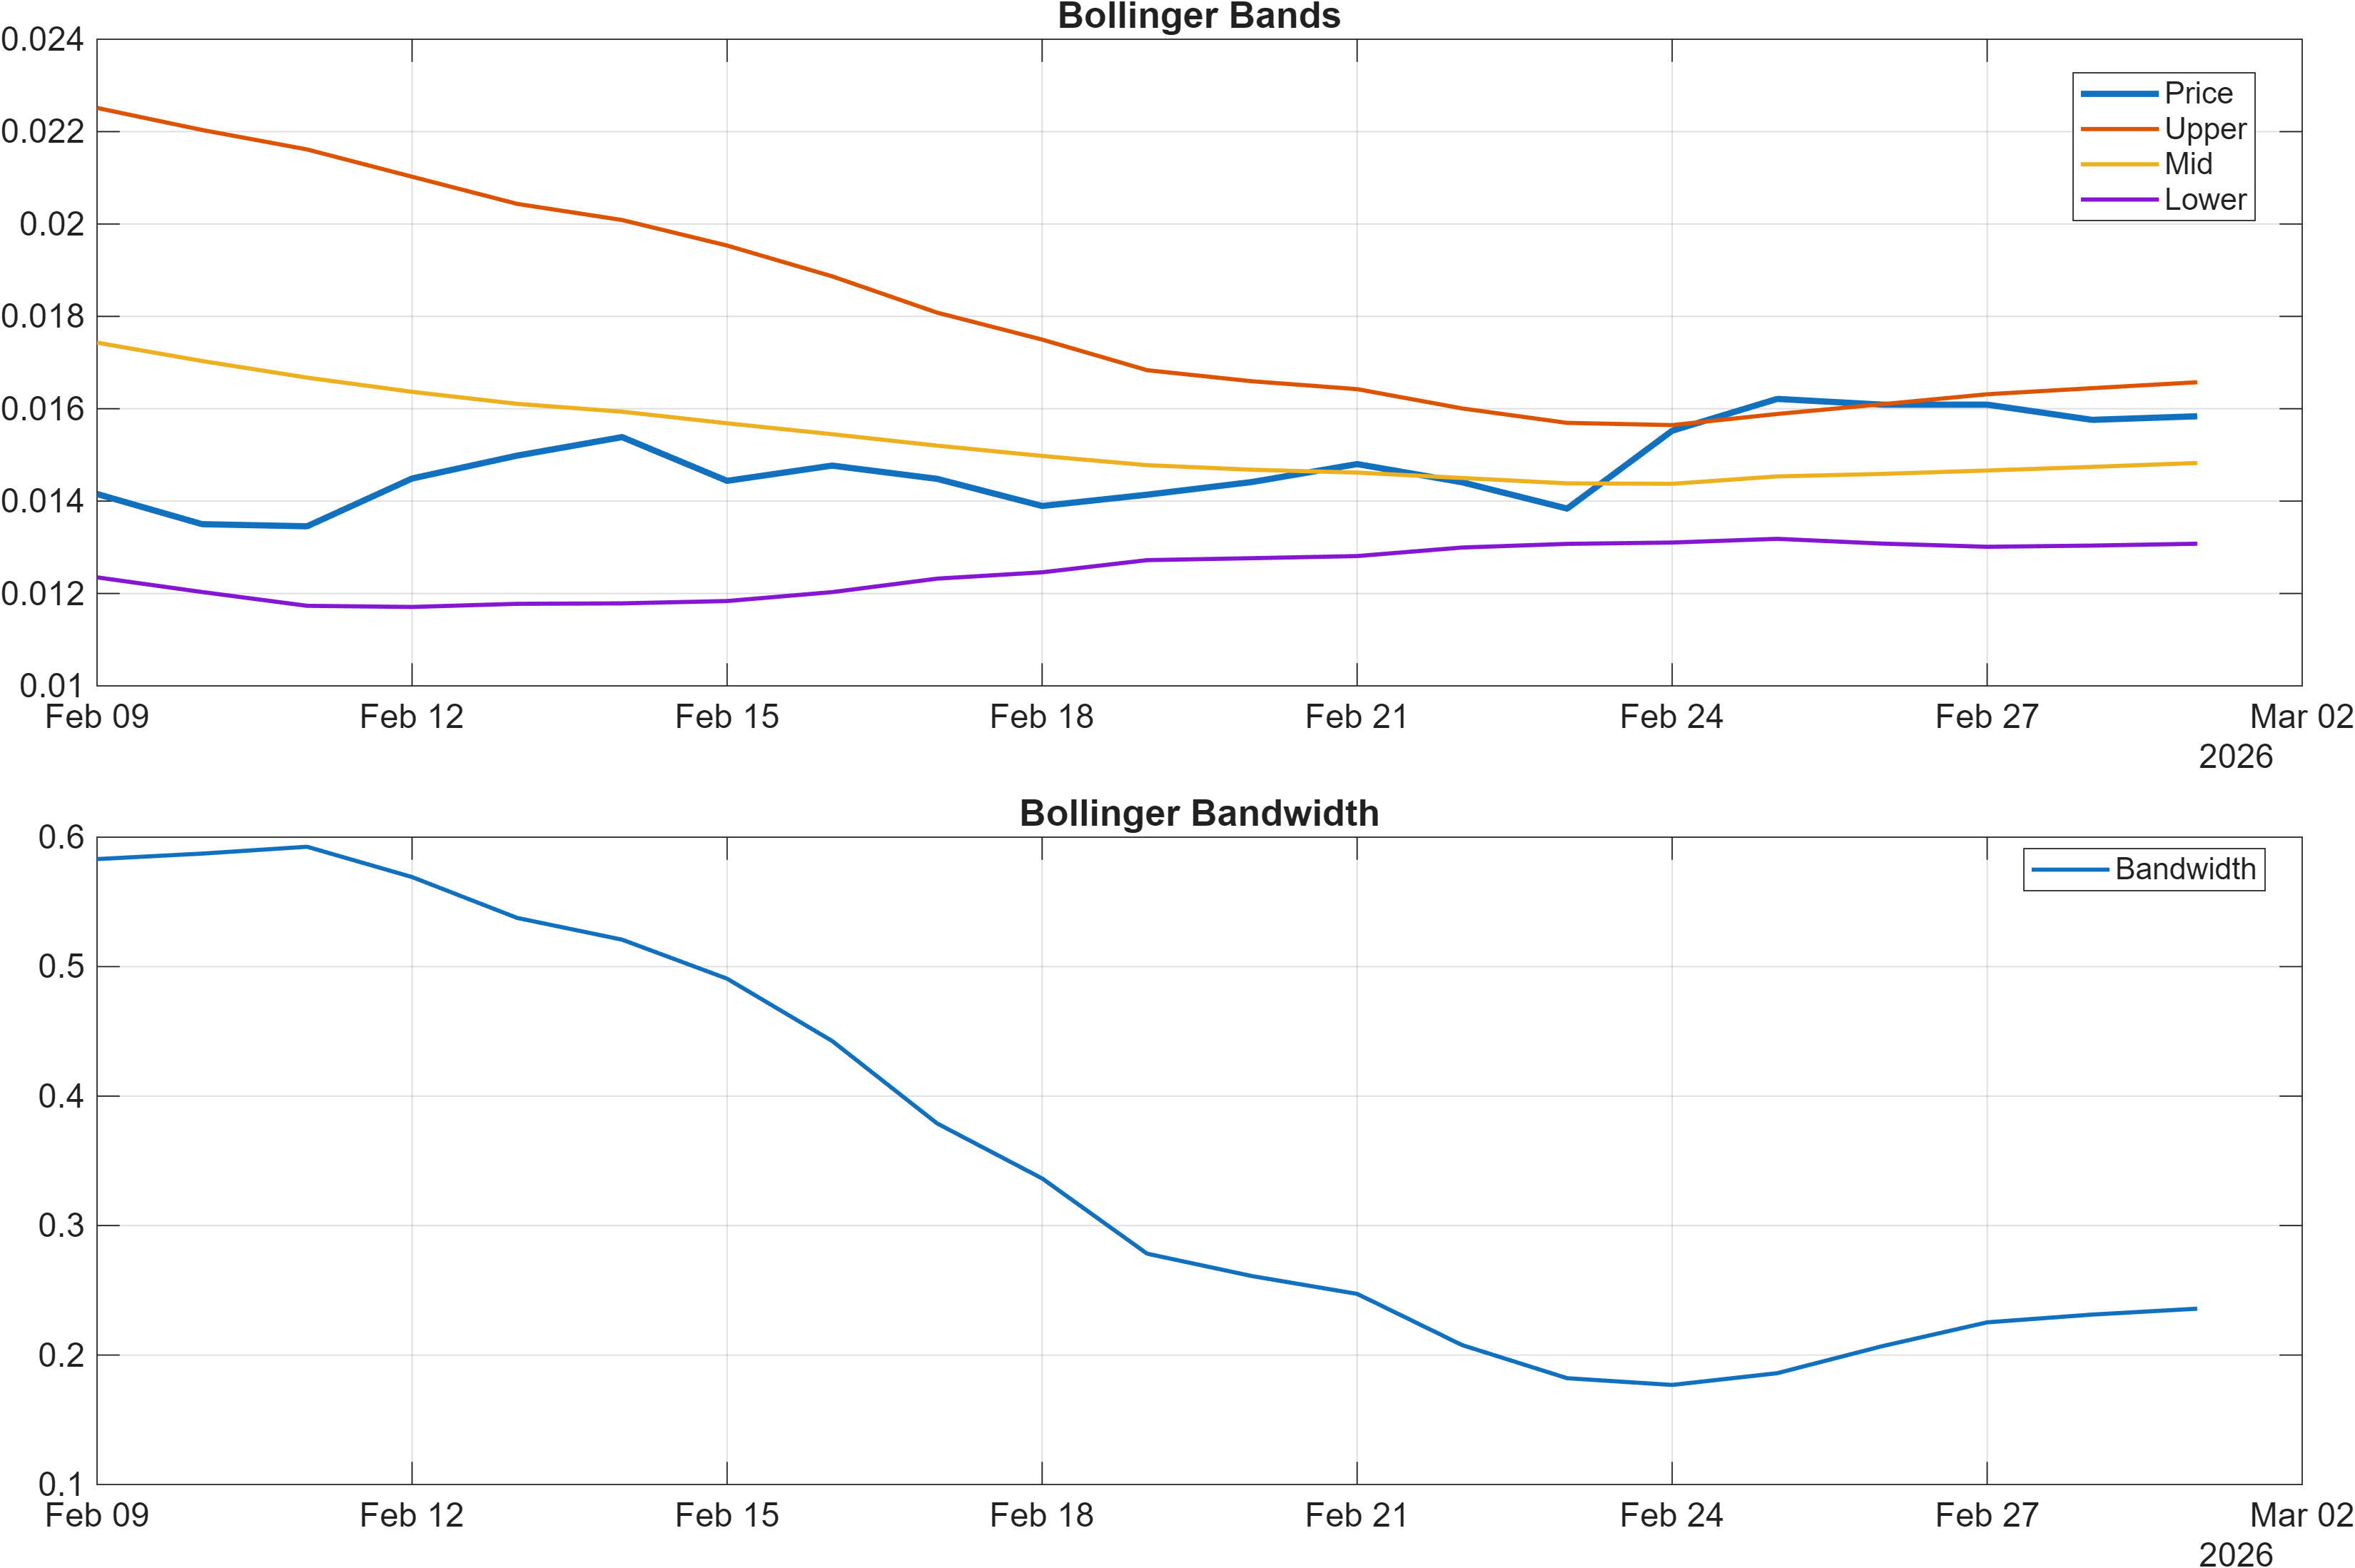
Interpretation: Bandwidth (volatility regime) latest = 0.2358.
Momentum confirms directionality, while volatility regime argues for faster validation
Momentum inputs lean constructive. The dashboard flags an RSI bias as Bullish, and the broader signal set later confirms RSI(14) at 61.69, which typically aligns with positive trend pressure without necessarily implying an overextended condition. The MACD histogram is also positive (0.0004 on the figure; 0.0003927 in the signal table), supporting the idea that upside impulse remains present rather than fading into a negative crossover state.
Volatility context is equally relevant because it changes how quickly momentum signals should be expected to resolve into price structure. A Bollinger Bandwidth of 0.2358 indicates a non-trivial volatility regime. In higher bandwidth conditions, support and resistance often behave as decision zones with quicker outcomes: tests can follow through more quickly, but failed breaks can also revert faster. That dynamic is consistent with the report’s emphasis on monitoring breakout confirmation with volume rather than treating a brief intraday breach as sufficient.
Taken together, the momentum-volatility pairing is best described as constructive but conditional. If momentum remains positive while price interacts with resistance (0.0246), the probability of continuation improves under the stated scenario framework. If momentum stays positive but price repeatedly rejects at resistance, that would represent signal compression—bullish oscillators without structural follow-through—raising the chance of mean reversion back toward support (0.0135).
4) Support / Resistance zones
Support ~ 0.0135 | Resistance ~ 0.0246
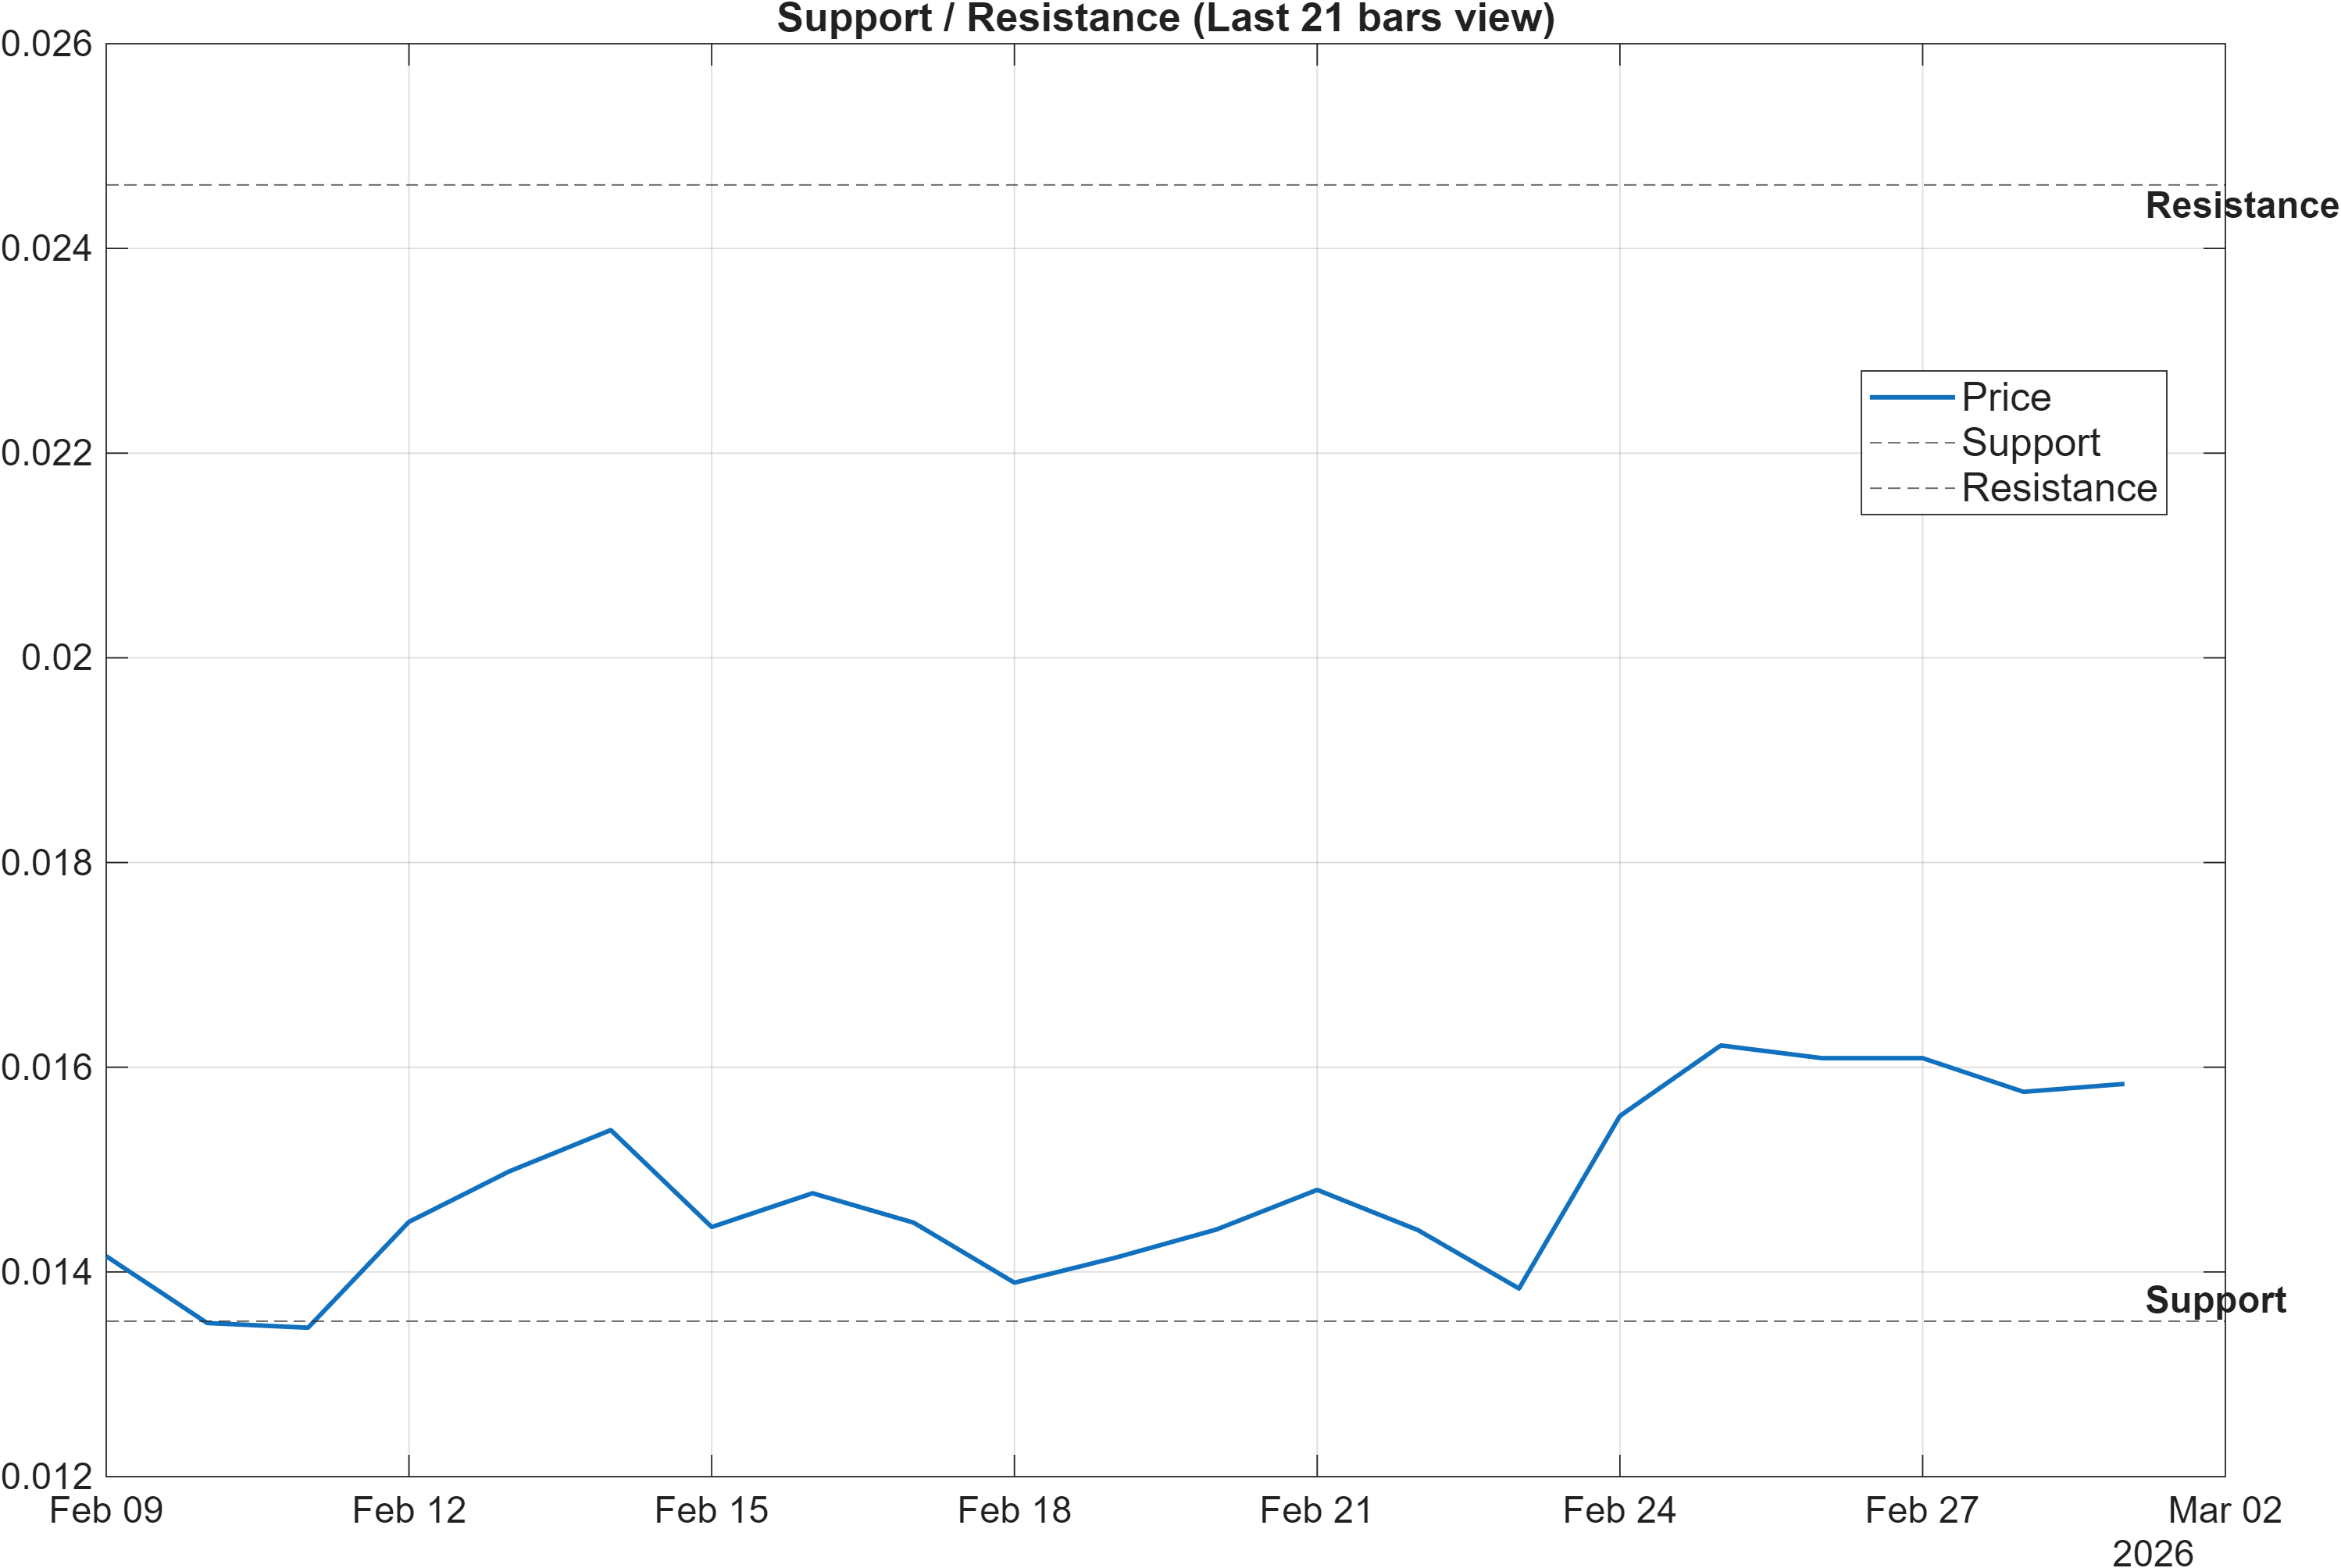
Scenario view: Break above resistance with volume → continuation. Close below support → signal deterioration risk.
Decision geometry: where trend must prove itself
The level framework is clean: 0.0135 defines the principal support zone, while 0.0246 defines the principal resistance zone. With momentum readings constructive (RSI 61.69; positive MACD histogram), the immediate analytical question is not whether upside is “possible,” but whether the market can convert resistance into acceptance—a higher-quality outcome than repeated wicks through a level.
The scenario definition emphasizes two conditions that map directly into regime labeling. A break above 0.0246 with volume is framed as a continuation pathway, implying that the model is looking for a participation-backed move rather than a low-liquidity drift. By contrast, a close below 0.0135 is explicitly associated with deterioration risk; that is a structural invalidation line that would likely align more closely with the weaker short-term ranks (daily #543; weekly #582) and could force a reassessment of the bullish longer-horizon posture.
From a positioning standpoint, this is a two-sided map: bullish momentum signals are already present, but the levels define where that momentum becomes actionable in structural terms. In higher volatility conditions (bandwidth 0.2358), the market can traverse these zones quickly, making closing behavior (not just intraperiod spikes) the more robust confirmation. The discipline is to treat these as probabilistic zones rather than targets, using them to evaluate whether the constructive technical state persists or begins to unwind.
5) Quant Technical Dashboard (18 Signals)
KGNAI AI Technical Analysis Score (Deep Reinforcement Learning): Rank #228 out of 800 (Rank 1 represents the strongest technical positioning and a higher probability of favorable price behavior. As ranks increase toward the maximum, the probability of favorable outcomes weakens and bearish positioning becomes more dominant.) | Label: Neutral | Score: 0.430
18-Signal Technical Confluence Score: 0.556 (Bullish)
Overall Technical Score (18-signal confluence + DRL rank blend): 0.518 (Bullish)
Note: The blended score reflects signal strength weighted against broader AI technical ranking, which may temporarily diverge.
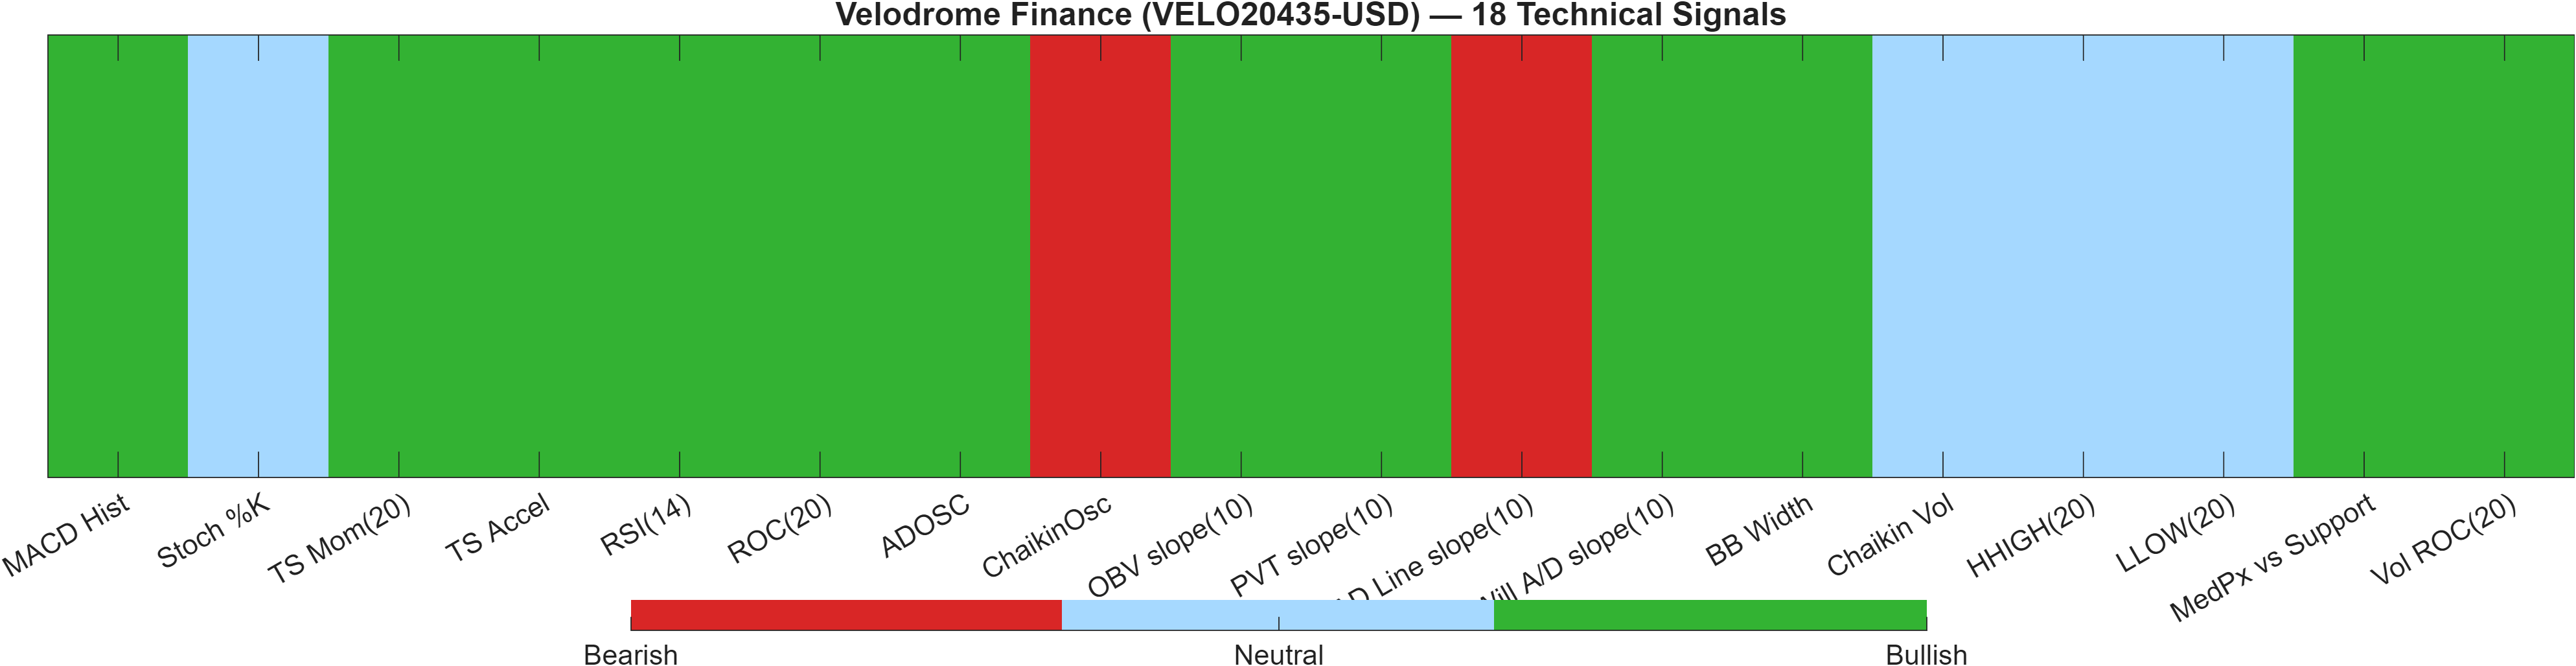
Blended technical score breakdown: 0.518 (Bullish | Bull 12 / Bear 2 / Neutral 4)
Confluence vs model rank: constructive breadth with selective pressure points
The technical picture is best summarized as breadth-positive but not uniformly endorsed by the separate AI technical rank model. The 18-signal confluence is 0.556 (Bullish), and the blended score remains Bullish at 0.518, supported by a distribution of Bull 12 / Bear 2 / Neutral 4. However, the deep reinforcement learning (DRL) technical rank is #228 with a Neutral label and a 0.430 score, indicating that the broader pattern classifier is less emphatic than the indicator stack.
That divergence matters: indicator confluence can improve quickly during rebounds, while rank-based pattern models often require more persistence across regimes. The immediate implication is that VELO20435-USD may be in a transition zone—improving momentum and participation signatures without full confirmation from longer-pattern technical positioning.
Among the listed signals, momentum is notably supportive (e.g., ROC(20) at 17.3, TS Accel at 0.009415, and MACD histogram at 0.0003927). At the same time, there are specific caution flags in the accumulation/distribution family, including a Bearish ChaikinOsc (-1.044e+06) and a Bearish AD Line slope(10) (-2.99e+06). That combination can occur when upside progress coexists with uneven internal flow—often visible as choppy advances or sensitivity to liquidity shifts.
Signal table (Bull/Bear/Neutral)
| Indicator | Value | Signal |
|---|---|---|
| MACD Hist | 0.0003927 | Bullish |
| Stoch %K | 64.19 | Neutral |
| TS Mom(20) | 0.002259 | Bullish |
| TS Accel | 0.009415 | Bullish |
| RSI(14) | 61.69 | Bullish |
| ROC(20) | 17.3 | Bullish |
| ADOSC | 59.33 | Bullish |
| ChaikinOsc | -1.044e+06 | Bearish |
| OBV slope(10) | 1.58e+06 | Bullish |
| PVT slope(10) | 4.469e+05 | Bullish |
| AD Line slope(10) | -2.99e+06 | Bearish |
| Will A/D slope(10) | 0.001353 | Bullish |
| BB Width | 0.2358 | Bullish |
| Chaikin Vol | -4.153 | Neutral |
| HHIGH(20) | 0.01709 | Neutral |
| LLOW(20) | 0.01291 | Neutral |
| MedPx vs Support | 0.002312 | Bullish |
| Vol ROC(20) | 5 | Bullish |
The practical read is that VELO20435-USD’s indicator suite is currently doing the work—momentum and volatility signals lean favorable—while the DRL rank (#228) keeps the label Neutral. That is a common configuration in markets that are improving but still need structural confirmation at resistance (0.0246) and continued defense of support (0.0135).
6) News sentiment + extractive gist
Note: Instrument-specific news matches were not found, so the digest includes broader market/sector headlines.
Sentiment score (avg): 0.013 | Positive: 12% | Neutral: 81% | Negative: 6%
KGNAI AI News Sentiment Score (normalized -1 to +1): Not available (as of —) | Label: Not available | Overall news score: 0.01
Positive Developments
Recent coverage across major financial outlets indicates a modestly constructive tone around broader crypto market positioning, with recurring discussion of cyclical “bottoming” frameworks and recovery narratives. While these are not VELO20435-USD-specific items in the provided data, they shape the ambient risk appetite that can influence altcoin liquidity and follow-through when technical conditions are already supportive. In the current setup, that backdrop aligns with the report’s constructive momentum readings (RSI bias Bullish; MACD histogram positive) and the bullish confluence structure (0.556; blended 0.518). The overall sentiment mix still skews heavily neutral (81%), but the presence of a positive slice (12%) suggests the information flow is not dominantly risk-off. For an asset sitting near key decision levels (support 0.0135; resistance 0.0246), a mildly constructive sector tone can act as a permissive environment for testing resistance—without being sufficient on its own to validate a breakout.
Neutral / Mixed Developments
The dominant feature of the news dataset is informational churn rather than directional conviction, consistent with the Neutral aggregate posture (avg 0.013; 81% neutral). This type of flow tends to matter most by what it fails to do: it does not strongly reinforce either bullish continuation or bearish repricing. In that environment, price action can become more technically driven, particularly when volatility is already active (Bollinger Bandwidth 0.2358). For VELO20435-USD, that places more weight on confirmation mechanics—such as whether a move through 0.0246 is accompanied by participation—than on narrative catalysts. It also keeps focus on whether the mixed cross-horizon ranks (daily #543 vs monthly #3) resolve via stabilization or via renewed dispersion.
Negative / Risk Signals
Risk coverage in the broader crypto backdrop remains present, particularly around compliance and security concerns that can periodically tighten liquidity conditions across the sector. Even when these items are not directly tied to VELO20435-USD in the provided data, they can influence correlations and short-term risk premia—often showing up as sharper pullbacks, failed breakouts, or reduced follow-through after technical break attempts. This is relevant given the report’s explicit deterioration condition: a close below 0.0135 would represent a structural break that can be exacerbated in risk-off microbursts. The internal technical dashboard also includes a small set of bearish flow signals (e.g., ChaikinOsc and AD Line slope), which does not negate the bullish confluence but argues for respecting invalidation levels and closing behavior, especially in a higher-volatility regime.
What to monitor next
- Acceptance above 0.0246 with volume versus repeated rejection.
- Closes relative to 0.0135 as the primary deterioration threshold.
- Whether momentum remains constructive (RSI 61.69; positive MACD histogram) as volatility persists (bandwidth 0.2358).
Sources referenced: Reuters, Bloomberg, Yahoo Finance, MarketWatch, Investing.com
7) Sources
Not available in the provided data.
You may also like: How KGNAI AI ranks instruments across global markets
Disclaimer: KGNAI provides AI-generated analytics and educational market commentary only. This is not financial advice. Markets involve risk. Always do your own research.