
BTC-USD (Bitcoin) Technical, Rank & Sentiment Report — 19-Apr-2026 | Bullish Bias with Mixed Trend Structure
Bitcoin (BTC-USD) screens as constructively positioned on KGNAI’s cross-sectional ranking framework as of 19-Apr-2026, with the instrument sitting in the upper quartile of the 800-instrument crypto universe on daily, weekly, monthly, and 3-month horizons. Beneath that strength, the chart-state is more nuanced: price is bullish versus the MA50 while the MA50 remains below the MA200, a configuration that can reflect either a recovery phase within a broader lagging regime or a trend transition still in progress. Momentum reads supportive overall—RSI bias is bullish and MACD histogram is positive at 692.4290—while volatility is moderate with Bollinger bandwidth at 0.1912. Key decision zones remain clearly defined at 65024.2188 (support) and 75457.9219 (resistance), with news sentiment appearing largely neutral in aggregate.
- Rank stance: Short / Mid / Long all Bullish (daily #32, weekly #40, monthly #27, 3-monthly #25 out of 800).
- Technical confluence label: Bullish (18-signal confluence 0.667; blended overall technical score 0.462).
- Key levels: Support 65024.2188 | Resistance 75457.9219.
- News sentiment bias: Neutral (avg sentiment 0.053; Positive 19% / Neutral 76% / Negative 4%; normalized score 0.00 as of 2026-04-11).
- Confirmation / invalidation: A break above 75457.9219 with volume supports continuation; a close below 65024.2188 increases deterioration risk.
What KGNAI Measures
KGNAI evaluates assets using large cross-sectional datasets built from millions of structured data points. Inputs incorporate fundamental metrics, technical structures, and systematically processed news sentiment. Statistical models, machine learning, and AI frameworks are used to assess relative positioning, signal alignment, and probabilistic behavior across broad universes.
How to Read This Report
- Ranks are comparative across the tracked universe, not absolute price targets.
- Confluence reflects alignment among independent signal groups.
- Support/resistance levels are probabilistic decision zones, not guarantees.
- Sentiment provides contextual bias within the broader analytical framework.
1) KGNAI AI Analysis
Region: CRYPTO
Total universe size: 800 ranked instruments
- Daily rank: #32 out of 800 — Bullish
- Weekly rank: #40 out of 800 — Bullish
- Monthly rank: #27 out of 800 — Bullish
- 3-Monthly rank: #25 out of 800 — Bullish
Cross-horizon ranks are consistently strong, with BTC-USD holding #32 (daily), #40 (weekly), #27 (monthly), and #25 (3-monthly) out of 800. In a relative framework, that places Bitcoin firmly in the upper quartile across timeframes, supporting the view that its recent behavior is screening better than most instruments in the crypto set.
The key analytical nuance is alignment: when daily and weekly ranks confirm monthly and 3-month ranks, the signal tends to be more robust than a single-horizon improvement. Here, the ranks suggest broad-based strength rather than a narrow, short-term spike. That said, ranks are not a substitute for regime diagnosis; they identify where BTC-USD sits in the distribution of modeled outcomes, not a deterministic path.
The stated term view is uniformly Bullish across short-, mid-, and long-term horizons, which is directionally consistent with the cross-sectional positioning. For readers translating this into process, the highest-quality read-through is to treat the ranking stack as a context layer: it implies BTC-USD is relatively well-positioned, while the technical sections that follow determine whether that positioning is being expressed through trend persistence, momentum expansion, or a still-maturing transition.
Term view: Short-term: Bullish. Mid-term: Bullish. Long-term: Bullish.
Want the full universe and complete rank tables? Unlock full access on KGNAI: https://www.kgnai.com/pricing
2) Price & trend overview
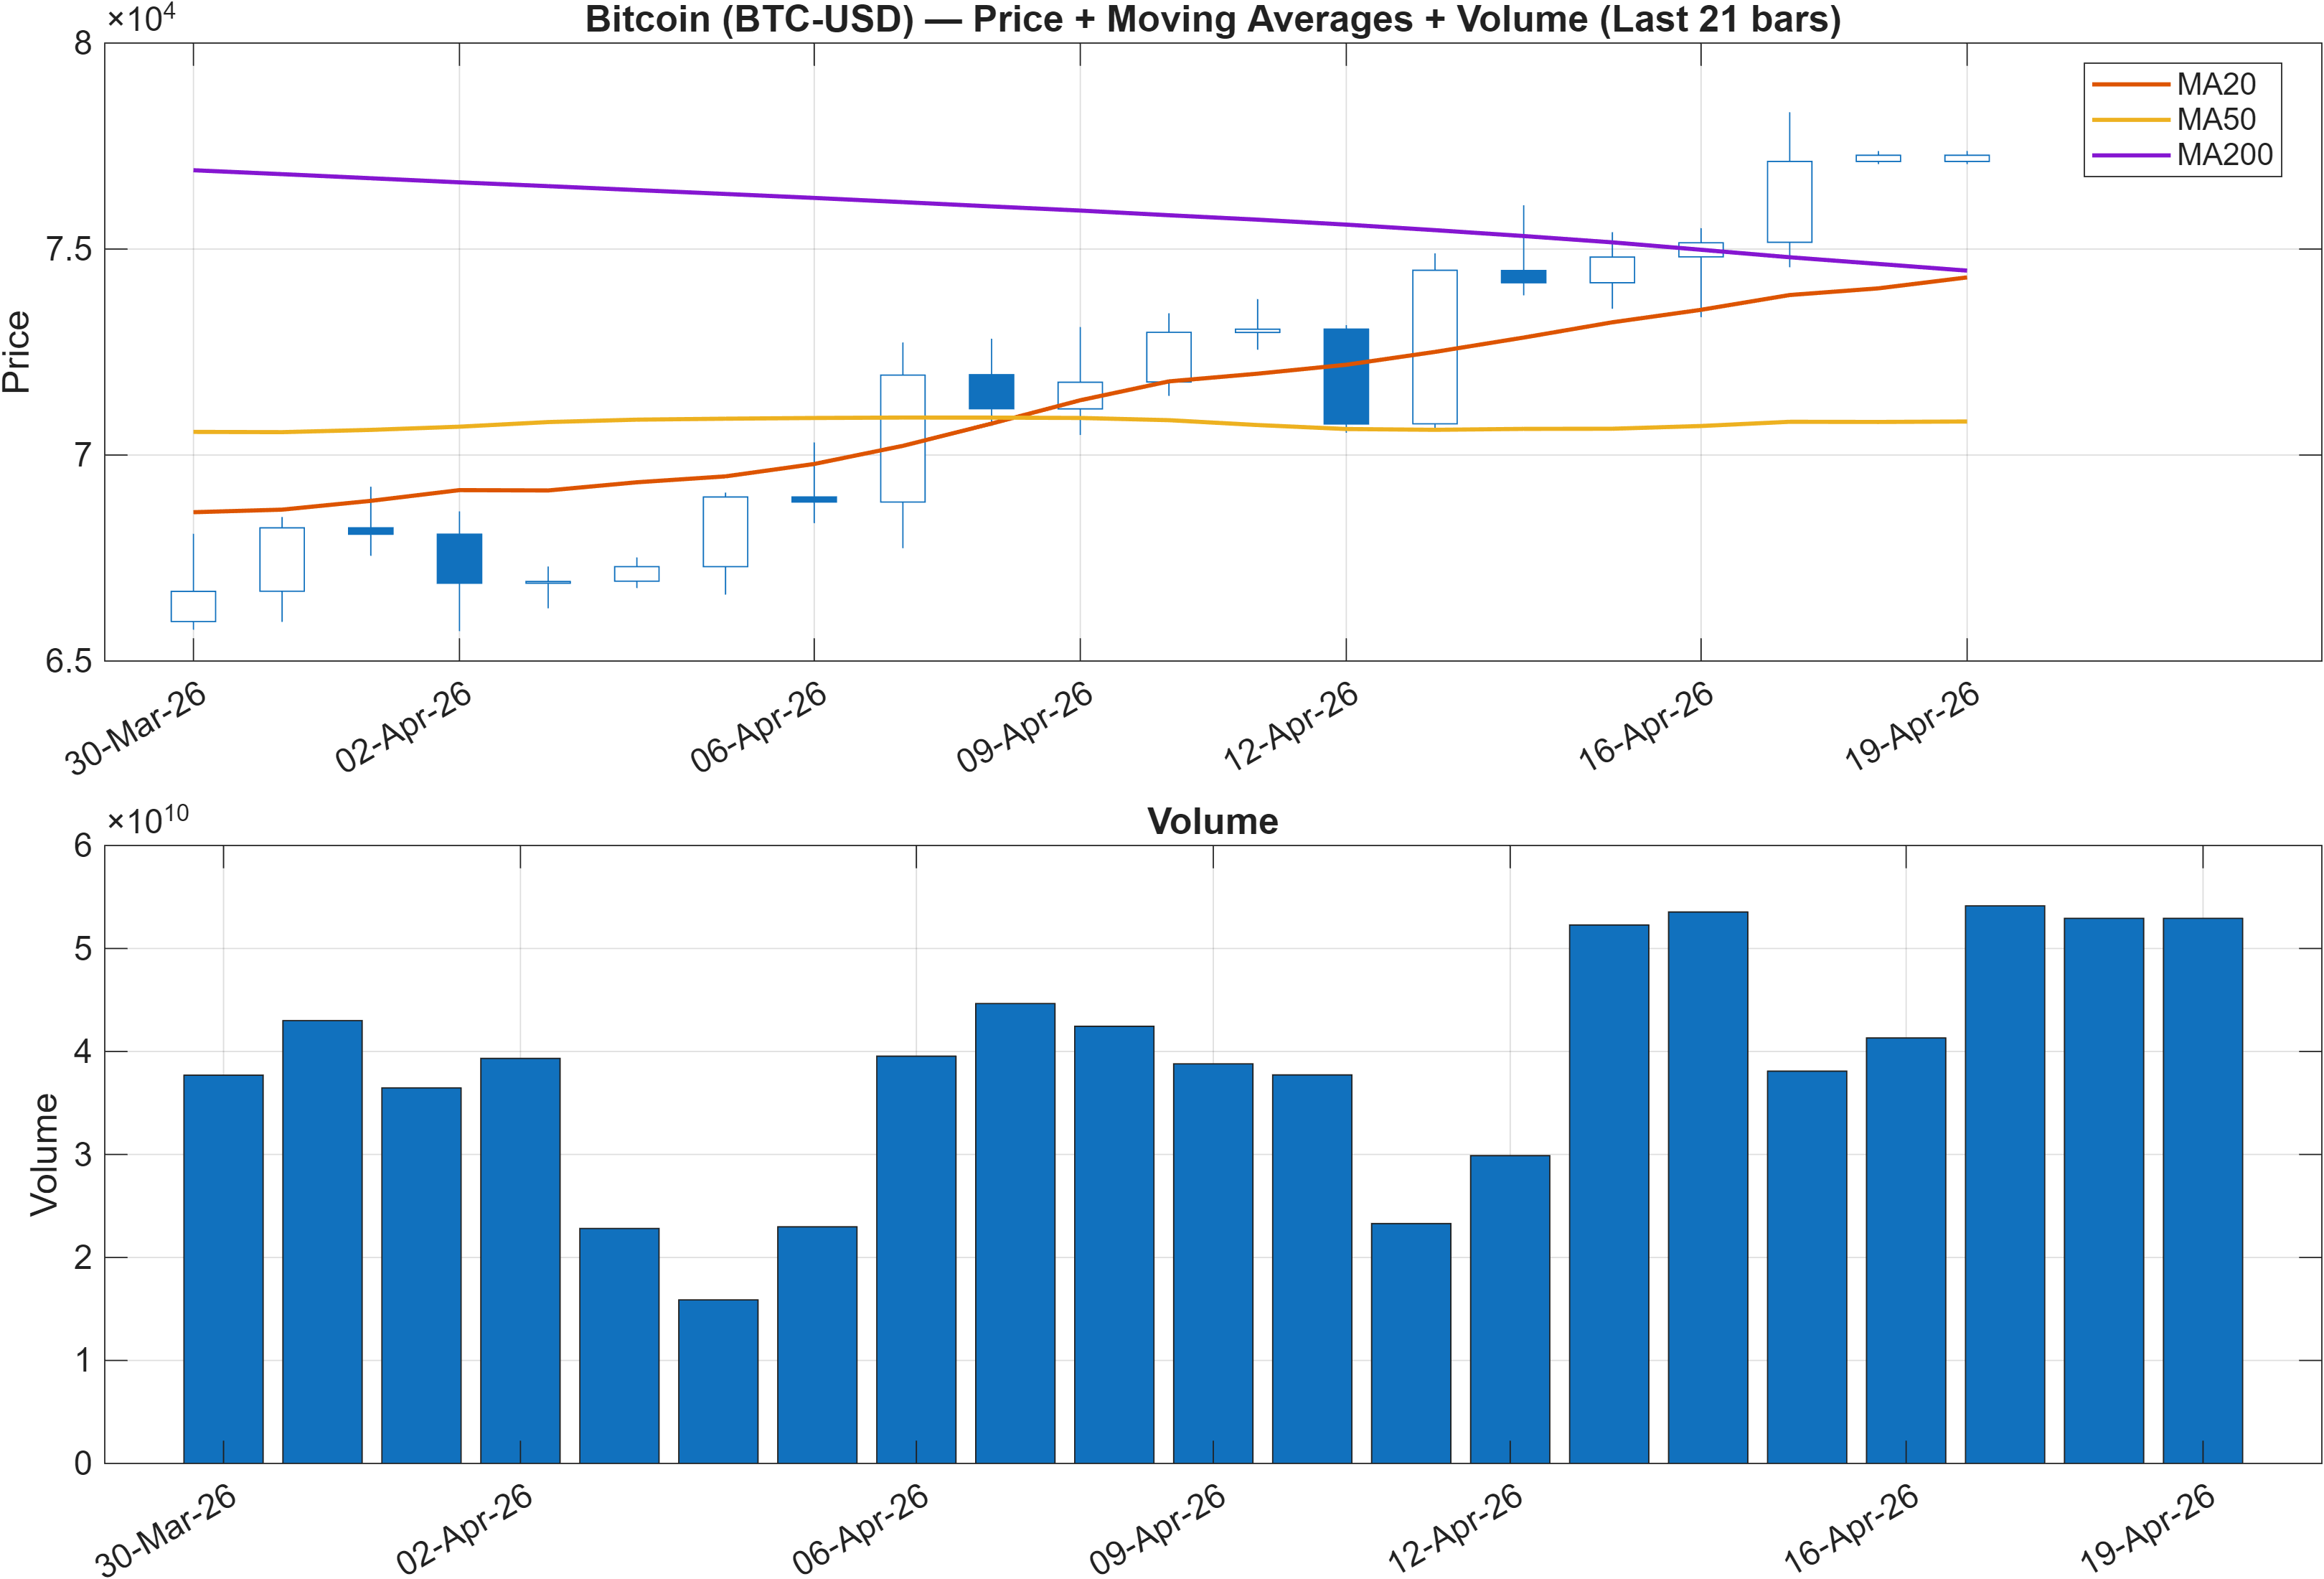
Trend diagnosis is currently a two-speed configuration. The close versus the MA50 is flagged as Bullish, indicating price is behaving constructively over the intermediate window. However, MA50 versus MA200 is flagged as Bearish, which is typical of a market that has not fully repaired longer-cycle structure.
This type of divergence often matters more than any single moving average cross. When the short-to-intermediate trend is positive but longer-term structure remains negative, the market can behave in either of two ways: (1) sustain a grind higher that eventually forces longer-term averages to re-align, or (2) fail near overhead supply where longer-term participants remain cautious. The rank stack (daily #32 and 3-monthly #25) leans toward the former being plausible, but the moving-average state argues for confirmation discipline rather than assumption.
Volume context is embedded in the figure, and it becomes most actionable around the defined resistance area (see Section 4). A bullish close relative to MA50 is typically most durable when participation expands on advances and contracts on pullbacks; without leaning on additional datasets, the cleanest operational conclusion is that trend is constructive but still carries regime-transition risk until longer-cycle structure improves.
Interpretation: Close vs MA50 = Bullish, MA50 vs MA200 = Bearish.
3) Momentum & volatility dashboard
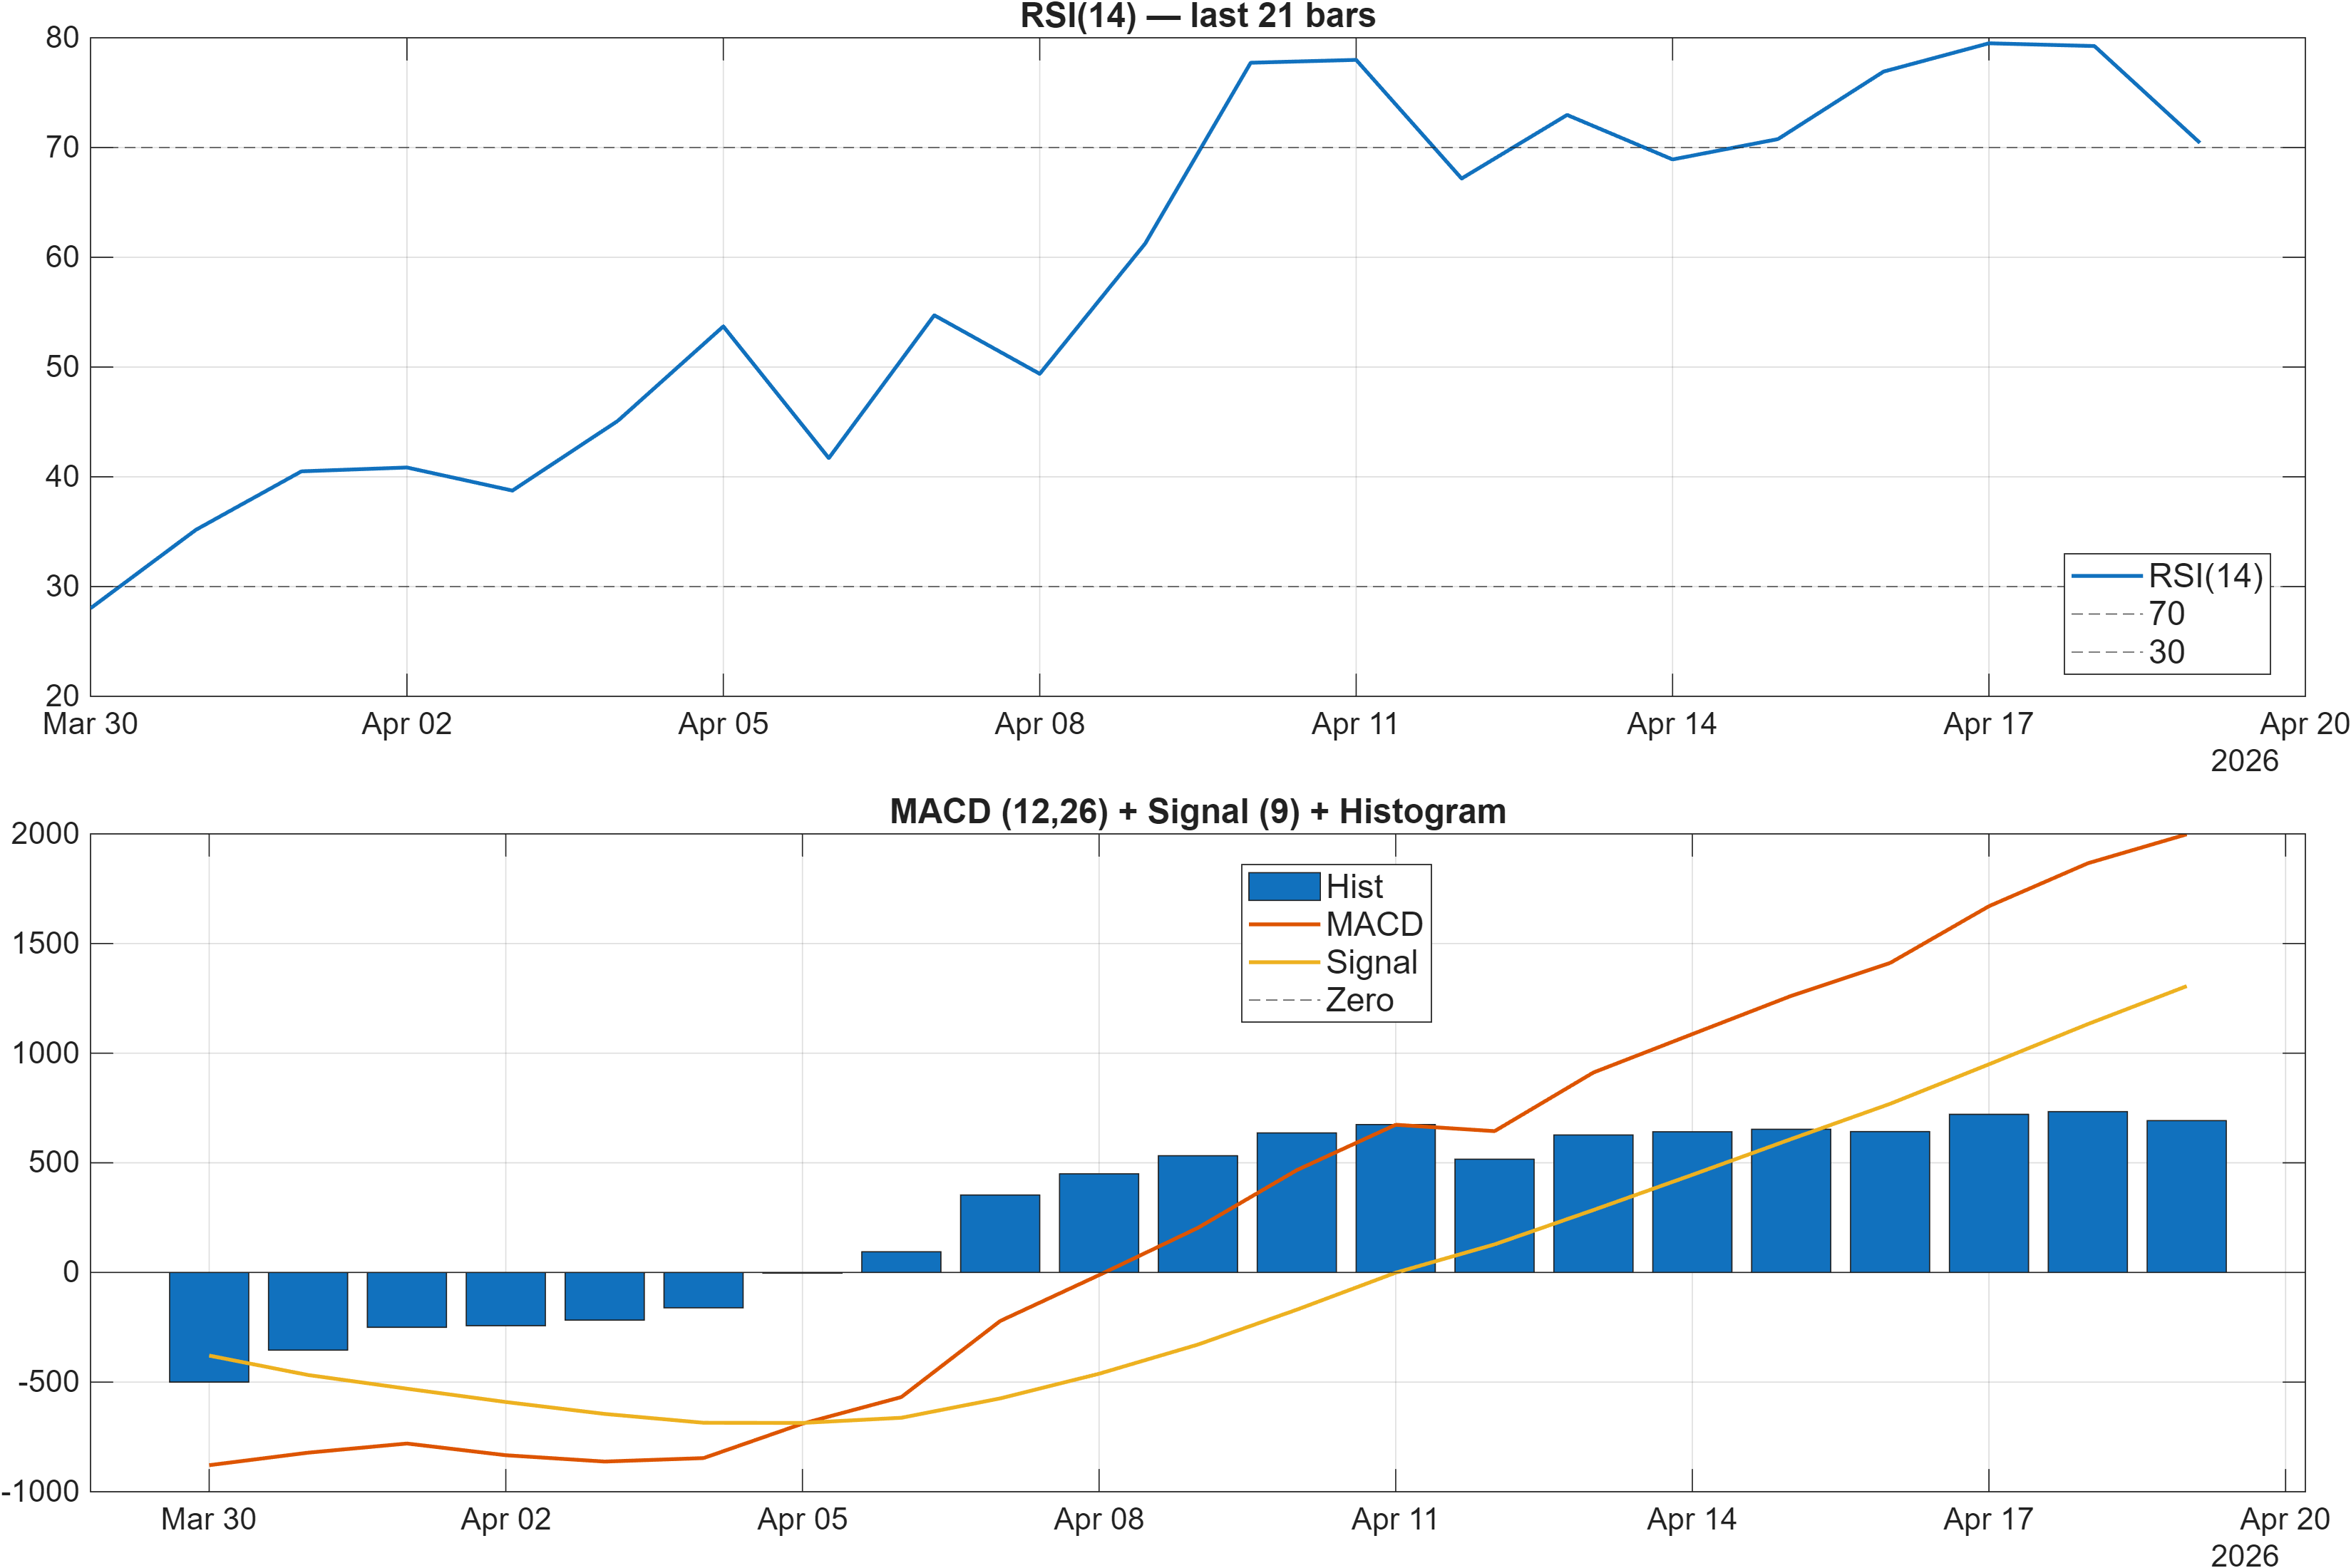
Momentum signals are broadly supportive, but they also suggest late-stage pressure that warrants selective risk control. RSI bias is labeled bullish and the RSI(14) reading is 70.43, a zone that frequently coincides with strong trend behavior but can also precede short consolidation phases. Importantly, RSI at ~70 does not, on its own, invalidate trend; it shifts attention toward whether price can hold above prior breakout areas during any pullback.
MACD adds a constructive layer: the MACD histogram is positive at 692.4290 (and 692.4 in the signal table), typically consistent with upside momentum persisting. In divergence terms, the picture is not “RSI hot / MACD fading”; it is “RSI strong / MACD still expanding,” which is generally a healthier configuration than an overbought oscillator paired with weakening trend impulse.
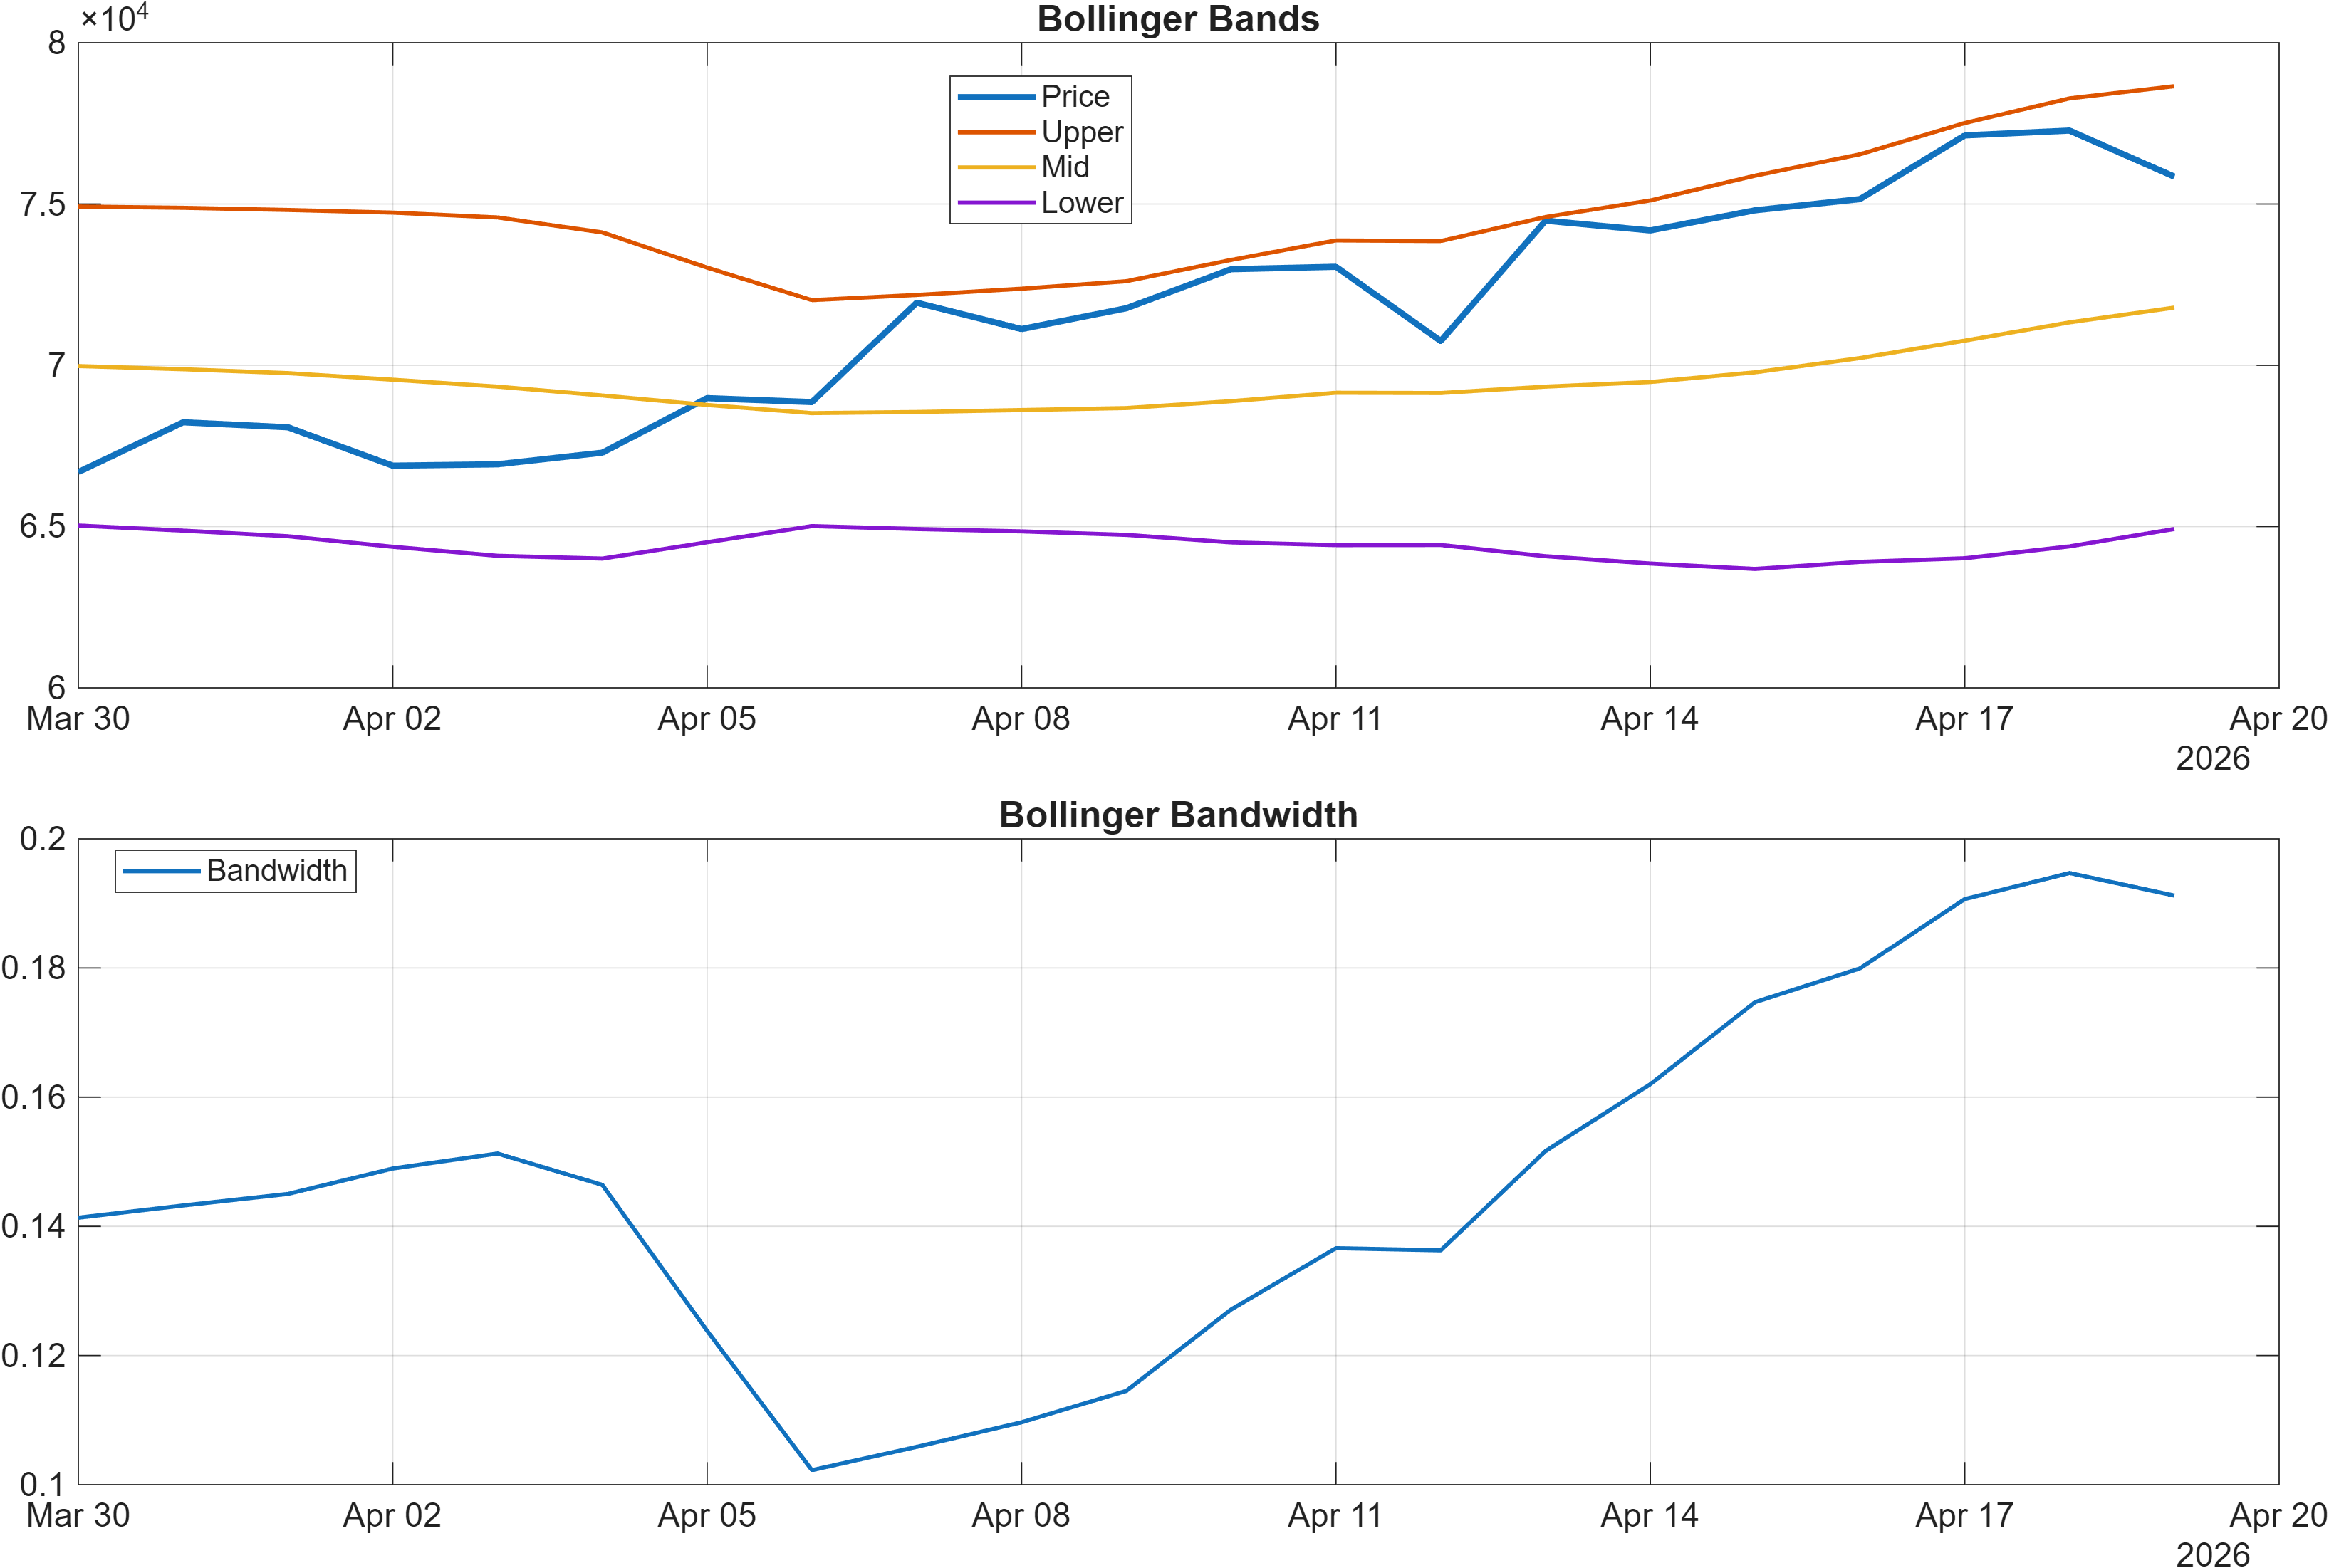
Volatility conditions look orderly rather than explosive. Bollinger bandwidth is 0.1912, also tagged as neutral in the 18-signal table. That matters because trend continuation tends to be easier when volatility is not rapidly compressing into a squeeze (which can create false breaks) or expanding uncontrollably (which can mark exhaustion). Here, bandwidth reads more like a stable regime supporting directional follow-through, provided price behaves cleanly around resistance and does not lose the primary support band.
Interpretation: RSI bias = Bullish, MACD hist = 692.4290.
Interpretation: Bandwidth (volatility regime) latest = 0.1912.
4) Support / Resistance zones
Support ~ 65024.2188 | Resistance ~ 75457.9219
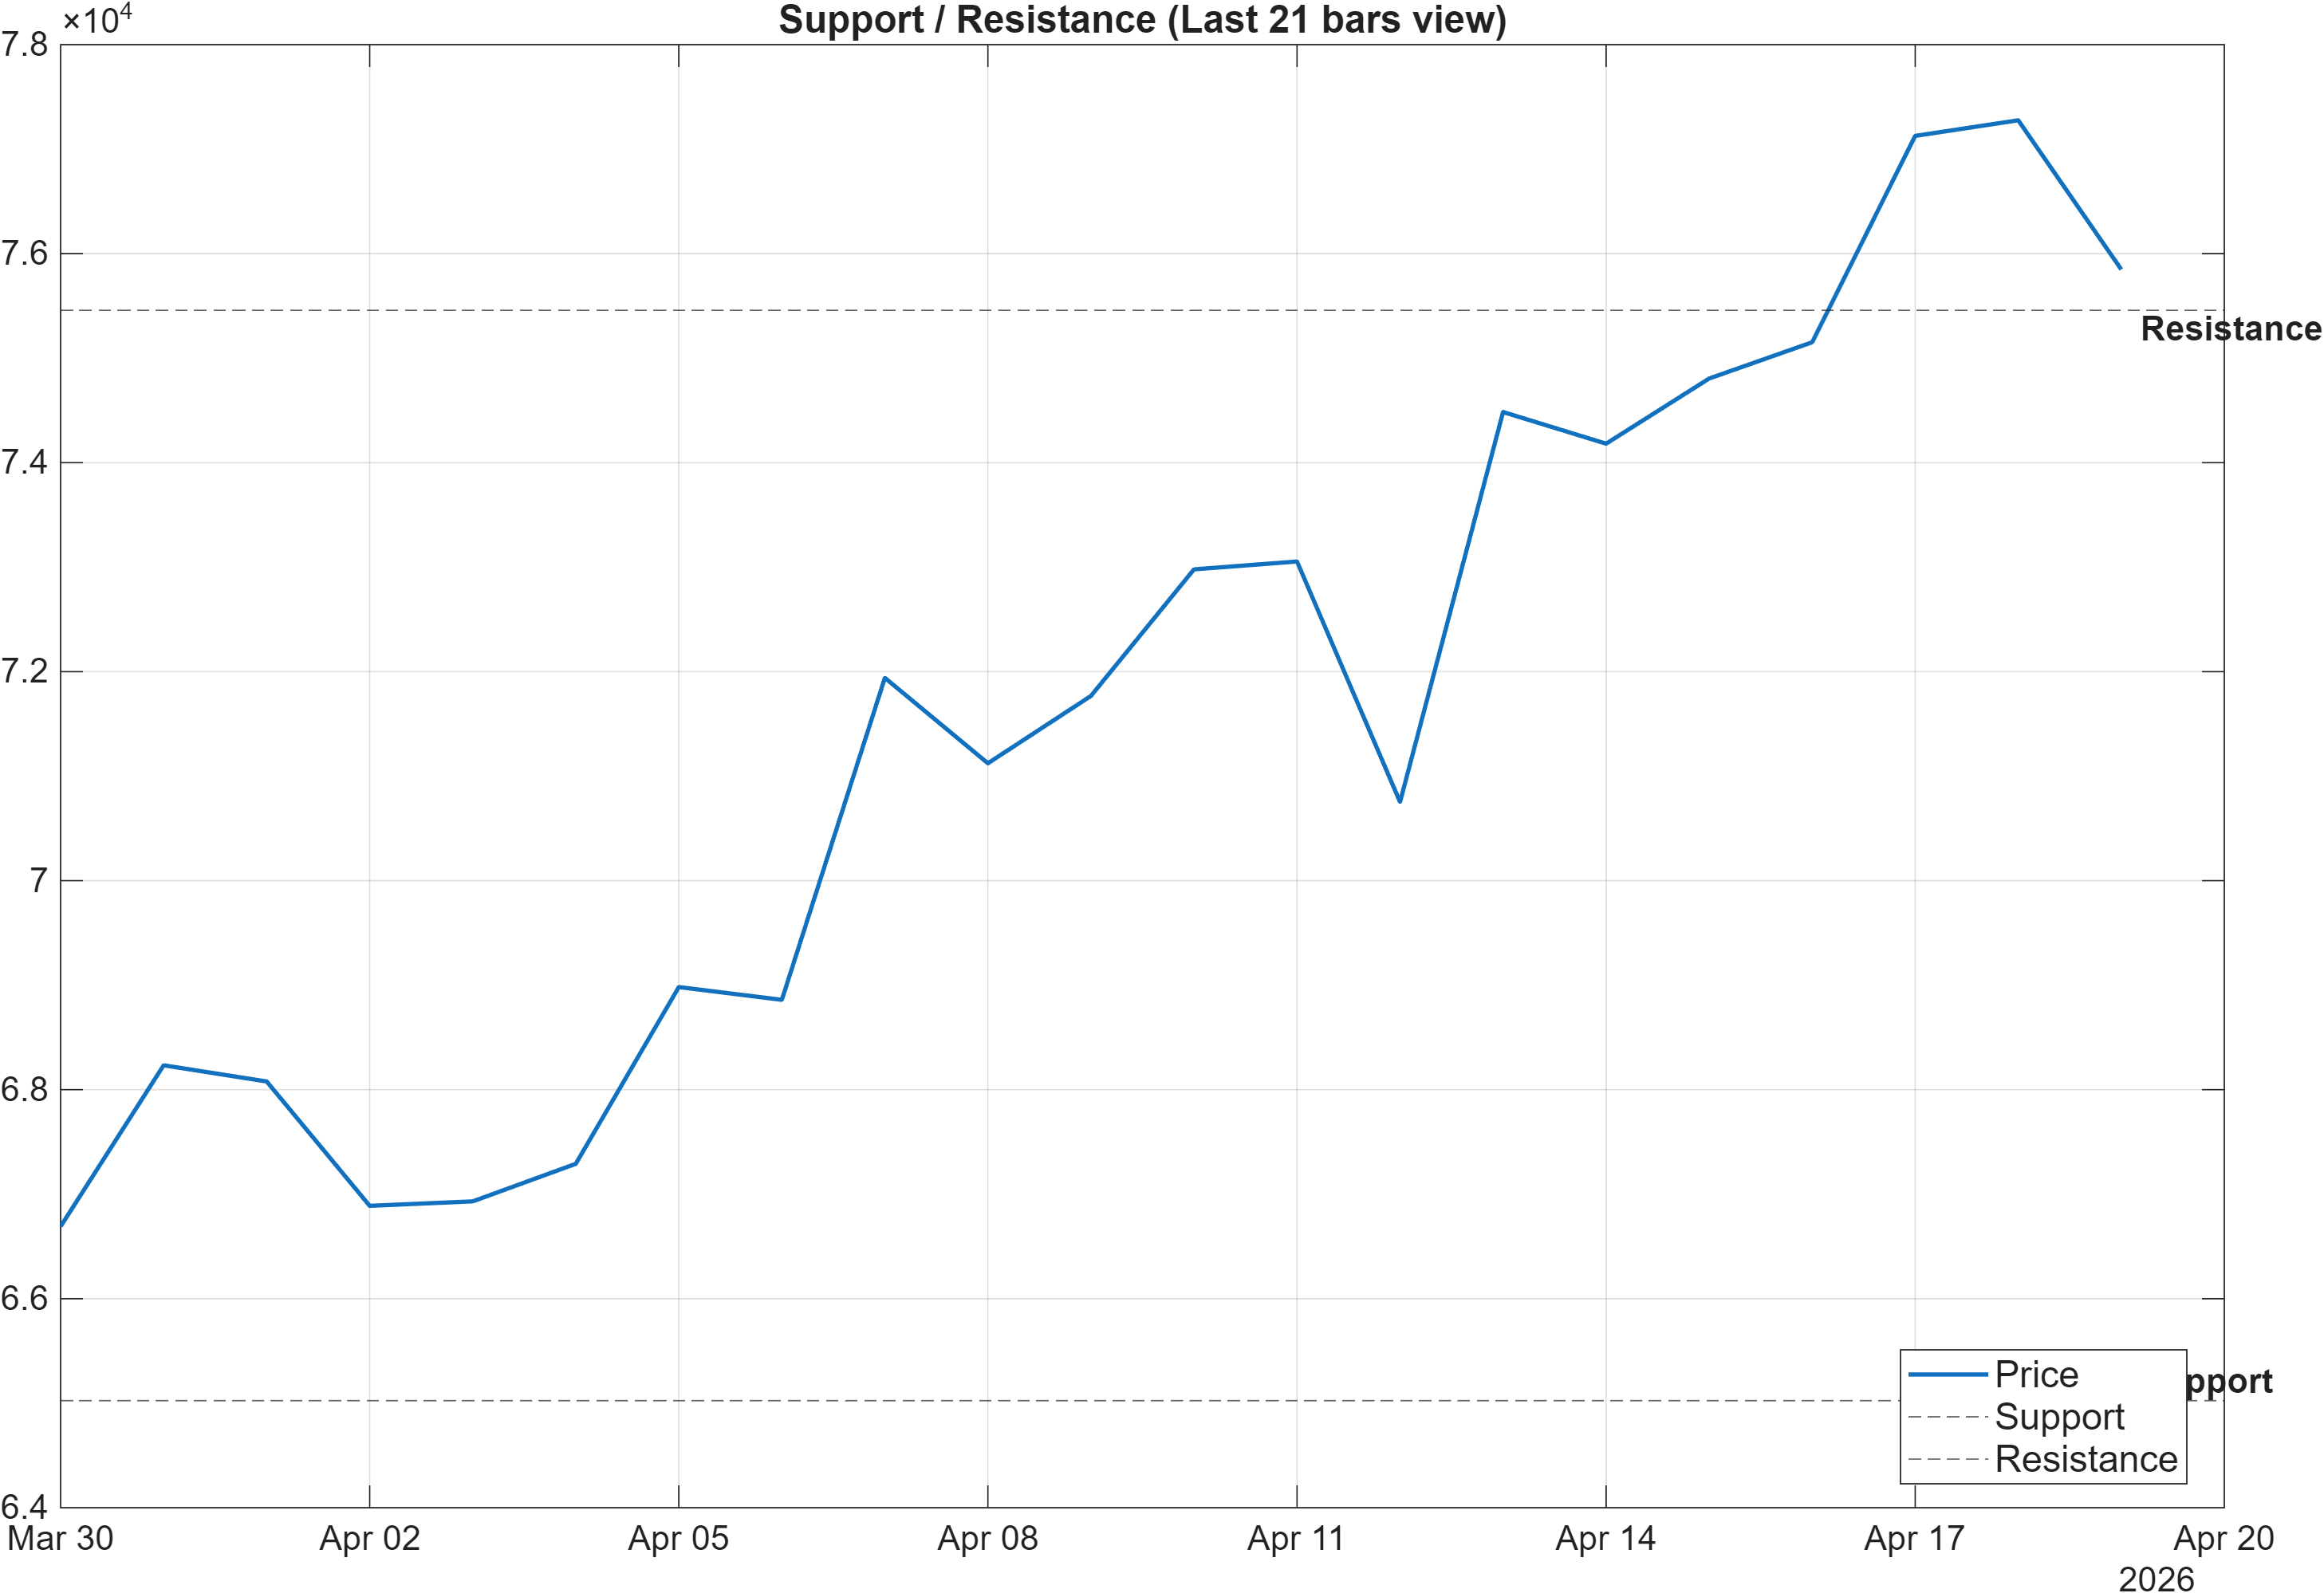
The current technical map is unusually clean: a single, well-defined support zone at 65024.2188 and a primary resistance zone at 75457.9219. This creates a straightforward framework for separating continuation from deterioration without overfitting to minor levels.
With intermediate trend flagged bullish (close vs MA50), the first question is whether pullbacks respect 65024.2188. A market can remain “bullish” on many indicators while still failing if it starts closing below a widely observed support zone; that is why the report’s scenario language emphasizes a close below support as a deterioration trigger.
On the upside, 75457.9219 represents the area where continuation needs validation. The condition is not merely touching or intraday piercing; the scenario specifies a break above resistance with volume. That volume qualifier aligns with the broader signal stack: momentum is positive (MACD histogram 692.4290; RSI(14) 70.43), but longer-cycle structure is not fully aligned (MA50 vs MA200 bearish). In such mixed-regime setups, participation tends to be the deciding variable for whether resistance becomes acceptance.
Scenario view: Break above resistance with volume → continuation. Close below support → signal deterioration risk.
5) Quant Technical Dashboard (18 Signals)
KGNAI AI Technical Analysis Score (Deep Reinforcement Learning): Rank #406 out of 800 (Rank 1 represents the strongest technical positioning and a higher probability of favorable price behavior. As ranks increase toward the maximum, the probability of favorable outcomes weakens and bearish positioning becomes more dominant.) | Label: Neutral | Score: -0.015
18-Signal Technical Confluence Score: 0.667 (Bullish)
Overall Technical Score (18-signal confluence + DRL rank blend): 0.462 (Bullish)
Note: The blended score reflects signal strength weighted against broader AI technical ranking, which may temporarily diverge.
Blended technical score breakdown: 0.462 (Bullish | Bull 13 / Bear 1 / Neutral 4)
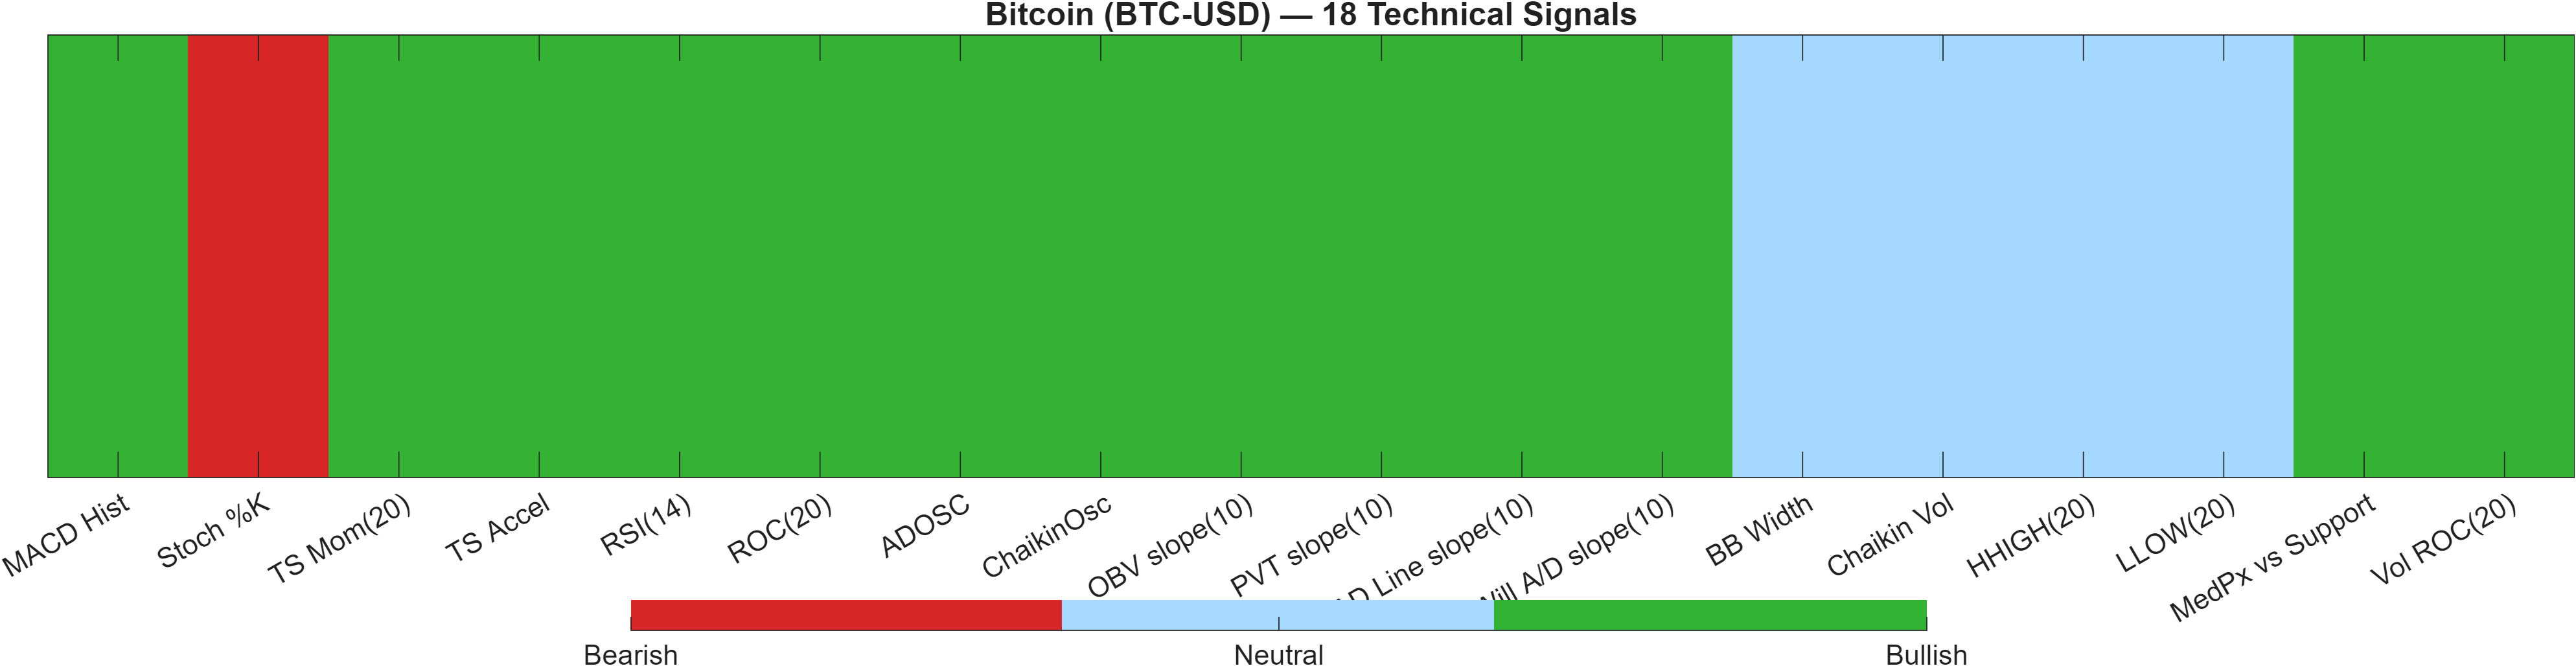
Signal confluence is net bullish at the indicator level: the 18-signal score is 0.667 and the blend remains bullish at 0.462, with Bull 13 / Bear 1 / Neutral 4. The distribution matters—broad agreement across many independent measures tends to be more resilient than a rally powered by one narrow factor.
The principal tension is the separate DRL technical rank: #406 out of 800 with a Neutral label and score -0.015. This is not a contradiction to ignore; it is a divergence worth tracking. In practice, it means the indicator stack is constructive, yet the broader pattern-recognition ranking model is not assigning BTC-USD to the strongest cohort of technical setups at this moment.
Within the signal table, momentum/participation inputs are largely supportive—MACD histogram 692.4 and RSI(14) 70.43 are bullish, while volume-related measures (e.g., Vol ROC(20) 23.09) also screen bullish. The main counter-signal is Stoch %K at 86.58, marked bearish, which can align with near-term overextension even inside an uptrend.
Signal table (Bull/Bear/Neutral)
| Indicator | Value | Signal |
|---|---|---|
| MACD Hist | 692.4 | Bullish |
| Stoch %K | 86.58 | Bearish |
| TS Mom(20) | 9043 | Bullish |
| TS Accel | 1.13e+04 | Bullish |
| RSI(14) | 70.43 | Bullish |
| ROC(20) | 11.16 | Bullish |
| ADOSC | 73.71 | Bullish |
| ChaikinOsc | 3.306e+10 | Bullish |
| OBV slope(10) | 2.163e+11 | Bullish |
| PVT slope(10) | 4.295e+09 | Bullish |
| AD Line slope(10) | 9.225e+10 | Bullish |
| Will A/D slope(10) | 7501 | Bullish |
| BB Width | 0.1912 | Neutral |
| Chaikin Vol | -22.5 | Neutral |
| HHIGH(20) | 7.832e+04 | Neutral |
| LLOW(20) | 6.573e+04 | Neutral |
| MedPx vs Support | 1.22e+04 | Bullish |
| Vol ROC(20) | 23.09 | Bullish |
Interpretation: Indicator-level signals form the base confluence, which is then adjusted using a separate AI-driven technical ranking model. The final technical score summarizes this combined view.
6) News sentiment + extractive gist
Sentiment score (avg): 0.053 | Positive: 19% | Neutral: 76% | Negative: 4%
KGNAI AI News Sentiment Score (normalized -1 to +1): 0.00 (as of 2026-04-11) | Label: Neutral | Overall news score: 0.04
Positive Developments
Recent coverage across major financial outlets indicates an ongoing focus on broad crypto risk appetite and related ecosystem activity, with attention on capital formation, institutional experimentation, and price-linked “proxy” exposures in adjacent public markets. While much of the flow is not Bitcoin-specific, BTC often functions as the reference asset for aggregate sentiment, so constructive tone can support participation during resistance tests. In the provided sentiment distribution, the positive share is modest at 19%, which is consistent with a market narrative that is supportive but not euphoric. This aligns reasonably well with the technical backdrop where momentum is bullish (RSI(14) 70.43; MACD histogram 692.4290) yet longer-cycle structure remains mixed (MA50 vs MA200 bearish). Taken together, the news layer reads as a tailwind for continuation attempts, but not a standalone driver.
Neutral / Mixed Developments
The dominant news tone is informational, consistent with the high neutral share of 76% and a normalized sentiment score of 0.00. Coverage emphasizes routine market updates and network/economic mechanics—items that can matter for positioning but typically do not create immediate directional impulse without concurrent technical triggers. This neutrality can be beneficial in a trending environment because it reduces the likelihood of sentiment-driven whipsaws; however, it also means breakouts may rely more heavily on confirmed price acceptance and volume rather than narrative momentum. With Bollinger bandwidth at 0.1912 (a more moderate volatility regime), a neutral headline environment fits a “grind” profile: the market may continue to lean on technical levels—particularly 75457.9219—to determine the next directional phase.
Negative / Risk Signals
Risk-oriented coverage appears limited in aggregate—negative share is 4%—but still relevant given the mixed longer-term trend structure. Typical risk themes include signals of short-term positioning stress, shifts in exchange-related metrics, and isolated examples of realized losses or tactical selling by prominent market participants. Even when these items are idiosyncratic, they can amplify sensitivity near major levels, particularly if price approaches resistance without strong participation. In this context, the cleanest way to integrate the risk narrative is to treat it as a conditional catalyst: if BTC-USD fails to hold above intermediate trend support and begins closing below 65024.2188, negative stories can accelerate a momentum unwind from elevated readings (RSI(14) 70.43). Conversely, a confirmed push through 75457.9219 tends to reduce the market’s responsiveness to marginally negative flow.
- Whether sentiment remains neutral while price tests 75457.9219, or shifts meaningfully away from the 0.00 normalized reading.
- Any change in the balance between neutral (76%) and positive (19%) coverage if volatility (bandwidth 0.1912) begins to expand.
- Whether risk narratives intensify if price action weakens toward 65024.2188.
Sources referenced: Reuters, Bloomberg, Yahoo Finance, MarketWatch, Investing.com
Snapshot: AI Rank (Short–Mid–Long): Bullish (Bullish–Bullish–Bullish) · Technical Confluence: Bullish · Key Levels: Support ~65024.22 | Resistance ~75457.92 · News Sentiment: Neutral
7) Sources
Not available in the provided data.
You may also like: How KGNAI AI ranks instruments across global markets
Disclaimer: KGNAI provides AI-generated analytics and educational market commentary only. This is not financial advice. Markets involve risk. Always do your own research.