
TVK-USD (Terra Virtua Kolect) — 12-Apr-2026 Technical & Rank View Shows Mixed-to-Neutral Setup
Terra Virtua Kolect (TVK-USD) enters 12-Apr-2026 with a notably uneven cross-horizon profile: the monthly rank (#12 of 800) signals strong longer-horizon relative positioning, while the weekly rank (#315) and 3-month rank (#358) sit closer to the market’s mid-pack. Technically, trend structure remains pressured—price is below the MA50 and the MA50 remains below the MA200—yet momentum is not decisively bearish, with RSI(14) at 45.57 (Neutral) and a near-flat MACD histogram. Volatility conditions are active rather than compressed, with Bollinger bandwidth at 0.1525, making level discipline more important than single-indicator reads. The nearest probabilistic decision zones remain support ~0.0046 and resistance ~0.0065, framing confirmation vs. invalidation around break/hold behavior.
- Short / Mid / Long rank stance: Neutral / Neutral / Neutral (with a standout monthly relative rank versus mixed weekly and 3-month positioning).
- Technical confluence label: Neutral (18-signal confluence 0.278; blended score 0.123).
- Key levels: Support 0.0046 | Resistance 0.0065.
- News sentiment bias: Neutral (avg 0.013; 94% neutral coverage).
- Confirmation / invalidation: A break above 0.0065 with volume supports continuation; a close below 0.0046 increases deterioration risk.
KGNAI evaluates assets using large cross-sectional datasets built from millions of structured data points. Inputs incorporate fundamental metrics, technical structures, and systematically processed news sentiment. Statistical models, machine learning, and AI frameworks are used to assess relative positioning, signal alignment, and probabilistic behavior across broad universes.
- Ranks are comparative across the tracked universe, not absolute price targets.
- Confluence reflects alignment among independent signal groups.
- Support/resistance levels are probabilistic decision zones, not guarantees.
- Sentiment provides contextual bias within the broader analytical framework.
1) KGNAI AI Analysis
Region: CRYPTO | Total universe size: 800 ranked instruments
- Daily rank: #94 out of 800 — Bullish
- Weekly rank: #315 out of 800 — Neutral
- Monthly rank: #12 out of 800 — Bullish
- 3-Monthly rank: #358 out of 800 — Neutral
TVK-USD’s rank stack is best characterized as cross-horizon divergence. The monthly rank (#12) places the asset in the top tier of the 800-instrument universe, a profile often associated with strong relative behavior when viewed on a longer window. At the same time, the weekly rank (#315) and 3-month rank (#358) sit closer to the distribution’s middle-to-lower region, implying that the longer-horizon strength is not being consistently expressed across intermediate timeframes.
The daily rank (#94) adds a separate dimension: it suggests near-term relative firmness versus the broader crypto set, but with less persistence than the monthly signal. When short-window rank improves while the intermediate windows remain neutral, it commonly reflects either (a) a rebound attempt that has not yet forced a broader regime change, or (b) a tactical bounce occurring inside a weaker trend envelope. In practice, this configuration tends to be more sensitive to confirmation from trend structure and participation metrics.
The stated KGNAI term view is Neutral across short-, mid-, and long-term, which is consistent with a blended regime where favorable longer-horizon rank is offset by less supportive intermediate positioning. From a risk-control perspective, this is typically a “prove it” environment: the monthly rank argues against dismissing the asset’s relative strength, while the weekly/3-month ranks argue against treating that strength as established across market regimes without additional confirmation.
2) Price & trend overview
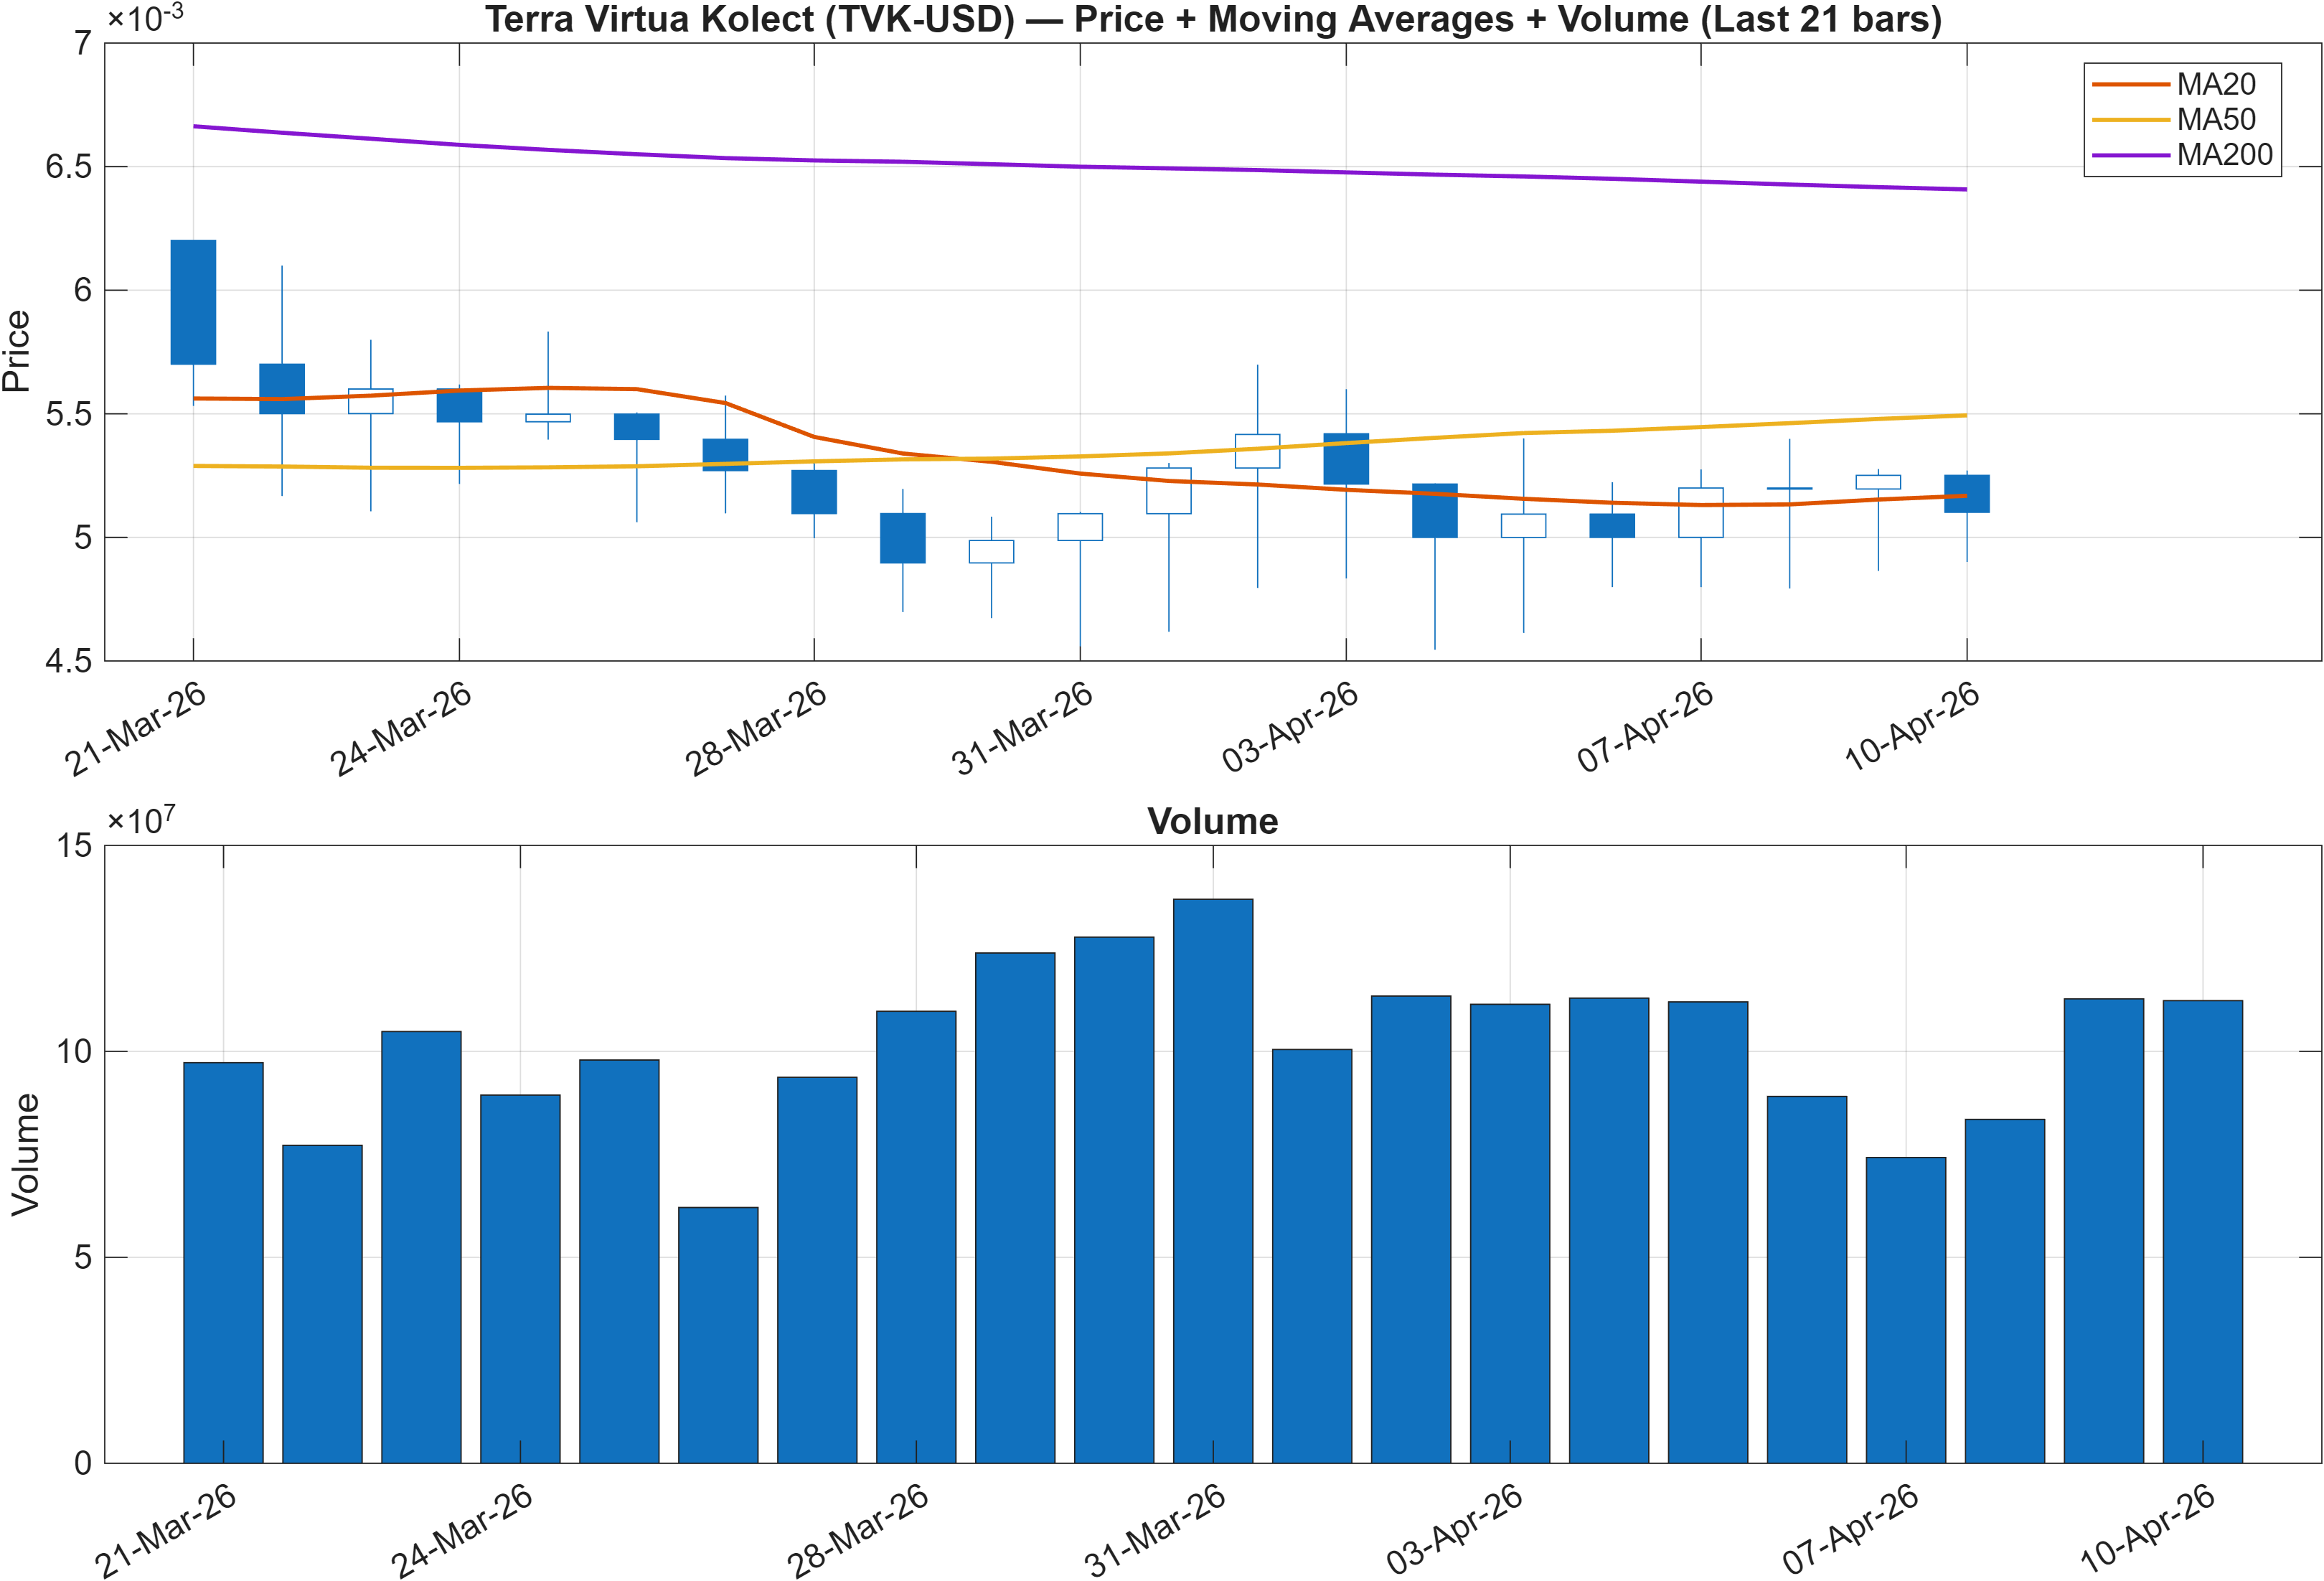
Trend structure is currently the primary restraint on bullish follow-through. The model interpretation flags Close vs MA50 = Bearish and MA50 vs MA200 = Bearish, which is the classic definition of a market trading beneath its intermediate average while the intermediate average is also below the longer-term anchor. In that arrangement, rallies can occur, but they often face overhead supply because the moving-average stack acts as a dynamic resistance band rather than a support complex.
This matters because rank strength alone does not “fix” a pressured moving-average regime—especially when the broader technical composite is only neutral. The overall blended technical score of 0.123 (Neutral) and the 18-signal confluence of 0.278 (Neutral) suggest the market is not providing a strong trending endorsement yet. In other words, the tape is not in a high-conviction bullish trend state even if some relative signals (notably monthly rank) are constructive.
The most actionable implication is that confirmation tends to show up first as a change in trend persistence: price holding higher lows while reducing the distance to the MA50, followed by improved acceptance above key resistance. With support near 0.0046 and resistance near 0.0065, trend improvement would typically be reflected by repeated defenses of the lower boundary and an ability to trade through the upper boundary without immediate reversal. Until those behaviors emerge, the moving-average posture argues for treating upside attempts as conditional rather than established.
3) Momentum & volatility dashboard
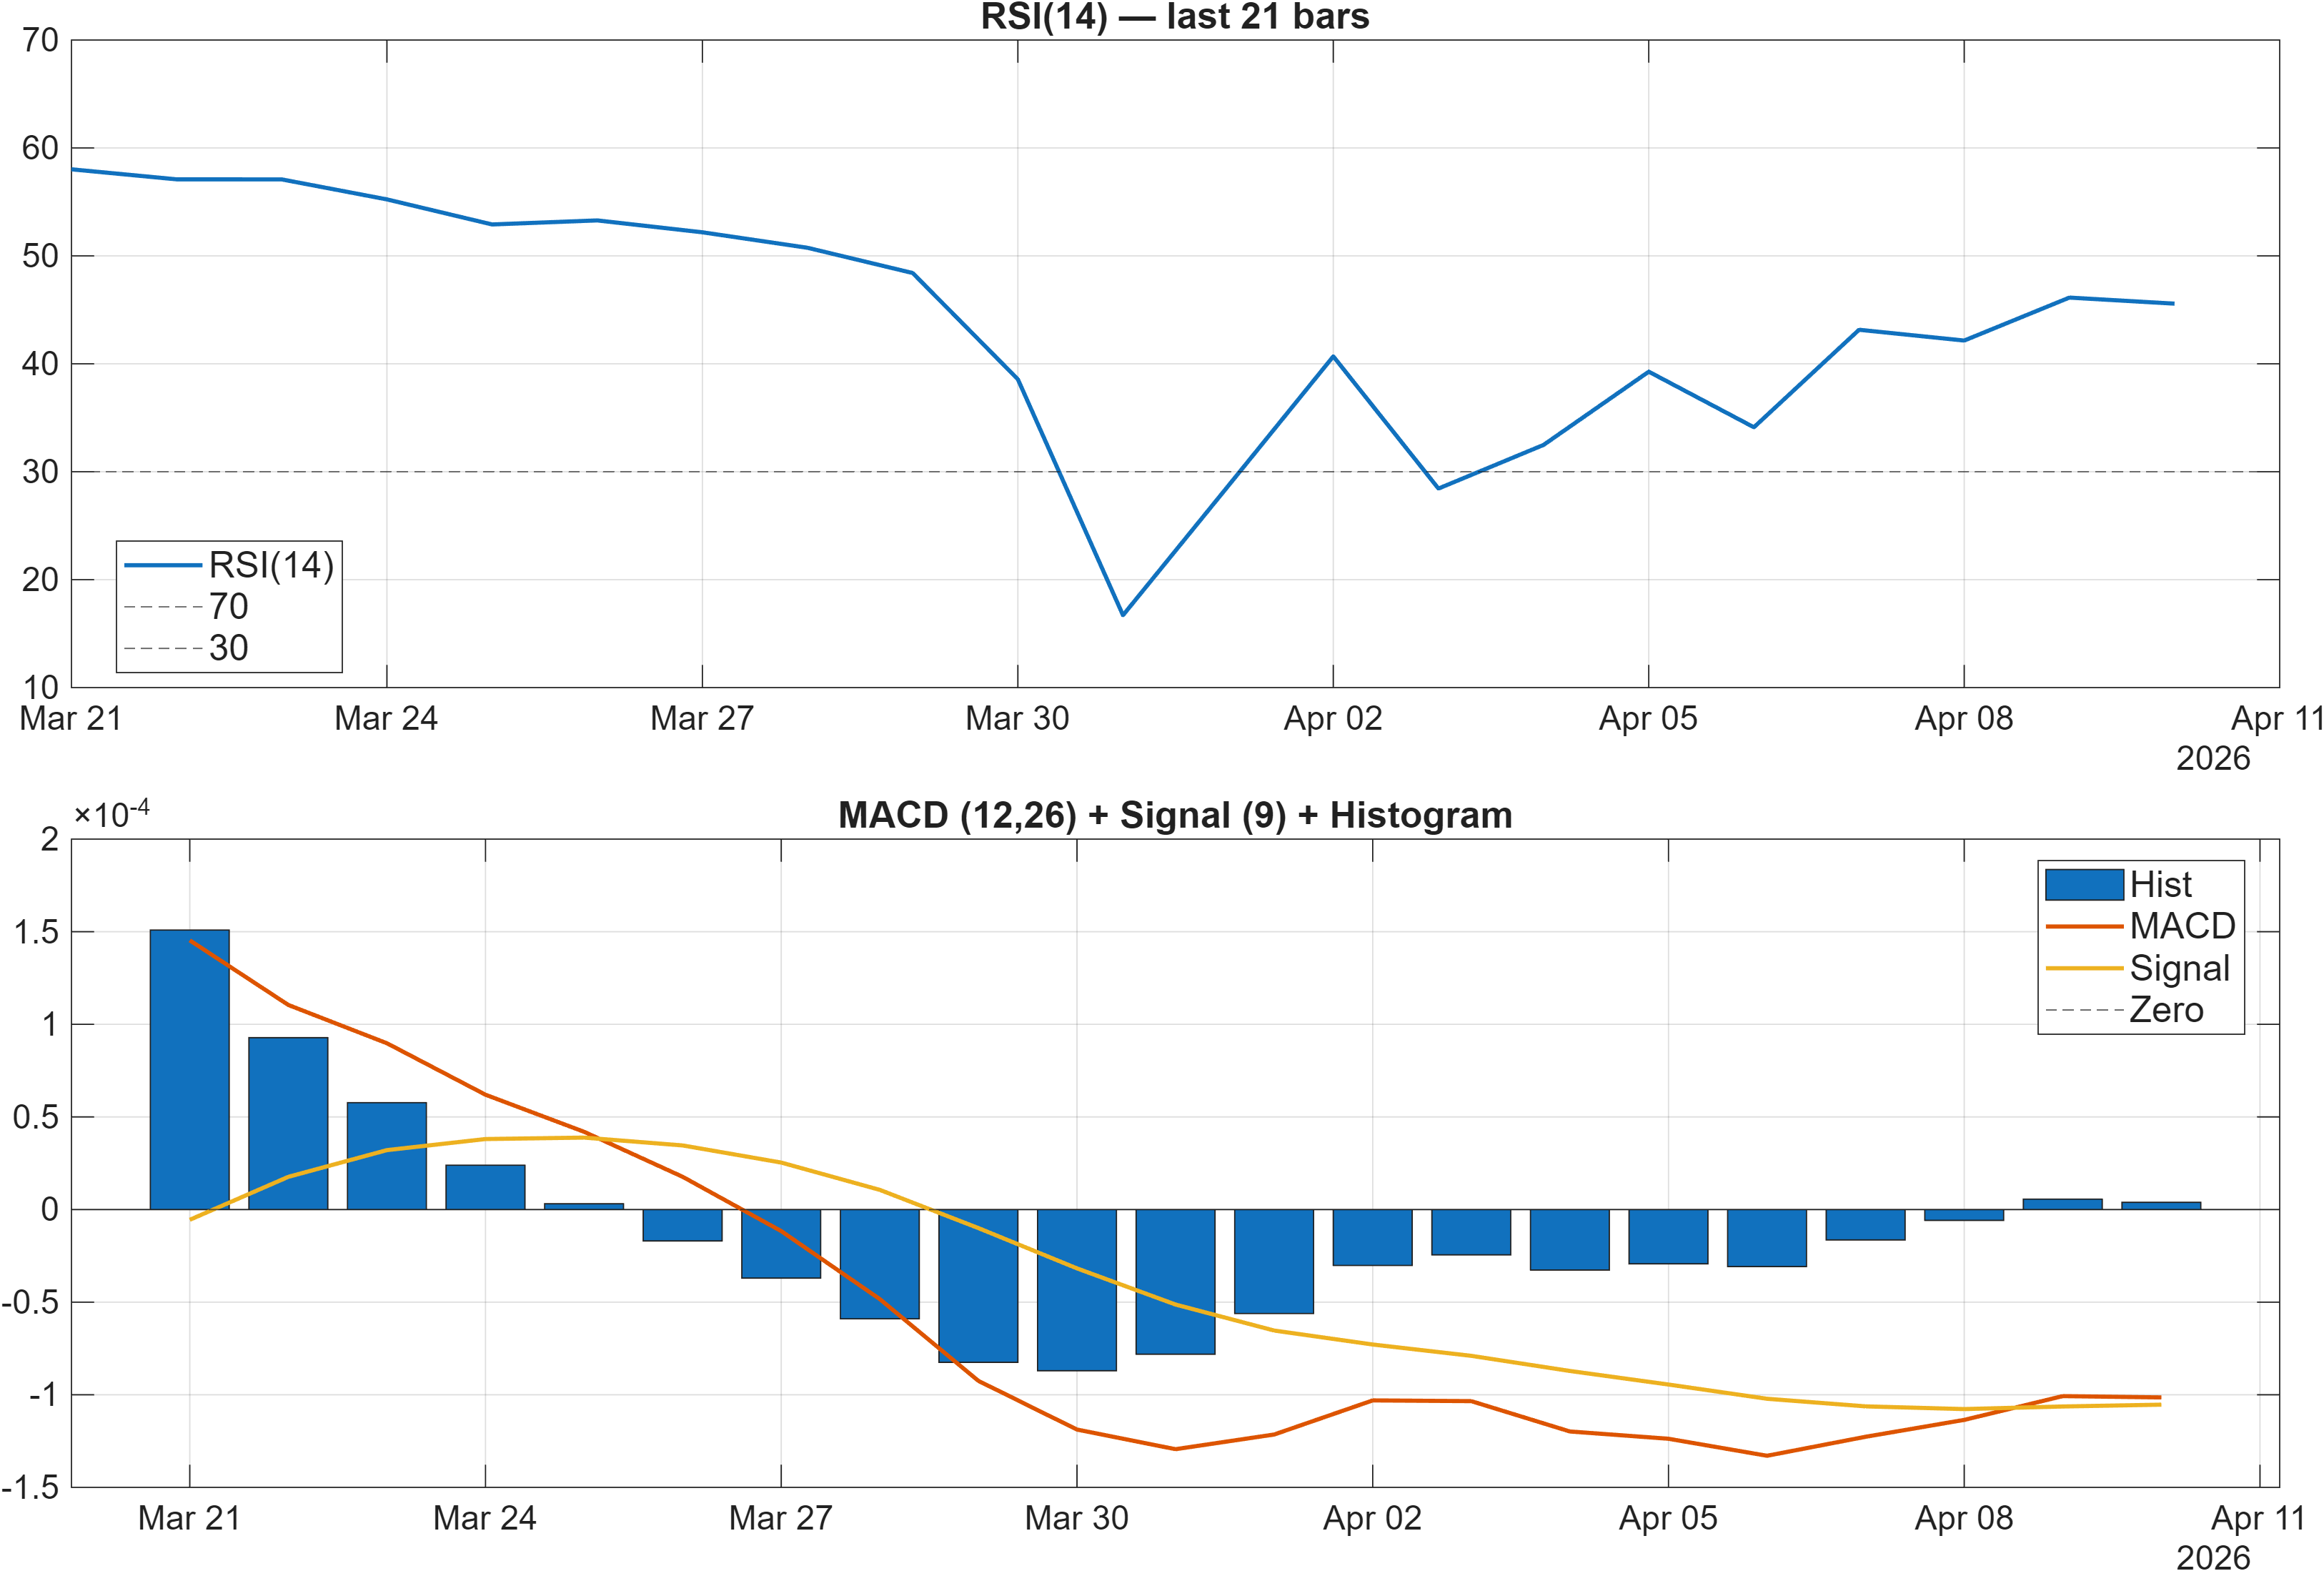
Momentum is not confirming the bearish trend structure, which creates a more nuanced read. RSI(14) at 45.57 is labeled Neutral, consistent with a market that is neither extended to the upside nor washed out to the downside. Meanwhile, the dashboard interpretation notes MACD hist = 0.0000, and the signal table reports a slightly positive MACD Hist (3.909e-06) marked bullish—together pointing to a momentum impulse that is present but not yet meaningfully separated from zero.
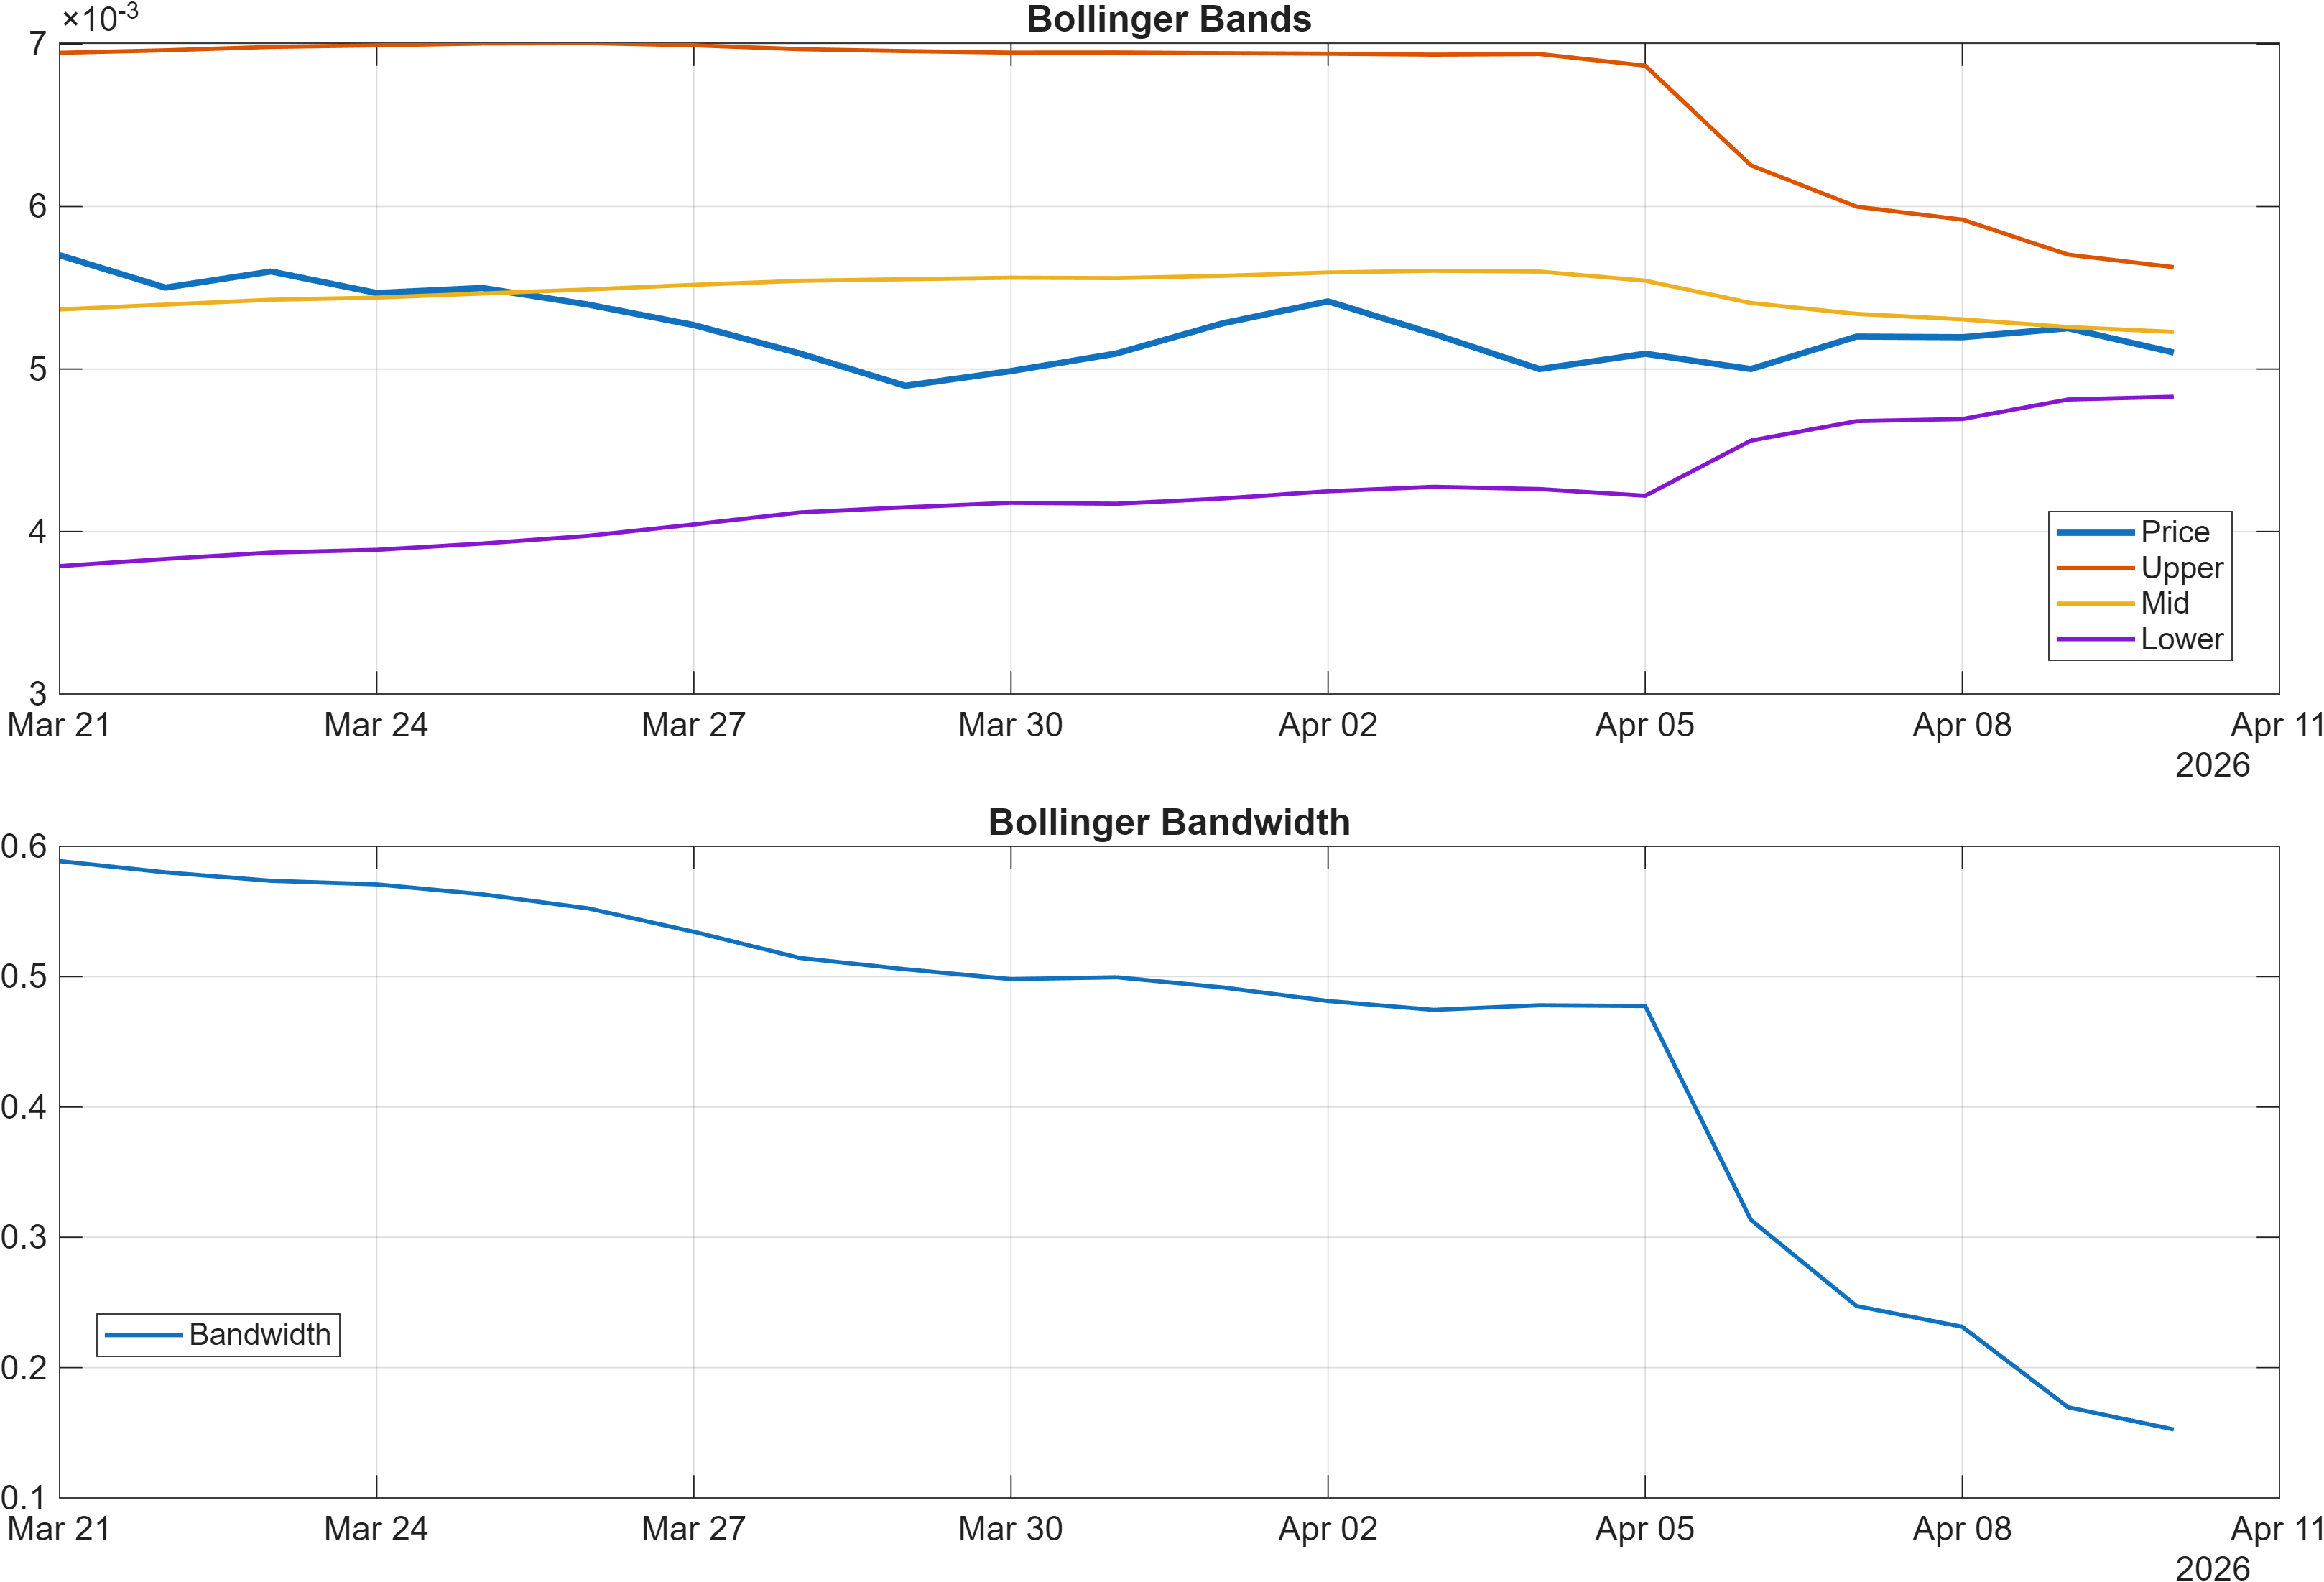
Volatility conditions are more supportive of tactical movement than of quiet consolidation. The Bollinger bandwidth at 0.1525 indicates an active regime rather than extreme compression, which can increase the probability of sharper swings around decision levels. That aligns with the broader comment that rising volatility can improve opportunity while widening timing error bars.
The key analytical tension here is momentum stabilization vs. trend headwind. With RSI neutral and MACD near flat, the market is not signaling exhaustion in either direction; instead, it implies that the next impulse is likely to be defined by level breaks and participation confirmation. In this context, momentum tools (RSI/MACD) are better used as confirmation filters—e.g., whether RSI can reassert above the midline during a resistance test—rather than as standalone reversal calls.
4) Support / Resistance zones
Support ~ 0.0046 | Resistance ~ 0.0065
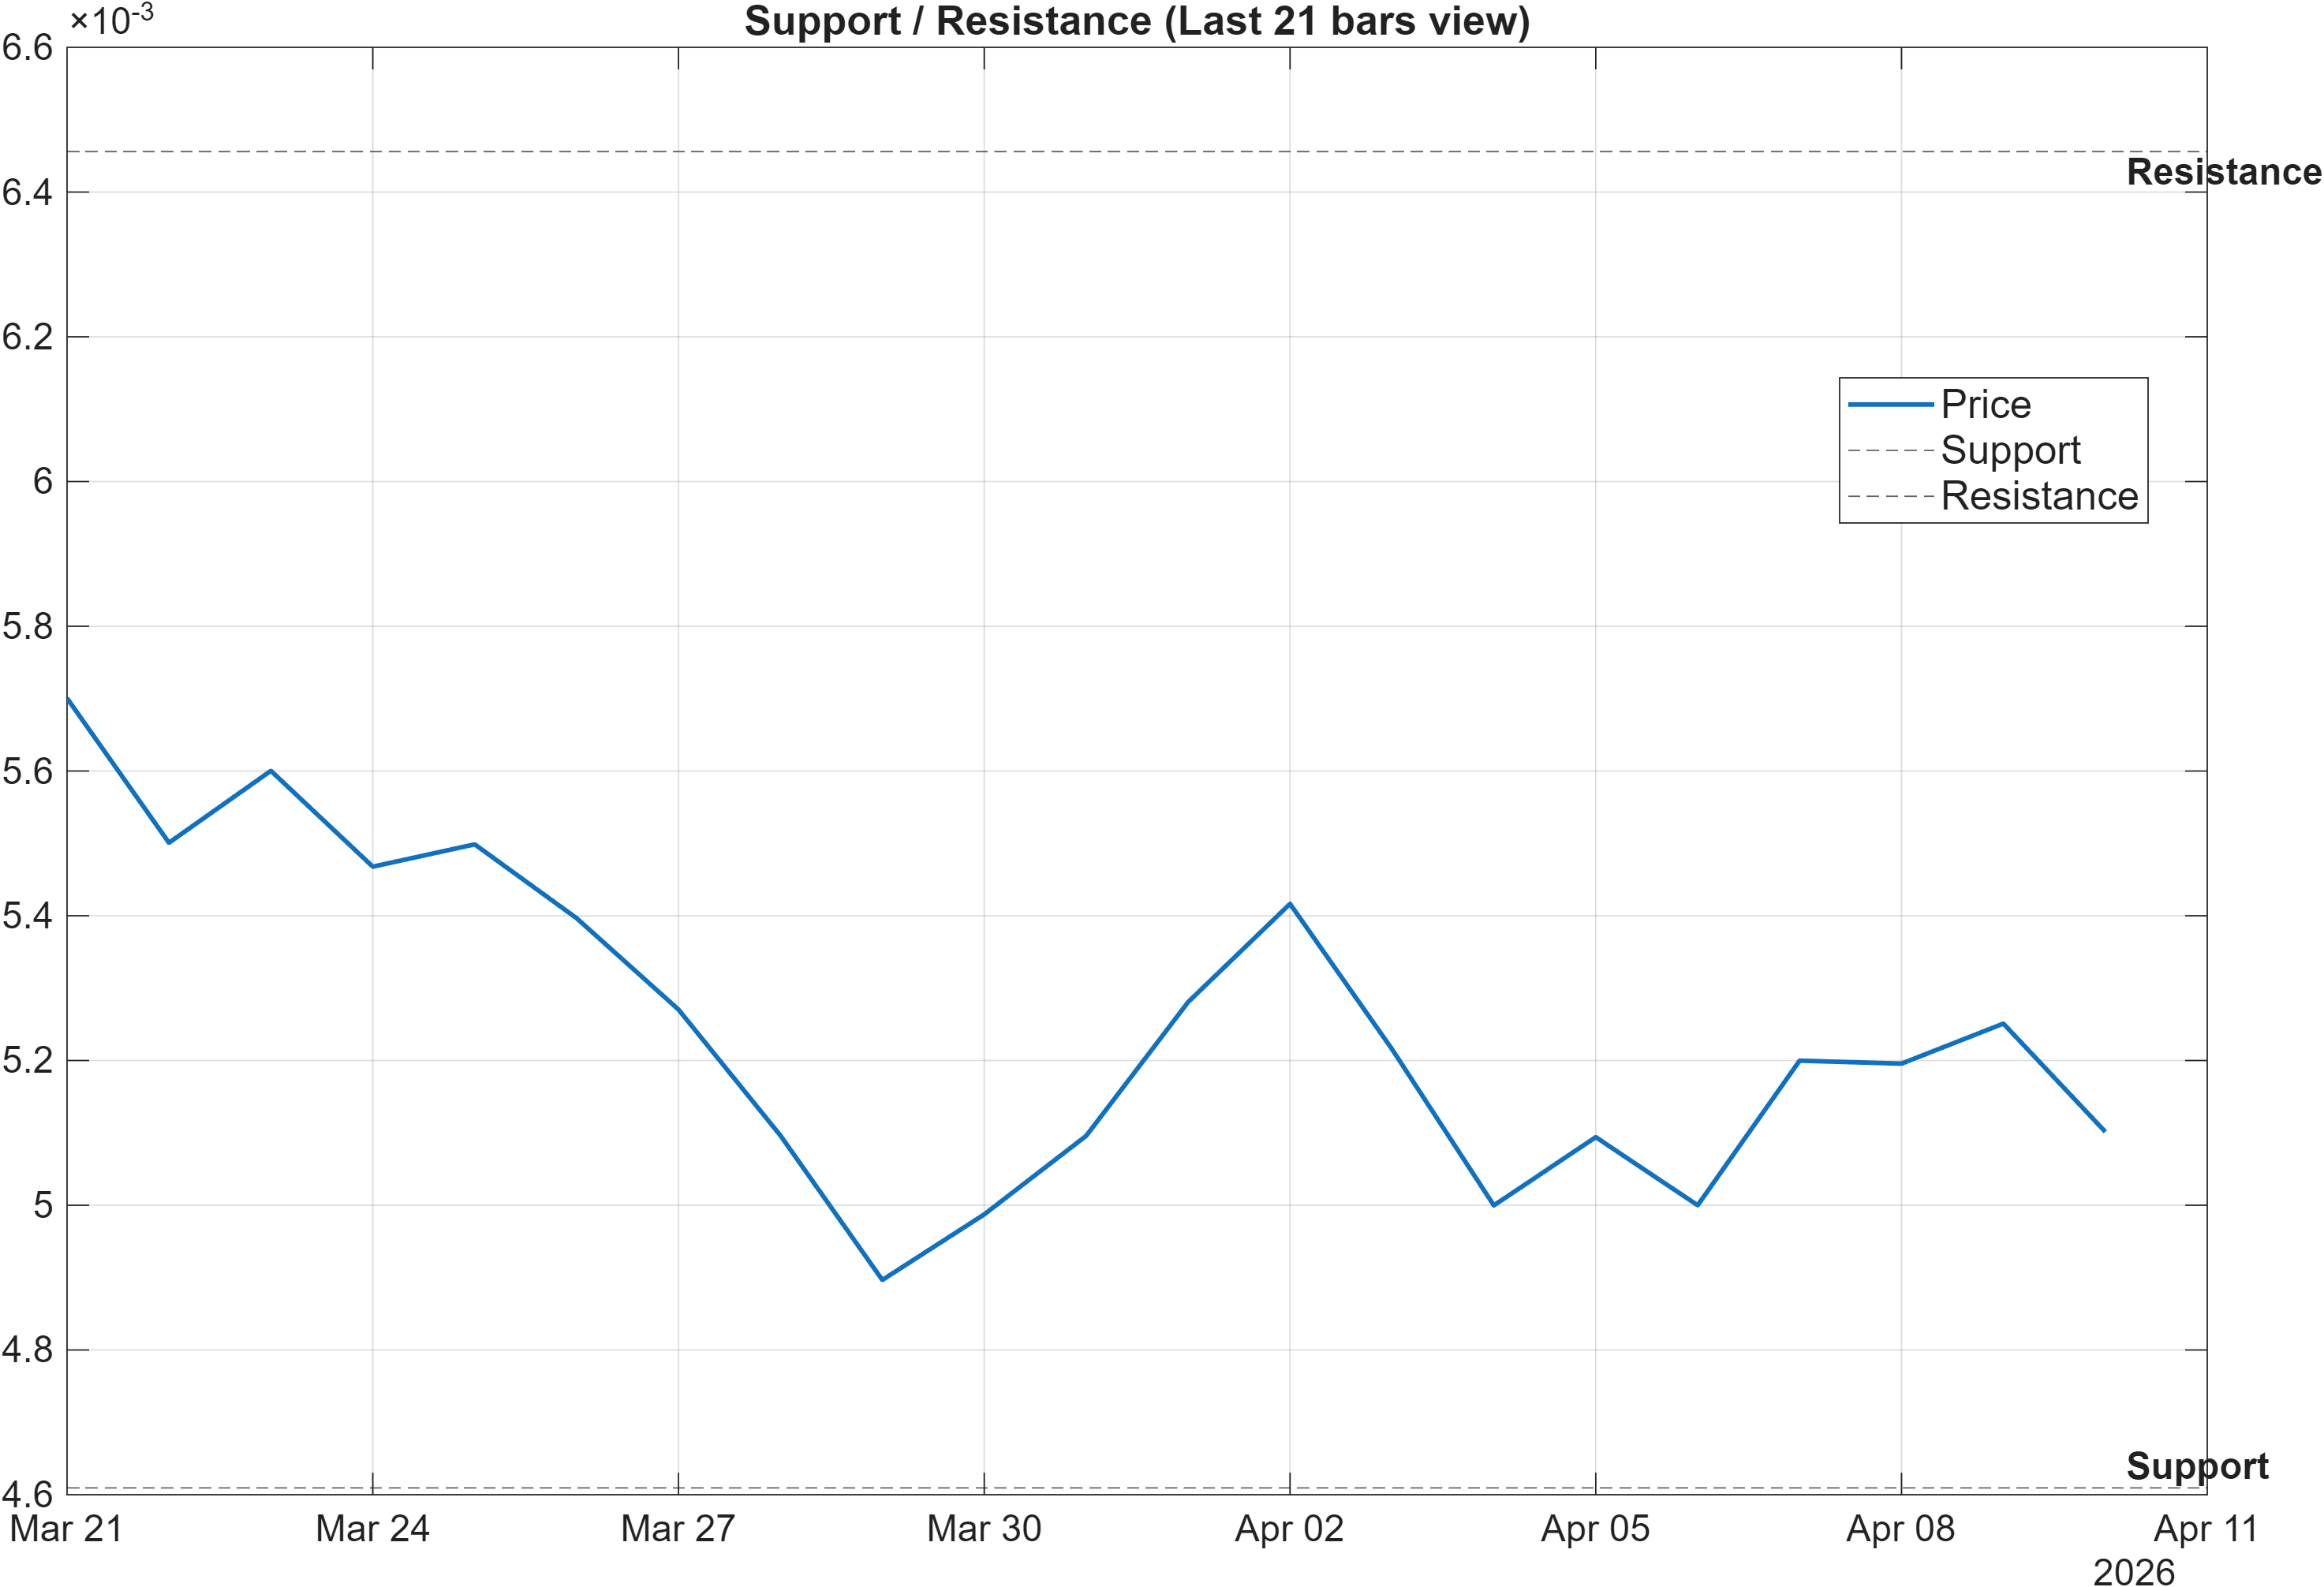
With trend signals still pressured, the 0.0046–0.0065 band functions as the primary map for separating stabilization from renewed weakness. The scenario guidance is explicit: a break above resistance with volume argues for continuation, while a close below support increases deterioration risk. In a neutral-to-mixed regime, these conditions are more informative than incremental indicator drift because they represent market acceptance (or rejection) at widely observed reference points.
The signal table adds context that reinforces the importance of level discipline. Over the last 20-day window, HHIGH(20) is 0.0061 and LLOW(20) is 0.004545, which brackets recent trading behavior tightly around the cited support zone and below the resistance level. That placement suggests that resistance at 0.0065 likely requires a more decisive impulse than a routine mean reversion move; it sits above the recent 20-day high measure, implying that a breakout would represent a fresh local expansion rather than a retest of an already-established ceiling.
Volatility conditions also matter for how these zones are used. With bandwidth at 0.1525, false breaks are a non-trivial risk, so confirmation is more credible when it is accompanied by participation proxies. Several volume-flow indicators are bullish (e.g., OBV slope(10) bullish and ChaikinOsc bullish in the table), but the presence of bearish momentum/return components (such as ROC(20) at -7.261) argues for waiting on the market to resolve the range rather than assuming direction inside it.
5) Quant Technical Dashboard (18 Signals)
KGNAI AI Technical Analysis Score (Deep Reinforcement Learning): Rank #495 out of 800 (Rank 1 represents the strongest technical positioning and a higher probability of favorable price behavior. As ranks increase toward the maximum, the probability of favorable outcomes weakens and bearish positioning becomes more dominant.) | Label: Neutral | Score: -0.238
18-Signal Technical Confluence Score: 0.278 (Neutral)
Overall Technical Score (18-signal confluence + DRL rank blend): 0.123 (Neutral)
Note: The blended score reflects signal strength weighted against broader AI technical ranking, which may temporarily diverge.
Blended technical score breakdown: 0.123 (Neutral | Bull 9 / Bear 4 / Neutral 5)
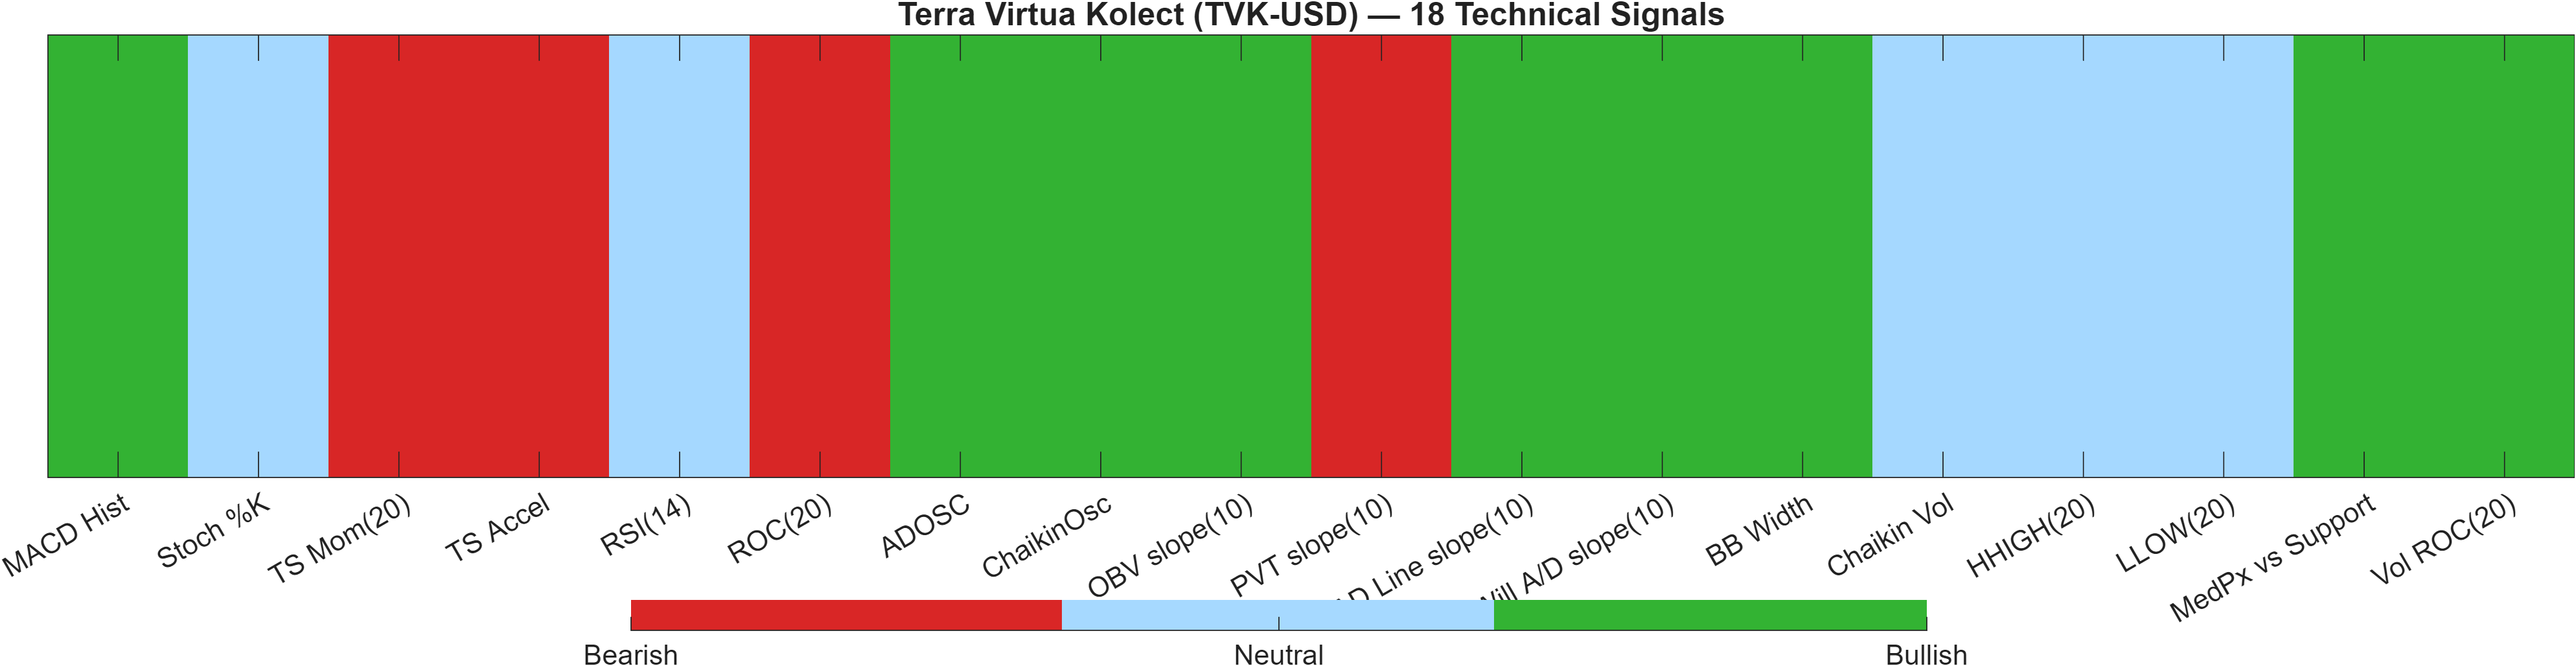
The technical dashboard highlights a neutral aggregate built from internally mixed components rather than a single dominant factor. The 18-signal confluence is 0.278 (Neutral) and the blended overall technical score is 0.123 (Neutral). Beneath that, the score composition (Bull 9 / Bear 4 / Neutral 5) implies that a meaningful number of indicators are constructive, but their strength is not cohesive enough to override the broader technical ranking model.
That tension is reflected in the Deep Reinforcement Learning technical rank: #495 out of 800 with a -0.238 score, also labeled neutral but positioned in the weaker half of the universe. When the signal basket leans bullish while the AI ranking remains relatively weak, it often indicates early improvement without regime confirmation—conditions where indicators can turn first, but price structure and persistence have not yet validated a higher-probability trend state.
Signal table (Bull/Bear/Neutral)
| Indicator | Value | Signal |
|---|---|---|
| MACD Hist | 3.909e-06 | Bullish |
| Stoch %K | 48.2 | Neutral |
| TS Mom(20) | -0.0003994 | Bearish |
| TS Accel | -0.0008985 | Bearish |
| RSI(14) | 45.57 | Neutral |
| ROC(20) | -7.261 | Bearish |
| ADOSC | 29.82 | Bullish |
| ChaikinOsc | 1.256e+08 | Bullish |
| OBV slope(10) | 3.687e+06 | Bullish |
| PVT slope(10) | -8.75e+05 | Bearish |
| AD Line slope(10) | 3.829e+08 | Bullish |
| Will A/D slope(10) | 0.001352 | Bullish |
| BB Width | 0.1525 | Bullish |
| Chaikin Vol | -5.544 | Neutral |
| HHIGH(20) | 0.0061 | Neutral |
| LLOW(20) | 0.004545 | Neutral |
| MedPx vs Support | 0.000476 | Bullish |
| Vol ROC(20) | 45.51 | Bullish |
The indicator mix itself shows the internal push-pull: volume/accumulation proxies are largely constructive (e.g., ADOSC bullish; OBV slope(10) bullish), while several return and time-series momentum measures remain bearish (ROC(20) -7.261, TS Accel -0.0008985). This is consistent with a market that may be seeing selective participation improvement, but has not yet converted that into sustained upside impulse. In such cases, breakouts through well-defined resistance tend to be more reliable when they occur alongside continued confirmation from these participation measures.
6) News sentiment + extractive gist
Note: Instrument-specific news matches were not found, so the digest reflects broader crypto/sector coverage. Not available in the provided data: KGNAI AI News Sentiment Score (normalized -1 to +1) and its timestamped label details.
Sentiment score (avg): 0.013 | Positive: 6% | Neutral: 94% | Negative: 0%
KGNAI AI News Sentiment Score (normalized -1 to +1): Not available (as of —) | Label: Not available | Overall news score: 0.01
Positive Developments
Recent coverage across major financial outlets indicates a generally steady tone for the sector, with most items reading as context-setting rather than directional catalysts. The sentiment distribution supports that interpretation: 94% of classified items are neutral, while positive coverage is limited (6%) and negatives are not present in the scored set (0%). In practical market-structure terms, that mix can reduce the probability of headline-driven dislocations for smaller assets, placing more weight on technical levels and liquidity conditions. For TVK-USD specifically—where ranks are mixed across horizons (notably #12 monthly versus #315 weekly)—a neutral macro news backdrop can allow relative-strength signals to express through price action if they receive confirmation via volume and level breaks, rather than being overridden by sudden risk-off narrative shocks.
Neutral / Mixed Developments
The overall news score of 0.01 and average sentiment of 0.013 sit near flat, aligning with a “monitoring” environment rather than a catalyst-rich one. When sector commentary is predominantly informational, markets often revert to technical drivers—trend regime (e.g., close below MA50 and MA50 below MA200) and volatility state (e.g., bandwidth 0.1525)—as the primary decision variables. This neutral informational flow is consistent with the dashboard’s Neutral technical label and suggests that price may respond more to local liquidity/participation than to narrative momentum.
Negative / Risk Signals
Even with 0% negative items in the scored set, risk should be framed through the technical and volatility context. TVK-USD’s trend posture is currently bearish by moving-average interpretation, which can amplify downside sensitivity if price slips under defined support. With support near 0.0046, a close below that zone would align technical deterioration with a market backdrop that lacks strong positive sentiment tailwinds. Additionally, an active volatility regime (0.1525 bandwidth) can widen intraday swings, increasing the chance of stop-driven moves and false breaks. In this configuration, the primary “risk signal” is less about headlines and more about whether participation-led bullish readings can offset return/momentum weakness (e.g., ROC(20) -7.261) before the market tests and potentially fails support.
- What to monitor next: Acceptance above 0.0065 alongside supportive volume/flow indicators.
- What to monitor next: Whether RSI(14) 45.57 trends upward during resistance tests (momentum confirmation).
- What to monitor next: Any daily closes below 0.0046 in an elevated-volatility backdrop (0.1525).
Sources referenced: Reuters, Bloomberg, Yahoo Finance, MarketWatch, Investing.com
7) Sources
Not available in the provided data.
You may also like: How KGNAI AI ranks instruments across global markets
Disclaimer: KGNAI provides AI-generated analytics and educational market commentary only. This is not financial advice. Markets involve risk. Always do your own research.