
Electric Cash (ELCASH-USD) — 22-Apr-2026 Neutral Ranks with Bearish Technical Tilt
Electric Cash (ELCASH-USD) is currently positioned in the middle of KGNAI’s 800-instrument crypto universe, with Neutral ranks across daily, weekly, monthly, and 3-month horizons. That comparative placement suggests neither persistent leadership nor clear underperformance risk relative to peers, but the technical layer adds nuance: the blended technical view is Bearish even as the 18-signal confluence is Neutral. Price structure also shows a mixed regime, with the close trading below the MA50 (bearish near-term posture) while MA50 remains above MA200 (a supportive longer-duration backdrop). Momentum readings lean defensive—RSI(14) at 20.4 and a near-flat MACD histogram—and volatility appears compressed with Bollinger bandwidth at 0.0158. Key decision zones remain tight: support ~0.0473 and resistance ~0.0482.
Key Takeaways
- Rank stance: Short Neutral | Mid Neutral | Long Neutral (mid-pack within 800-instrument universe)
- Technical confluence: Neutral on 18-signal score (−0.056), but Bearish on blended technical score (−0.309)
- Key levels: Support 0.0473 | Resistance 0.0482
- News sentiment bias: Slightly positive/mostly neutral mix (avg 0.050; 25% positive, 69% neutral, 6% negative)
- Confirmation / invalidation: A break above 0.0482 with volume supports continuation; a close below 0.0473 increases deterioration risk
What KGNAI Measures
KGNAI evaluates assets using large cross-sectional datasets built from millions of structured data points. Inputs incorporate fundamental metrics, technical structures, and systematically processed news sentiment. Statistical models, machine learning, and AI frameworks are used to assess relative positioning, signal alignment, and probabilistic behavior across broad universes.
How to Read This Report
- Ranks are comparative across the tracked universe, not absolute price targets.
- Confluence reflects alignment among independent signal groups.
- Support/resistance levels are probabilistic decision zones, not guarantees.
- Sentiment provides contextual bias within the broader analytical framework.
1) KGNAI AI Analysis
Region: CRYPTO
Total universe size: 800 ranked instruments
- Daily rank: #470 out of 800 — Neutral
- Weekly rank: #521 out of 800 — Neutral
- Monthly rank: #545 out of 800 — Neutral
- 3-Monthly rank: #478 out of 800 — Neutral
Cross-horizon consistency vs edge quality
ELCASH-USD sits in the middle of the 800-instrument universe across timeframes, with daily rank #470, weekly #521, monthly #545, and 3-month #478. This configuration signals a comparatively stable profile—there is no single horizon exhibiting outsized strength or weakness—but it also implies the market is not currently pricing ELCASH-USD as a persistent leader within the tracked set.
The slightly weaker placement on the weekly and monthly horizons (both worse than the daily and 3-month ranks) can be read as a mild mid-horizon drag. In practical analytical terms, that often aligns with a market that is still working through prior trend damage or lacks a catalyst strong enough to re-rate relative performance. At the same time, the 3-month rank returning to #478 suggests the longer lookback is not materially deteriorating versus the shorter windows—consistent with a market that is stabilizing rather than accelerating into a new downtrend.
The key takeaway is consistency without dominance: rank dispersion is limited, but the entire rank cluster remains in a neutral zone. For positioning, this tends to shift attention away from “rank-led” setups and toward whether technical signals and price structure can produce a higher-quality alignment.
KGNAI ranks each instrument across large universes using multiple proprietary AI tests and statistical models (millions of data points). Lower ranks generally indicate stronger probability of favorable performance behavior, while higher ranks indicate weaker probability and more bearish positioning.
Term view: Short-term: Neutral. Mid-term: Neutral. Long-term: Neutral.
Want the full universe and complete rank tables? Unlock full access on KGNAI: https://www.kgnai.com/pricing
2) Price & trend overview
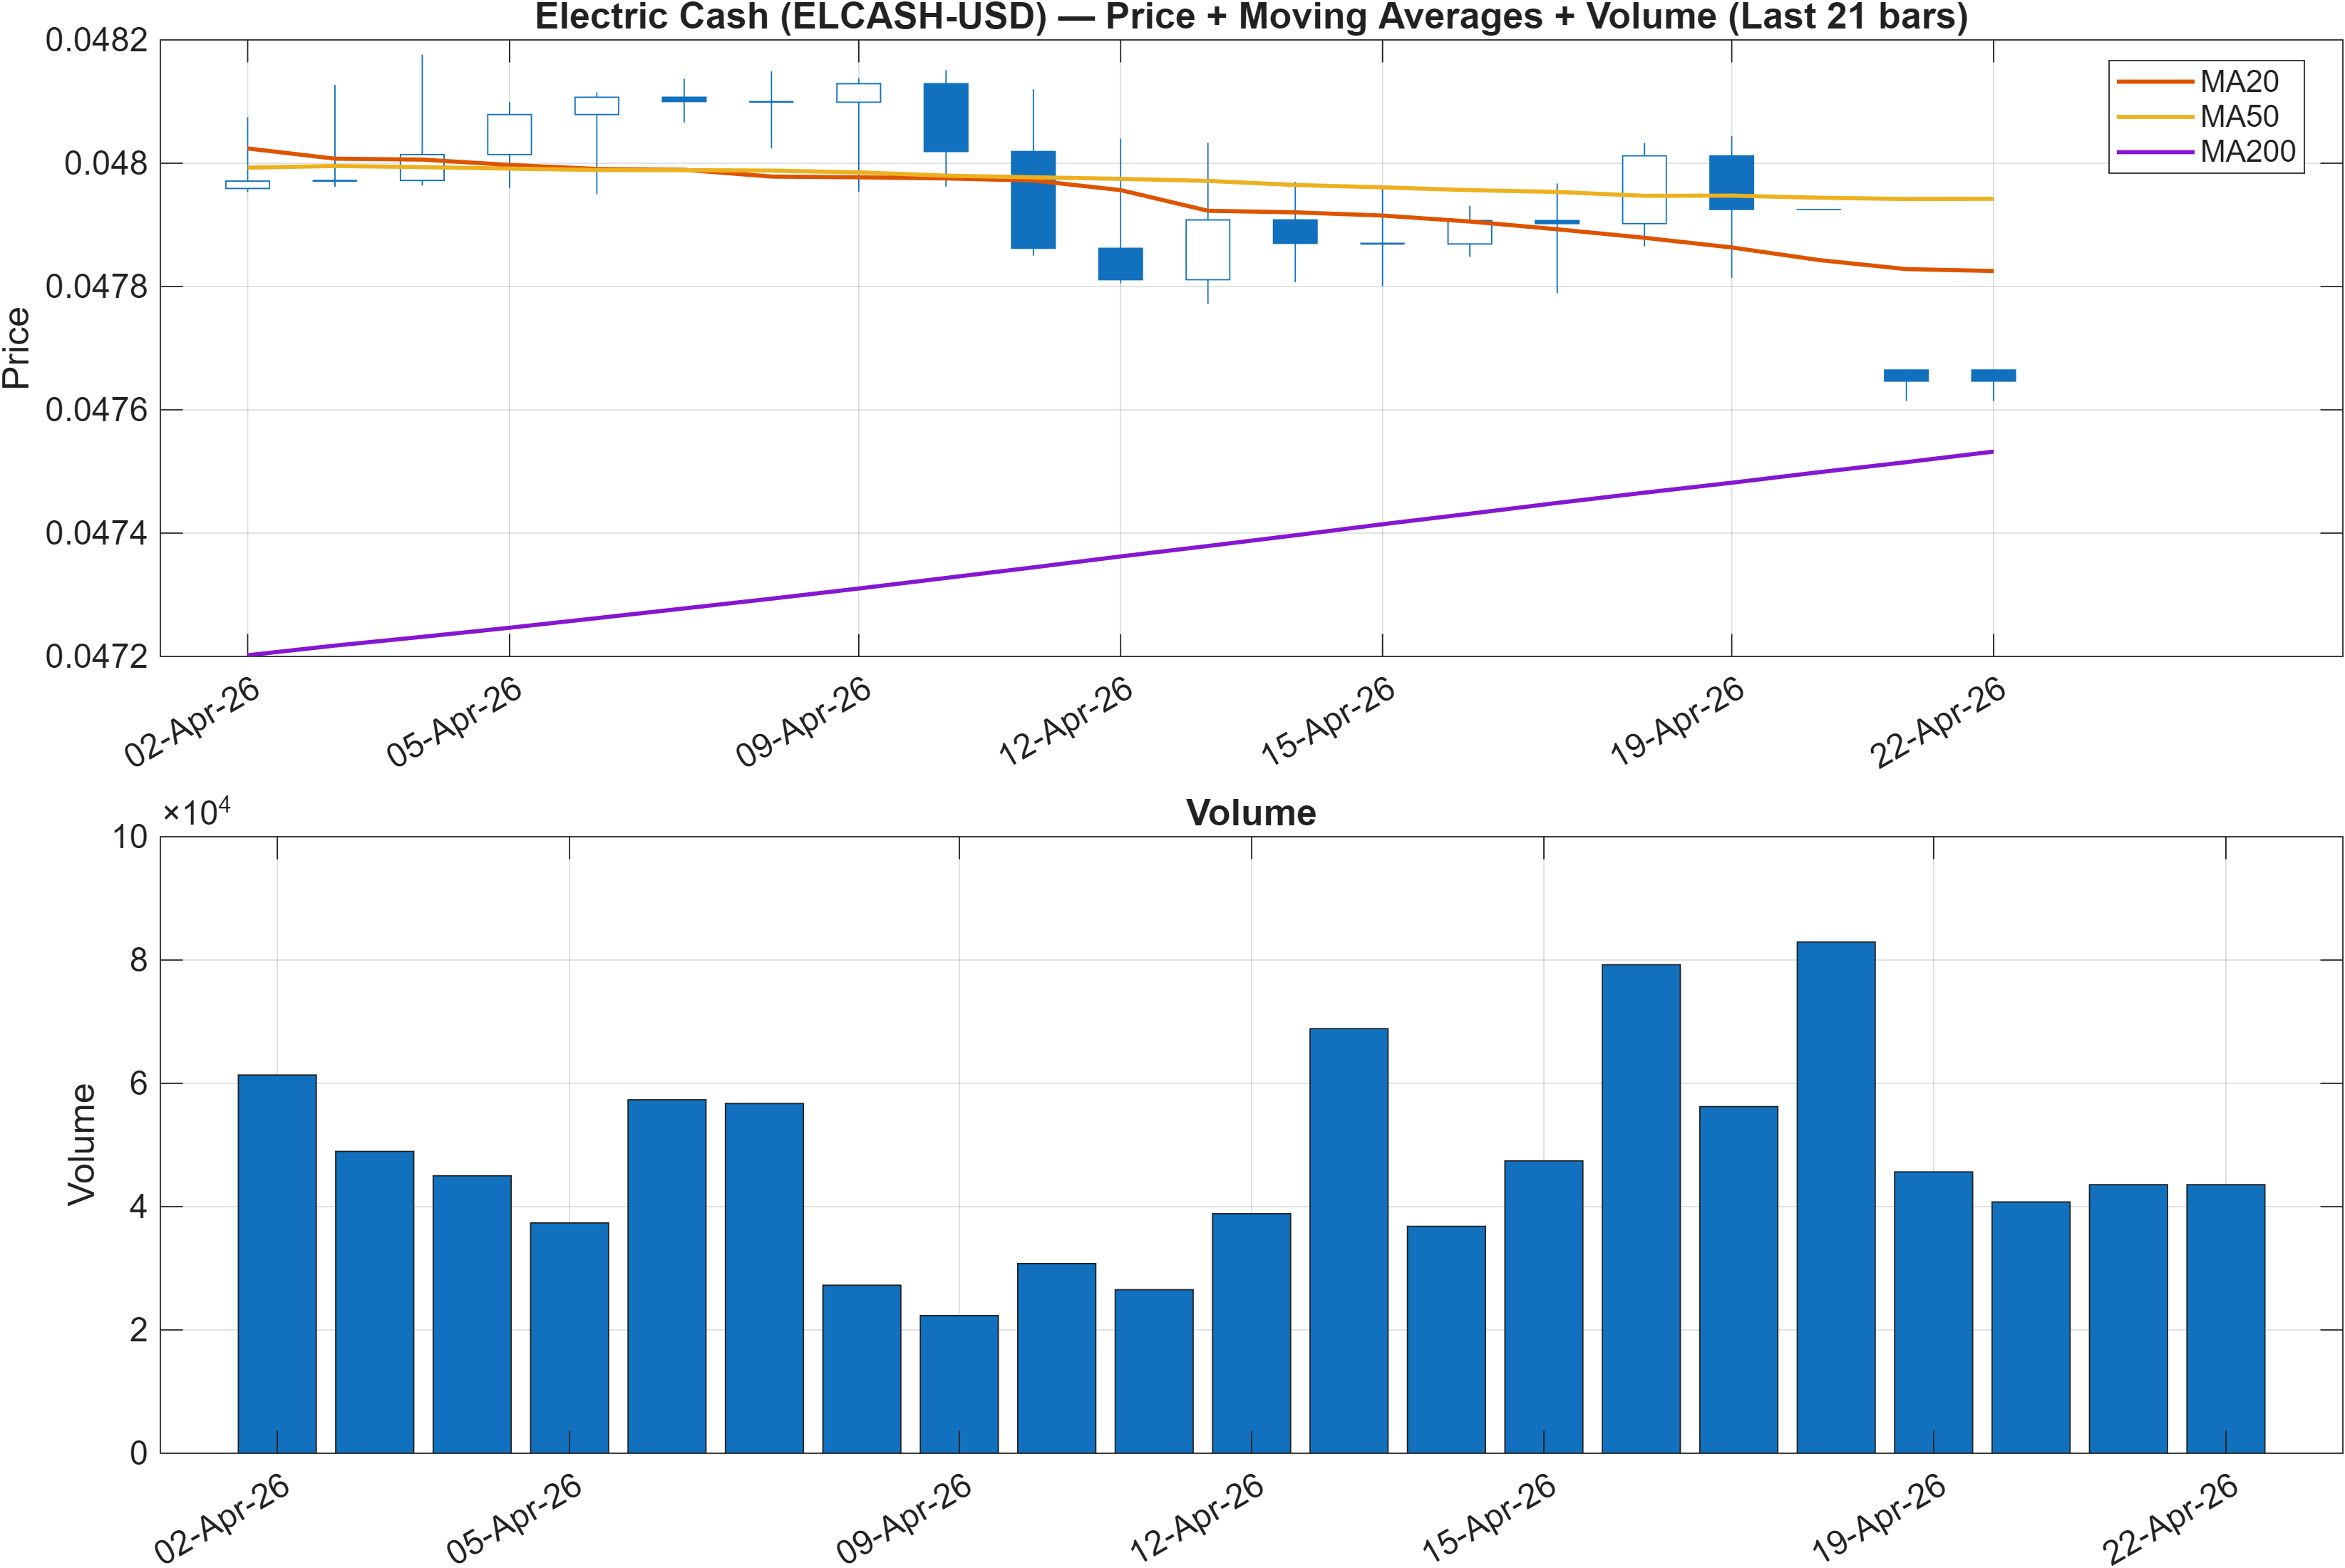
Timeframe split: short-term pressure vs longer-term structure
Price trend signals are explicitly mixed: Close vs MA50 = Bearish, while MA50 vs MA200 = Bullish. This combination is often observed in a pullback phase where near-term price action is soft, but the longer-duration moving-average structure has not fully rolled over. For ELCASH-USD, that places emphasis on whether weakness remains mean-reverting (supporting the bullish MA stack) or whether the pullback deepens enough to threaten the longer-term regime.
This mixed regime is consistent with the rank profile: neutral comparative standing paired with a market that is not producing clean trend confirmation. In these conditions, subsequent technical evidence—momentum and volatility—matters more than any single moving-average relationship, because small shifts in participation can rapidly flip signals when the market is already near an inflection zone.
The nearby support/resistance corridor (support near 0.0473 and resistance near 0.0482) reinforces the idea that the market is currently operating with a relatively tight decision range. When price is below the MA50 while the MA50 remains above the MA200, breakouts tend to require clear volume confirmation; otherwise, rebounds can fail into resistance and revert back toward support.
Interpretation: Close vs MA50 = Bearish, MA50 vs MA200 = Bullish.
3) Momentum & volatility dashboard
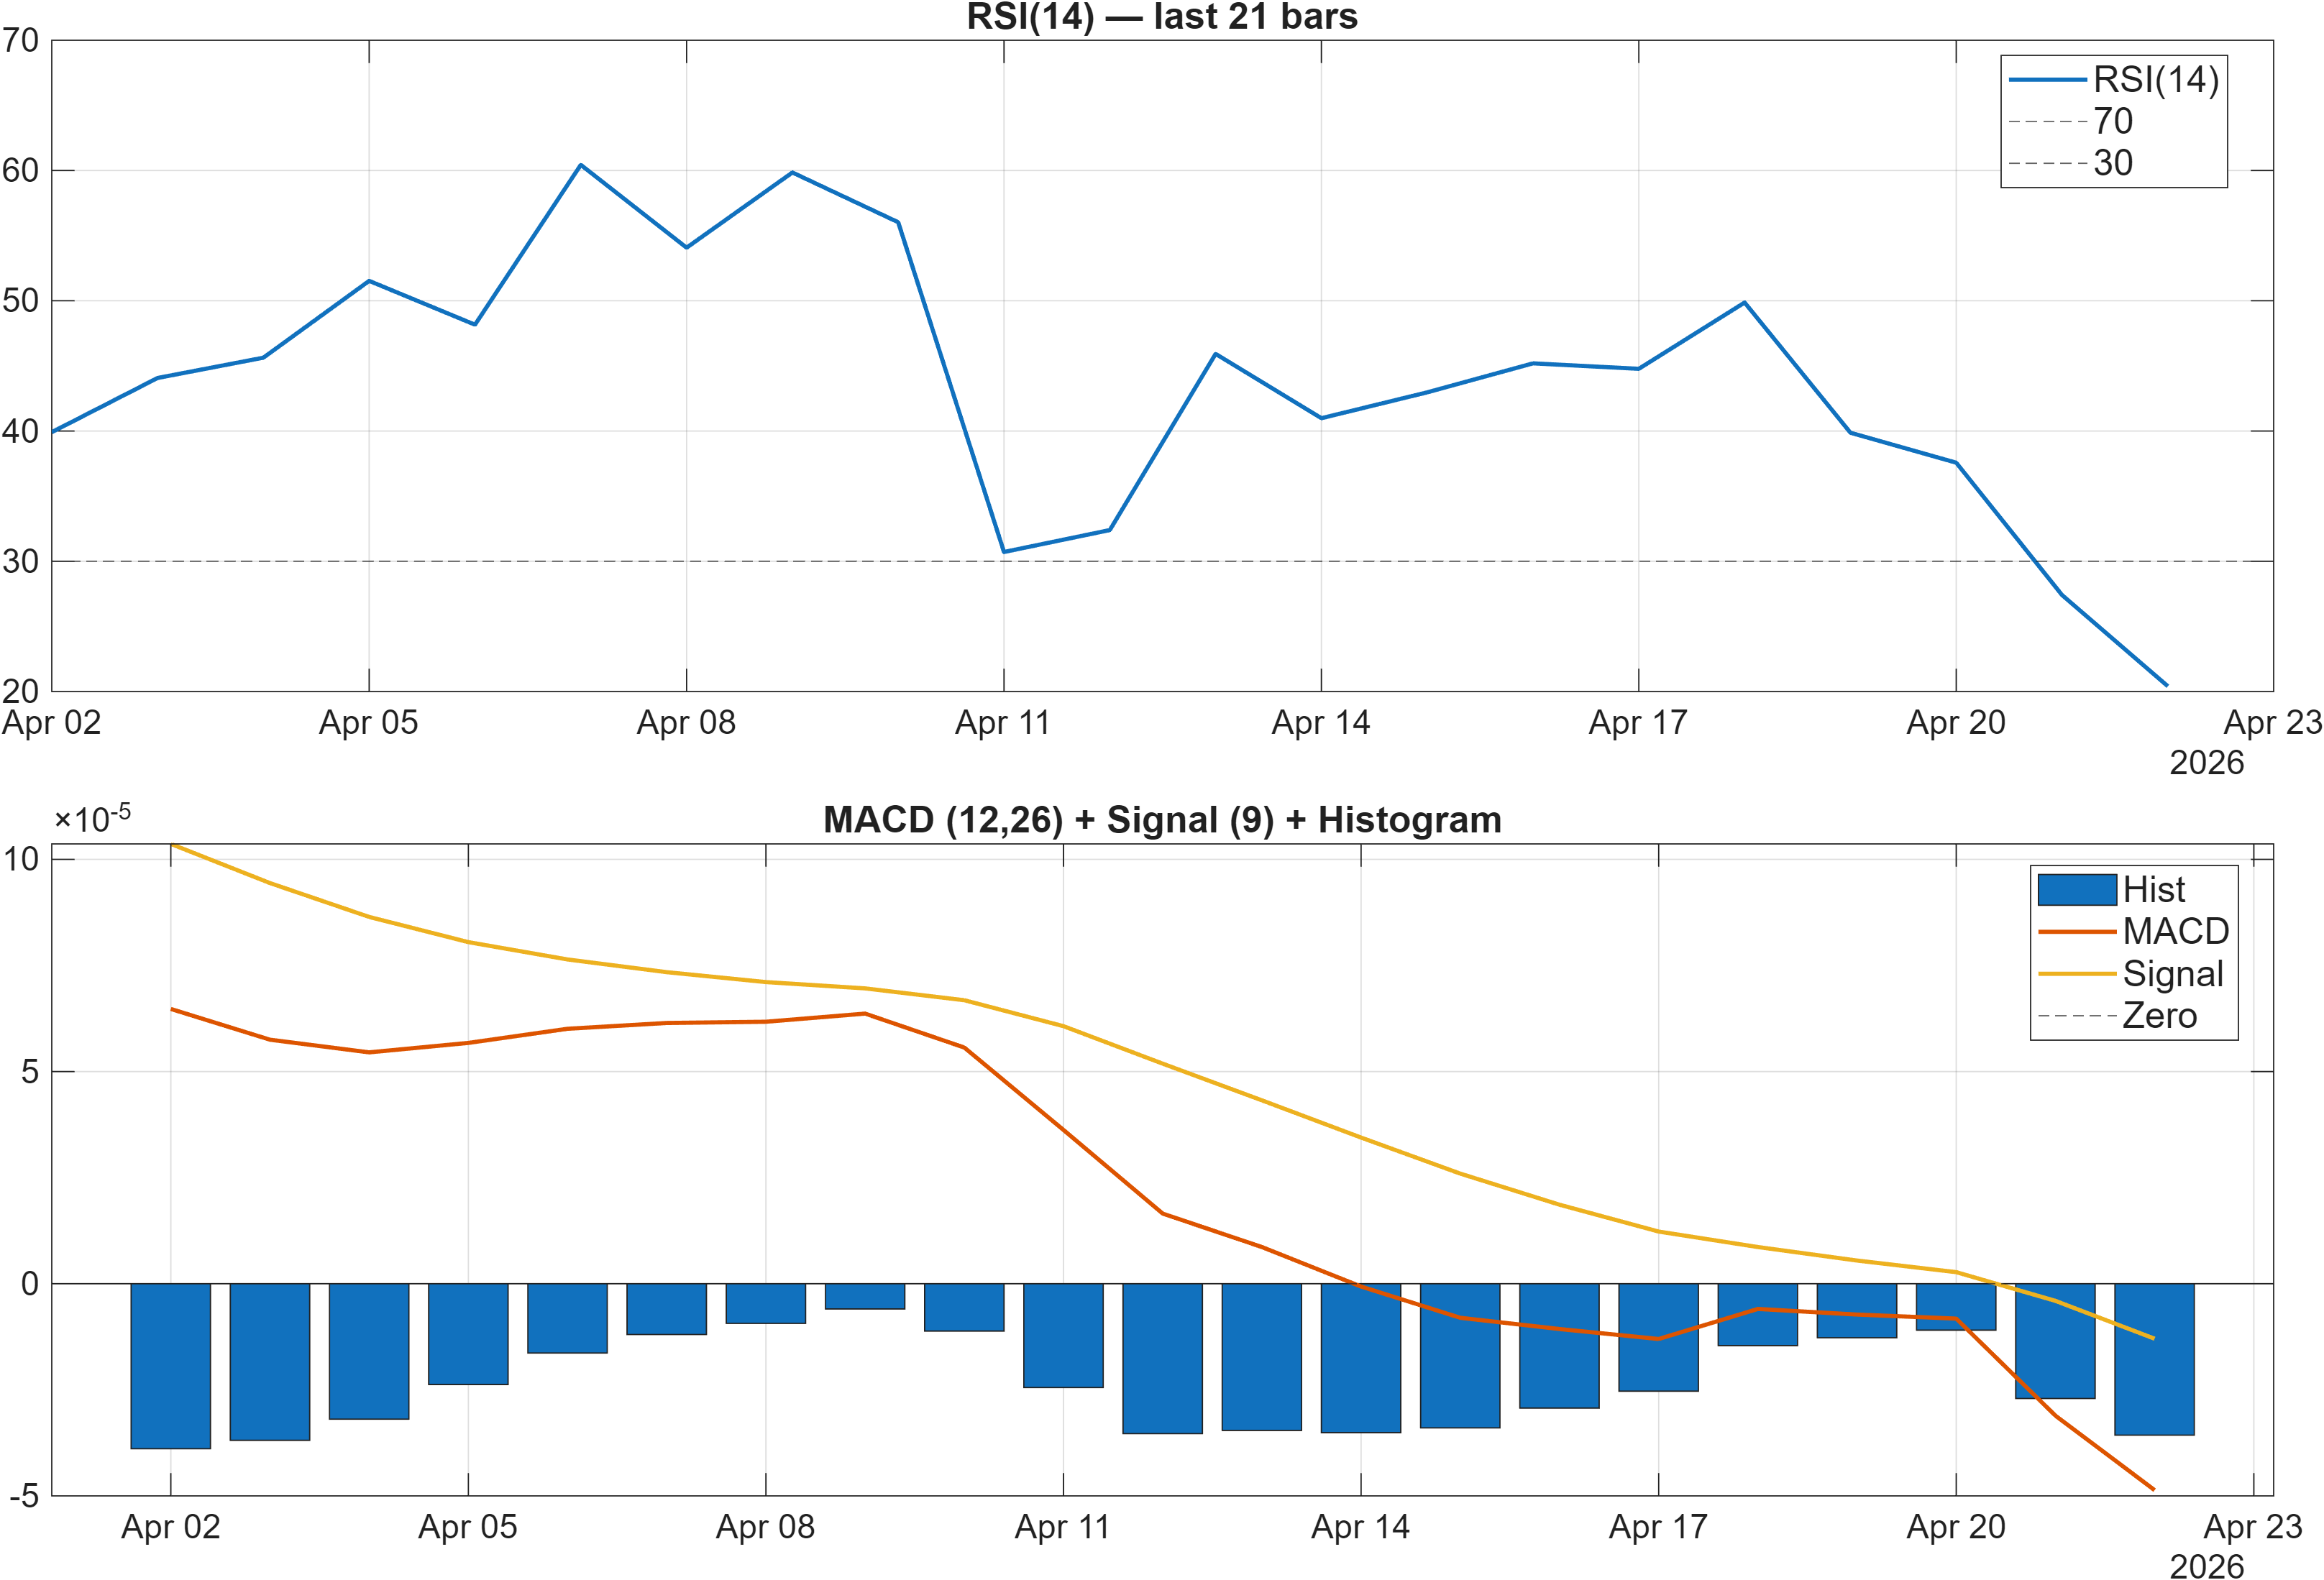
Momentum compression: oversold RSI with a near-flat MACD
Momentum reads defensively. The dashboard flags RSI bias = Bearish, and the signal table places RSI(14) at 20.4 with a bearish label—an oversold-type condition that can coincide with both capitulation lows and prolonged downtrends. In isolation, a low RSI can support mean-reversion narratives; however, its reliability improves when paired with improving trend/momentum confirmation rather than occurring alongside continued negative rate-of-change.
MACD is not yet providing strong directional clarity. The narrative read shows MACD hist = -0.0000, while the signal table prints MACD Hist -3.569e-05 as bearish—effectively near flat but marginally negative. That combination typically reflects weak impulse: selling pressure is present, but not accelerating strongly at this moment. When MACD is close to zero while RSI is deeply depressed, the market is often in a “decision” state where small changes in flow can shift the short-term tone.
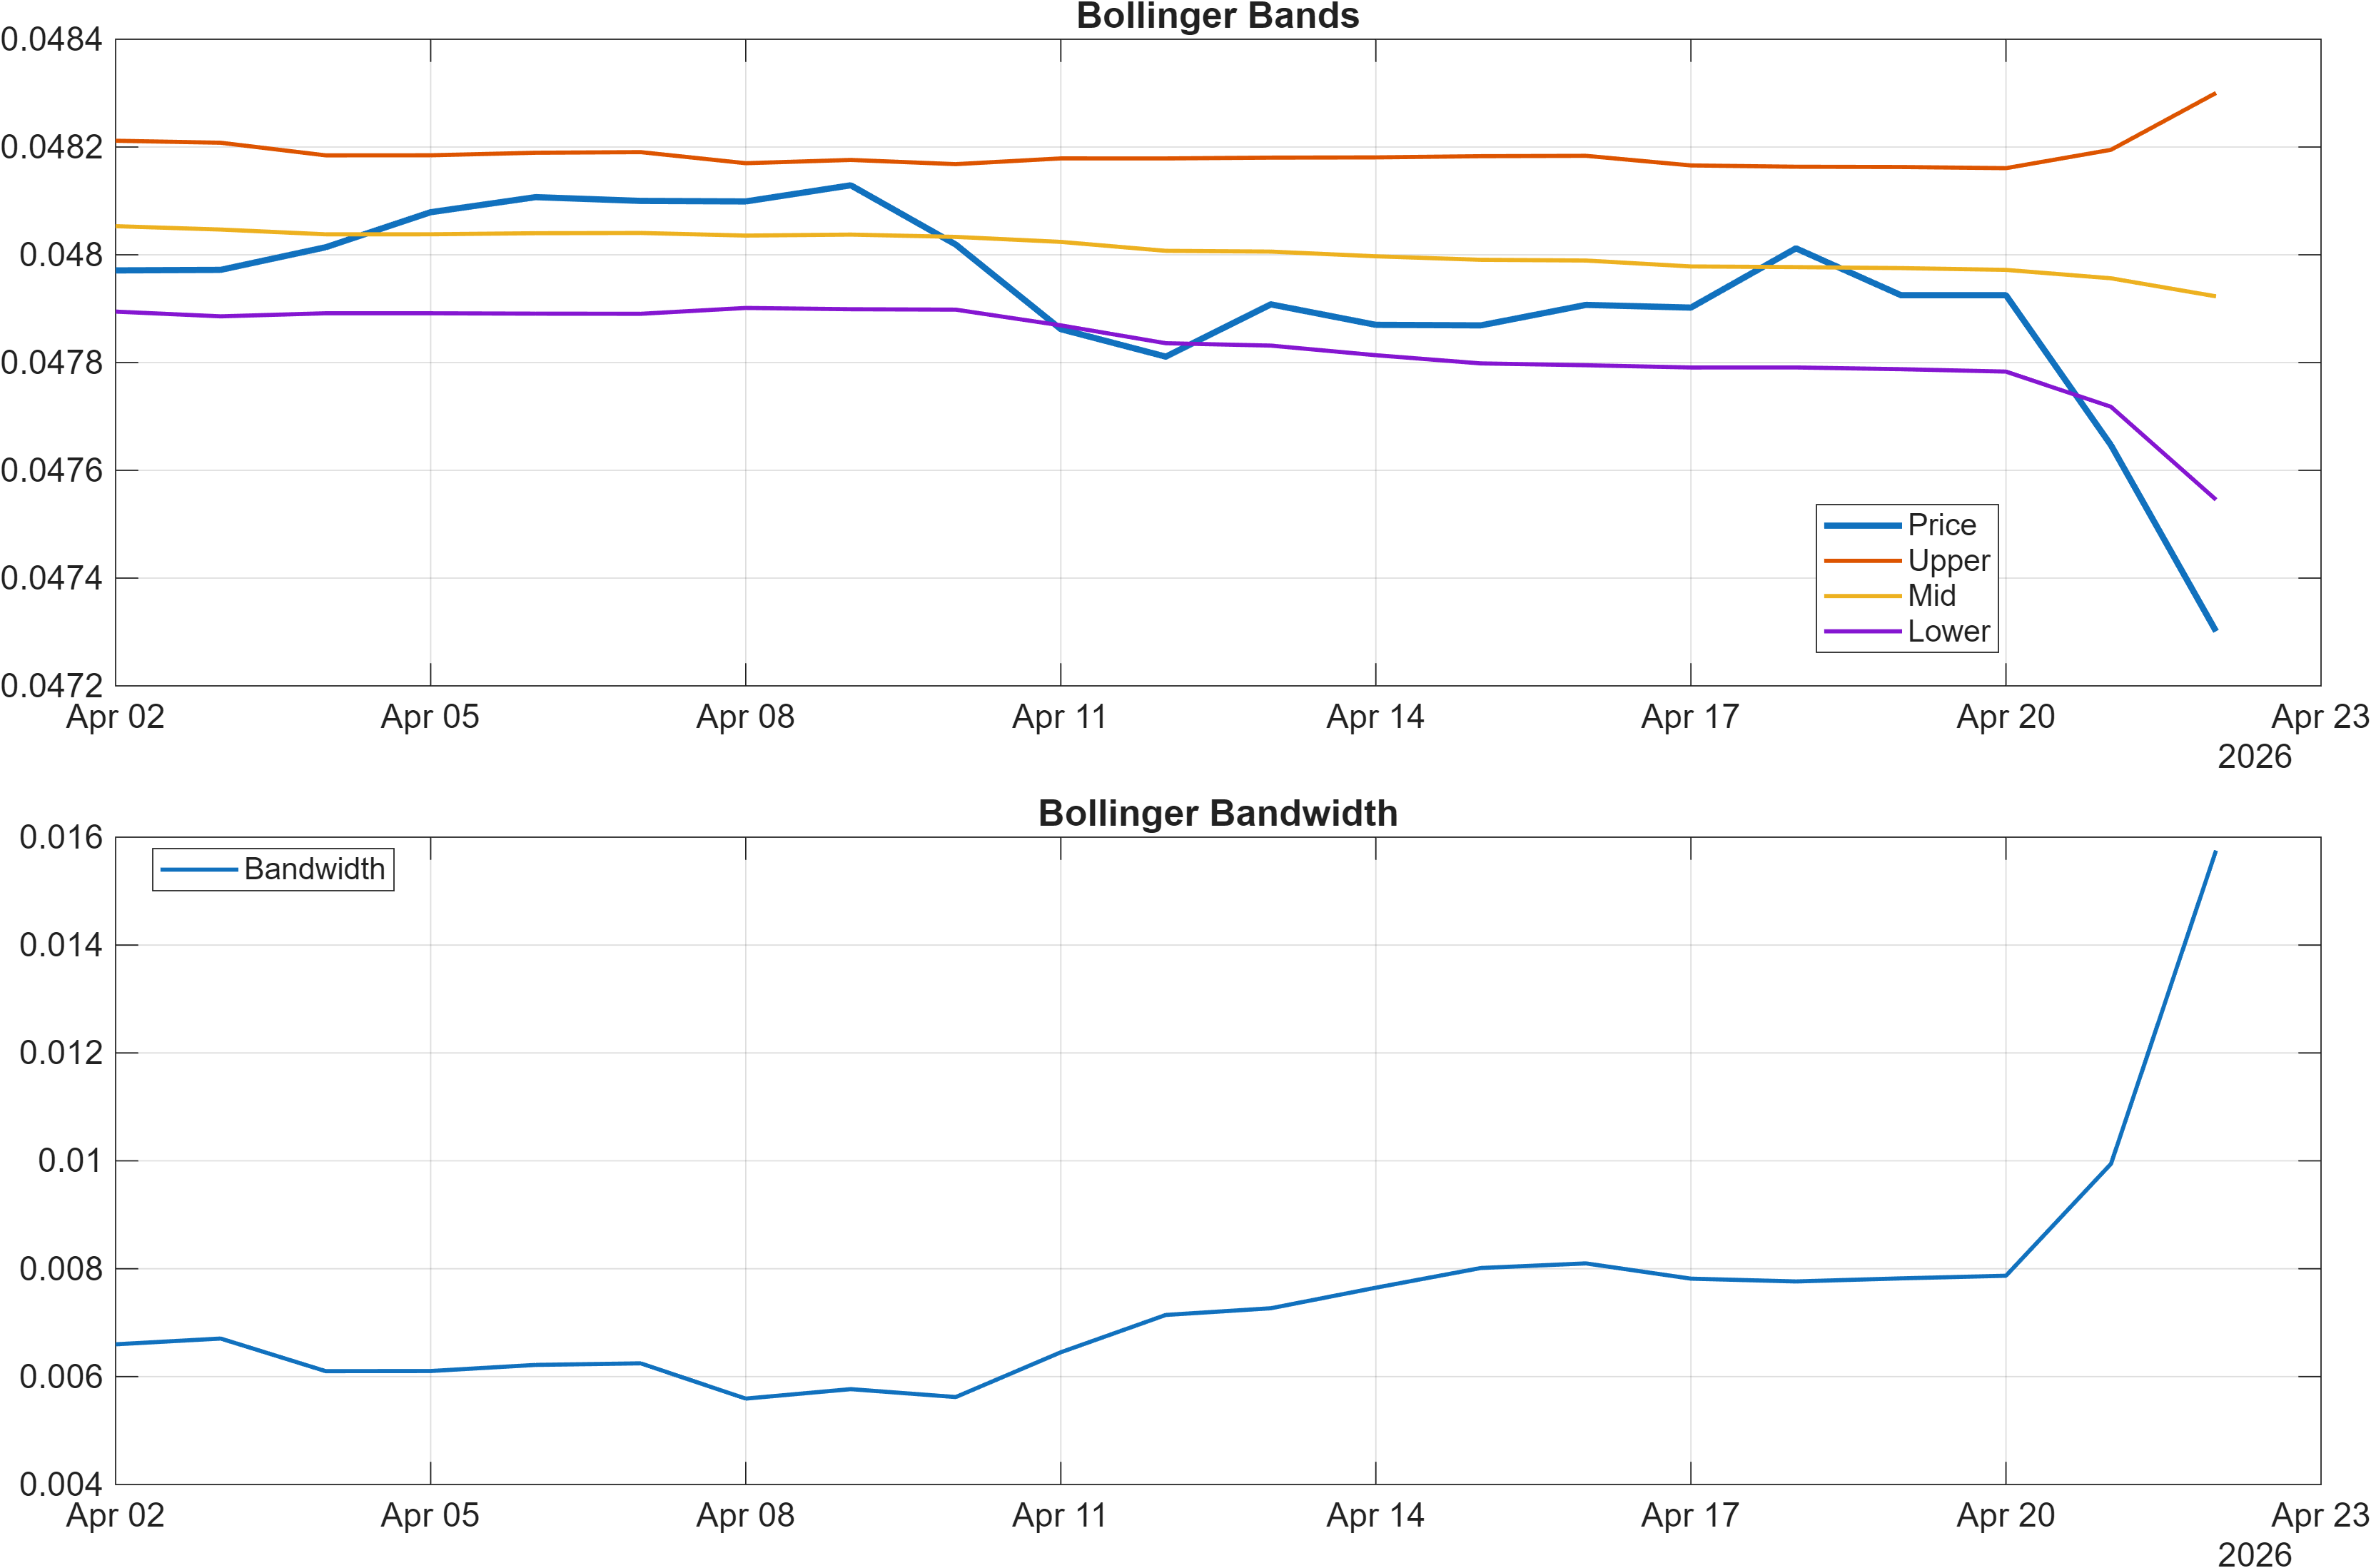
Volatility regime: tight bands increase sensitivity to breaks
Volatility is compressed: Bollinger bandwidth latest = 0.0158 (table: BB Width 0.01575, neutral). Low bandwidth conditions can persist, but they also increase sensitivity to level breaks—particularly around well-defined support/resistance. With ranks neutral (e.g., daily #470) and trend mixed, the volatility regime becomes a key context input: a breakout attempt into 0.0482 may carry more signal value than it would in a high-volatility environment.
Interpretation: RSI bias = Bearish, MACD hist = -0.0000.
Interpretation: Bandwidth (volatility regime) latest = 0.0158.
4) Support / Resistance zones
Support ~ 0.0473 | Resistance ~ 0.0482
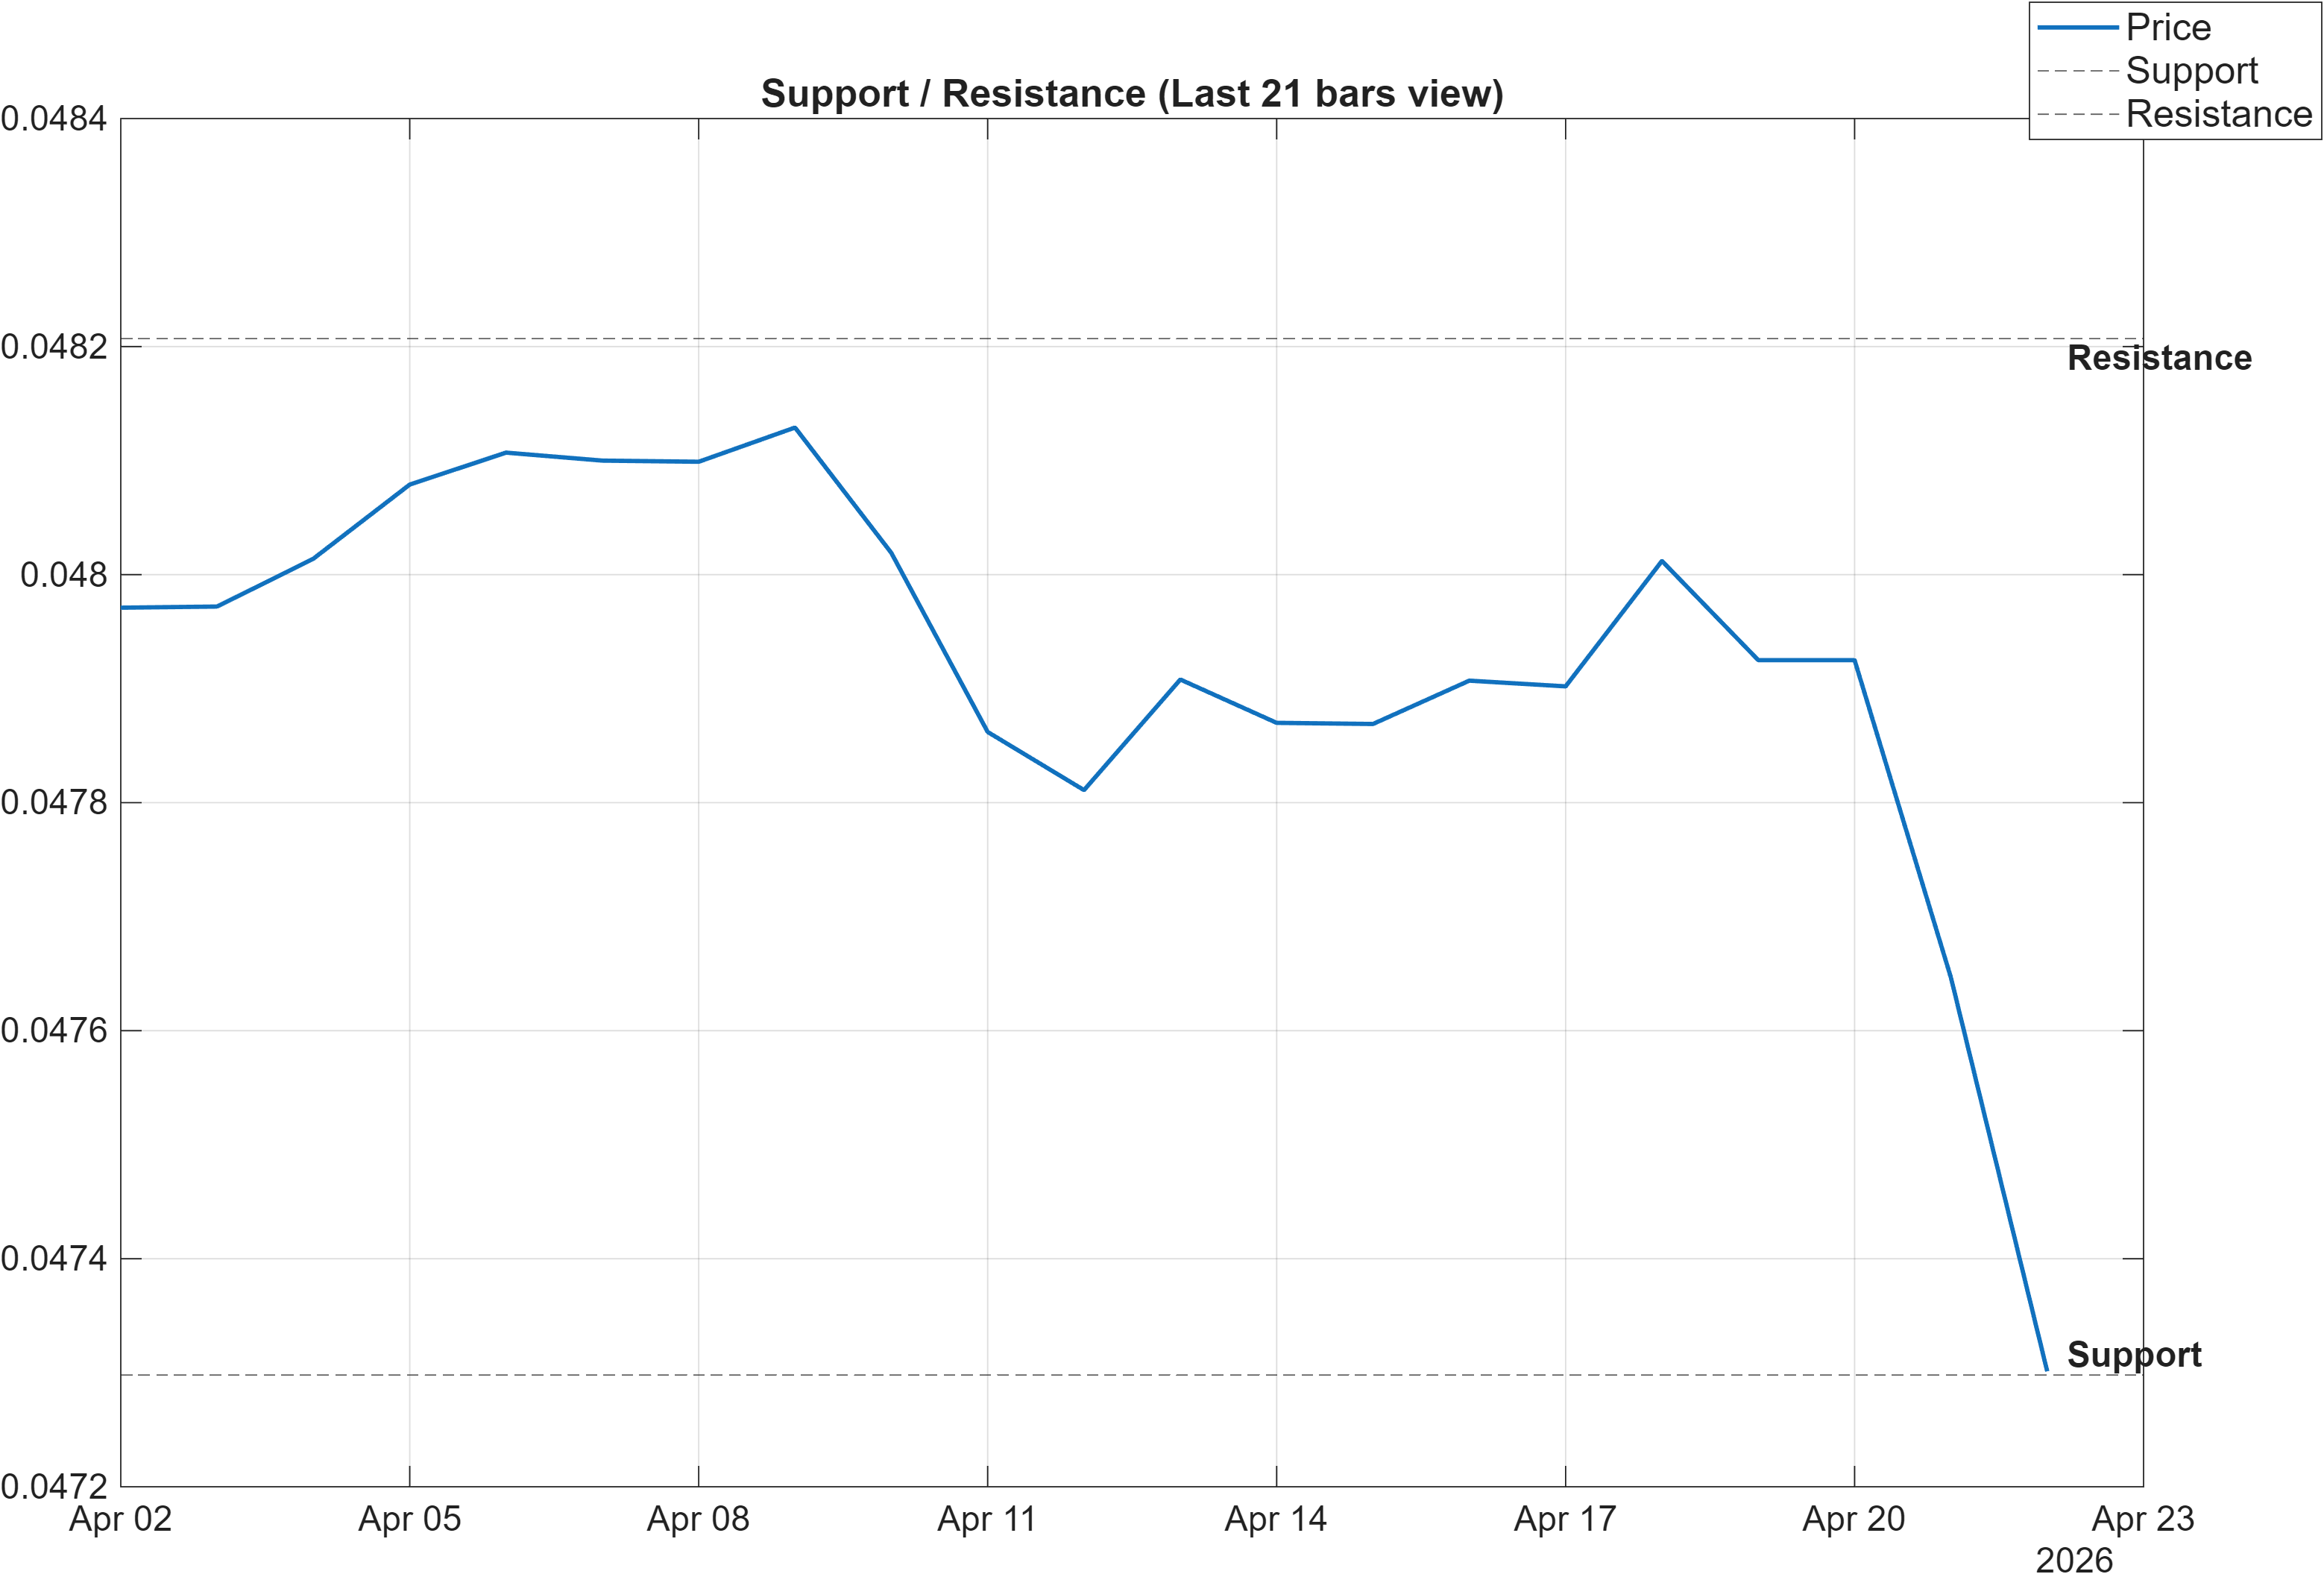
Tight level structure and conditional path dependence
The actionable map for ELCASH-USD is defined by a narrow band: 0.0473 as support and 0.0482 as resistance. In a compressed volatility regime (bandwidth 0.0158), tight levels often matter more than usual because price can transition from range behavior to directional behavior quickly once a boundary is violated.
This is also where the mixed moving-average posture becomes operational. With the close currently below the MA50, any move toward resistance should be assessed for acceptance (sustained trade) rather than mere intrusion. Conversely, a loss of support can carry disproportionate informational value because RSI is already depressed (20.4)—meaning the market would be extending weakness from an already stressed momentum condition rather than “resetting” from a neutral state.
Internal indicator structure provides additional context for these zones. The 20-day high marker HHIGH(20) 0.04818 is labeled neutral and sits essentially on top of the stated resistance area, reinforcing it as a reference point where supply has recently asserted. Meanwhile, the signal table’s LLOW(20) 0.04761 is labeled bearish, suggesting recent lows have not yet translated into a stable floor. Taken together, the zone structure argues for disciplined interpretation: the market is near thresholds where confirmation requires volume, and deterioration risk increases with a firm break under support.
Scenario view: Break above resistance with volume → continuation. Close below support → signal deterioration risk.
5) Quant Technical Dashboard (18 Signals)
KGNAI AI Technical Analysis Score (Deep Reinforcement Learning): Rank #760 out of 800 (Rank 1 represents the strongest technical positioning and a higher probability of favorable price behavior. As ranks increase toward the maximum, the probability of favorable outcomes weakens and bearish positioning becomes more dominant.) | Label: Bearish | Score: -0.900
18-Signal Technical Confluence Score: -0.056 (Neutral)
Overall Technical Score (18-signal confluence + DRL rank blend): -0.309 (Bearish)
Note: The blended score reflects signal strength weighted against broader AI technical ranking, which may temporarily diverge.
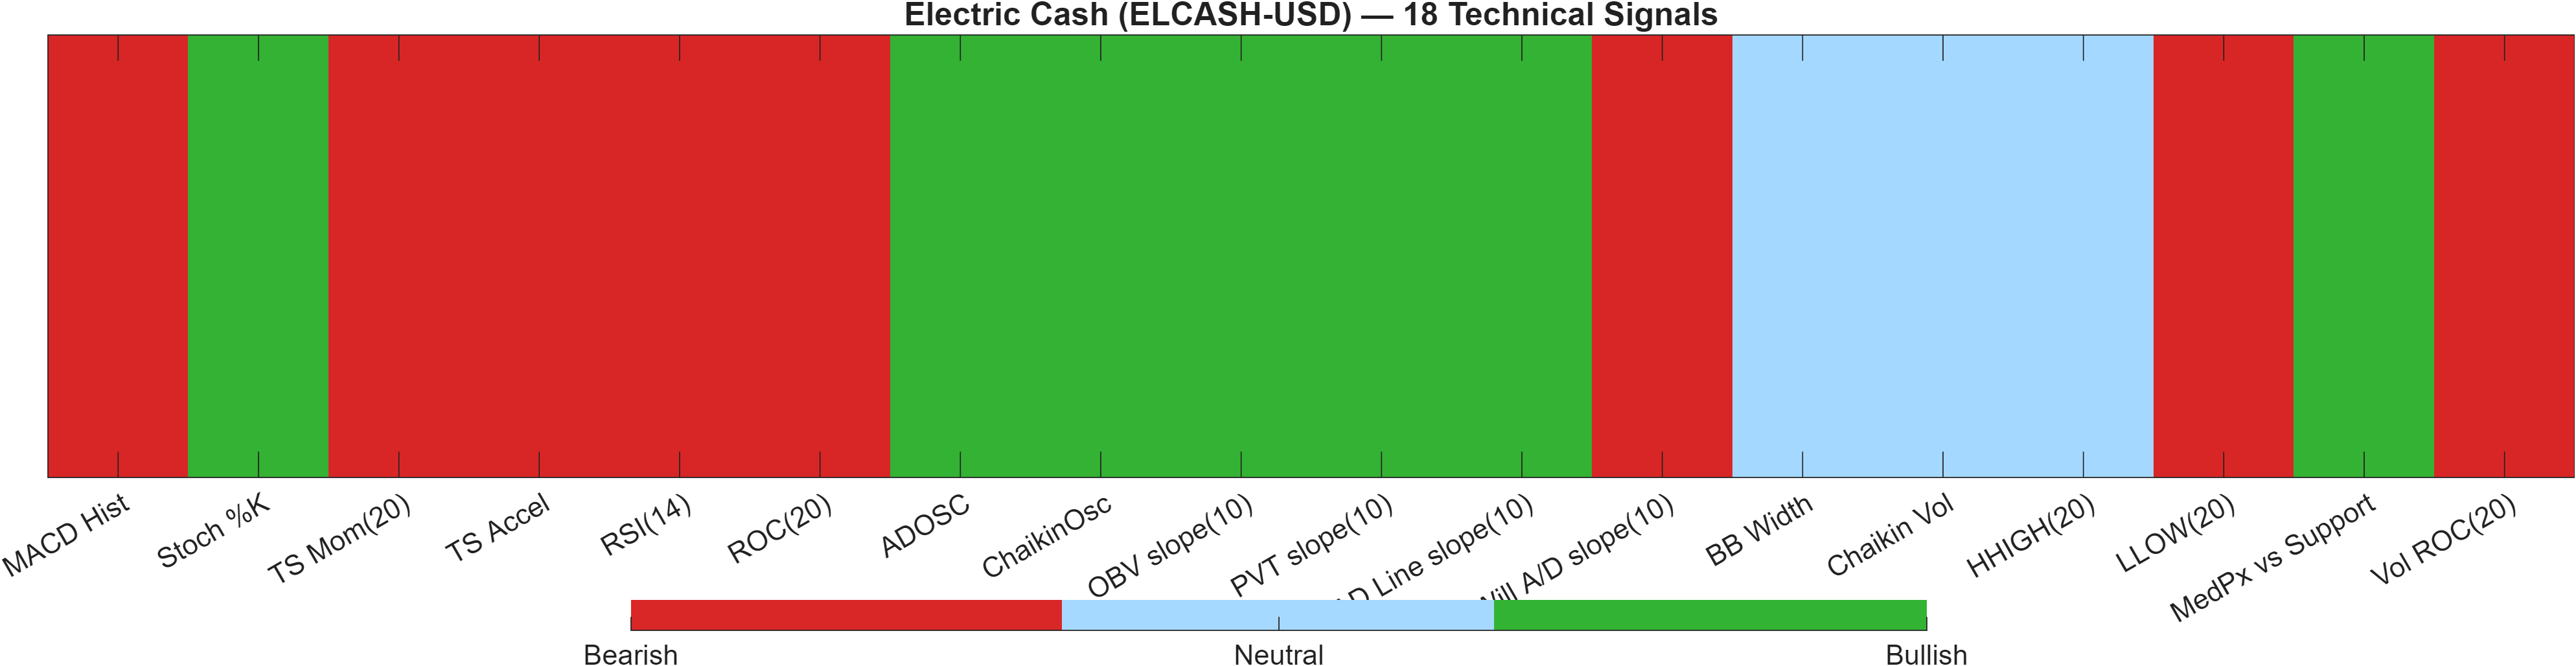
Blended technical score breakdown: -0.309 (Bearish | Bull 7 / Bear 8 / Neutral 3)
Confluence vs model rank: why a neutral dashboard can still resolve bearish
The technical layer is defined by a divergence between signal confluence and the broader AI technical rank model. On one hand, the 18-signal confluence score is -0.056, labeled Neutral. On the other, the deep reinforcement learning (DRL) technical rank is #760 out of 800 with a Bearish label and score -0.900. The blended overall technical score lands at -0.309 (bearish).
The breakdown (Bull 7 / Bear 8 / Neutral 3) highlights a market where indicators are not unanimously negative; rather, bears hold a slight majority, and the model layer penalizes the setup further. That internal composition matters: several flow/accumulation-type inputs are bullish (e.g., OBV slope(10) 1375 and ADOSC 32.74), which can be consistent with intermittent bid support. However, the momentum complex remains pressured—ROC(20) -1.398, TS Mom(20) -0.0003254, and RSI(14) 20.4 are all bearish—suggesting that any supportive flow has not yet translated into positive price impulse.
In practice, this configuration often resolves through level acceptance: a recovery that reclaims resistance (0.0482) can allow bullish sub-signals to “matter,” while continued inability to do so leaves the bearish momentum stack in control.
Signal table (Bull/Bear/Neutral)
| Indicator | Value | Signal |
|---|---|---|
| MACD Hist | -3.569e-05 | Bearish |
| Stoch %K | 7.579 | Bullish |
| TS Mom(20) | -0.0003254 | Bearish |
| TS Accel | -0.0001064 | Bearish |
| RSI(14) | 20.4 | Bearish |
| ROC(20) | -1.398 | Bearish |
| ADOSC | 32.74 | Bullish |
| ChaikinOsc | 3.717e+04 | Bullish |
| OBV slope(10) | 1375 | Bullish |
| PVT slope(10) | 21.23 | Bullish |
| AD Line slope(10) | 1.185e+05 | Bullish |
| Will A/D slope(10) | -0.0003124 | Bearish |
| BB Width | 0.01575 | Neutral |
| Chaikin Vol | -43.49 | Neutral |
| HHIGH(20) | 0.04818 | Neutral |
| LLOW(20) | 0.04761 | Bearish |
| MedPx vs Support | 0.0003421 | Bullish |
| Vol ROC(20) | -11.02 | Bearish |
Interpretation: Indicator-level signals form the base confluence, which is then adjusted using a separate AI-driven technical ranking model. The final technical score summarizes this combined view.
6) News sentiment + extractive gist
Note: Instrument-specific news matches were not found, so the digest includes broader market/sector headlines. Links are provided for verification.
Sentiment score (avg): 0.050 | Positive: 25% | Neutral: 69% | Negative: 6%
KGNAI AI News Sentiment Score (normalized -1 to +1): Not available (as of —) | Label: Not available | Overall news score: 0.05
Positive Developments
Recent coverage across major financial outlets indicates a constructive backdrop for broader crypto risk appetite, with market discussion leaning toward continuation narratives in large-cap crypto and the ongoing maturation of market infrastructure. In that context, ELCASH-USD’s sentiment mix (avg 0.050) is modestly positive but not exuberant, aligning with an environment where participants appear open to upside follow-through while remaining selective. For a mid-ranked asset (daily rank #470 of 800), that kind of tone can be supportive mainly when technical confirmation is present—particularly when volatility is compressed (bandwidth 0.0158) and breakouts can become self-reinforcing. The positive share (25%) suggests there is enough constructive flow to keep downside narratives from dominating, but the data does not imply a sentiment-driven regime on its own.
Neutral / Mixed Developments
The dominant feature of the digest is neutrality: 69% of items are classified neutral, consistent with “market update” style coverage and incremental developments around venues, products, and regulation rather than single-asset catalysts. For ELCASH-USD specifically, the absence of instrument-specific matches means the sentiment signal functions as sector context rather than direct validation. Neutral-heavy coverage tends to correlate with range-bound behavior unless price structure breaks a key level. With resistance near 0.0482 and support near 0.0473, the news backdrop is best treated as a secondary input that may influence follow-through once a technical trigger occurs.
Negative / Risk Signals
Risk signals are present but limited in magnitude, with negatives at 6%. The more relevant interpretation is not “bearish news,” but the reminder that crypto market microstructure can transmit shocks quickly—especially in low-volatility conditions where positioning may be complacent. In ELCASH-USD’s case, the technical layer already leans bearish on the blended score (-0.309) and the DRL technical rank is weak (#760 of 800). That makes downside sensitivity higher if the market loses support (0.0473) while momentum remains stressed (RSI(14) 20.4). In other words, limited negative sentiment does not remove technical fragility; it simply suggests that deterioration would likely be price-led rather than headline-led.
What to monitor next
- Whether price acceptance develops above 0.0482 while volatility remains compressed (bandwidth 0.0158).
- Momentum stabilization signals: RSI(14) (20.4) improving alongside a firmer MACD histogram (currently near -0.0000).
- Downside invalidation risk: any sustained trade below 0.0473 with weak volume dynamics (Vol ROC(20) -11.02).
Sources referenced: Reuters, Bloomberg, Yahoo Finance, MarketWatch, Investing.com
Snapshot: AI Rank (Short–Mid–Long): Neutral (Neutral–Neutral–Neutral) · Technical Confluence: Neutral · Key Levels: Support ~0.05 | Resistance ~0.05 · News Sentiment: Neutral
7) Sources
- Here’s what happened in crypto today — https://cointelegraph.com/news/what-happened-in-crypto-today?utm_source=rss_feed&utm_medium=rss&utm_campaign=rss_partner_inbound
- Kalshi mulls crypto expansion with perpetual futures launch: Report — https://cointelegraph.com/news/kalshi-eyes-crypto-expansion-with-perpetual-futures-launch-report?utm_source=rss_feed&utm_medium=rss&utm_campaign=rss_partner_inbound
- DoorDash to offer stablecoin payments to users via Tempo blockchain — https://cointelegraph.com/news/doordash-stablecoin-payments-tempo?utm_source=rss_feed&utm_medium=rss&utm_campaign=rss_partner_inbound
- Blockchain.com adds perpetual futures trading to self-custody wallets — https://cointelegraph.com/news/blockchain-com-brings-perpetual-futures-trading-to-self-custody-wallets-via-hyperliquid?utm_source=rss_feed&utm_medium=rss&utm_campaign=rss_partner_inbound
- Bitcoin inflows to Binance fall to 2023 low as BTC bulls set target on $80K — https://cointelegraph.com/news/bitcoin-inflows-to-binance-fall-to-2023-low-as-btc-bulls-set-target-on-dollar80k?utm_source=rss_feed&utm_medium=rss&utm_campaign=rss_partner_inbound
- New York targets Coinbase, Gemini in fresh crackdown on prediction markets — https://cointelegraph.com/news/new-york-sues-coinbase-gemini-unlicensed-markets?utm_source=rss_feed&utm_medium=rss&utm_campaign=rss_partner_inbound
- Nium taps Coinbase to add USDC into global payments network — https://cointelegraph.com/news/nium-taps-coinbase-to-bring-usdc-into-global-payments-cutting-prefunding-costs?utm_source=rss_feed&utm_medium=rss&utm_campaign=rss_partner_inbound
- Bitcoin price rally 'in progress' but upside could be capped at $84K — https://cointelegraph.com/news/bitcoin-price-rally-in-progress-but-upside-could-be-capped-at-84k?utm_source=rss_feed&utm_medium=rss&utm_campaign=rss_partner_inbound
You may also like: How KGNAI AI ranks instruments across global markets
Disclaimer: KGNAI provides AI-generated analytics and educational market commentary only. This is not financial advice. Markets involve risk. Always do your own research.