
Minto (BTCMT-USD) Market Analysis — 27-May-2026 | Neutral ranks with bearish technical tilt
As of 27-May-2026, this KGNAI note for Minto (BTCMT-USD) frames the market using confirmation/invalidation zones rather than point forecasts, with emphasis on how independent signals align (or diverge). Cross-sectional ranks place BTCMT-USD in the upper quartile on the daily horizon (rank #123 of 800), while the weekly and monthly ranks are neutral, indicating improving short-term relative behavior without a fully synchronized multi-horizon shift. Technically, the picture is less constructive: price remains below the MA50 and MA50 below MA200 (both bearish), while momentum readings are mixed—RSI(14) at 44.04 is soft and MACD histogram at -0.0002 suggests weak impulse. Volatility is compressed (bandwidth 0.0092), keeping the next directional resolution highly dependent on behavior around support 0.6544 and resistance 0.6764.
- Rank stance: Short-term Neutral (daily rank #123), mid-term Neutral (weekly #173), long-term Neutral (monthly #315; 3-monthly #490).
- Technical confluence label: Bearish overall (18-signal confluence -0.222 is Neutral, but blended technical score -0.362 is Bearish).
- Key levels: Support ~ 0.6544 | Resistance ~ 0.6764.
- News sentiment bias: Slightly positive-to-neutral (avg 0.037; 19% positive / 75% neutral / 6% negative).
- Confirmation / invalidation: A break above 0.6764 with volume supports continuation; a close below 0.6544 increases deterioration risk.
KGNAI evaluates assets using large cross-sectional datasets built from millions of structured data points. Inputs incorporate fundamental metrics, technical structures, and systematically processed news sentiment. Statistical models, machine learning, and AI frameworks are used to assess relative positioning, signal alignment, and probabilistic behavior across broad universes.
- Ranks are comparative across the tracked universe, not absolute price targets.
- Confluence reflects alignment among independent signal groups.
- Support/resistance levels are probabilistic decision zones, not guarantees.
- Sentiment provides contextual bias within the broader analytical framework.
1) KGNAI AI Analysis
Region: CRYPTO
Total universe size: 800 ranked instruments
- Daily rank: #123 out of 800 — Bullish
- Weekly rank: #173 out of 800 — Neutral
- Monthly rank: #315 out of 800 — Neutral
- 3-Monthly rank: #490 out of 800 — Neutral
Cross-horizon alignment: short-term improvement without broader confirmation
The rank stack shows a timeframe gradient: BTCMT-USD is stronger on the daily horizon (rank #123, a bullish label) but progressively weaker as the horizon extends to weekly (#173), monthly (#315), and 3-monthly (#490). In cross-sectional terms, that pattern is consistent with early-stage relative improvement rather than a fully established regime change.
This is the central tension in the current profile: the short-term rank is constructive, yet the mid-to-long ranks remain neutral and do not corroborate a durable shift. When rank improvements are isolated to the shortest timeframe, follow-through tends to depend on whether technical structure and price behavior can confirm (trend alignment, breakout behavior, and persistence above key levels). Without that confirmation, short-term rank strength can represent mean reversion or brief relative outperformance rather than sustained leadership.
The stated KGNAI term view remains Neutral across short-, mid-, and long-term horizons. Interpreting that alongside the ranks suggests the model is recognizing incremental improvement but not enough to reclassify the broader stance. Practically, that increases the value of monitoring decision zones (not forecasts): whether price can reclaim levels tied to resistance and trend filters, and whether a breakdown below support undermines the daily improvement signal.
Want the full universe and complete rank tables? Unlock full access on KGNAI: https://www.kgnai.com/pricing
2) Price & trend overview
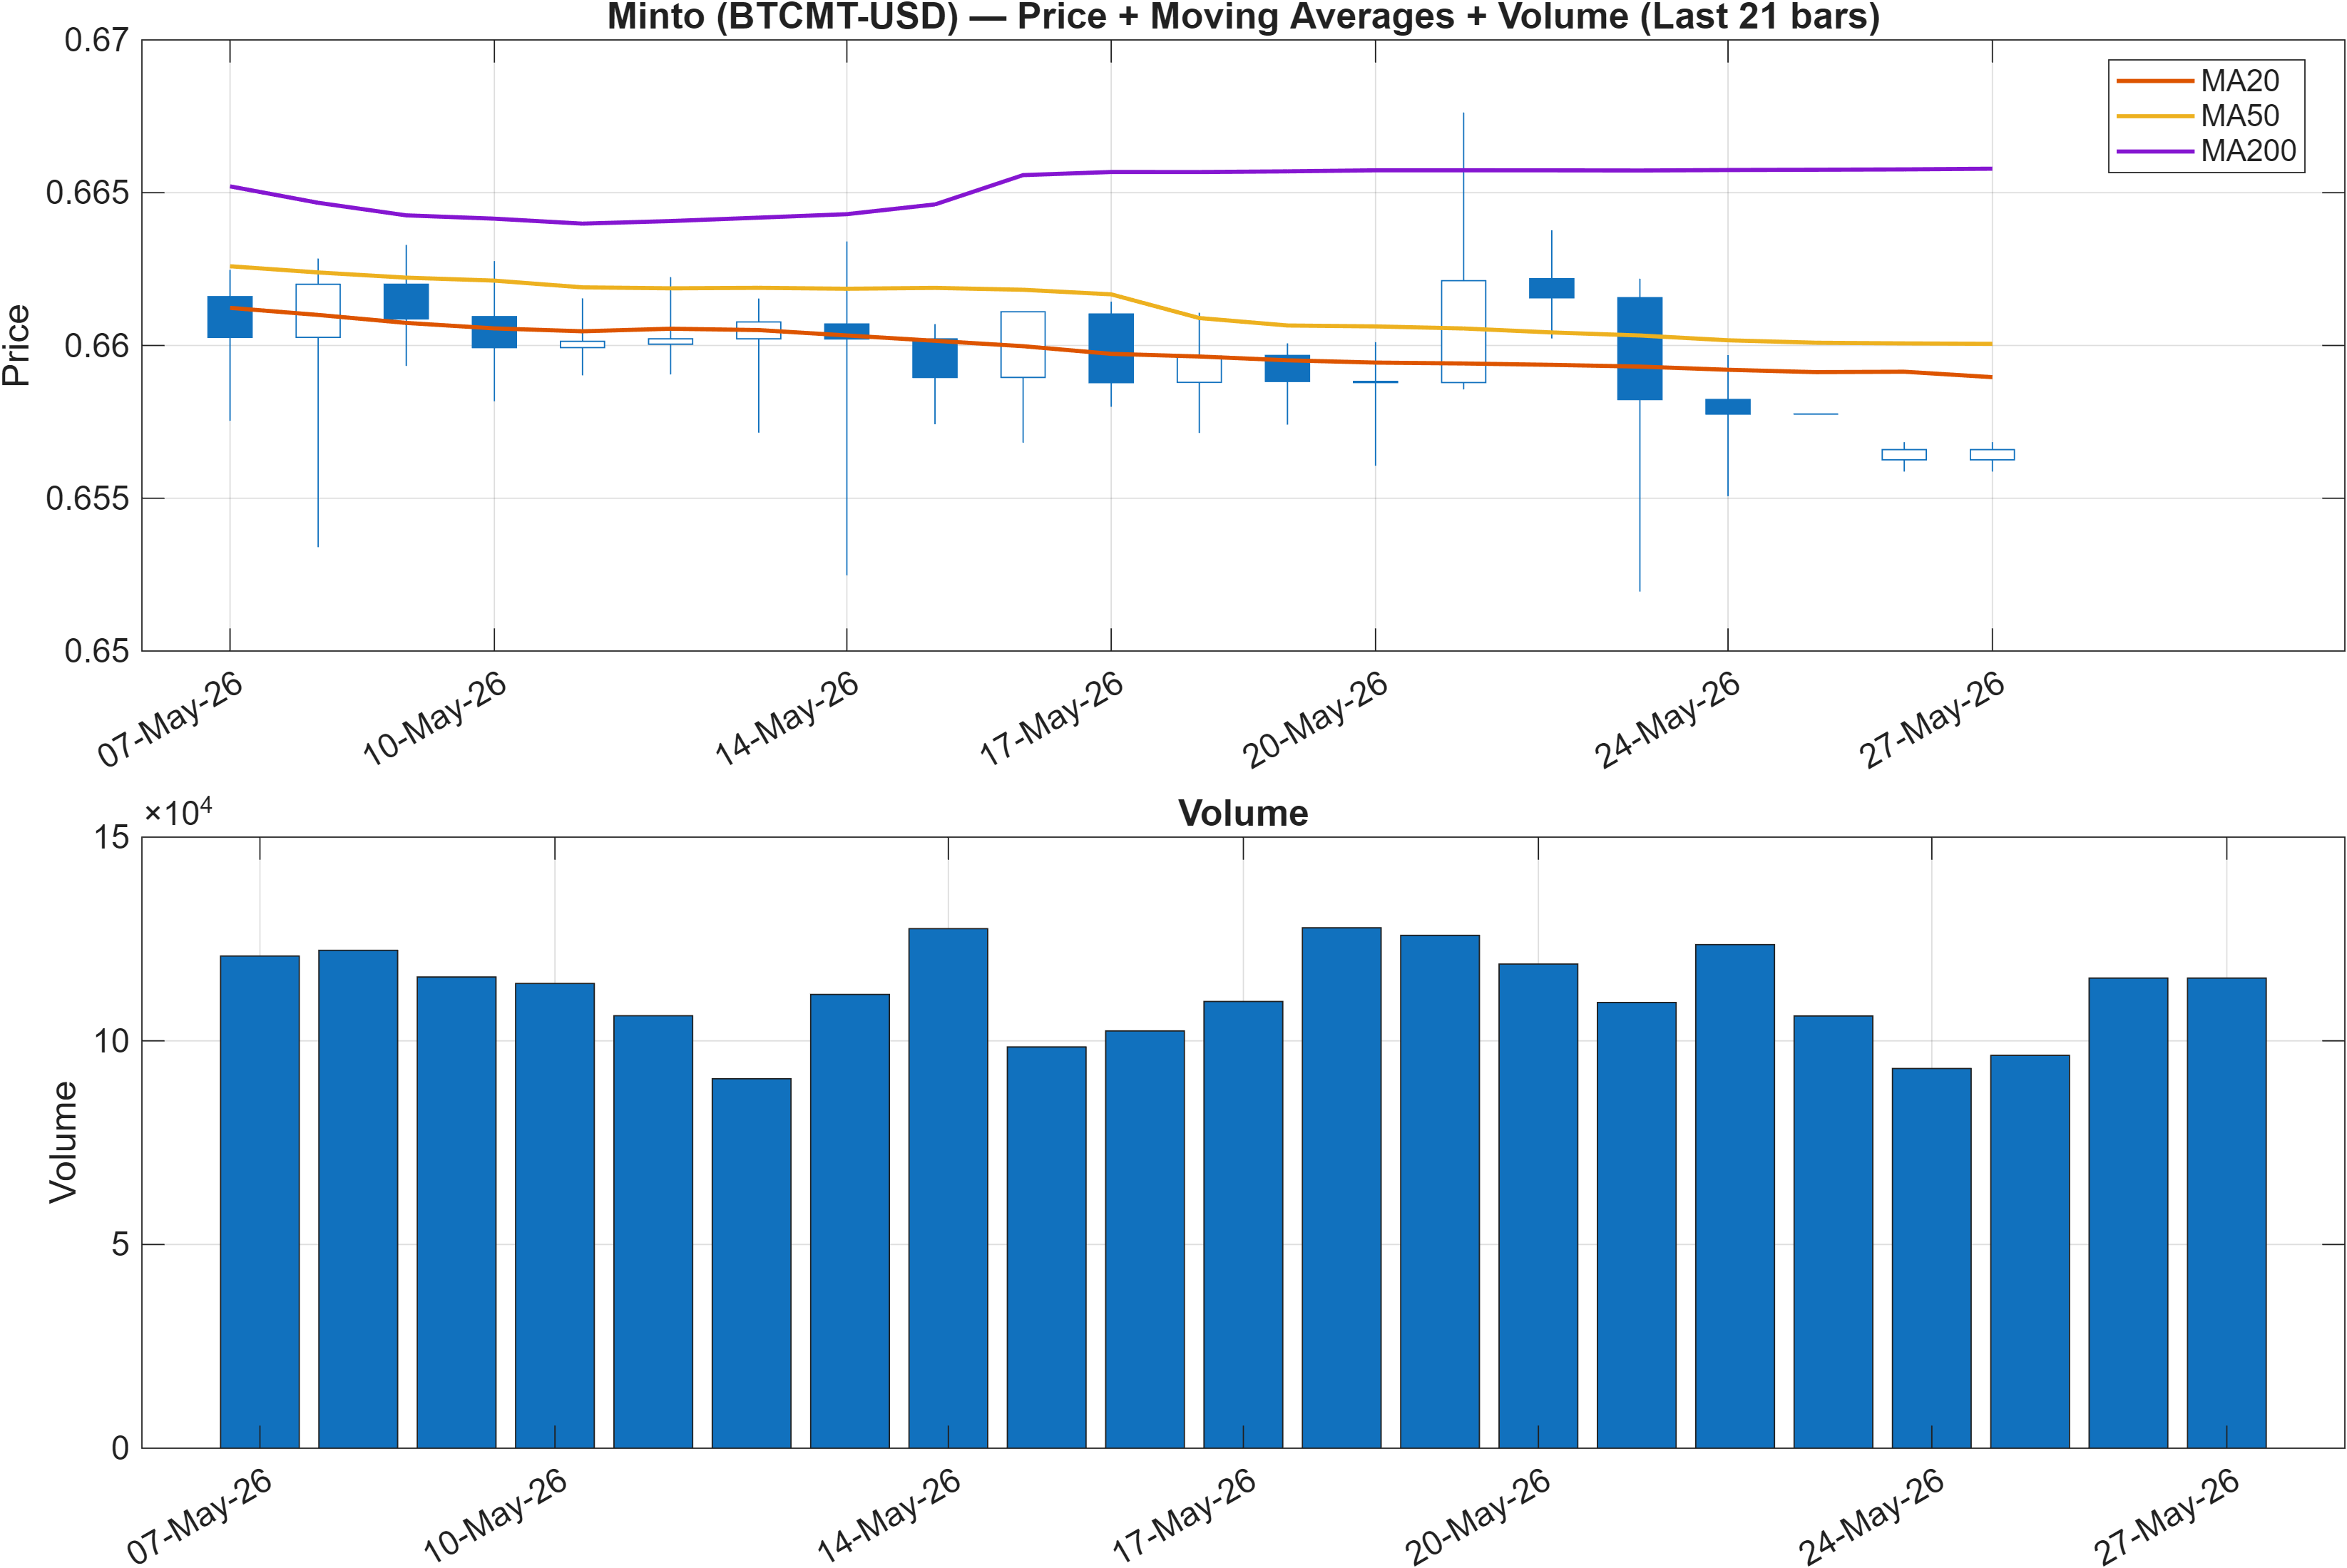
Trend filters: bearish alignment, with ranks attempting to improve against the tape
The trend read is unambiguous on the moving-average filters provided: close vs MA50 = Bearish and MA50 vs MA200 = Bearish. That combination typically reflects a market trading below intermediate trend while also sitting within a weaker longer-term trend structure. In that regime, upside progress often requires evidence of trend repair—stabilization above the MA50 and eventual flattening or reversal of the MA50/MA200 relationship—rather than relying on a single momentum bounce.
The analytical nuance is the divergence between the daily rank (#123) and the trend filters. When cross-sectional ranks improve while trend remains bearish, the market can be in a reversion phase (short-term stabilization) or in the early portion of a transition. The difference is resolved by whether price can build persistence above resistance and whether pullbacks respect defined support.
The nearest structural decision points are explicitly defined later as support 0.6544 and resistance 0.6764. Those levels become more consequential when trend filters are bearish because failed rallies into resistance can reinforce the prevailing trend, while clean breaks—particularly if accompanied by improved participation—can mark the start of a repair process. Until such confirmation appears, the trend context argues for treating strength as conditional rather than directional certainty.
3) Momentum & volatility dashboard
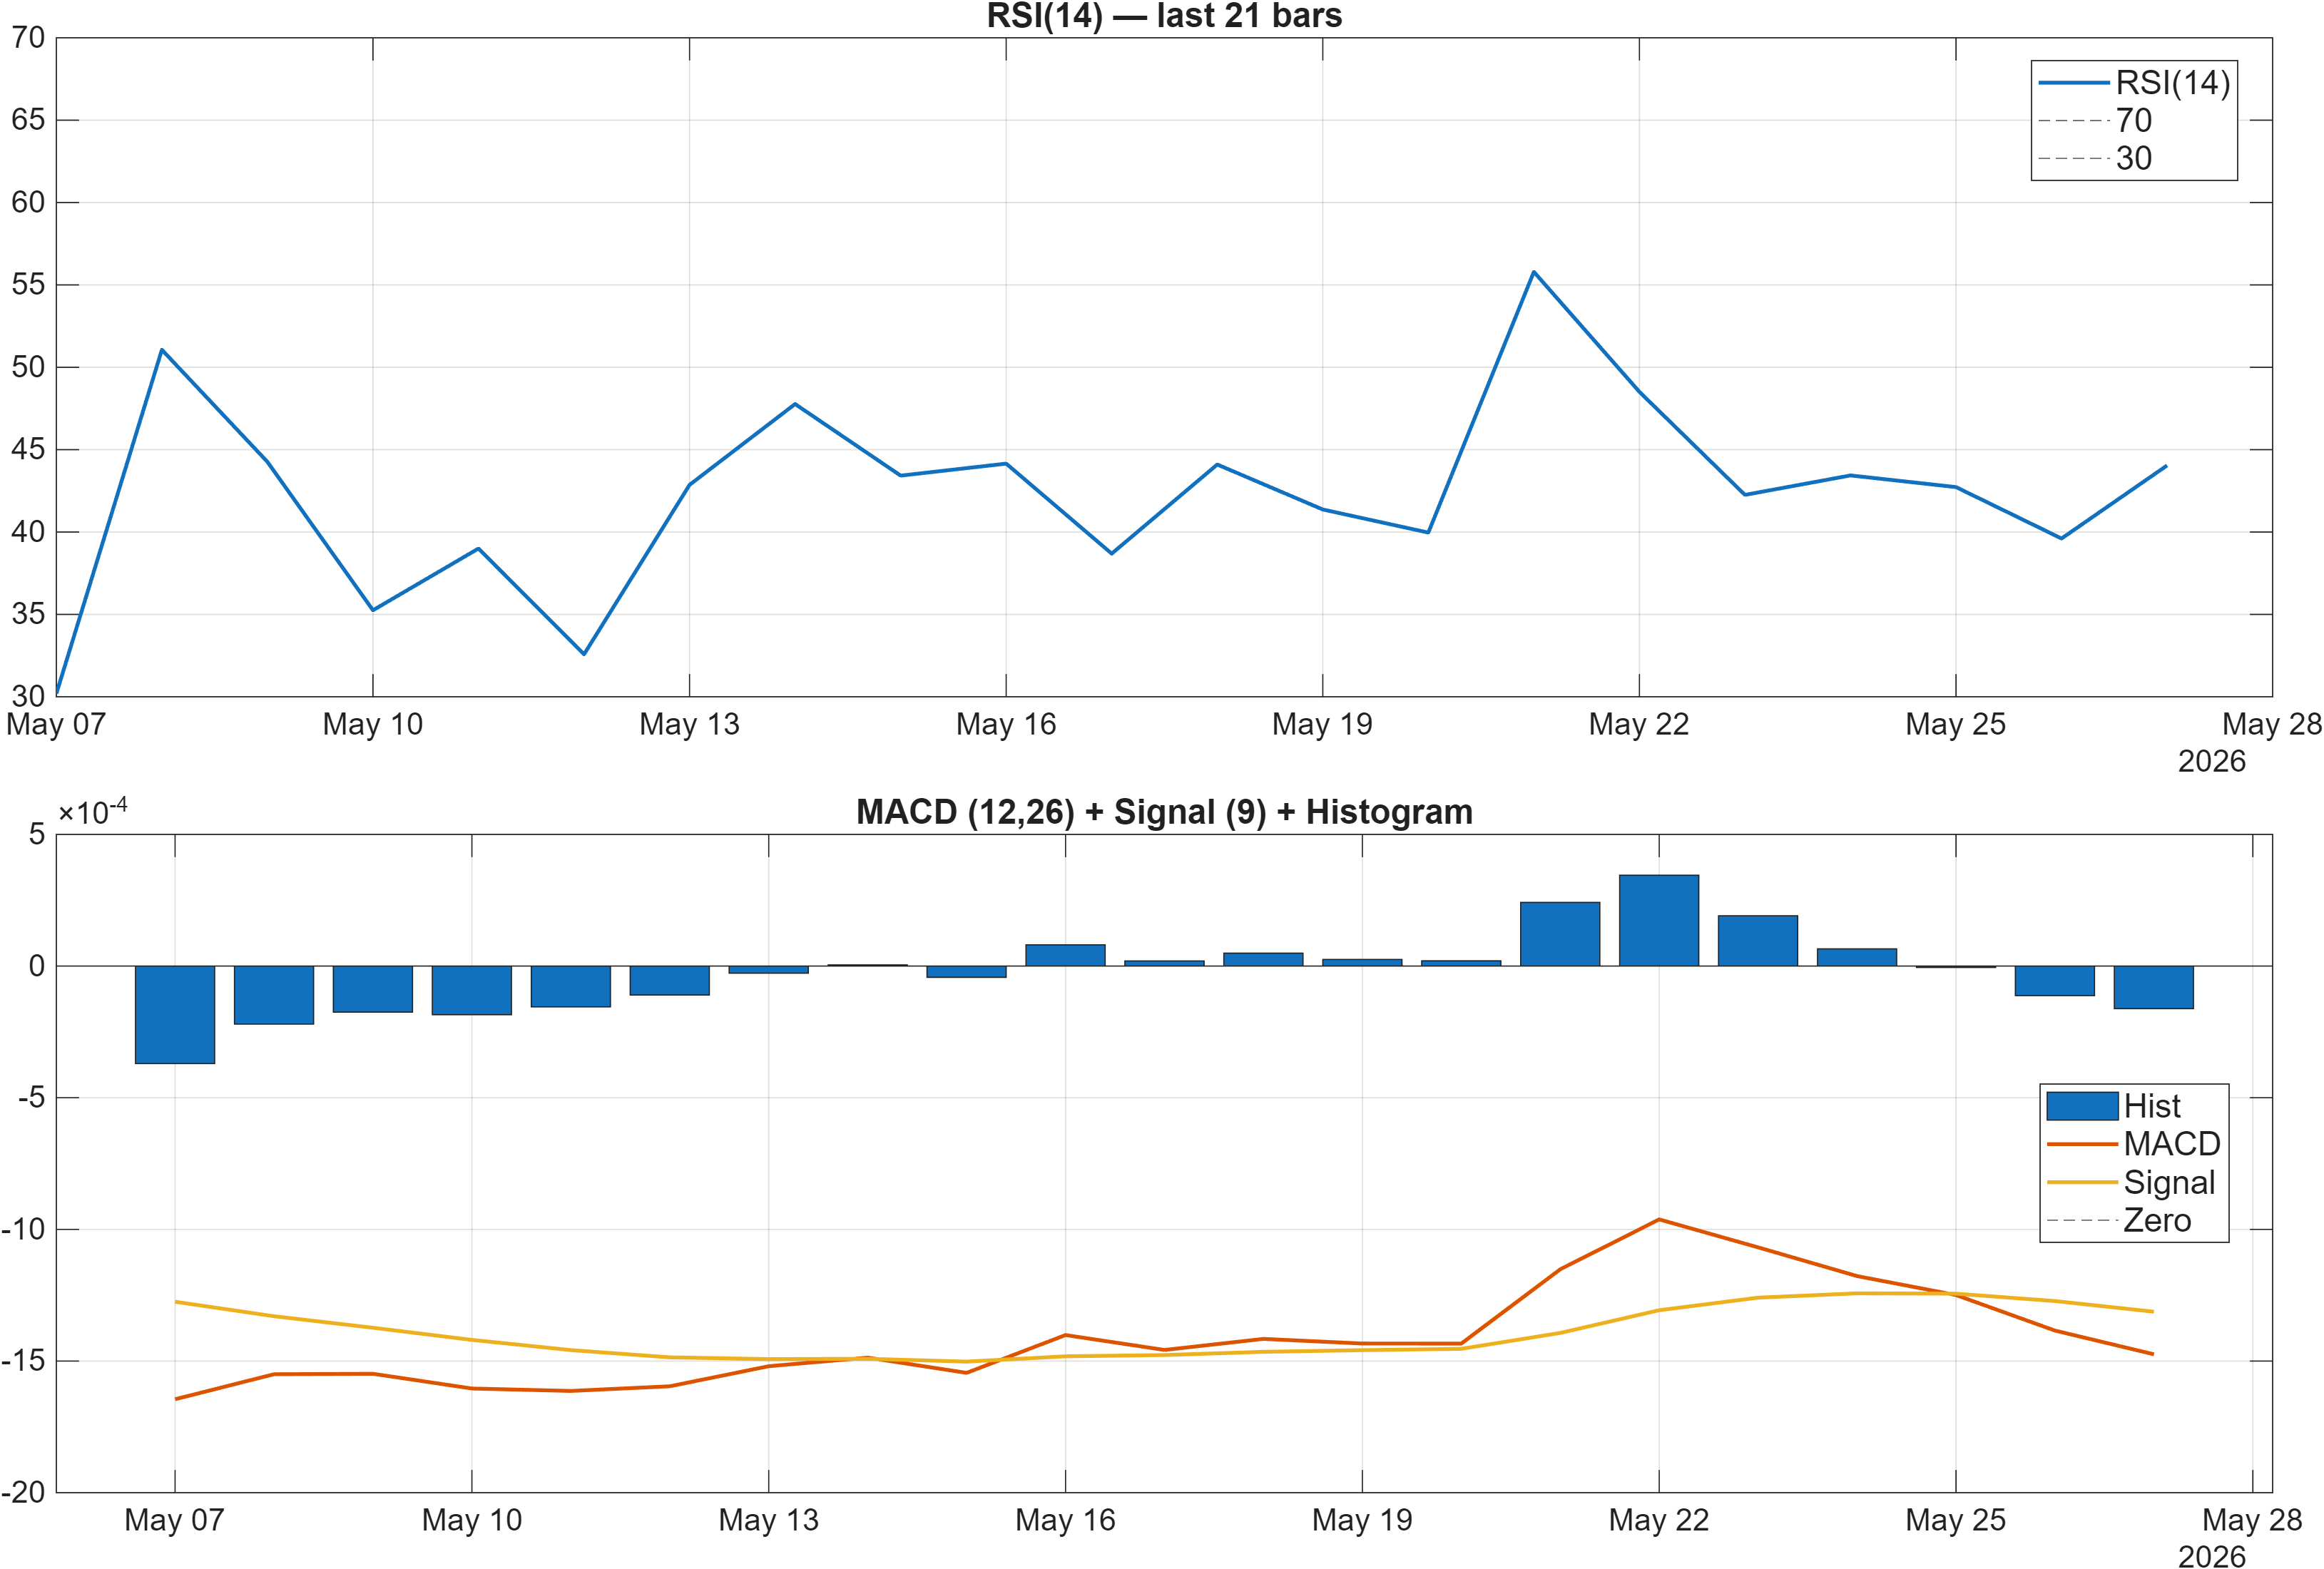
Interpretation: RSI bias = Neutral, MACD hist = -0.0002.
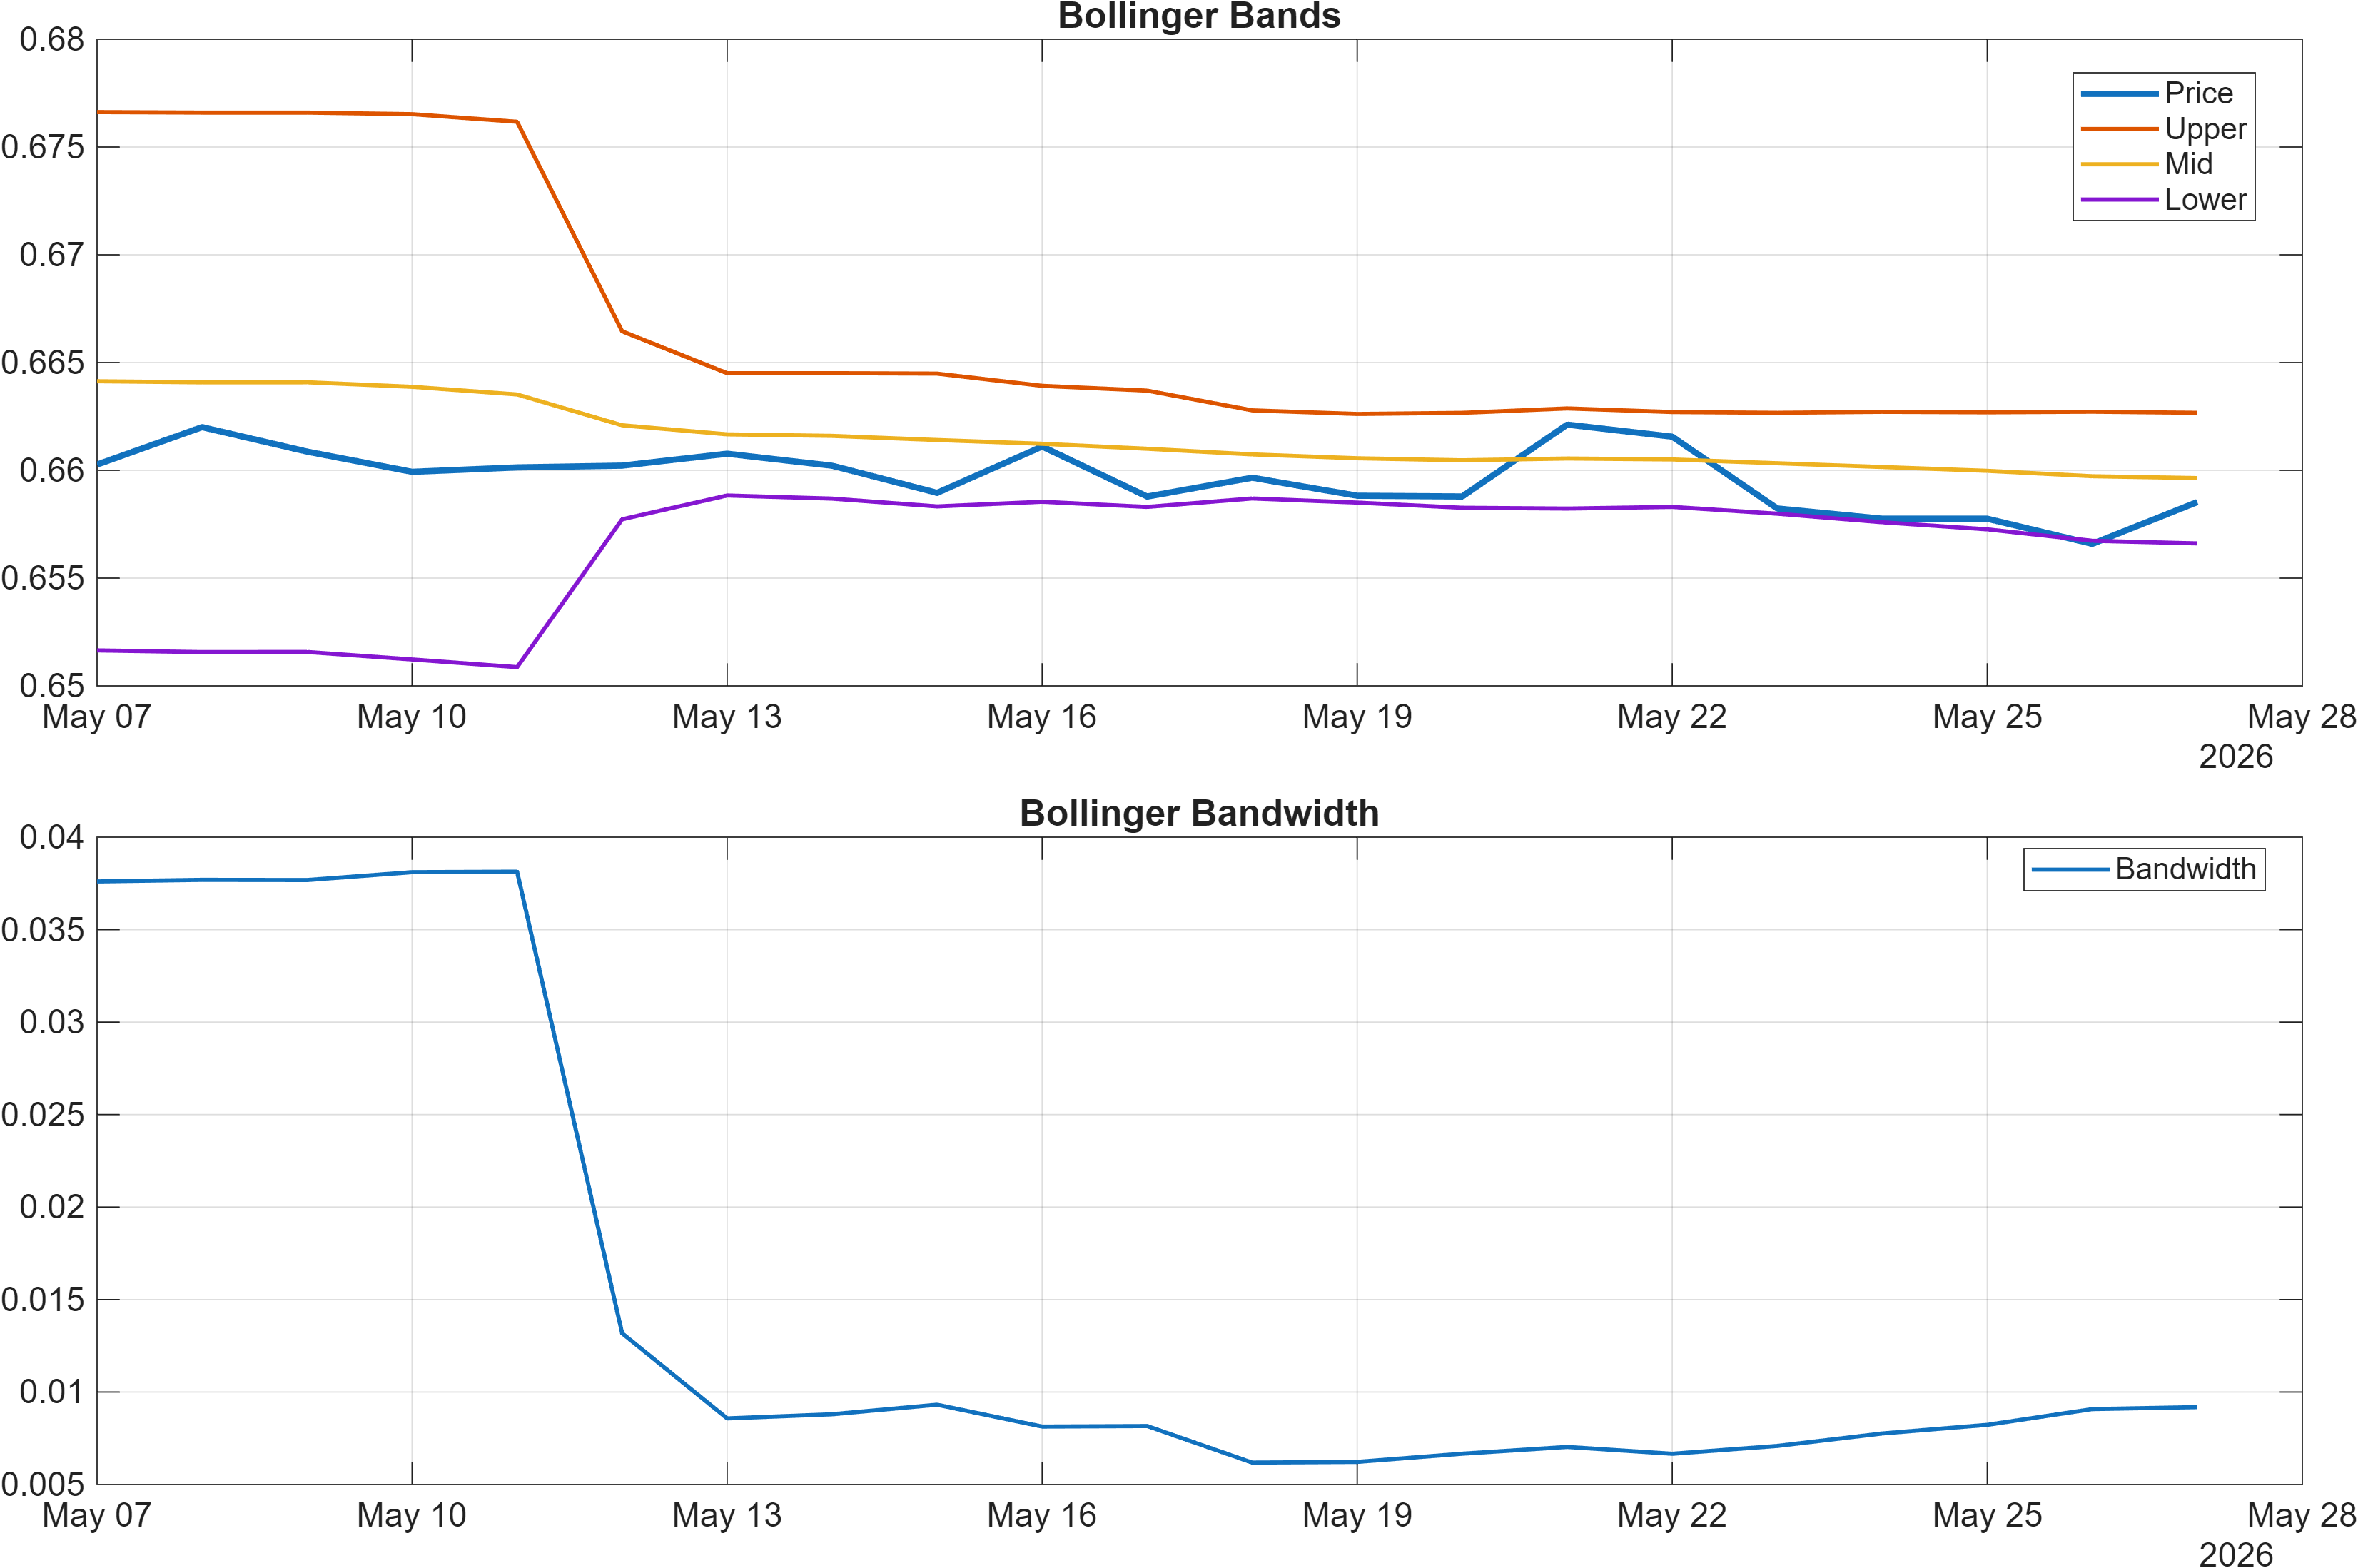
Interpretation: Bandwidth (volatility regime) latest = 0.0092.
Compression regime: momentum is mixed, volatility is tight, and the next impulse is likely level-driven
Momentum indicators are not delivering a unified directional message. The dashboard calls RSI bias Neutral, while the detailed signal table later tags RSI(14) at 44.04 as Bearish—a difference that can occur when broader thresholds are neutral but the exact reading remains in the lower half of the typical RSI range. Meanwhile, the MACD histogram at -0.0002 indicates mild negative impulse, consistent with a market that has not yet generated sustained upside acceleration.
Volatility is the more distinctive feature: Bollinger bandwidth at 0.0092 points to a compressed regime. Compression does not imply direction, but it tends to raise the importance of breakout validation because moves from low-volatility baselines can be sharper once expansion begins. In this context, levels and trend filters can dominate interpretation: a break that occurs while the market is still under bearish moving-average alignment may require stronger confirmation than usual to avoid whipsaw.
Internally, the momentum/volatility mix supports a “wait for resolution” posture: negative impulse is present but not extreme, RSI is not signaling oversold conditions, and volatility is tight enough that a single catalyst can reprice the range. That places extra analytical weight on whether price action respects support 0.6544 during pullbacks or can reclaim and hold above resistance 0.6764 into a volatility expansion.
4) Support / Resistance zones
Support ~ 0.6544 | Resistance ~ 0.6764
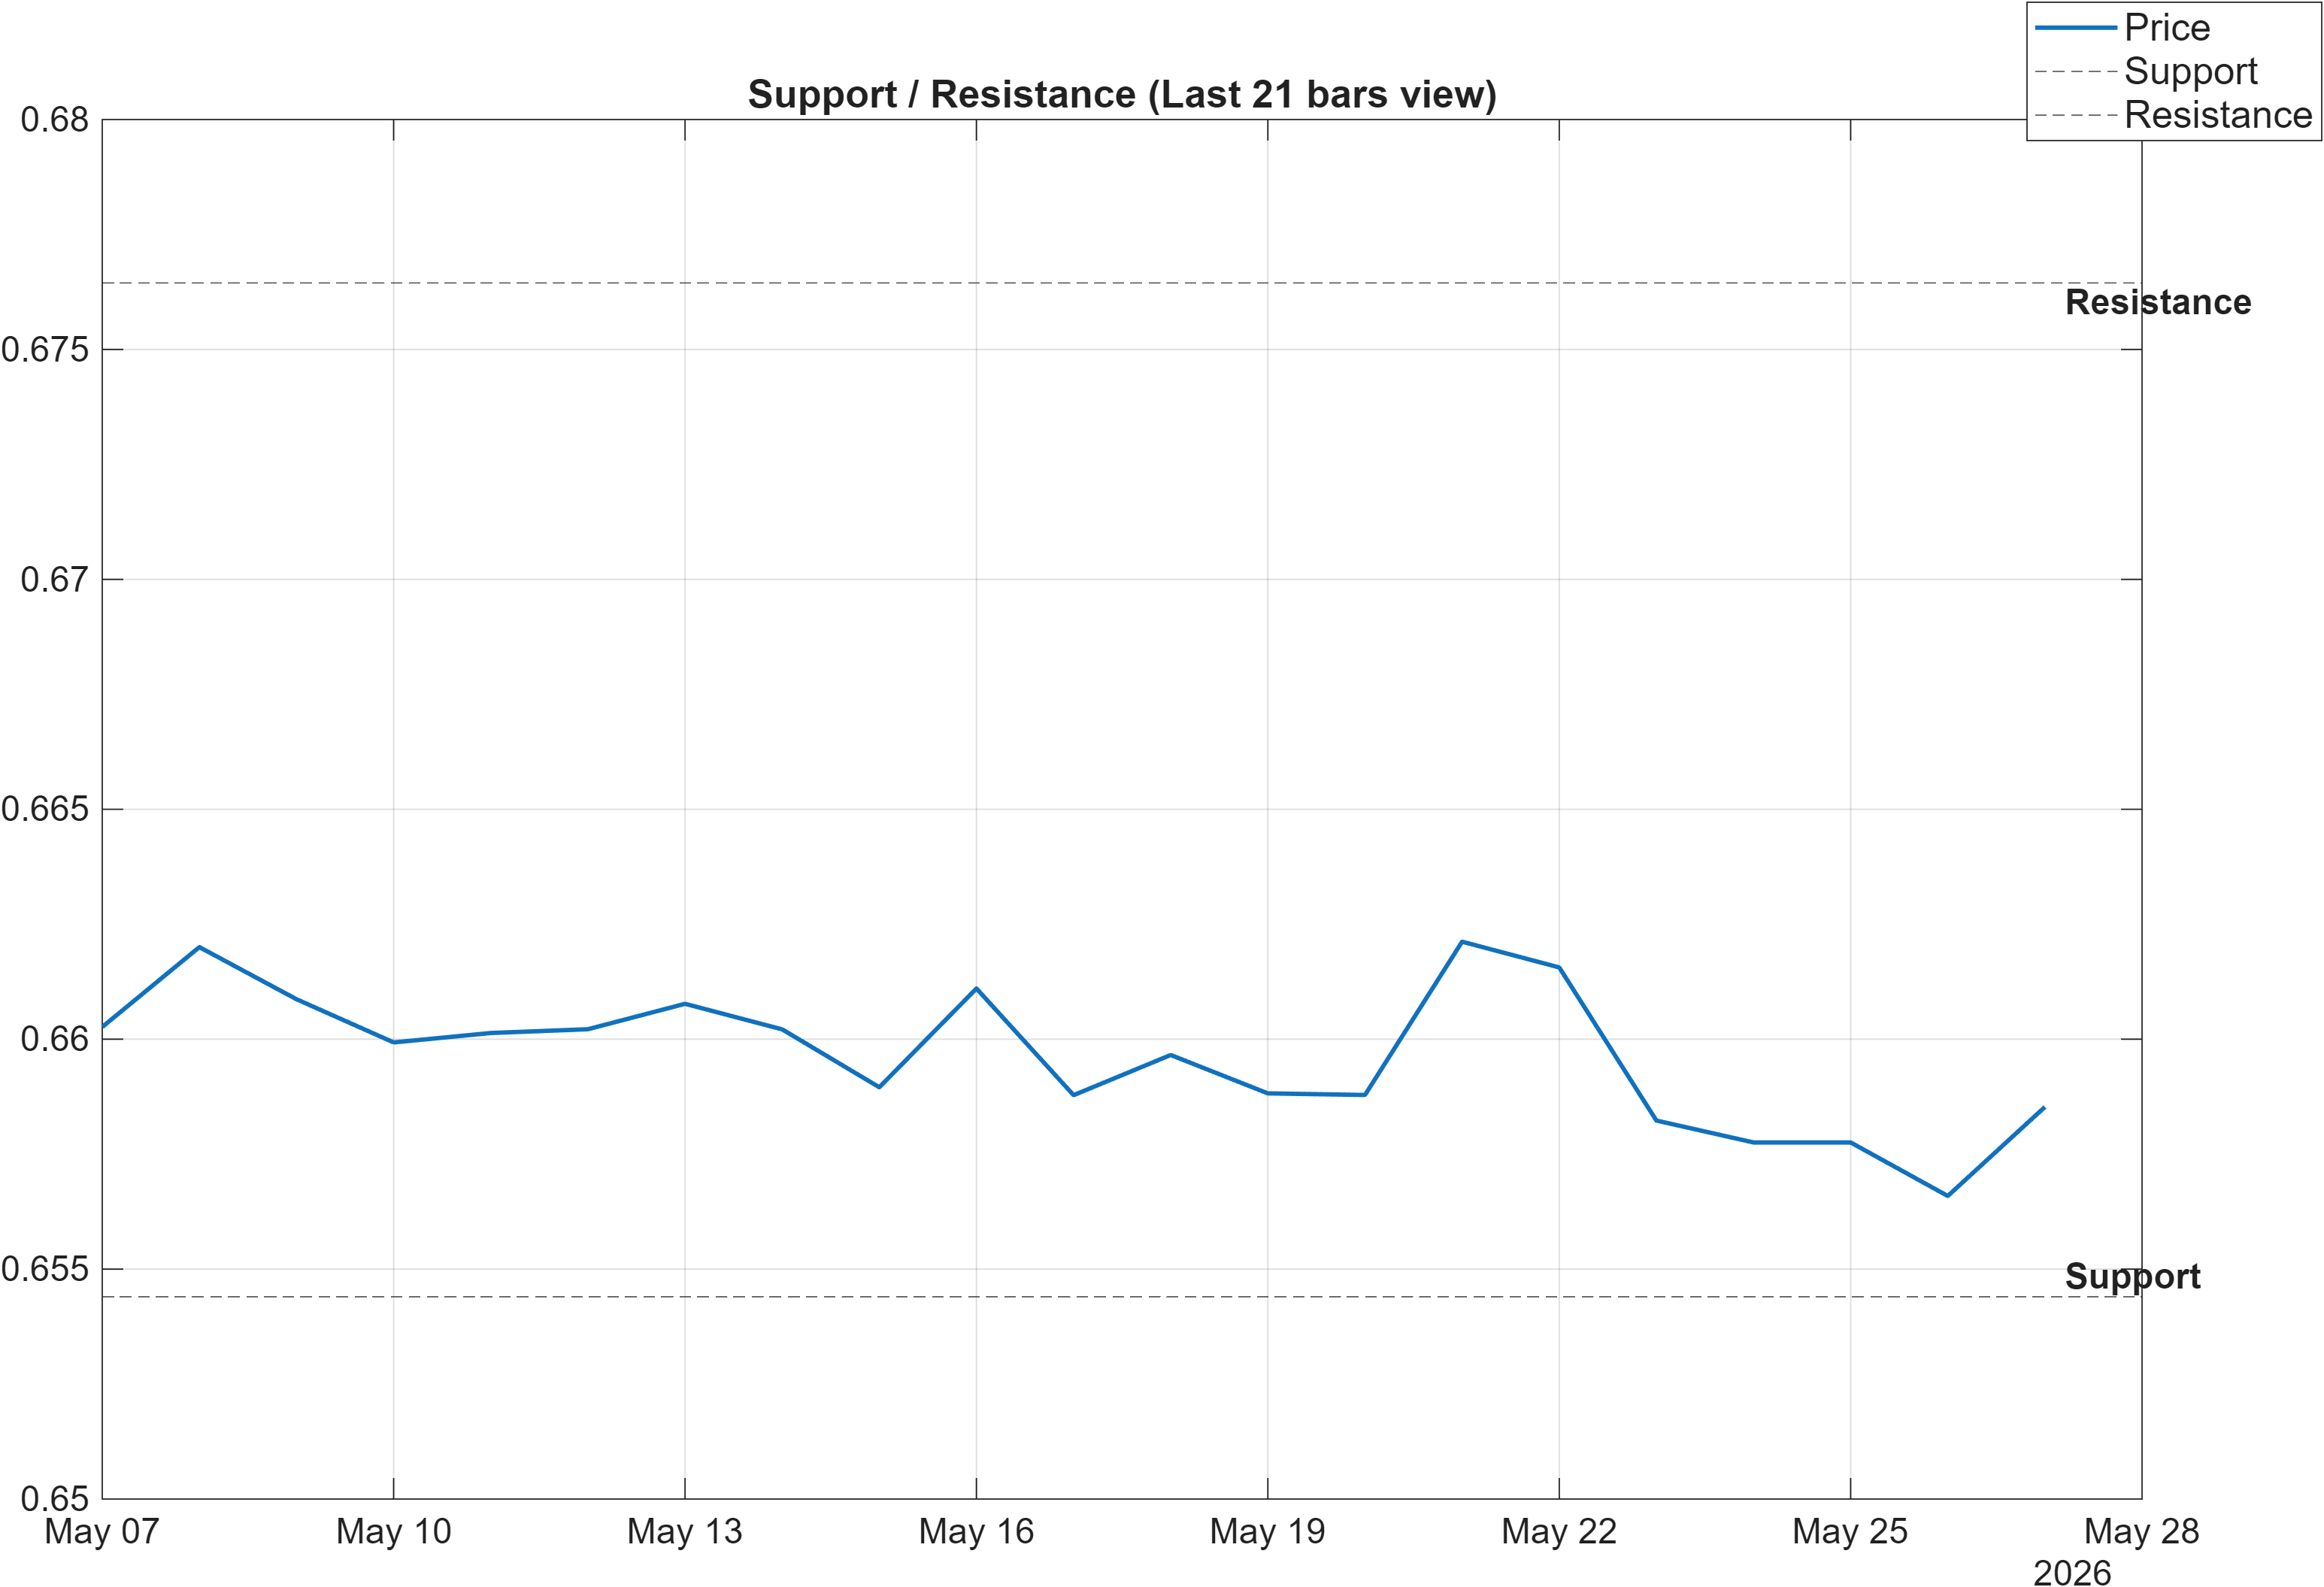
Scenario view: Break above resistance with volume → continuation. Close below support → signal deterioration risk.
Decision zones: mapping confirmation vs invalidation in a compressed-volatility market
With volatility compressed (0.0092) and trend filters bearish (close below MA50; MA50 below MA200), the support/resistance map functions as the primary framework for distinguishing range continuation from regime shift. The defined band is tight: support near 0.6544 and resistance near 0.6764. In practice, tight bands can attract false breaks, so the scenario language correctly emphasizes confirmation with volume rather than a single intraday print.
A sustained move above 0.6764 would serve as a direct test of whether the short-term rank strength (daily #123) is translating into tradable follow-through. Because the broader ranks remain neutral and the technical blend is bearish, upside confirmation would ideally be accompanied by improving momentum conditions—such as stabilization in MACD histogram (currently -0.0002) and RSI behavior lifting away from softer territory (44.04 on RSI(14) in the signal table).
Conversely, a close below 0.6544 is the clearest invalidation line in this report. Given the existing bearish trend filters, a breakdown would align price structure with the weaker side of the technical blend and would pressure the notion that the daily rank improvement is durable. In a compressed regime, breakdowns can also coincide with volatility expansion, making the support line the key reference for whether risk is contained or deteriorating.
5) Quant Technical Dashboard (18 Signals)
KGNAI AI Technical Analysis Score (Deep Reinforcement Learning): Rank #675 out of 800 (Rank 1 represents the strongest technical positioning and a higher probability of favorable price behavior. As ranks increase toward the maximum, the probability of favorable outcomes weakens and bearish positioning becomes more dominant.) | Label: Bearish | Score: -0.688
18-Signal Technical Confluence Score: -0.222 (Neutral)
Overall Technical Score (18-signal confluence + DRL rank blend): -0.362 (Bearish)
Note: The blended score reflects signal strength weighted against broader AI technical ranking, which may temporarily diverge.
Blended technical score breakdown: -0.362 (Bearish | Bull 5 / Bear 9 / Neutral 4)
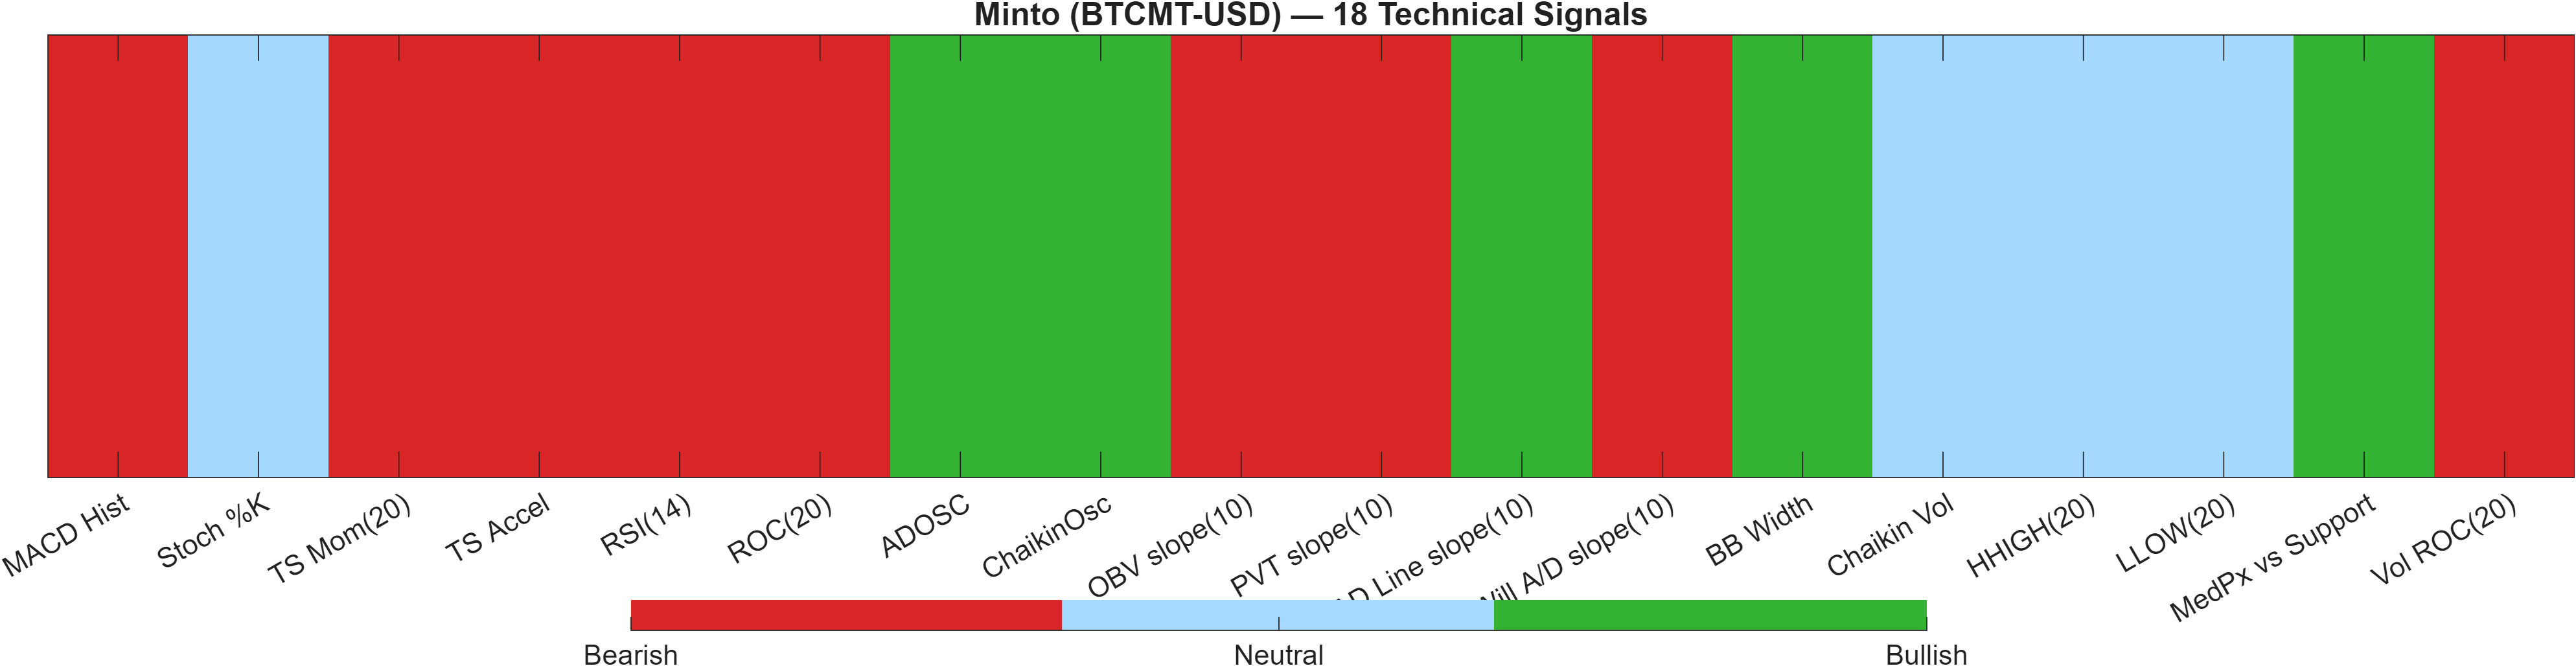
Composite view: neutral confluence, bearish model overlay
The technical stack is best understood as a two-layer system. First, the 18-signal confluence score is -0.222, labeled Neutral. Second, the Deep Reinforcement Learning (DRL) technical model assigns a notably weak cross-sectional position: rank #675 out of 800 with score -0.688, labeled Bearish. When blended, the overall technical score moves to -0.362 (Bearish).
That blend implies that while the indicator set is not uniformly negative, the broader pattern-recognition layer sees the technical state as structurally weak versus peers. The breakdown (Bull 5 / Bear 9 / Neutral 4) supports that asymmetry: there are constructive pockets, but bearish signals dominate the distribution. Examples include the momentum side—MACD Hist -0.0001617 and TS Mom(20) -0.005412—which reinforce a soft impulse profile, consistent with the bearish trend filters in the price section.
At the same time, the presence of bullish volume/flow-related signals (e.g., ADOSC 67.23 and a bullish ChaikinOsc 6.795e+04) suggests the market is not purely risk-off internally. This is a classic divergence setup: participation measures can firm while price/momentum remain heavy. In such cases, the support/resistance framework becomes the arbiter—strength in flows matters most if it helps sustain price above 0.6544 and ultimately challenge 0.6764.
Signal table (Bull/Bear/Neutral)
| Indicator | Value | Signal |
|---|---|---|
| MACD Hist | -0.0001617 | Bearish |
| Stoch %K | 29.62 | Neutral |
| TS Mom(20) | -0.005412 | Bearish |
| TS Accel | -0.00661 | Bearish |
| RSI(14) | 44.04 | Bearish |
| ROC(20) | -0.5251 | Bearish |
| ADOSC | 67.23 | Bullish |
| ChaikinOsc | 6.795e+04 | Bullish |
| OBV slope(10) | -4.459e+05 | Bearish |
| PVT slope(10) | -352.8 | Bearish |
| AD Line slope(10) | 1.834e+05 | Bullish |
| Will A/D slope(10) | -0.005748 | Bearish |
| BB Width | 0.009183 | Bullish |
| Chaikin Vol | -27.87 | Neutral |
| HHIGH(20) | 0.6676 | Neutral |
| LLOW(20) | 0.6519 | Neutral |
| MedPx vs Support | 0.001956 | Bullish |
| Vol ROC(20) | -5.579 | Bearish |
Interpretation: Indicator-level signals form the base confluence, which is then adjusted using a separate AI-driven technical ranking model. The final technical score summarizes this combined view.
6) News sentiment + extractive gist
Note: Instrument-specific news matches were not found, so the digest includes broader market/sector headlines. Links are provided for verification.
Sentiment score (avg): 0.037 | Positive: 19% | Neutral: 75% | Negative: 6%
KGNAI AI News Sentiment Score (normalized -1 to +1): Not available (as of —) | Label: Not available | Overall news score: 0.04
Positive Developments
Recent coverage across major financial outlets indicates a constructive tone in parts of the crypto complex, with attention on higher participation, product flows, and ongoing institutional engagement themes. The aggregated sentiment mix supports this: 19% positive items versus only 6% negative, and an average score of 0.037 (slightly positive-to-neutral). For BTCMT-USD specifically, this backdrop can matter most through second-order effects—liquidity conditions, sector risk appetite, and the willingness of traders to act on breakouts when volatility is compressed. That said, the report explicitly flags that instrument-specific matches were not found, so the positive skew should be treated as context rather than a direct catalyst. When market-wide tone is constructive, confirmation at technical levels (for example, reclaiming resistance) can be more readily reinforced by follow-through participation.
Neutral / Mixed Developments
The dominant share of coverage is still categorized as neutral (75%), which aligns with a market digest that blends sector narratives without a singular driver tied to BTCMT-USD. Neutral items often reflect policy, regulatory, or market-structure developments that can shift attention without immediately changing price behavior. In this setup, a neutral-heavy tape can amplify the importance of technical resolution: when news flow is not decisive, price tends to respect mechanical levels and volatility regimes more cleanly. The lack of a dedicated KGNAI normalized news sentiment score (Not available) also reinforces that the news input here is best read as a background bias rather than a calibrated signal within the model stack.
Negative / Risk Signals
Risk framing in the broader crypto narrative remains present even if quantitatively smaller (6% negative). Themes typically cluster around regulatory scrutiny, compliance enforcement, and the expansion of 24/7 crypto-linked products—developments that can alter volatility and correlation behavior quickly, especially in thinner markets. For BTCMT-USD, the practical implication is not a forecast but a heightened sensitivity to breakdown confirmation when volatility is already tight (0.0092). In a compressed regime, negative risk signals can act as the trigger for volatility expansion; therefore, the key question becomes whether price action holds above 0.6544 or slips into deterioration territory. With trend filters already bearish, adverse shocks can more easily reinforce the prevailing structure unless offset by strong demand near support.
- Whether price confirms above 0.6764 with participation while volatility expands from 0.0092.
- Whether dips hold 0.6544 despite bearish trend filters (close<MA50 and MA50<MA200).
- Whether momentum stabilizes (MACD histogram improving from -0.0002 and RSI behavior lifting from the 44.04 area).
Sources referenced: Reuters, Bloomberg, Yahoo Finance, MarketWatch, Investing.com
Snapshot: AI Rank (Short–Mid–Long): Neutral (Neutral–Neutral–Neutral) · Technical Confluence: Neutral · Key Levels: Support ~0.65 | Resistance ~0.68 · News Sentiment: Neutral
7) Sources
Not available in the provided data.
You may also like: How KGNAI AI ranks instruments across global markets
Disclaimer: KGNAI provides AI-generated analytics and educational market commentary only. This is not financial advice. Markets involve risk. Always do your own research.