
ZelCash (ZEL-USD) Technical & Rank Outlook — Neutral Near-Term, Bullish Longer-Horizon Signals (24-May-2026)
ZelCash (ZEL-USD) shows a split time-horizon profile in KGNAI’s cross-sectional framework as of 24-May-2026. The near-term positioning remains neutral, with the Daily rank #293 and Weekly rank #525 suggesting the asset is not currently screening as a short-term leader within a universe of 800 instruments. In contrast, longer-horizon ranks are notably stronger, led by a Monthly rank #9 and 3-Monthly rank #38, indicating more favorable relative behavior across broader lookbacks. Technically, the picture is more cautious: the 18-signal confluence score of -0.444 (Bearish) implies momentum and participation signals have not fully confirmed the longer-horizon rank strength. Key price decision zones are clearly defined around support ~0.0491 and resistance ~0.0813, which can help frame invalidation/confirmation as volatility and volume conditions evolve.
- Rank stance (Short / Mid / Long): Short-term Neutral (Daily #293; Weekly #525) | Mid-term Bullish | Long-term Bullish (Monthly #9; 3-Monthly #38)
- Technical confluence label: Bearish (18-signal confluence -0.444) with a Neutral blend (overall technical score -0.236)
- Key levels: Support ~0.0491 | Resistance ~0.0813
- News sentiment bias: Neutral (avg 0.024; 19% positive / 69% neutral / 12% negative)
- Confirmation / invalidation condition: A break above 0.0813 with volume supports continuation; a close below 0.0491 increases deterioration risk per the scenario framing.
KGNAI evaluates assets using large cross-sectional datasets built from millions of structured data points. Inputs incorporate fundamental metrics, technical structures, and systematically processed news sentiment. Statistical models, machine learning, and AI frameworks are used to assess relative positioning, signal alignment, and probabilistic behavior across broad universes.
- Ranks are comparative across the tracked universe, not absolute price targets.
- Confluence reflects alignment among independent signal groups.
- Support/resistance levels are probabilistic decision zones, not guarantees.
- Sentiment provides contextual bias within the broader analytical framework.
1) KGNAI AI Analysis
Region: CRYPTO
Total universe size: 800 ranked instruments
- Daily rank: #293 out of 800 — Neutral
- Weekly rank: #525 out of 800 — Neutral
- Monthly rank: #9 out of 800 — Bullish
- 3-Monthly rank: #38 out of 800 — Bullish
Cross-horizon alignment: strong longer lookbacks, muted near-term leadership
The rank stack for ZEL-USD is asymmetric across horizons, a pattern that often matters more than any single score. Within the same 800-instrument universe, the Monthly rank #9 places the asset in the top tier cross-sectionally, while the 3-Monthly rank #38 also sits in a strong upper band. Those longer-horizon readings suggest that, on broader windows, ZEL-USD has exhibited comparatively favorable behavior versus peers.
The shorter horizon is less cooperative. A Daily rank #293 implies mid-pack behavior rather than leadership, and the Weekly rank #525 moves further into the weaker half of the universe. The practical implication is not “bullish vs bearish,” but timing uncertainty: longer-horizon strength can coexist with near-term mean reversion, liquidity pullbacks, or consolidation that prevents the asset from screening as a short-term outperformer.
KGNAI’s term view reflects this dispersion: Short-term Neutral alongside Mid-term Bullish and Long-term Bullish. When ranks diverge this way, confirmation typically comes from whether technical internals (momentum, volume flow, volatility regime) begin to rotate toward the longer-horizon signal—rather than expecting the long-horizon rank to immediately dominate short-term behavior.
Want the full universe and complete rank tables? Unlock full access on KGNAI: https://www.kgnai.com/pricing
2) Price & trend overview
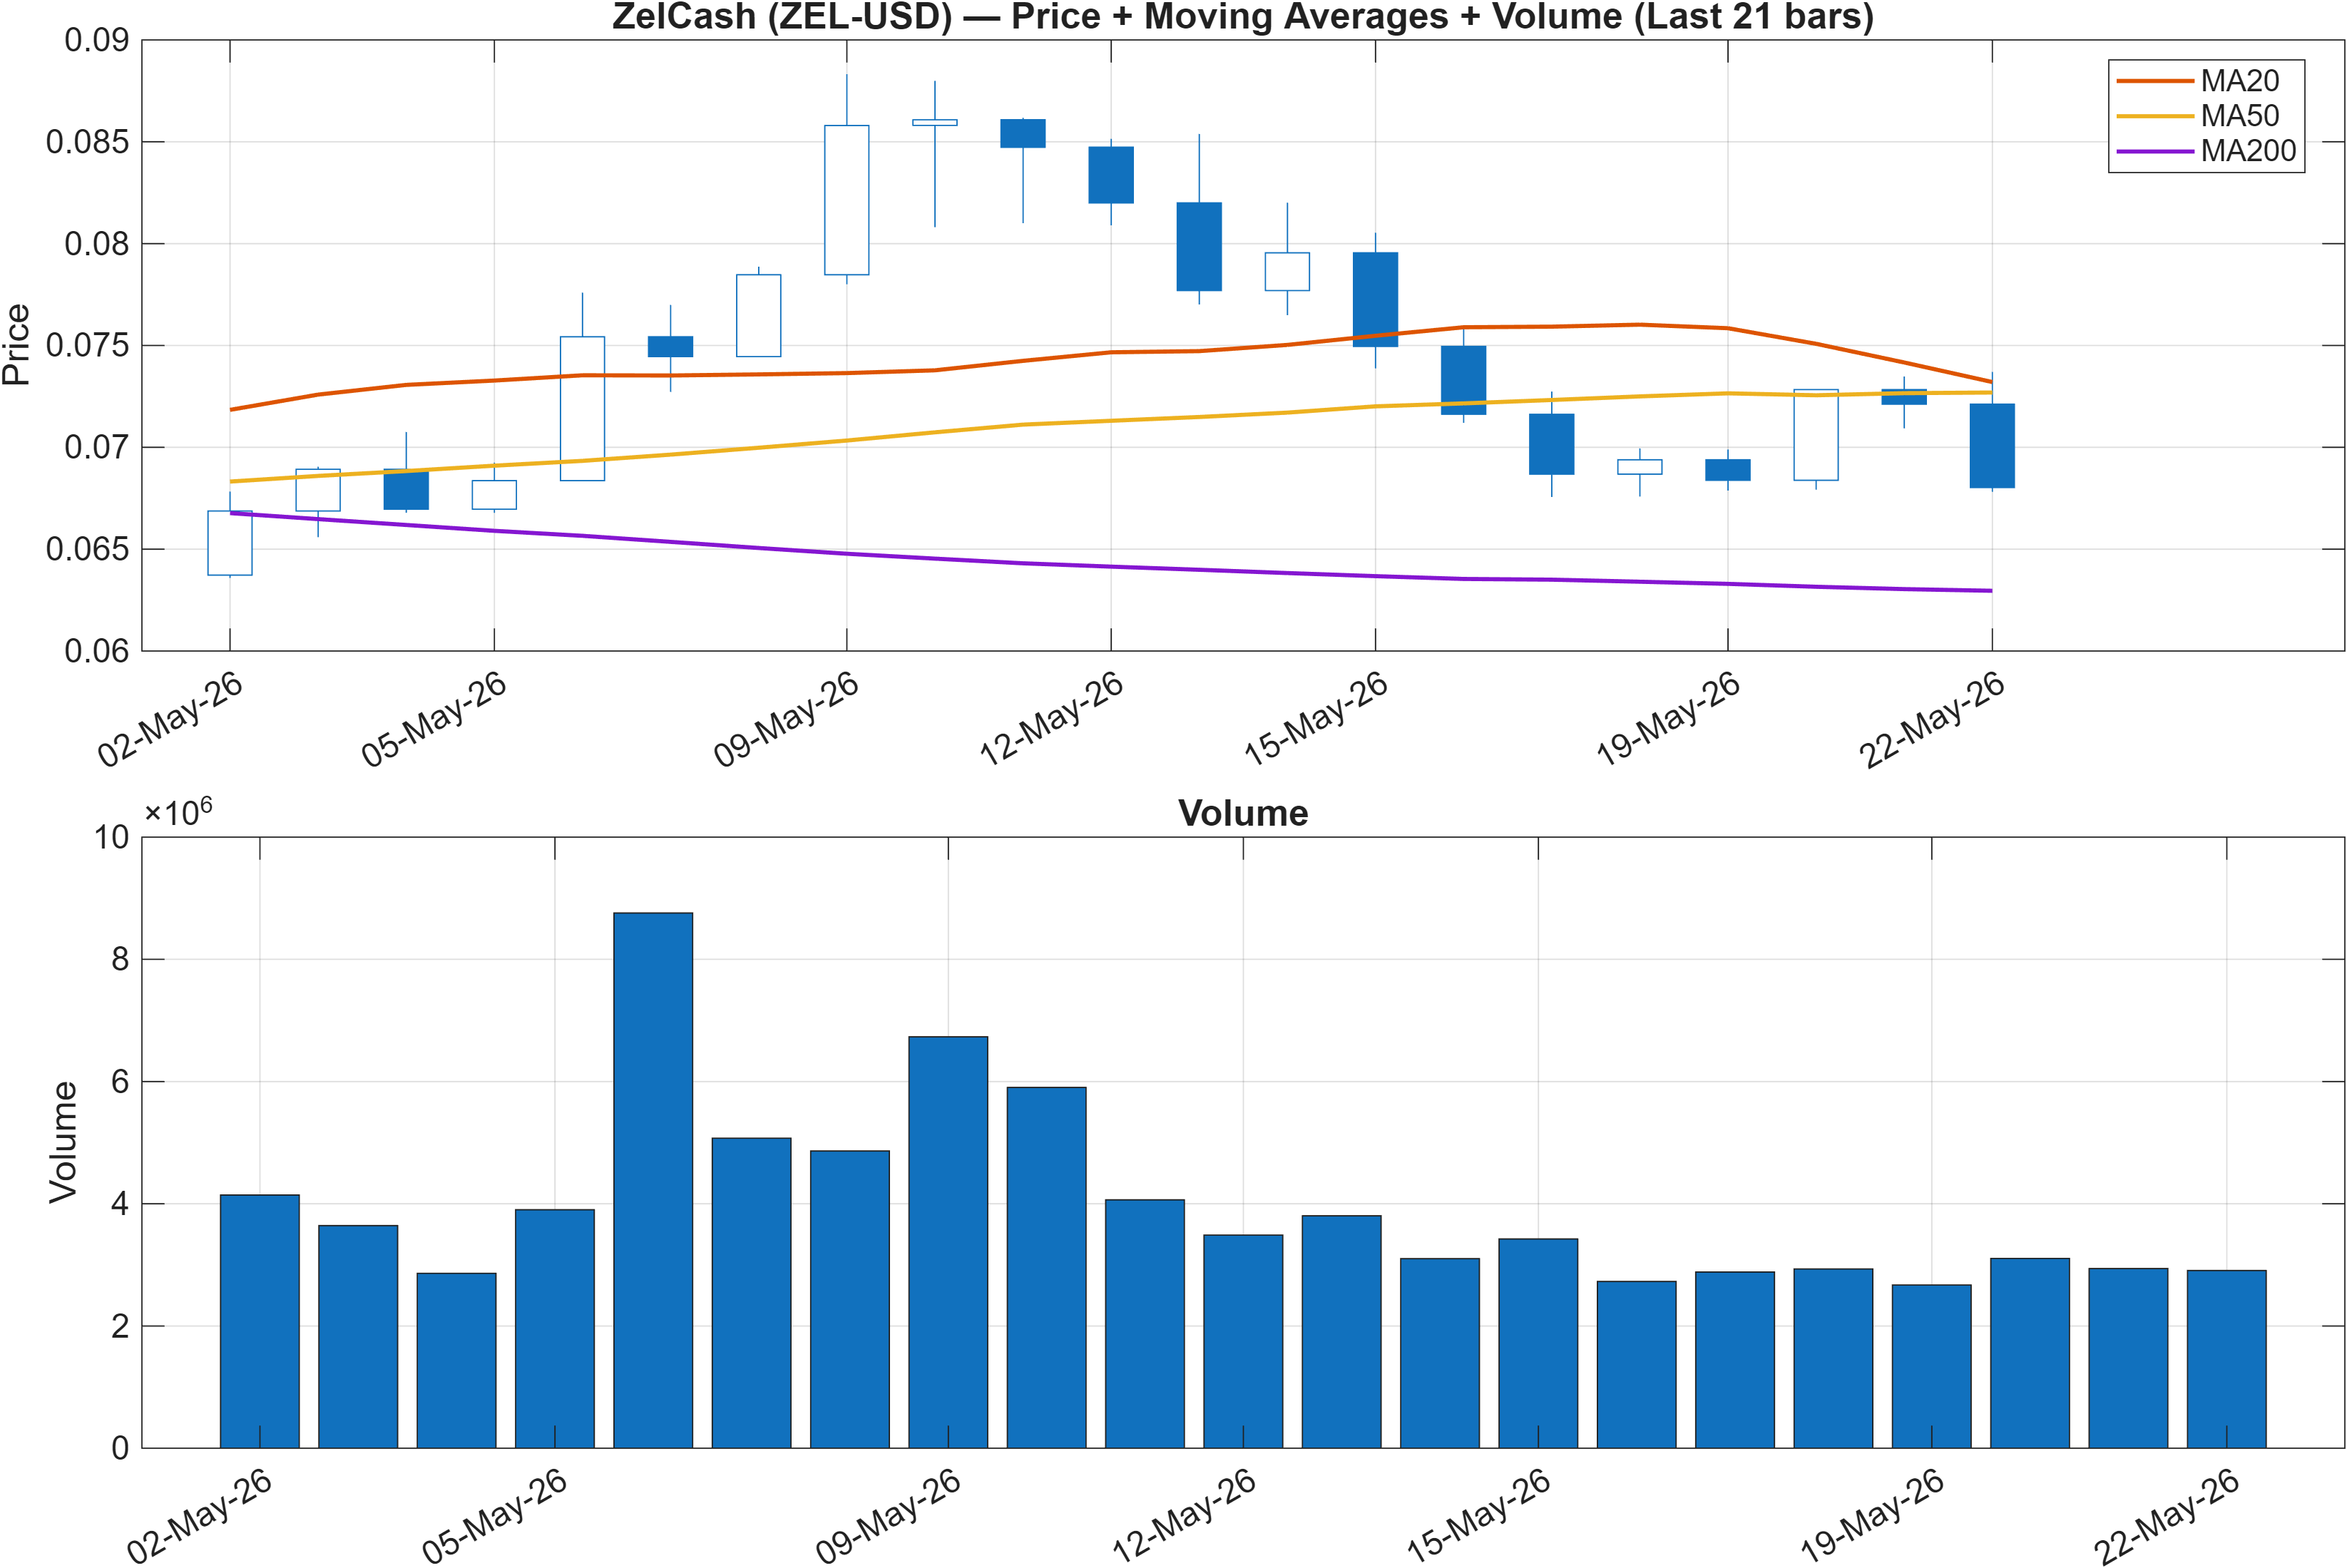
Interpretation: Close vs MA50 = Bearish, MA50 vs MA200 = Bullish.
Regime tension: longer-trend structure vs nearer-term pressure
The moving-average read is a classic case of trend structure tension. The signal “Close vs MA50 = Bearish” indicates price is currently trading below its intermediate reference, a condition commonly associated with softer near-term demand and a higher burden of proof for upside follow-through. At the same time, “MA50 vs MA200 = Bullish” points to a more constructive longer-trend scaffold, where the intermediate trend measure remains above the longer-term anchor.
This combination often maps to a pullback within an uptrending baseline (or an attempted transition back to that baseline). It aligns well with the rank dispersion: the longer-horizon ranks (Monthly #9; 3-Monthly #38) can remain strong even while price trades below the MA50, particularly if prior trend phases produced durable relative strength versus peers.
The immediate analytical question becomes whether the market is repairing the intermediate trend (reclaiming MA50 and holding) or degrading it (failing rebounds and keeping price pinned below). This matters because intermediate trend weakness can suppress the probability that longer-horizon strength expresses itself quickly, especially when combined with bearish momentum evidence elsewhere (e.g., negative MACD histogram and RSI bias discussed below).
From a market-structure perspective, the coexistence of these two moving-average signals also increases the value of confirmation via volume behavior on attempts to recover. The framework here is conditional: the trend scaffold is not outright broken, but it is not currently in clean alignment either.
3) Momentum & volatility dashboard
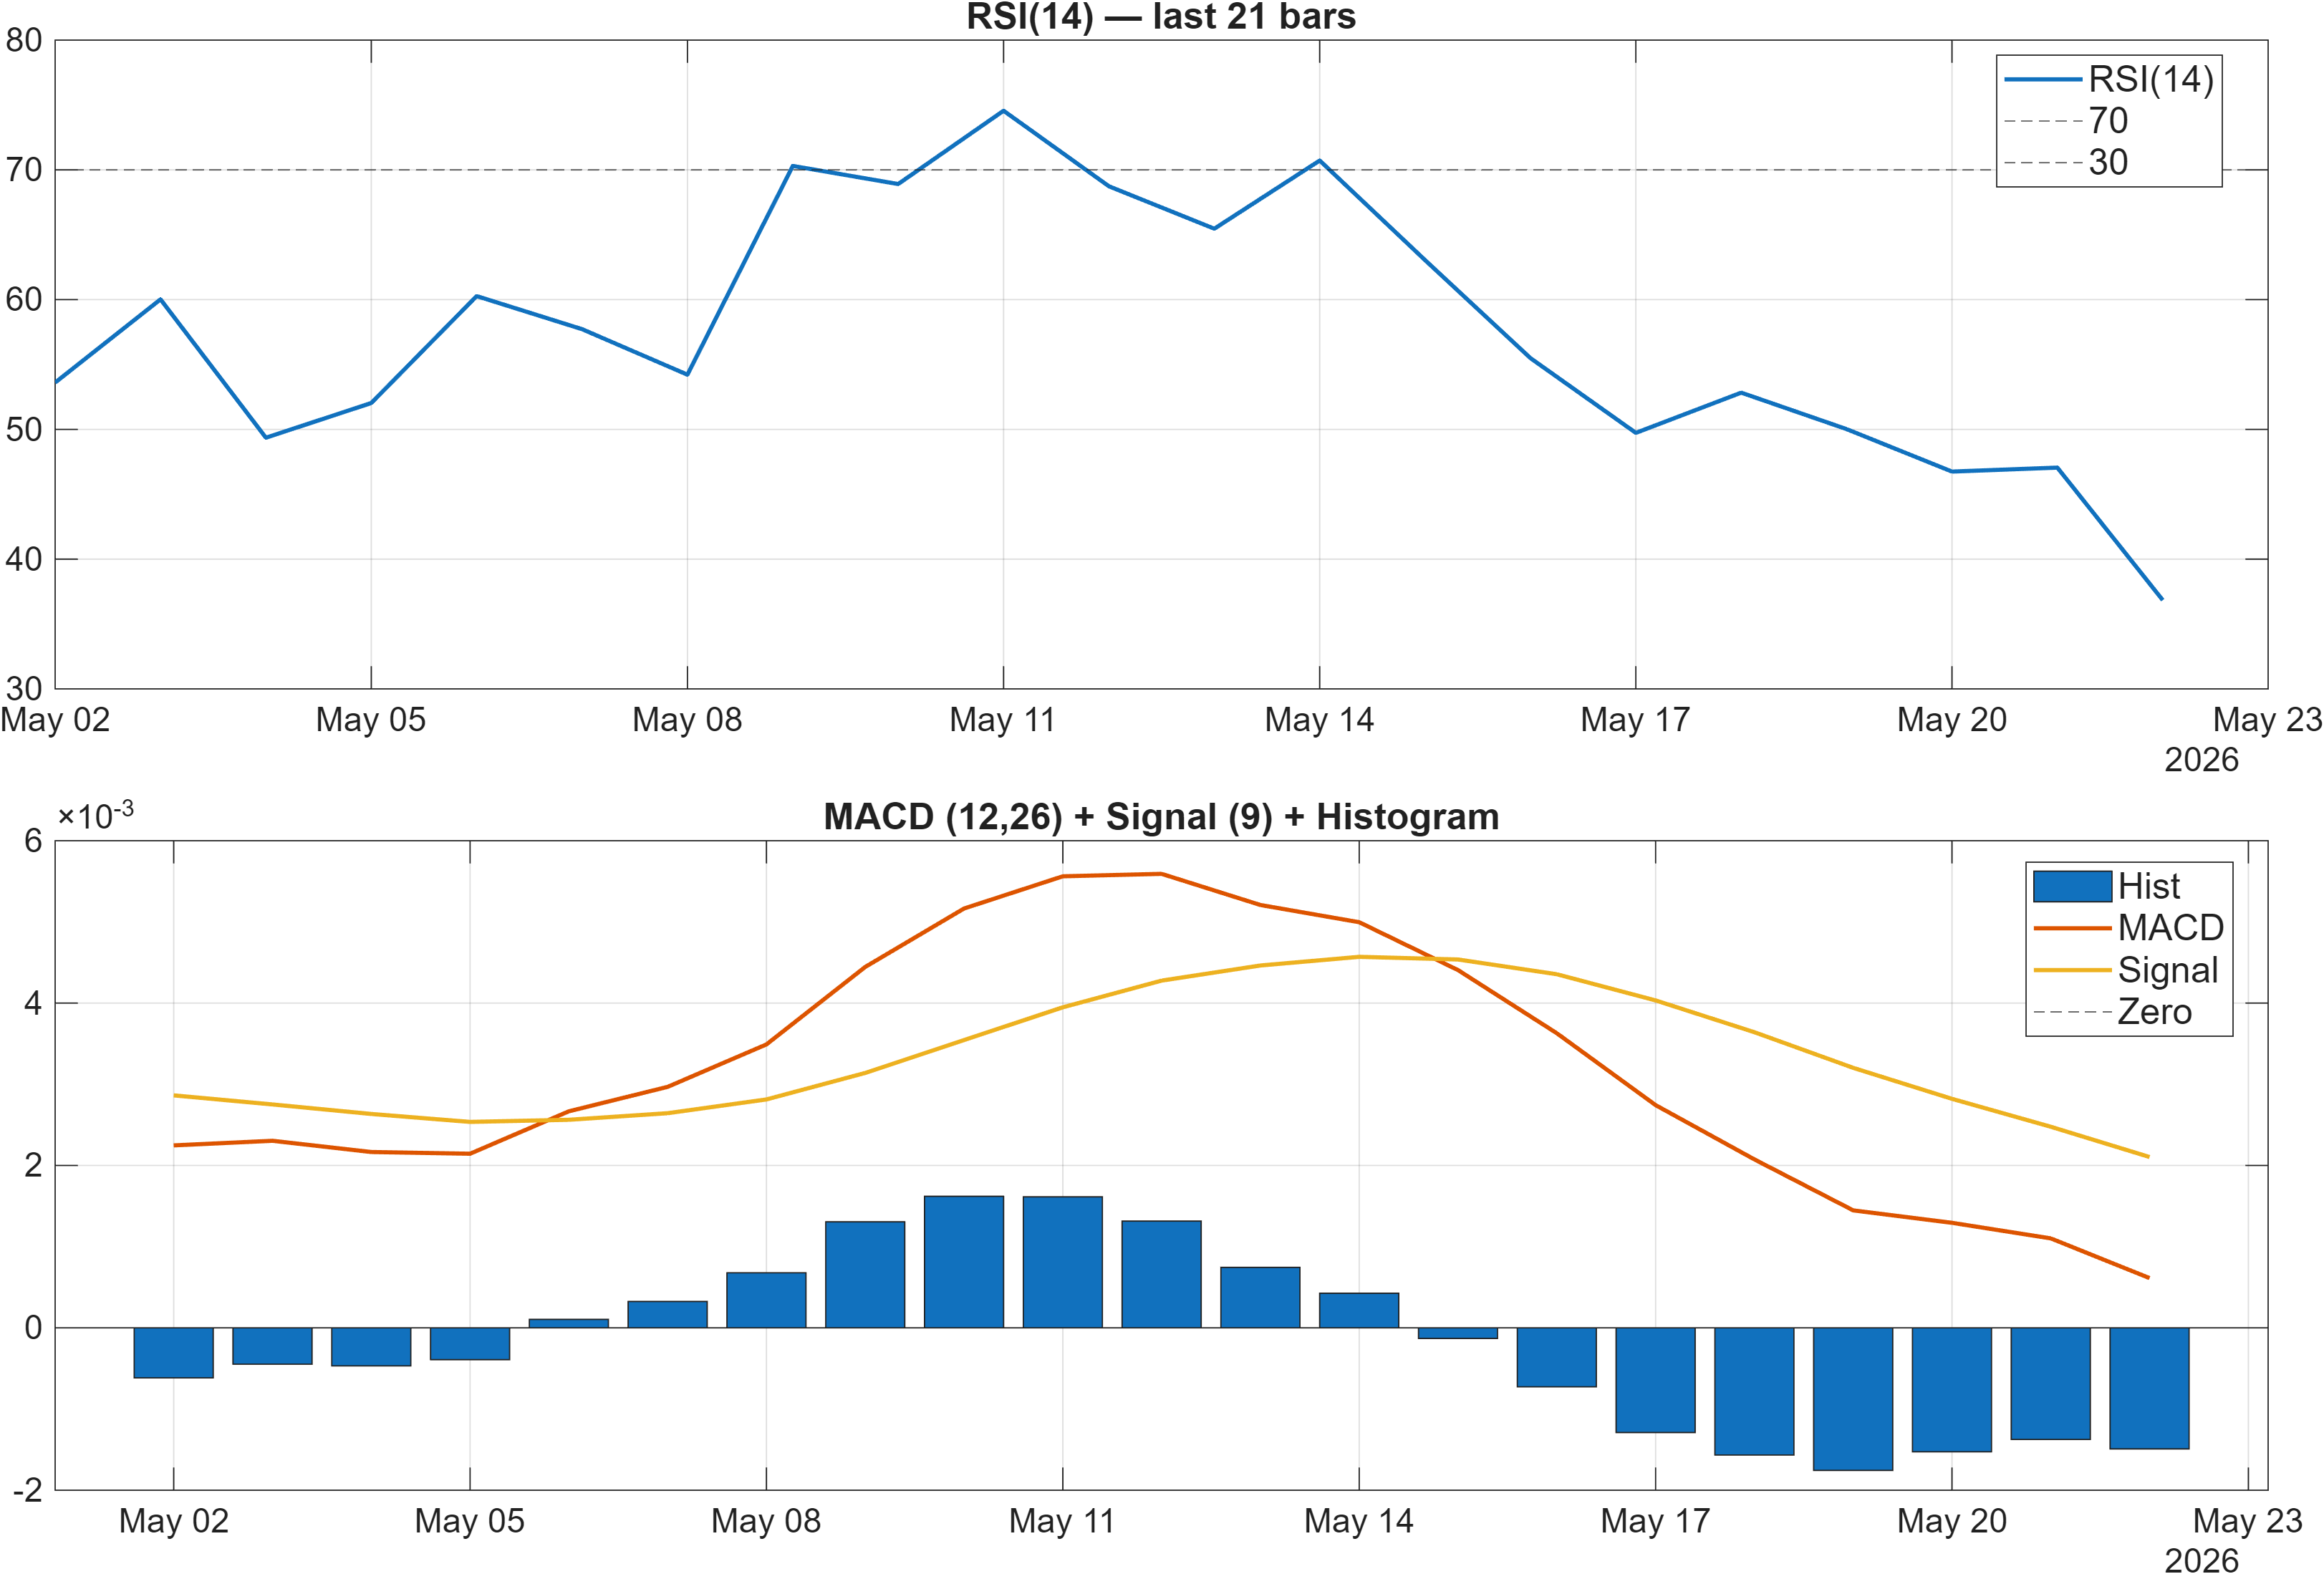
Interpretation: RSI bias = Bearish, MACD hist = -0.0015.
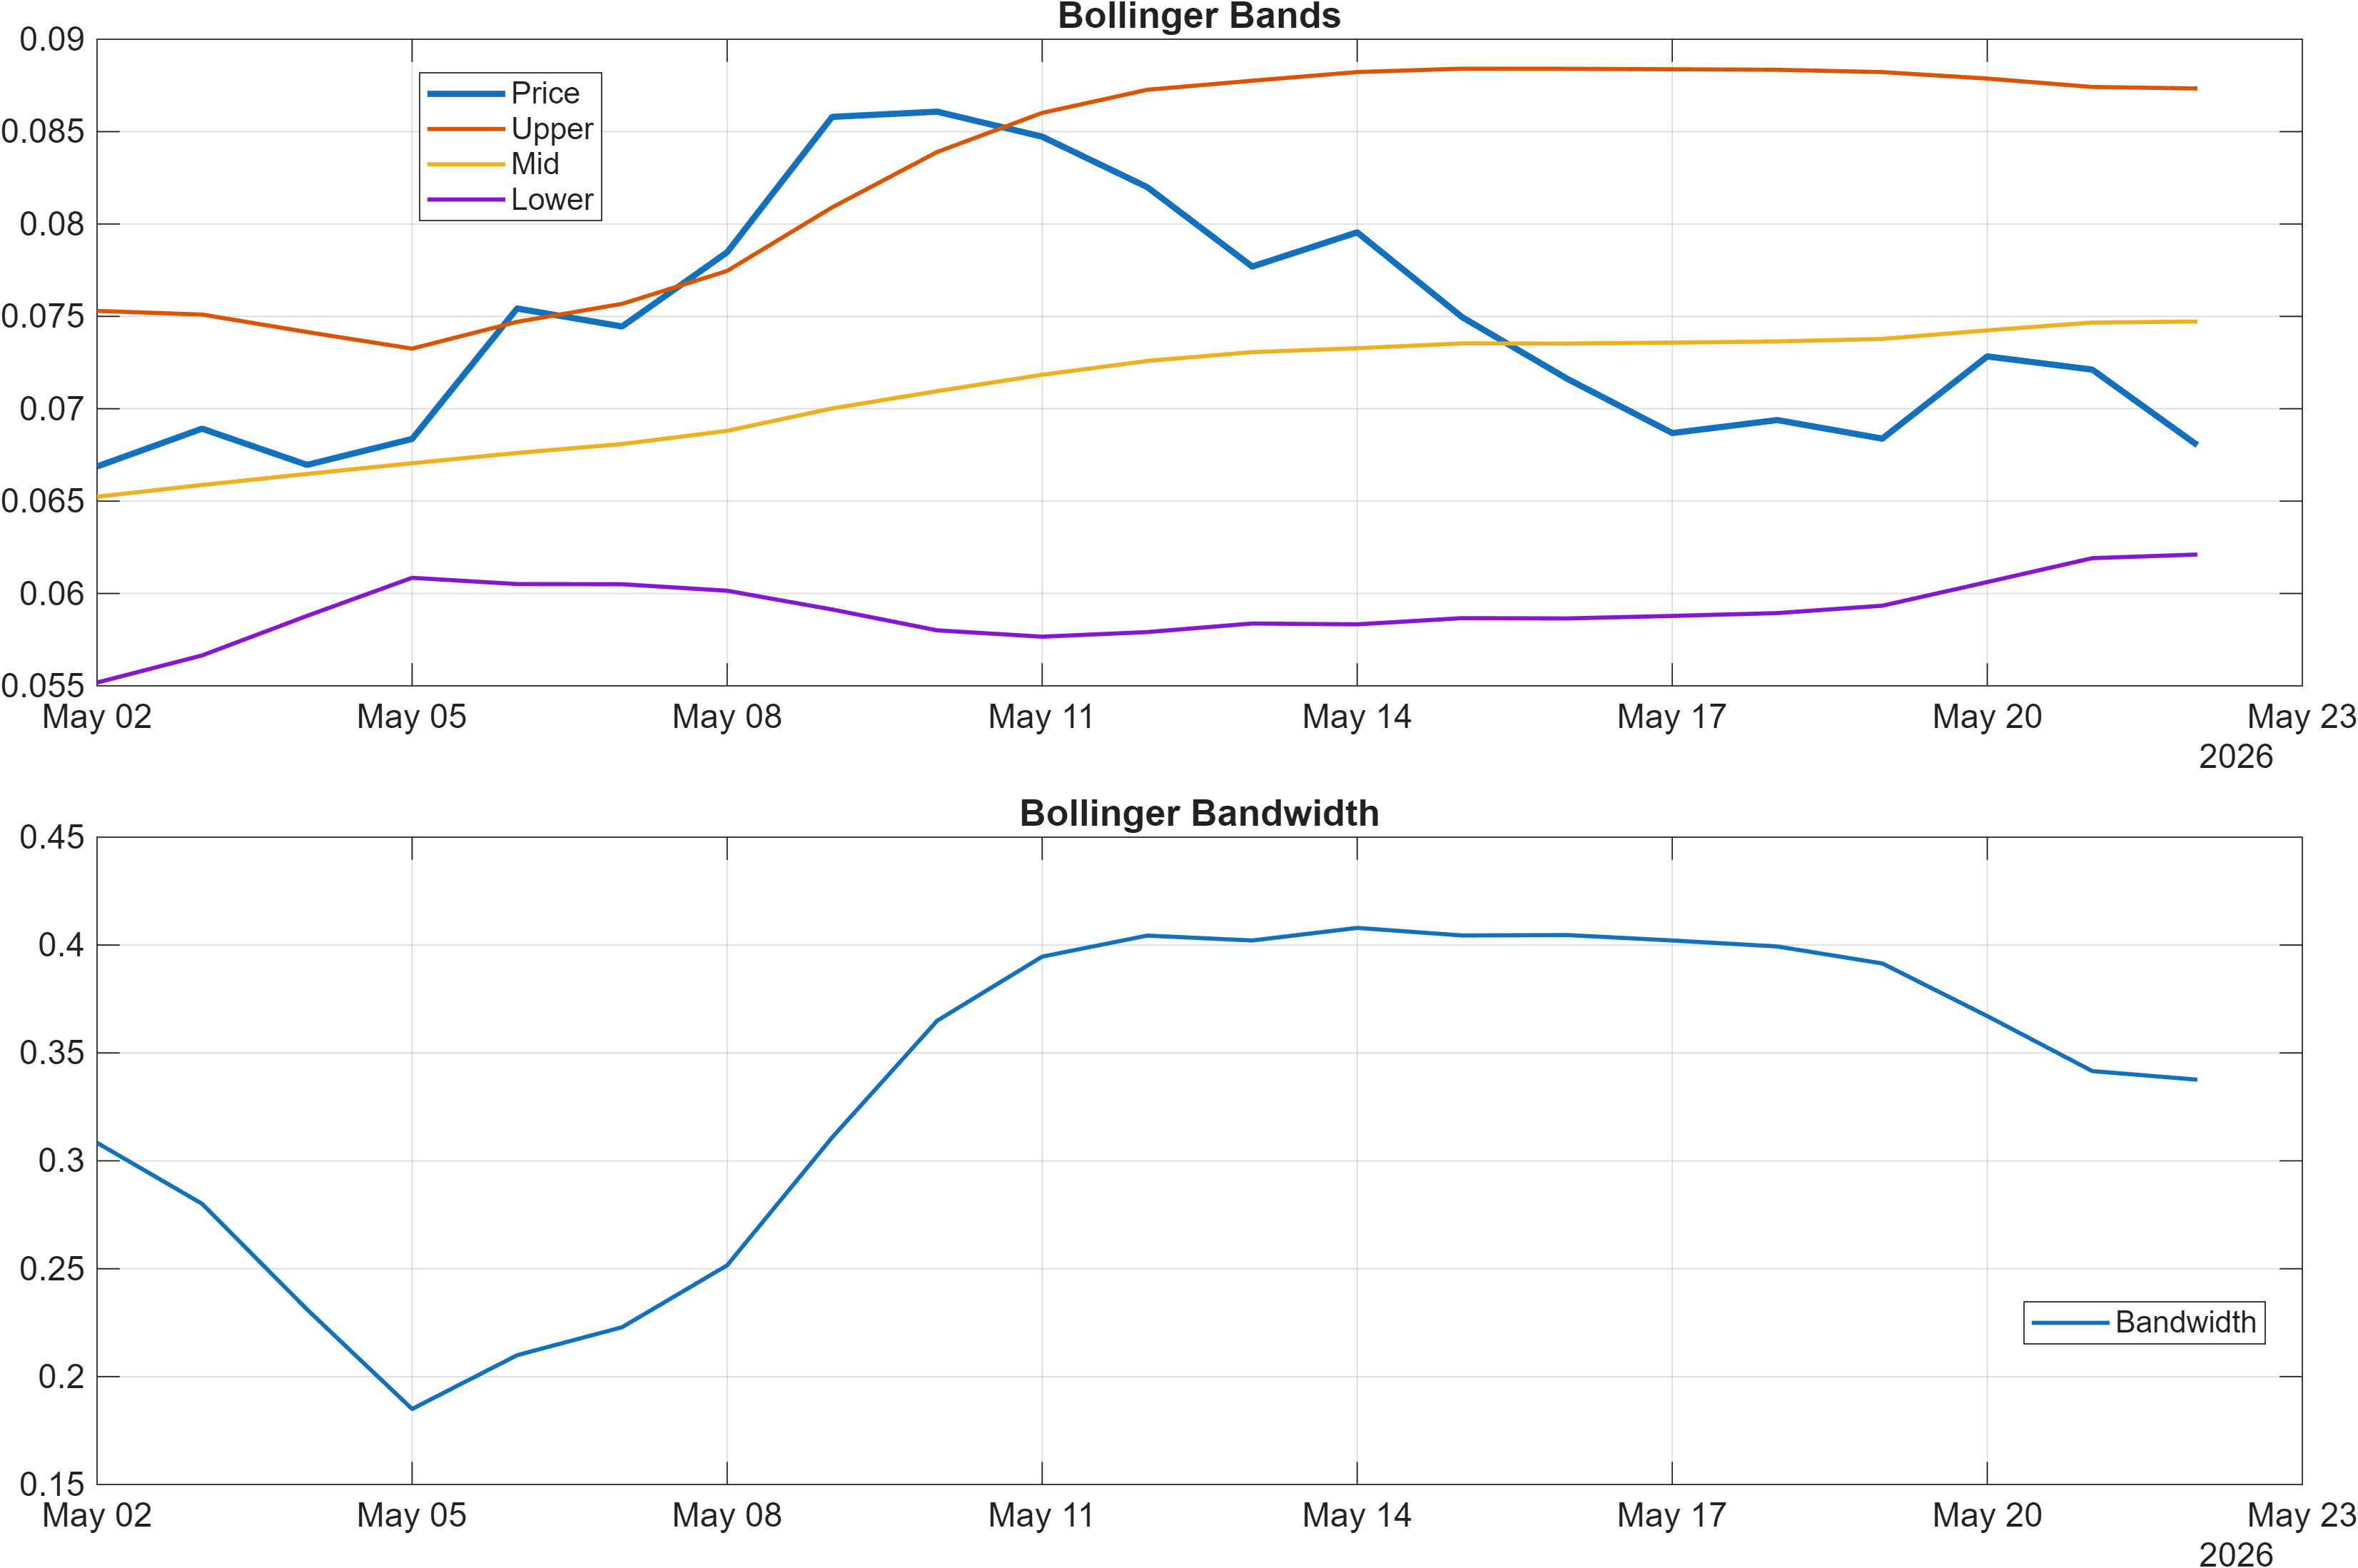
Interpretation: Bandwidth (volatility regime) latest = 0.3376.
Momentum undercut: bearish impulse with a defined volatility backdrop
Momentum indicators are presently skewed to downside impulse. The dashboard flags RSI bias = Bearish, and the MACD histogram is -0.0015, indicating negative momentum pressure rather than a confirmed upside rotation. In the 18-signal set, this shows up consistently: RSI(14) = 36.84 (Bearish) and MACD Hist = -0.001491 (Bearish). Together, these readings argue that rebounds may face friction until momentum improves and negative impulse begins to fade.
Volatility context is more nuanced. Bollinger bandwidth at 0.3376 is labeled neutral in the signal table, suggesting neither an extreme compression nor an obvious volatility blow-off in this snapshot. That matters because momentum reversals tend to be more durable when they occur alongside a supportive volatility transition (for example, expansion after compression), whereas “normal” bandwidth can coincide with choppy, range-like price discovery.
A key cross-check is whether downside momentum is being accompanied by weak participation. The broader technical stack includes a Vol ROC(20) = -20.18 (Bearish), which leans toward a softer volume impulse. When price momentum is negative and volume change is also negative, it can reflect disengagement rather than aggressive distribution; however, it still reduces the probability of immediate trend acceleration without a new catalyst.
Net: the momentum/volatility dashboard currently does not confirm the strong longer-horizon ranks. That divergence is analytically important because it frames ZEL-USD as a market in repair mode, where confirmation is more likely to come from observable shifts in RSI/MACD behavior than from rank strength alone.
4) Support / Resistance zones
Support ~ 0.0491 | Resistance ~ 0.0813
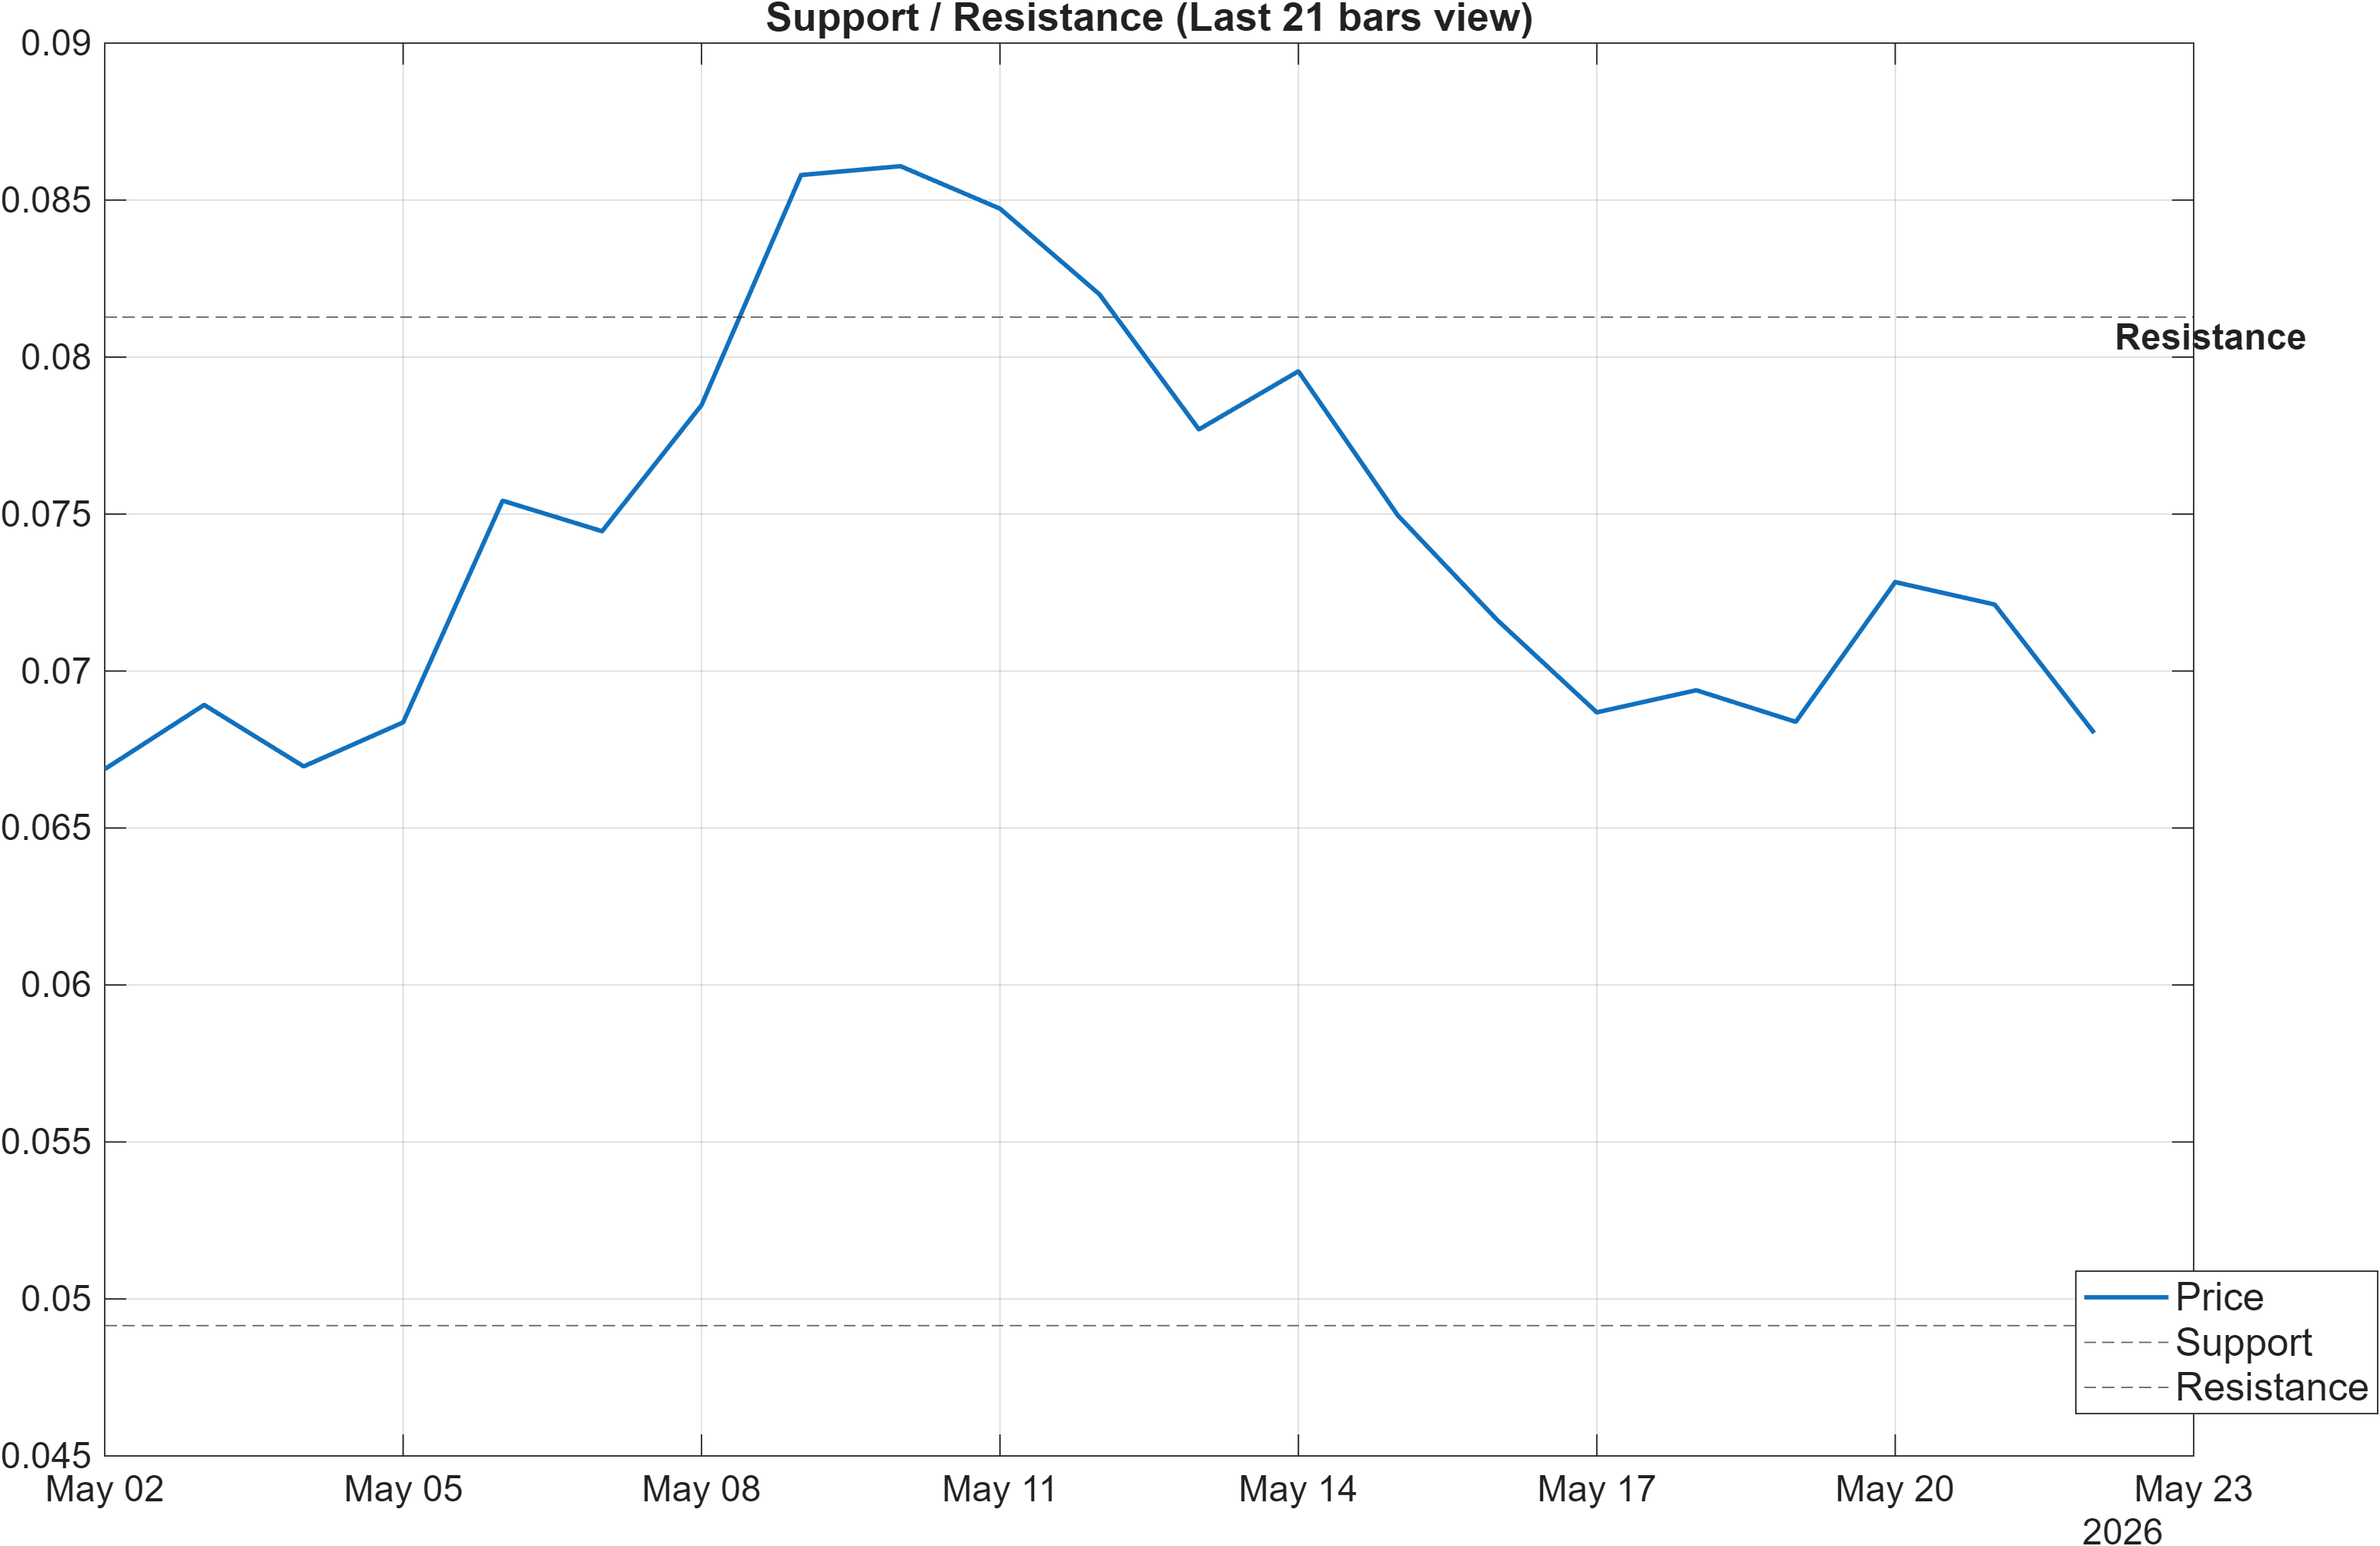
Scenario view: Break above resistance with volume → continuation. Close below support → signal deterioration risk.
Decision zones: separating continuation from deterioration risk
The level structure is tight and actionable: support ~0.0491 and resistance ~0.0813. With near-term momentum soft (negative MACD histogram and bearish RSI bias), the resistance area functions as a validation threshold—a move above it is less about “touching a number” and more about demonstrating that demand can overcome the current momentum headwind.
The scenario framing is explicitly conditional: break above resistance with volume → continuation. That volume requirement is consistent with other readings in the stack, including the bearish Vol ROC(20) = -20.18, which indicates volume change has not recently been supportive. Without volume confirmation, upside attempts can be prone to retracement, particularly when the intermediate trend signal remains bearish (close below MA50).
On the downside, a close below 0.0491 increases “signal deterioration risk.” This matters because it creates a clear invalidation zone for the longer-horizon constructive ranks (Monthly #9; 3-Monthly #38). In practice, strong longer-horizon ranks can persist through volatility, but repeated closes below support would tend to pull trend and momentum indicators into deeper bearish alignment, reducing the probability that the long-horizon profile holds.
A useful additional context from the signal table is that “MedPx vs Support” is 0.02161 (Bullish), implying the median price reference remains positioned above the identified support zone in a way that is currently interpreted as constructive. That constructive micro-signal, however, sits alongside broader bearish momentum, reinforcing that levels may define the market’s next resolution more than directional conviction does at this moment.
5) Quant Technical Dashboard (18 Signals)
KGNAI AI Technical Analysis Score (Deep Reinforcement Learning): Rank #300 out of 800 (Rank 1 represents the strongest technical positioning and a higher probability of favorable price behavior. As ranks increase toward the maximum, the probability of favorable outcomes weakens and bearish positioning becomes more dominant.) | Label: Neutral | Score: 0.250
18-Signal Technical Confluence Score: -0.444 (Bearish)
Overall Technical Score (18-signal confluence + DRL rank blend): -0.236 (Neutral)
Note: The blended score reflects signal strength weighted against broader AI technical ranking, which may temporarily diverge.
Blended technical score breakdown: -0.236 (Neutral | Bull 3 / Bear 11 / Neutral 4)
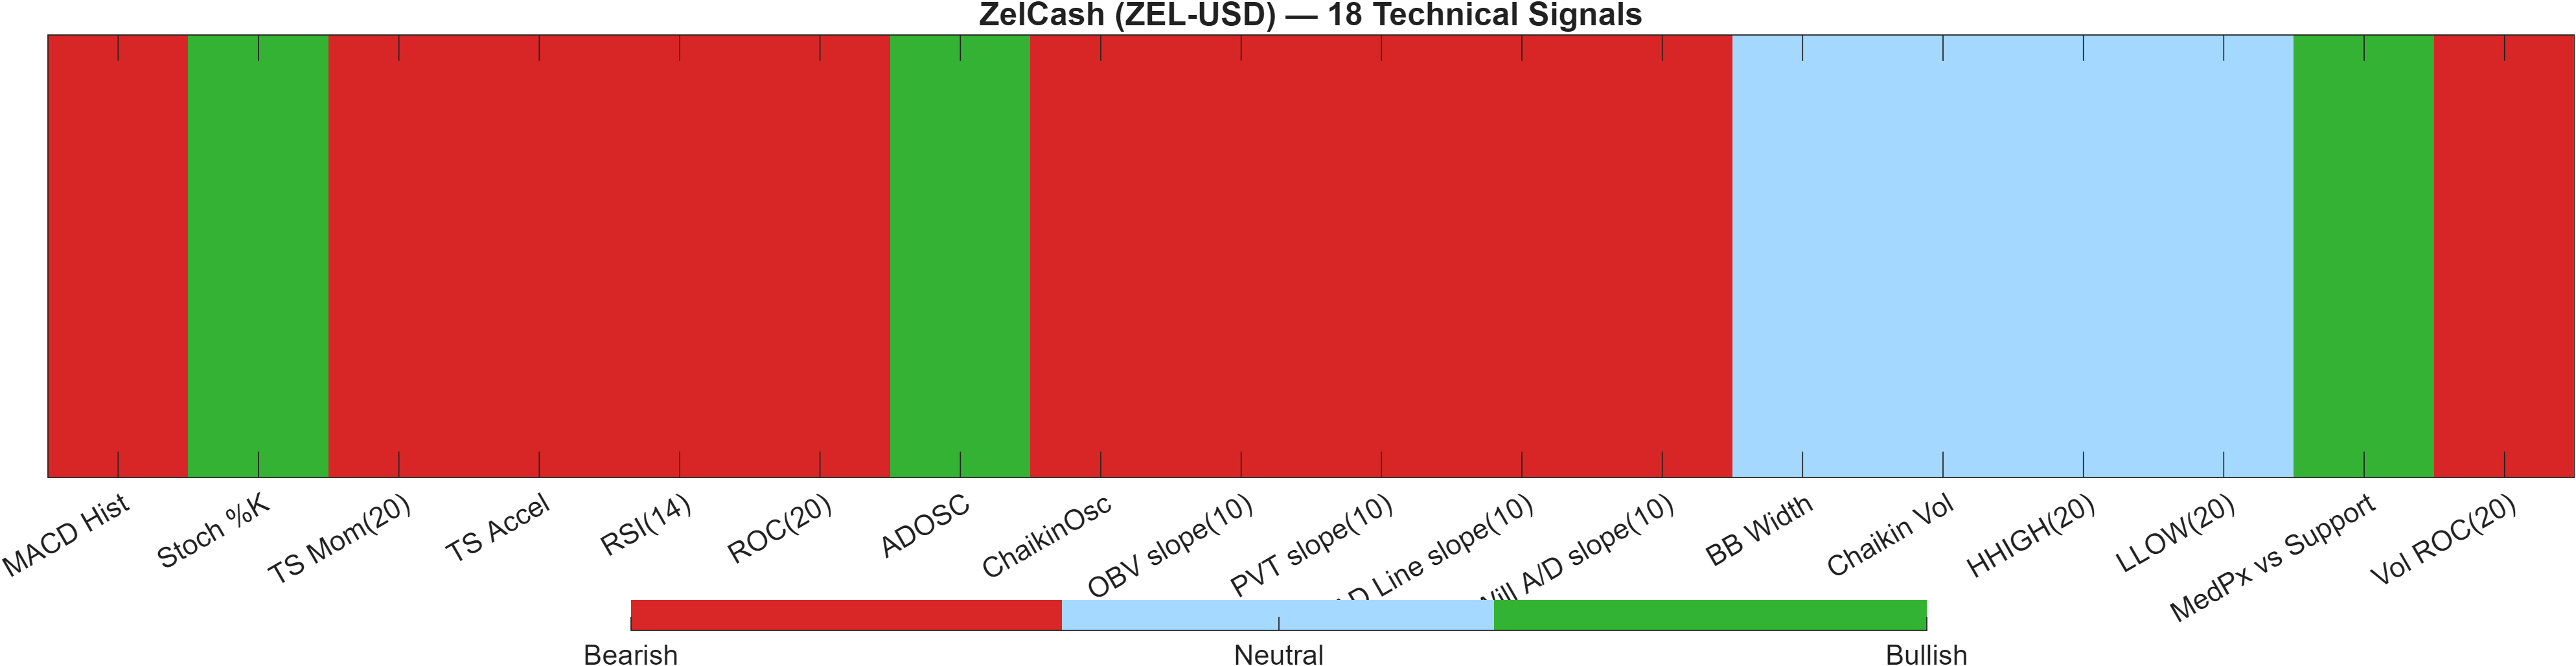
Signal table (Bull/Bear/Neutral)
| Indicator | Value | Signal |
|---|---|---|
| MACD Hist | -0.001491 | Bearish |
| Stoch %K | 2.623 | Bullish |
| TS Mom(20) | -0.0008944 | Bearish |
| TS Accel | -0.01481 | Bearish |
| RSI(14) | 36.84 | Bearish |
| ROC(20) | -1.298 | Bearish |
| ADOSC | 15.25 | Bullish |
| ChaikinOsc | -7.568e+05 | Bearish |
| OBV slope(10) | -1.222e+07 | Bearish |
| PVT slope(10) | -5.633e+05 | Bearish |
| AD Line slope(10) | -8.603e+06 | Bearish |
| Will A/D slope(10) | -0.02037 | Bearish |
| BB Width | 0.3376 | Neutral |
| Chaikin Vol | -25.01 | Neutral |
| HHIGH(20) | 0.08832 | Neutral |
| LLOW(20) | 0.06559 | Neutral |
| MedPx vs Support | 0.02161 | Bullish |
| Vol ROC(20) | -20.18 | Bearish |
Interpretation: Indicator-level signals form the base confluence, which is then adjusted using a separate AI-driven technical ranking model. The final technical score summarizes this combined view.
Confluence vs model blend: why the dashboard reads “bearish,” yet overall stays neutral
ZEL-USD’s technical layer is best described as bearish breadth with neutral aggregation. The 18-signal confluence score is -0.444 (Bearish), and the breakdown (Bull 3 / Bear 11 / Neutral 4) shows that bearish signals dominate the indicator set. Momentum and trend-derived components such as ROC(20) = -1.298, TS Accel = -0.01481, and TS Mom(20) = -0.0008944 lean consistently negative, suggesting persistence in downside impulse rather than a completed reversal.
Yet the overall technical score is -0.236 (Neutral) because it blends confluence with a separate AI technical ranking. The DRL component places ZEL-USD at Rank #300 out of 800 with a 0.250 score and a Neutral label, dampening the bearish signal stack. This divergence is analytically valuable: it implies that while many classical indicators are flashing risk-off, the broader pattern-recognition model does not classify the technical state as deeply impaired relative to the universe.
Participation metrics add texture to that caution. Several volume/flow slopes are bearish—e.g., OBV slope(10) = -1.222e+07 and PVT slope(10) = -5.633e+05—which often indicates that rallies may lack sustained sponsorship. Offsetting this, there are selective bullish pockets such as Stoch %K = 2.623 (Bullish) and ADOSC = 15.25 (Bullish), consistent with the idea of potential short-term oversold dynamics inside a still-fragile broader momentum setup.
6) News sentiment + extractive gist
Note: Instrument-specific news matches were not found, so the digest includes broader market/sector headlines. Links are provided for verification.
Sentiment score (avg): 0.024 | Positive: 19% | Neutral: 69% | Negative: 12%
KGNAI AI News Sentiment Score (normalized -1 to +1): Not available (as of —) | Label: Not available | Overall news score: 0.02
Positive Developments
Recent coverage across major financial outlets indicates a cautiously constructive narrative in parts of the broader crypto ecosystem, even as volatility remains a central theme. Attention has been directed toward institutional market plumbing and flows, including discussions around ETF-related activity that some commentators frame as potentially supportive for patient accumulation during drawdowns. Separately, protocol-level upgrades and maintenance events across major chains continue to reinforce the idea that core infrastructure development is ongoing, which can help stabilize longer-horizon participation even when short-term price action is choppy. In aggregate, this backdrop aligns with ZEL-USD’s longer-horizon relative strength (notably the Monthly rank #9), while not necessarily resolving the near-term technical weakness implied by bearish momentum indicators.
Neutral / Mixed Developments
The dominant informational thread has been market risk framing rather than asset-specific catalysts. Commentary has mixed macro-rate expectations, security considerations, and general reflections on crypto’s role as a hedge—often without a consistent directional conclusion. This tone fits the measured sentiment mix: 0.024 average sentiment with a heavy 69% neutral share suggests that news flow is currently more context-setting than decisively trend-driving. For ZEL-USD specifically, the lack of instrument-matched headlines means this section should be treated as background that may influence overall risk appetite rather than as a direct driver of ZEL-USD price discovery.
Negative / Risk Signals
Risk-oriented coverage has emphasized liquidation dynamics, episodic drawdowns in larger benchmark assets, and security risks affecting holders. Broadly risk-off narratives can tighten liquidity conditions across smaller tokens and alt pairs, which can amplify sensitivity to technical levels such as support ~0.0491. In addition, reports highlighting vulnerabilities (from operational security incidents to market-structure stress during sharp moves) can reinforce cautious positioning when technical confluence is already weak, as reflected in the -0.444 bearish 18-signal score. The net effect is not a deterministic bearish call, but a reminder that downside tails can widen when sentiment and momentum align negatively.
What to monitor next
- Whether sentiment remains near-neutral (avg 0.024) or shifts toward a more directional skew as broader crypto volatility evolves.
- Any sustained change in flow conditions that would complement a push through 0.0813 “with volume.”
- Whether market risk narratives coincide with closes that test or break 0.0491.
Snapshot: AI Rank (Short–Mid–Long): Mixed (Bullish tilt) (Neutral–Bullish–Bullish) · Technical Confluence: Bearish · Key Levels: Support ~0.05 | Resistance ~0.08 · News Sentiment: Neutral
7) Sources
Not available in the provided data.
You may also like: How KGNAI AI ranks instruments across global markets
Disclaimer: KGNAI provides AI-generated analytics and educational market commentary only. This is not financial advice. Markets involve risk. Always do your own research.