
MAI (MIMATIC-USD) — MiMatic (USD) Technical State on 29-May-2026: Neutral Confluence with Short-Term Rank Strength
MAI (MIMATIC-USD) currently presents a mixed, range-oriented profile where ranking strength in the very near term contrasts with softer technical structure. The Daily rank sits at #1 out of 800, while the Weekly (#218), Monthly (#232), and 3-Monthly (#291) placements remain neutral, suggesting the short-term improvement has not yet translated into sustained cross-horizon leadership. Trend framing is still challenged: the close vs MA50 and MA50 vs MA200 are both flagged bearish, while momentum signals split—RSI(14) at 38.89 leans risk-off even as MACD hist near 0.0002 indicates only marginal positive drift. Volatility is moderate rather than expanding, with Bollinger bandwidth at 0.0487. The key decision area remains tightly defined by support ~0.9399 and resistance ~0.9991, making confirmation criteria more dependent on level behavior than on broad trend persistence.
Key Takeaways
- Rank stance: Short-term Neutral; Mid-term Neutral; Long-term Neutral (Daily rank #1 contrasts with Weekly #218 / Monthly #232 / 3-Monthly #291).
- Technical confluence: Neutral (18-signal confluence 0.000; blended overall technical score -0.170).
- Key levels: Support ~0.9399 and Resistance ~0.9991 define the near-term decision band.
- News sentiment bias: Neutral (avg 0.000; Positive 25% / Neutral 50% / Negative 25%).
- Confirmation / invalidation: A break above 0.9991 with volume supports continuation conditions; a close below 0.9399 raises deterioration risk.
What KGNAI Measures
KGNAI evaluates assets using large cross-sectional datasets built from millions of structured data points. Inputs incorporate fundamental metrics, technical structures, and systematically processed news sentiment. Statistical models, machine learning, and AI frameworks are used to assess relative positioning, signal alignment, and probabilistic behavior across broad universes.
How to Read This Report
- Ranks are comparative across the tracked universe, not absolute price targets.
- Confluence reflects alignment among independent signal groups.
- Support/resistance levels are probabilistic decision zones, not guarantees.
- Sentiment provides contextual bias within the broader analytical framework.
1) KGNAI AI Analysis
Region: CRYPTO
Total universe size: 800 ranked instruments
- Daily rank: #1 out of 800 — Bullish
- Weekly rank: #218 out of 800 — Neutral
- Monthly rank: #232 out of 800 — Neutral
- 3-Monthly rank: #291 out of 800 — Neutral
The rank stack highlights a time-horizon asymmetry. The Daily rank #1 places MAI at the very top of the tracked universe for short-window behavior, but the Weekly (#218), Monthly (#232), and 3-Monthly (#291) readings remain firmly neutral. That configuration commonly indicates either (a) a very recent shift that has not persisted long enough to lift higher-horizon composites, or (b) a short-term micro-structure effect that is not yet supported by trend-following measures.
Importantly, KGNAI ranks are probabilistic and cross-sectional: the objective is not to “call” direction, but to identify relative positioning. With 800 instruments in the universe, the difference between a top-of-universe daily placement and mid-pack multi-week placement is analytically meaningful because it can coincide with signal compression—short-term conditions improving while longer-run state variables lag.
The explicit term view remains Neutral across Short-term, Mid-term, and Long-term. In practice, that neutrality is consistent with a market that may be testing a new equilibrium rather than trending decisively. Confirmation is more likely to come from whether price can re-assert above key levels (see support/resistance) and whether momentum gauges (RSI/MACD) migrate from mixed to aligned readings.
Term view: Short-term: Neutral. Mid-term: Neutral. Long-term: Neutral.
Want the full universe and complete rank tables? Unlock full access on KGNAI: https://www.kgnai.com/pricing
2) Price & trend overview
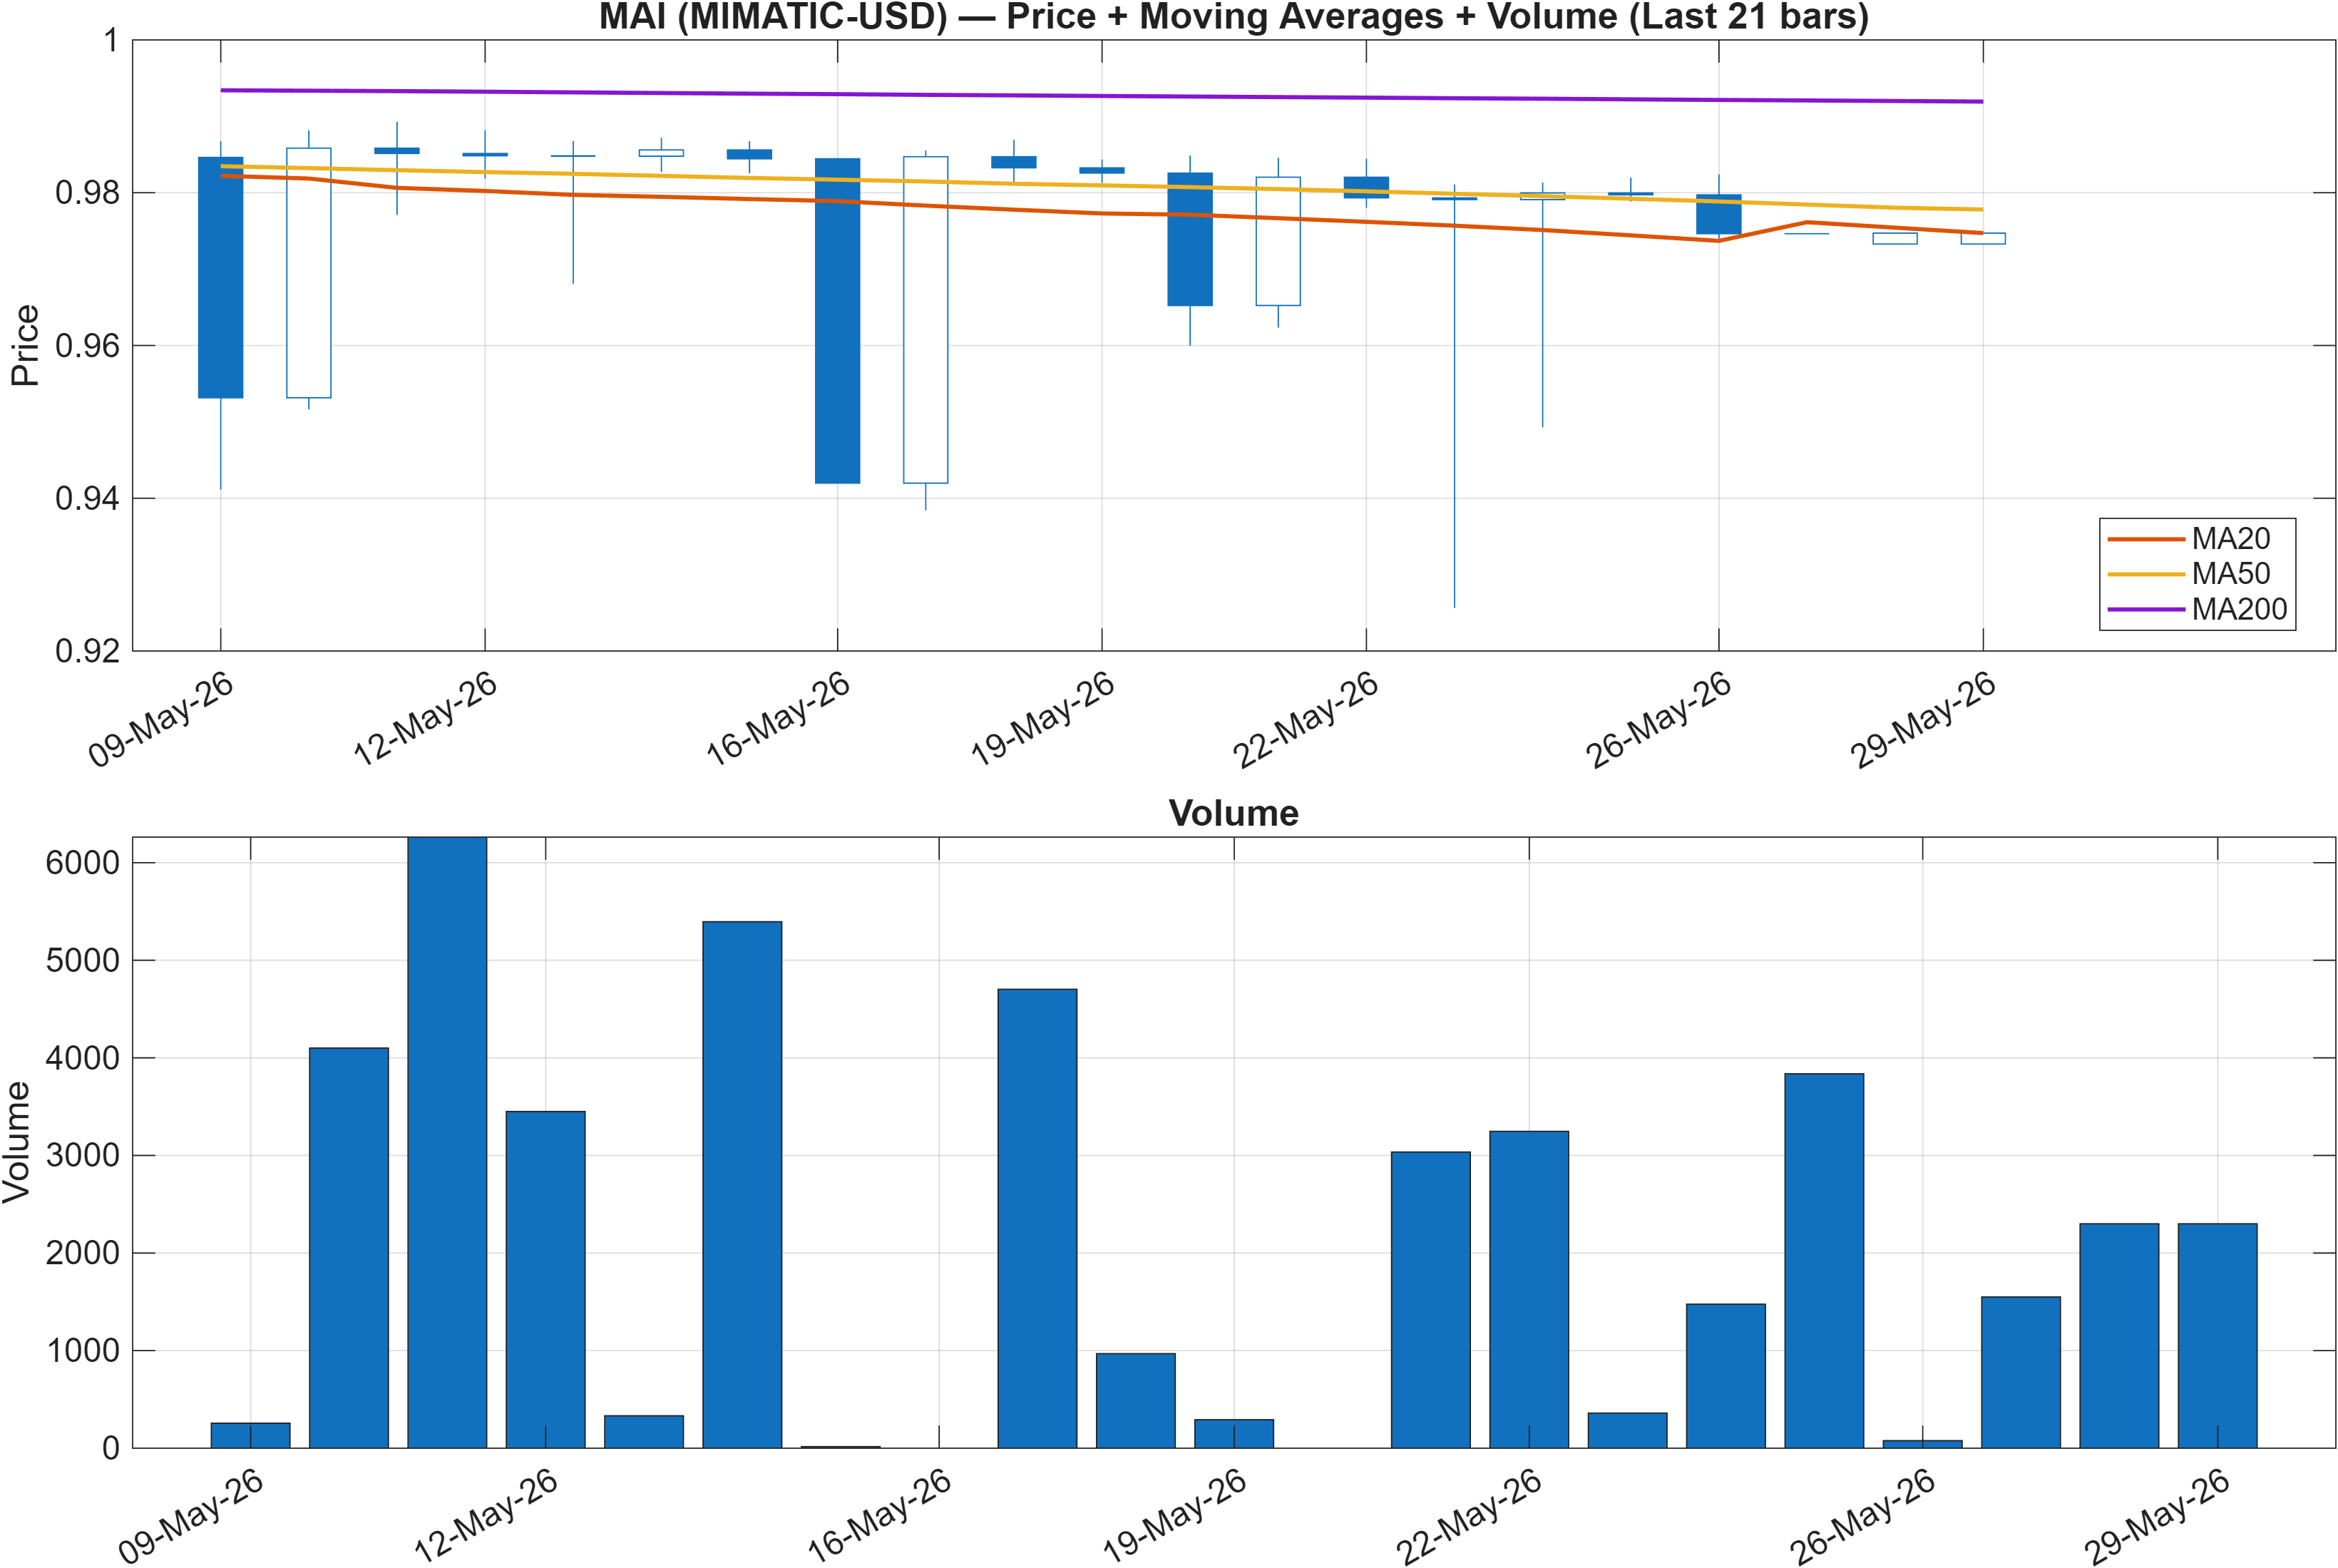
Trend structure remains technically constrained despite the exceptionally strong daily rank. The interpretation flags both close vs MA50 = Bearish and MA50 vs MA200 = Bearish, which is a classic configuration for a market still operating below intermediate and long moving-average control. This does not preclude short bursts of strength, but it does imply that rallies may face overhead friction unless the moving-average slope/position improves.
The more interesting element is the rank/price tension: a top daily rank occurring while moving-average relationships remain bearish often reflects a short-term “repair” attempt—price action can stabilize and improve relative to peers even before the medium-duration trend indicators flip. In that regime, the market frequently becomes more sensitive to nearby decision levels, since trend-following participants are not yet uniformly committed.
This is where cross-confirmation matters: if the market can push toward the resistance ~0.9991 region (Section 4) while momentum stops deteriorating (e.g., RSI moving away from 38.89), the moving-average bearish posture may become less binding. Conversely, if price slips and tests support ~0.9399, the bearish MA state can amplify downside persistence because the prevailing trend template still leans defensive.
Interpretation: Close vs MA50 = Bearish, MA50 vs MA200 = Bearish.
3) Momentum & volatility dashboard
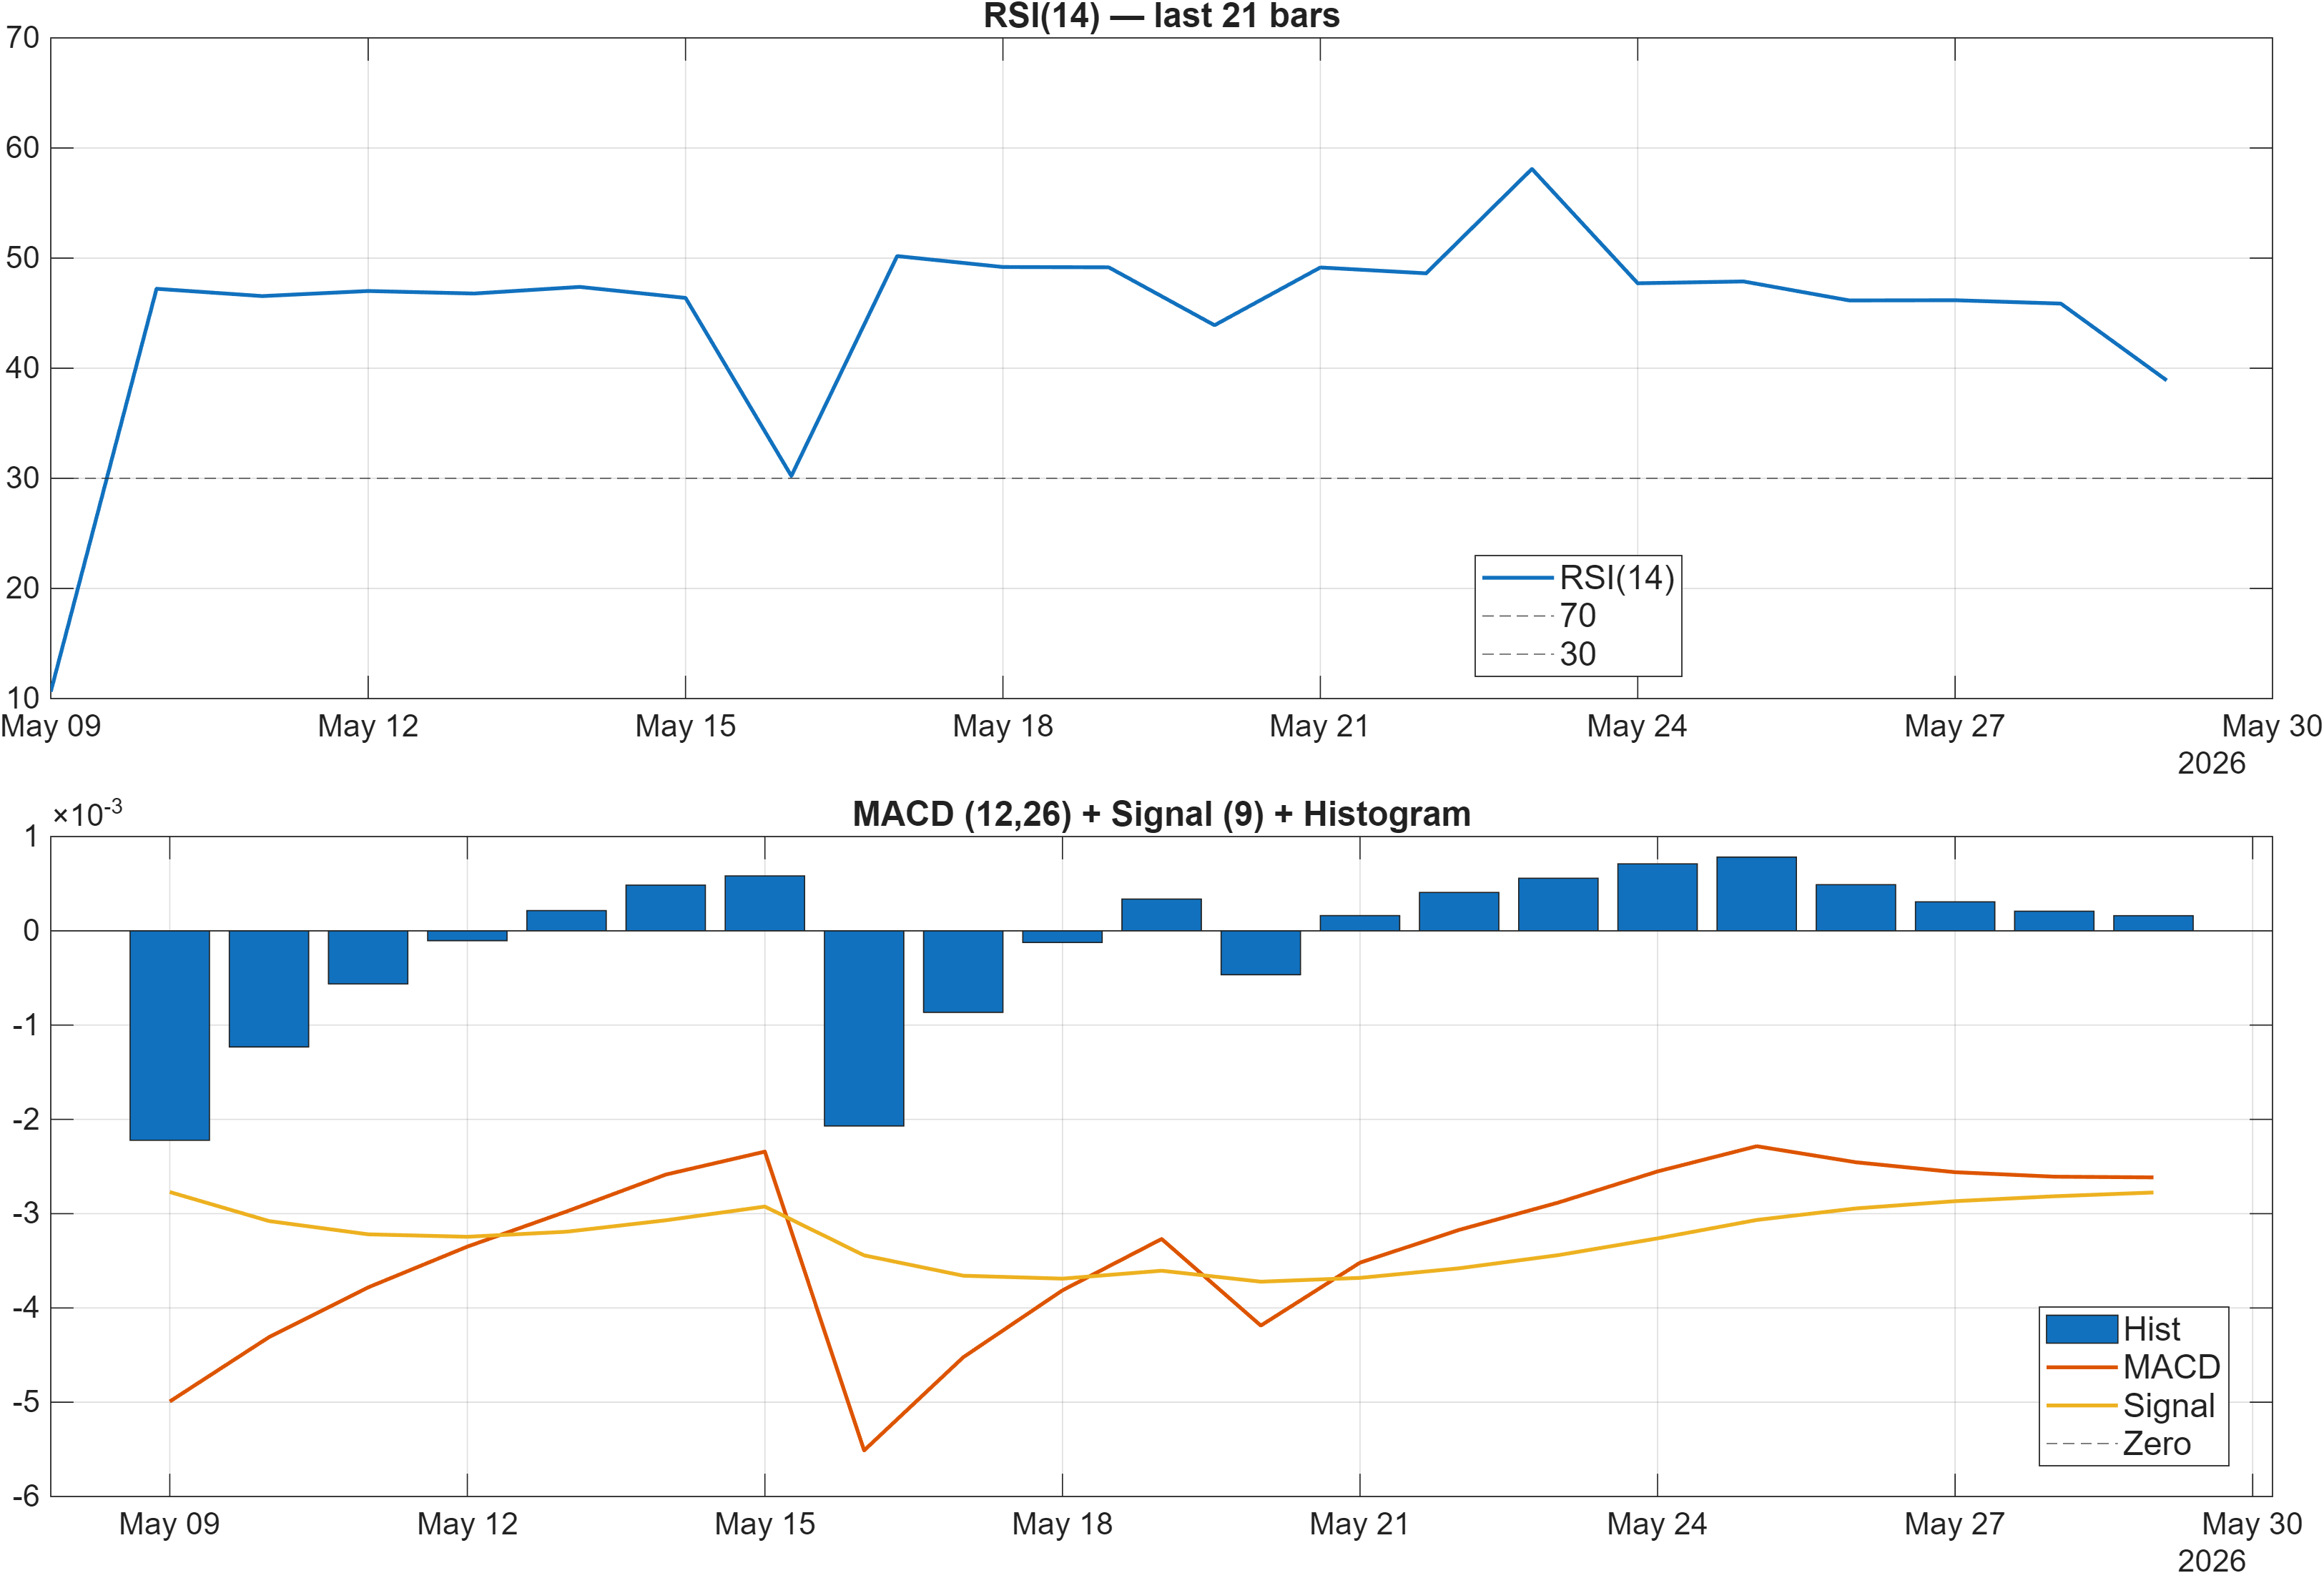
Momentum is currently split rather than synchronized. RSI is explicitly assessed as bearish, with RSI(14) at 38.89, which typically corresponds to weak impulse and a market that has not yet re-established consistent buying pressure. At the same time, the MACD histogram is 0.0002 (and the signal table lists MACD Hist 0.0001603 as bullish), implying incremental improvement in the short-window trend differential.
That combination—bearish RSI with slightly positive MACD histogram—often characterizes an early stabilization phase: downside momentum may be losing force without a clear transition to sustained upside. The signal table supports that interpretation by showing several momentum/price-rate measures still negative (for example, ROC(20) at -3.645 and TS Mom(20) at -0.01113), even as certain accumulation/flow proxies register bullish (e.g., ADOSC 100).
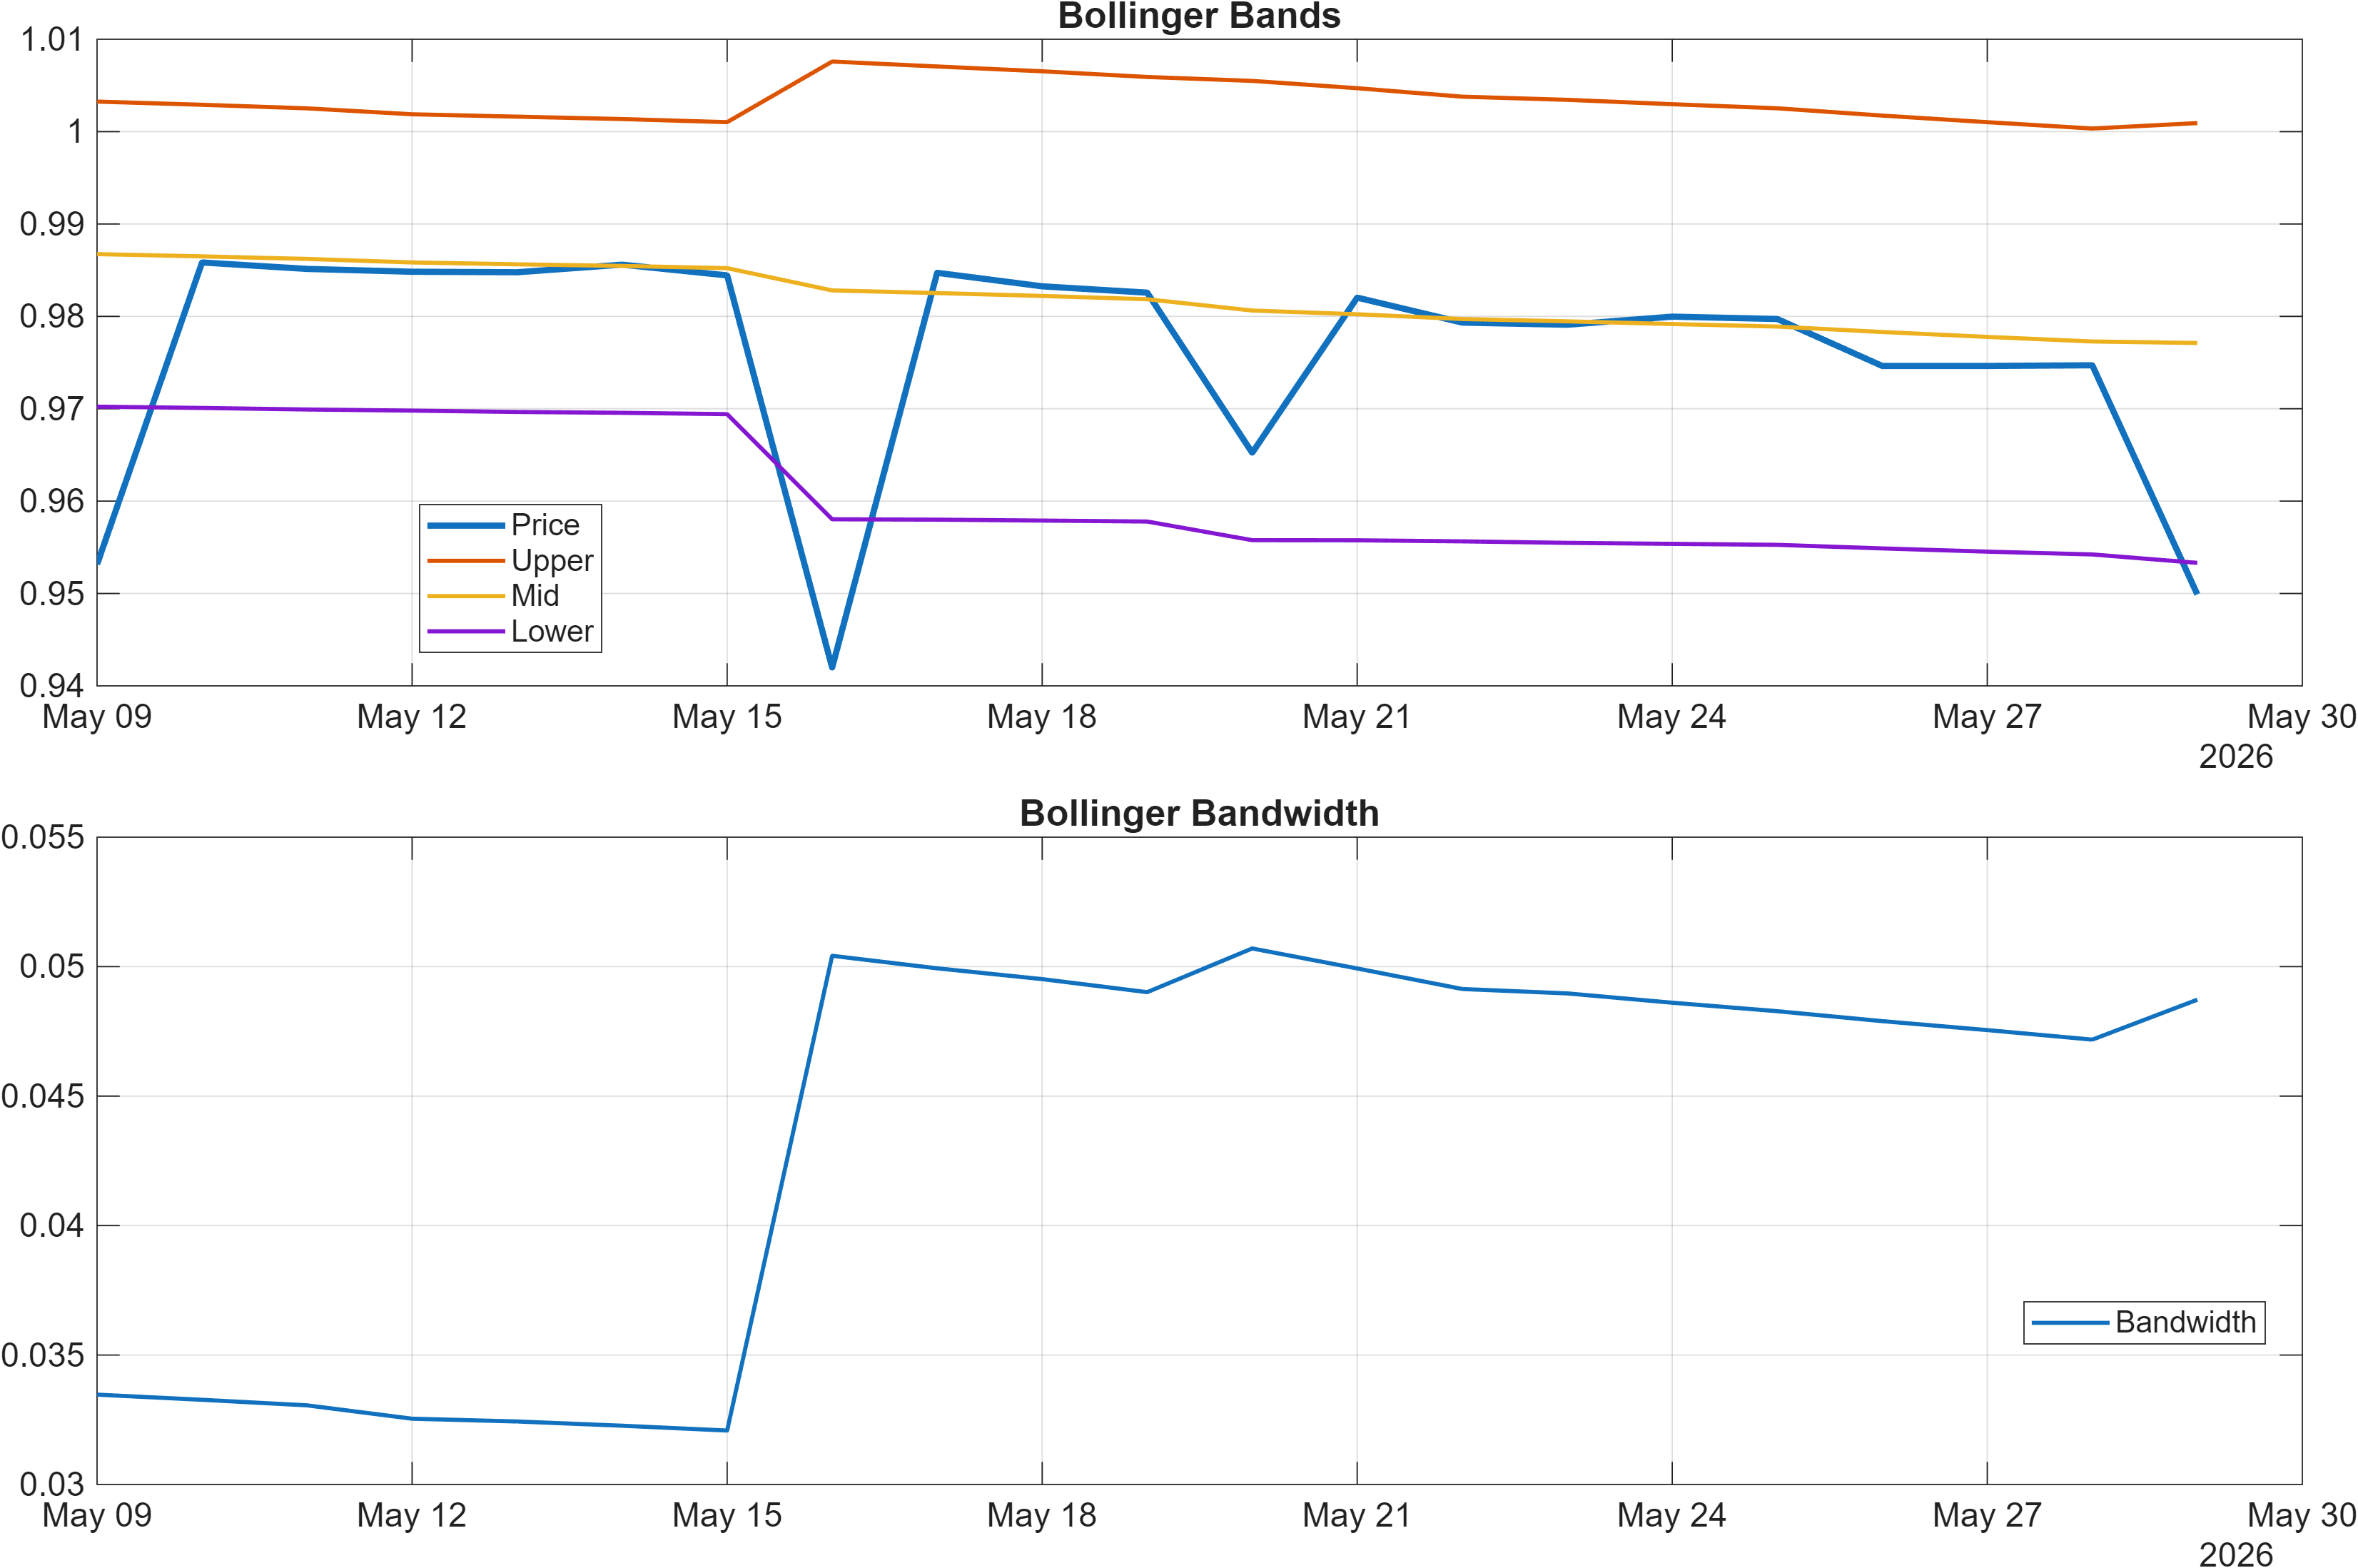
Volatility is not signaling a decisive expansion. The bandwidth at 0.0487 (and BB Width 0.04872 in the signal table) is treated as neutral, consistent with a market in a holding pattern where moves can be mean-reverting around nearby levels. In such conditions, level breaks (support/resistance) typically provide cleaner confirmation than oscillator noise, because the volatility regime itself is not forcing directional follow-through.
Interpretation: RSI bias = Bearish, MACD hist = 0.0002.
Interpretation: Bandwidth (volatility regime) latest = 0.0487.
4) Support / Resistance zones
Support ~ 0.9399 | Resistance ~ 0.9991
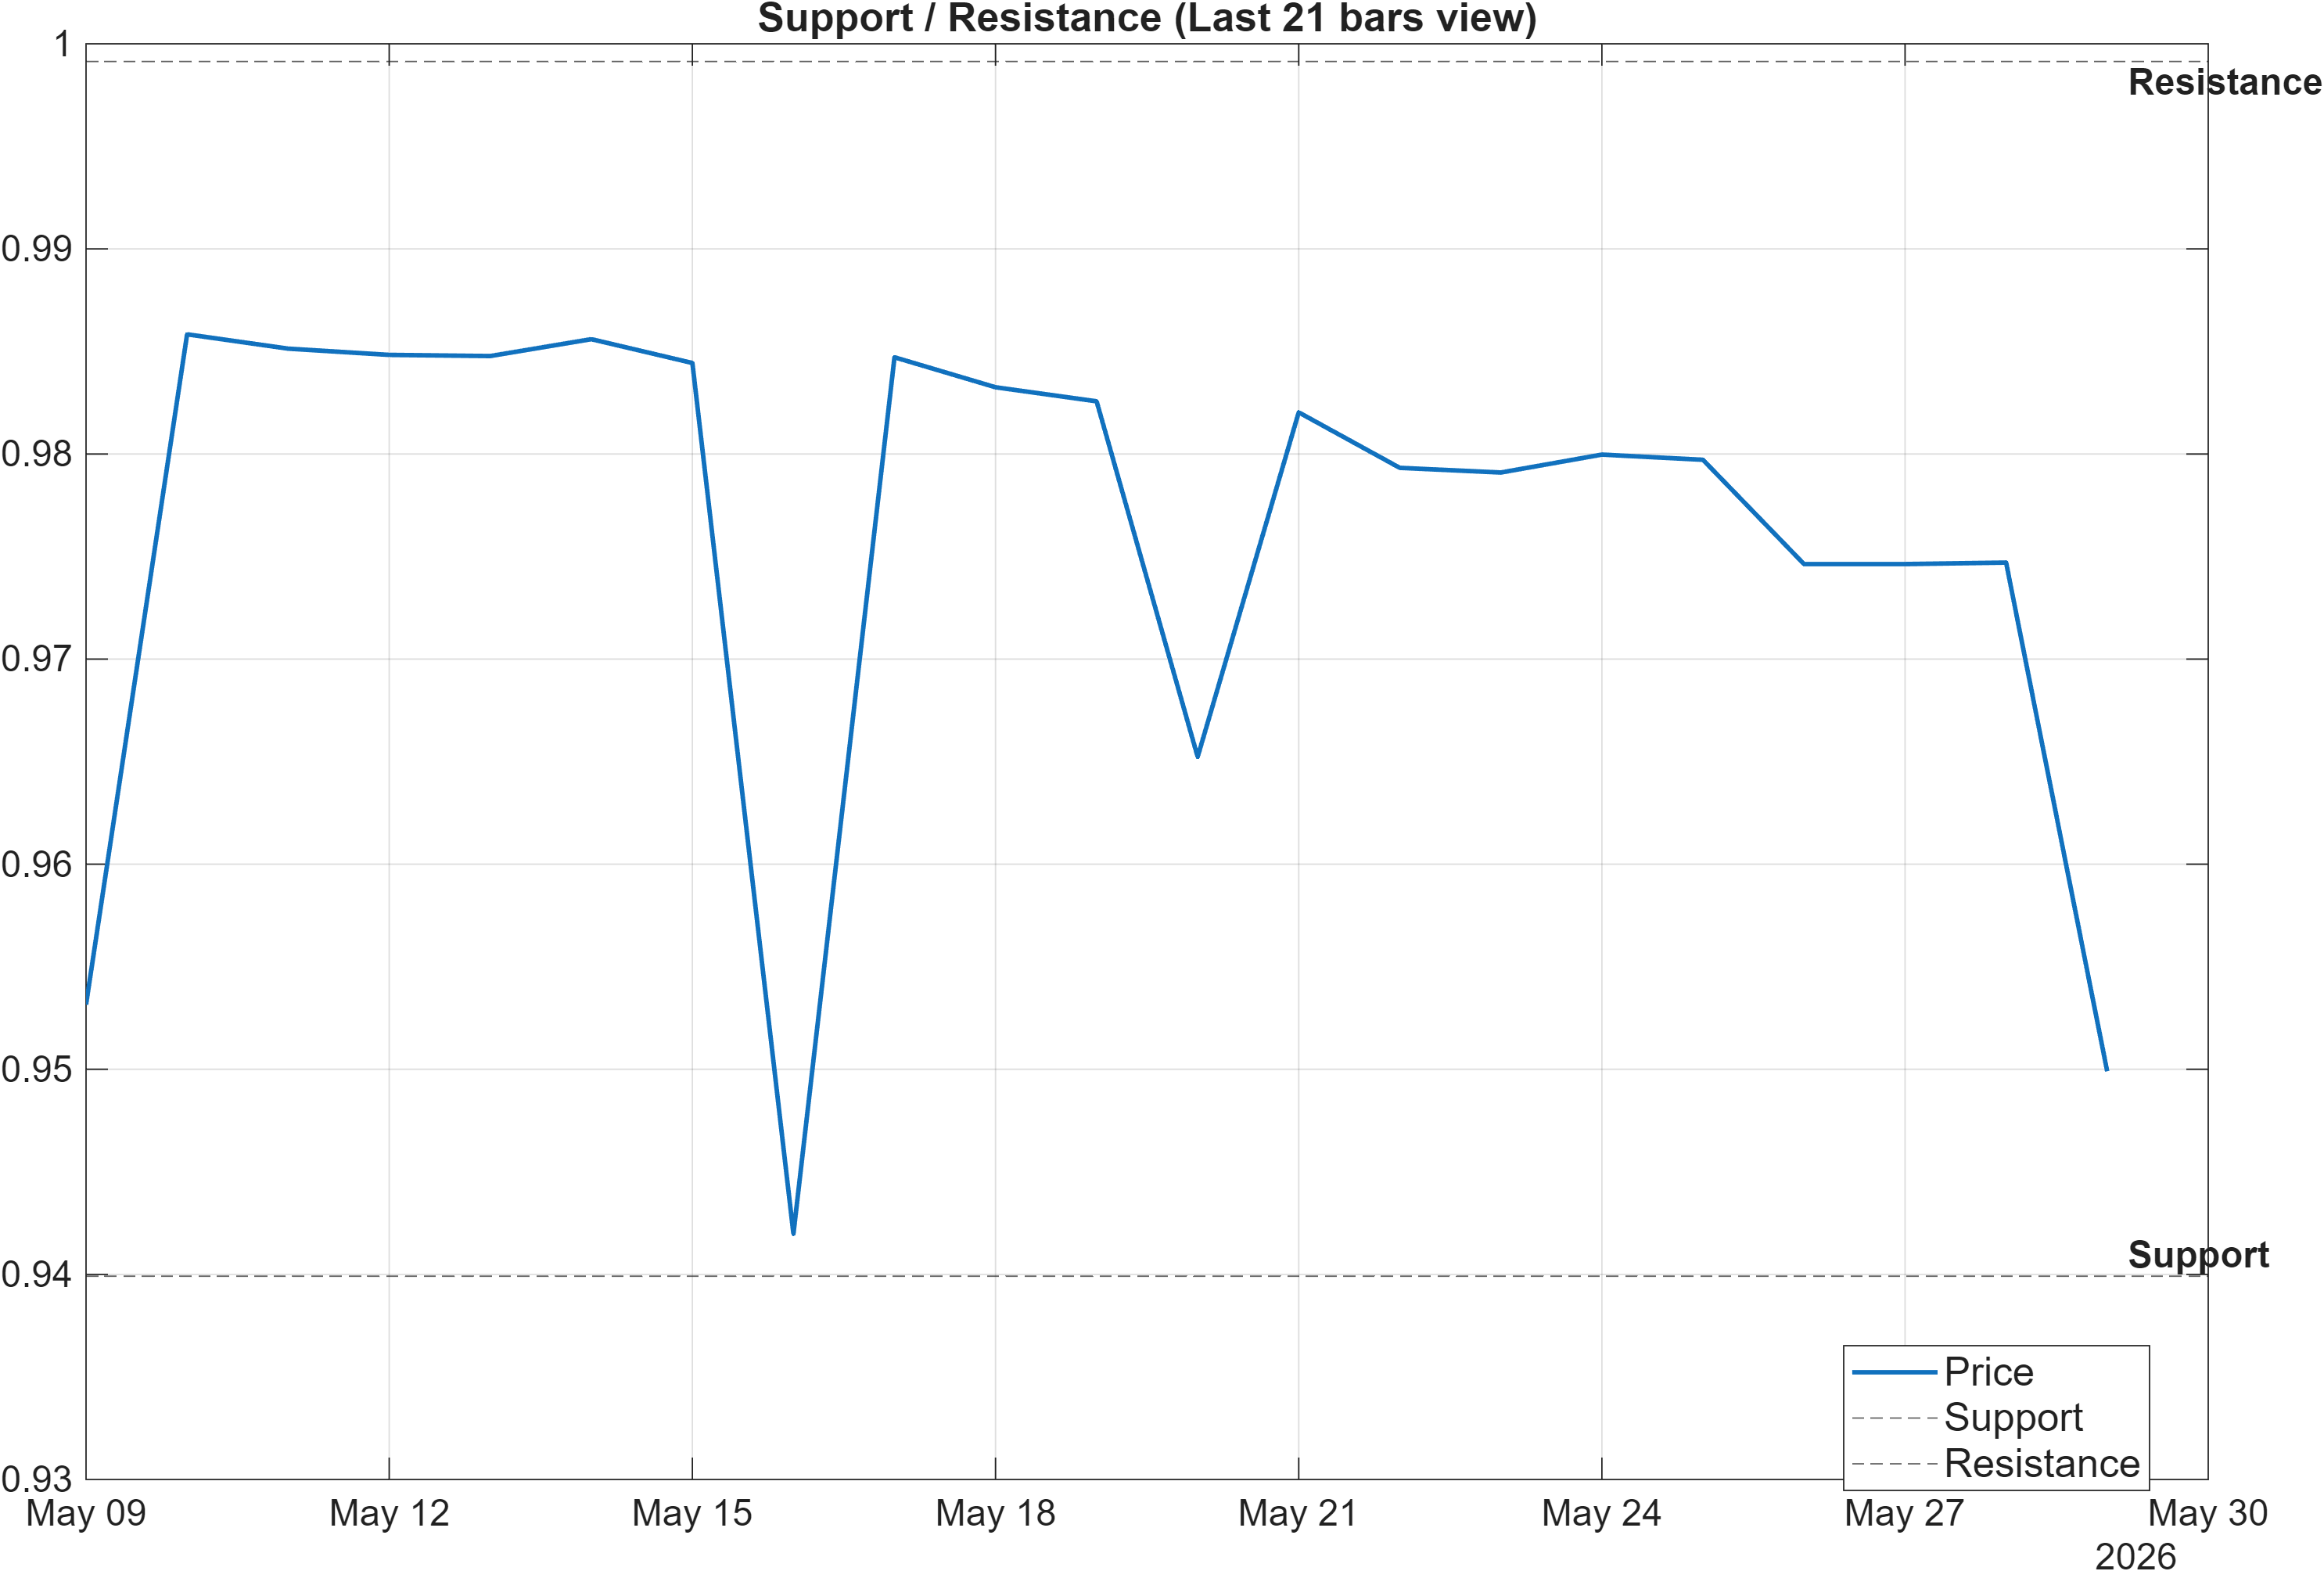
The level map is unusually tight, with support near 0.9399 and resistance near 0.9991, creating a constrained decision corridor. When paired with a neutral volatility regime (0.0487 bandwidth), this often points to a market where positioning outcomes are dominated by acceptance vs rejection around the boundaries rather than broad trend extension.
Structurally, this section is where the earlier divergences can be reconciled. A market can carry bearish moving-average relationships (Section 2) and still deliver a short-lived top daily rank if it is repeatedly defending a nearby support zone. That is consistent with the signal table’s mix: some flow measures are bullish (e.g., AD Line slope(10) 4942), while momentum remains soft (e.g., RSI(14) 38.89 and ROC(20) -3.645).
Because the resistance is close to parity-like territory (0.9991), the quality of any attempt above it matters more than the mere touch. The scenario language in the provided data aligns with institutional practice: break above resistance with volume is the higher-quality continuation condition, while a close below support is a clearer signal of deterioration risk than intraday probing.
Scenario view: Break above resistance with volume → continuation. Close below support → signal deterioration risk.
5) Quant Technical Dashboard (18 Signals)
KGNAI AI Technical Analysis Score (Deep Reinforcement Learning): Rank #627 out of 800 (Rank 1 represents the strongest technical positioning and a higher probability of favorable price behavior. As ranks increase toward the maximum, the probability of favorable outcomes weakens and bearish positioning becomes more dominant.) | Label: Neutral | Score: -0.567
18-Signal Technical Confluence Score: 0.000 (Neutral)
Overall Technical Score (18-signal confluence + DRL rank blend): -0.170 (Neutral)
Note: The blended score reflects signal strength weighted against broader AI technical ranking, which may temporarily diverge.
Blended technical score breakdown: -0.170 (Neutral | Bull 7 / Bear 7 / Neutral 4)
The technical dashboard reads as balanced but not constructive enough to be directional. The 18-signal confluence is exactly 0.000 (Neutral), and the blended overall technical score sits at -0.170 (Neutral), consistent with a market where bullish and bearish inputs offset rather than reinforce. The distribution—Bull 7 / Bear 7 / Neutral 4—supports the idea of a compressed regime rather than a trending one.
A key nuance is the separation between confluence and the reinforcement-learning rank model. The DRL technical rank is #627 out of 800 with a score of -0.567 (labeled neutral), which is weak relative positioning within the technical subset even though the confluence itself is flat. That divergence can occur when individual indicators cancel, but the broader pattern library (used by the DRL model) still classifies the overall setup as less favorable relative to peers.
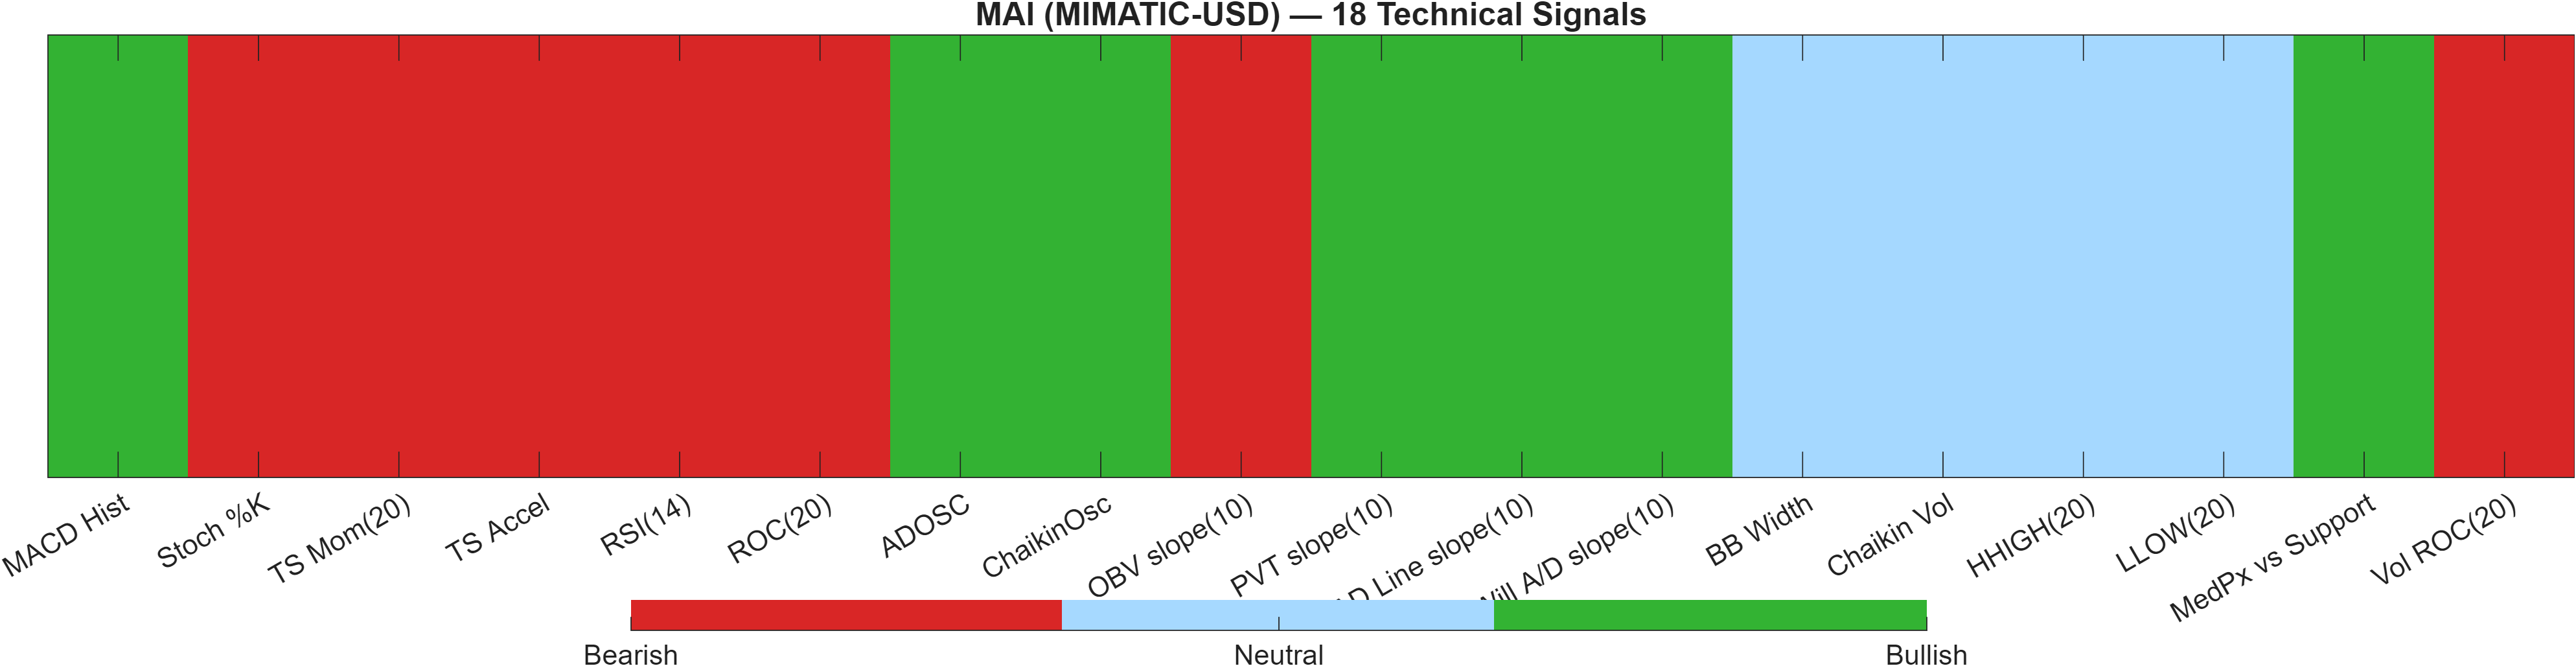
At the indicator level, the mix is coherent with the earlier narrative: RSI(14) 38.89 and Stoch %K 82.84 are both bearish, pointing to fragile momentum and potential late-cycle oscillation behavior. Meanwhile, flow/accumulation signals such as ChaikinOsc 2247 and ADOSC 100 are bullish, which can show participation improving without price confirmation. Volume rate of change is bearish (Vol ROC(20) -43.92), reinforcing that any attempted upside likely needs a volume-backed break to improve reliability.
Signal table (Bull/Bear/Neutral)
| Indicator | Value | Signal |
|---|---|---|
| MACD Hist | 0.0001603 | Bullish |
| Stoch %K | 82.84 | Bearish |
| TS Mom(20) | -0.01113 | Bearish |
| TS Accel | -0.00629 | Bearish |
| RSI(14) | 38.89 | Bearish |
| ROC(20) | -3.645 | Bearish |
| ADOSC | 100 | Bullish |
| ChaikinOsc | 2247 | Bullish |
| OBV slope(10) | -710 | Bearish |
| PVT slope(10) | 43.88 | Bullish |
| AD Line slope(10) | 4942 | Bullish |
| Will A/D slope(10) | 0.015 | Bullish |
| BB Width | 0.04872 | Neutral |
| Chaikin Vol | -55.17 | Neutral |
| HHIGH(20) | 0.9893 | Neutral |
| LLOW(20) | 0.9256 | Neutral |
| MedPx vs Support | 0.03408 | Bullish |
| Vol ROC(20) | -43.92 | Bearish |
Interpretation: Indicator-level signals form the base confluence, which is then adjusted using a separate AI-driven technical ranking model. The final technical score summarizes this combined view.
6) News sentiment + extractive gist
Note: Some headlines were matched using a looser (title-only) rule to avoid missing relevant coverage.
Sentiment score (avg): 0.000 | Positive: 25% | Neutral: 50% | Negative: 25%
KGNAI AI News Sentiment Score (normalized -1 to +1): Not available (as of —) | Label: Not available | Overall news score: 0.00
Positive Developments
Recent coverage across major financial outlets indicates a measured improvement in constructive narratives around crypto market structure and participant behavior, but without a dominant bullish catalyst. The sentiment mix shows 25% positive against a majority 50% neutral, consistent with incremental rather than decisive tone. Constructive threads include discussions around industry compliance standards and the idea that parts of the broader altcoin landscape may be transitioning from acute stress toward stabilization. For MAI (MIMATIC-USD), this matters less as a direct driver and more as a background condition: neutral-to-constructive framing can reduce the probability that micro drawdowns escalate purely from headline pressure, especially when the market is already operating within a tight technical band bounded by 0.9399 and 0.9991. With technical confluence at 0.000, the news backdrop is currently more supportive as a stability factor than as a directional impulse.
Neutral / Mixed Developments
The dominant tone remains informational. A 0.000 average sentiment score alongside a 50% neutral share typically aligns with coverage that describes conditions (flows, compliance, broad market positioning) rather than re-pricing events. This neutral skew fits the technical picture: Bollinger bandwidth at 0.0487 suggests no major volatility expansion, and the blended technical score of -0.170 indicates neither a strong risk-on nor risk-off consensus across signals. Mixed commentary—where stabilizing narratives coexist with cautionary context—often produces short-lived rank improvements (such as the Daily rank #1) without follow-through across weekly/monthly horizons. In this environment, price validation tends to matter more than interpretation, particularly around whether the market accepts above 0.9991 or reverts toward 0.9399.
Negative / Risk Signals
Risk-oriented coverage continues to emphasize demand fragility and the possibility that accumulation dynamics across major crypto assets are not consistently improving. With negative items at 25%, the downside tone is not dominant, but it is sufficient to keep the market sensitive to technical breaks—especially given the bearish trend framing from moving averages (close vs MA50 bearish; MA50 vs MA200 bearish). If macro crypto participation or whale accumulation narratives remain cautious, assets showing weaker medium-term technical rank behavior can struggle to convert short-window improvements into durable trend transitions. For MAI, the most relevant linkage is conditional: if price were to close below 0.9399, the combination of bearish RSI (38.89) and defensive market narratives could increase follow-through risk. Conversely, without such a break, negative headlines are more likely to manifest as range persistence than as directional acceleration.
- What to monitor next: Whether sentiment balance shifts meaningfully away from 0.000 as price approaches 0.9991.
- What to monitor next: Any change in risk framing if price closes below 0.9399 while RSI remains near 38.89.
- What to monitor next: Whether neutral coverage persists while volatility stays contained near 0.0487 bandwidth (range conditions).
Snapshot: AI Rank (Short–Mid–Long): Neutral (Neutral–Neutral–Neutral) · Technical Confluence: Neutral · Key Levels: Support ~0.94 | Resistance ~1.00 · News Sentiment: Neutral
Sources referenced: Reuters, Bloomberg, Yahoo Finance, MarketWatch, Investing.com
7) Sources
Not available in the provided data.
You may also like: How KGNAI AI ranks instruments across global markets
Disclaimer: KGNAI provides AI-generated analytics and educational market commentary only. This is not financial advice. Markets involve risk. Always do your own research.