
Swarm (BZZ-USD) Technical & Sentiment Update — 18-Mar-2026 (Neutral confluence, bearish short-term rank pressure)
Swarm (BZZ-USD) enters 18-Mar-2026 with a cross-horizon profile best described as mixed-to-cautious: the short-term KGNAI stance leans bearish while mid- and long-horizon ranks sit closer to neutral. Price structure versus key moving averages remains weak (Close vs MA50 and MA50 vs MA200 both bearish), yet momentum signals are not uniformly negative—RSI bias is neutral and MACD histogram is slightly positive at 0.0013, indicating limited upside impulse but not a clear breakdown momentum. Volatility conditions are relatively contained with Bollinger Bandwidth near 0.0799, which often corresponds to tighter ranges where support/resistance mapping matters more than trend extrapolation. With support near 0.0949 and resistance near 0.1858, the near-term decision framework centers on whether BZZ can reclaim trend structure above resistance with volume, or whether a loss of support amplifies downside risk. News sentiment in the provided digest reads broadly neutral (0.026 average) and is not instrument-specific.
- Rank stance: Short-term Bearish; Mid-term Neutral; Long-term Neutral (universe size: 800).
- Technical confluence: Neutral (18-signal score 0.111; blended overall technical score -0.200).
- Key levels: Support ~ 0.0949; Resistance ~ 0.1858.
- News sentiment bias: Neutral (avg 0.026; Positive 12% / Neutral 88% / Negative 0%).
- Confirmation / invalidation: A break above 0.1858 with volume supports continuation conditions; a close below 0.0949 increases deterioration risk.
What KGNAI Measures
KGNAI evaluates assets using large cross-sectional datasets built from millions of structured data points. Inputs incorporate fundamental metrics, technical structures, and systematically processed news sentiment. Statistical models, machine learning, and AI frameworks are used to assess relative positioning, signal alignment, and probabilistic behavior across broad universes.
How to Read This Report
- Ranks are comparative across the tracked universe, not absolute price targets.
- Confluence reflects alignment among independent signal groups.
- Support/resistance levels are probabilistic decision zones, not guarantees.
- Sentiment provides contextual bias within the broader analytical framework.
1) KGNAI AI Analysis
Region: CRYPTO
Total universe size: 800 ranked instruments
- Daily rank: #519 out of 800 — Neutral
- Weekly rank: #651 out of 800 — Bearish
- Monthly rank: #587 out of 800 — Neutral
- 3-Monthly rank: #505 out of 800 — Neutral
Cross-horizon rank dispersion is the defining feature of this profile. The weekly rank (#651) sits in the lower portion of the 800-instrument universe, consistent with a Bearish near-term regime. By contrast, the daily rank (#519) and 3‑monthly rank (#505) are closer to mid-pack, reflecting a market state that is not uniformly risk-off across horizons.
The practical interpretation is alignment risk: when one horizon (weekly) is meaningfully weaker than adjacent horizons (daily/monthly/3‑monthly), short-term flows can dominate realized volatility without necessarily changing the broader regime. In such cases, signal confirmation typically requires either (a) short-horizon ranks improving toward the neutral cluster, or (b) the neutral horizons drifting downward to “meet” the weekly weakness.
KGNAI’s stated term view captures this asymmetry—Short-term: Bearish; Mid-term: Neutral; Long-term: Neutral. For positioning discipline, the weekly rank being worse than the monthly rank (#651 vs #587) often implies the market is dealing with unresolved near-term pressure rather than a stable trend.
KGNAI ranks each instrument across large universes using multiple proprietary AI tests and statistical models (millions of data points). Lower ranks generally indicate stronger probability of favorable performance behavior, while higher ranks indicate weaker probability and more bearish positioning.
Want the full universe and complete rank tables? Unlock full access on KGNAI: https://www.kgnai.com/pricing
2) Price & trend overview
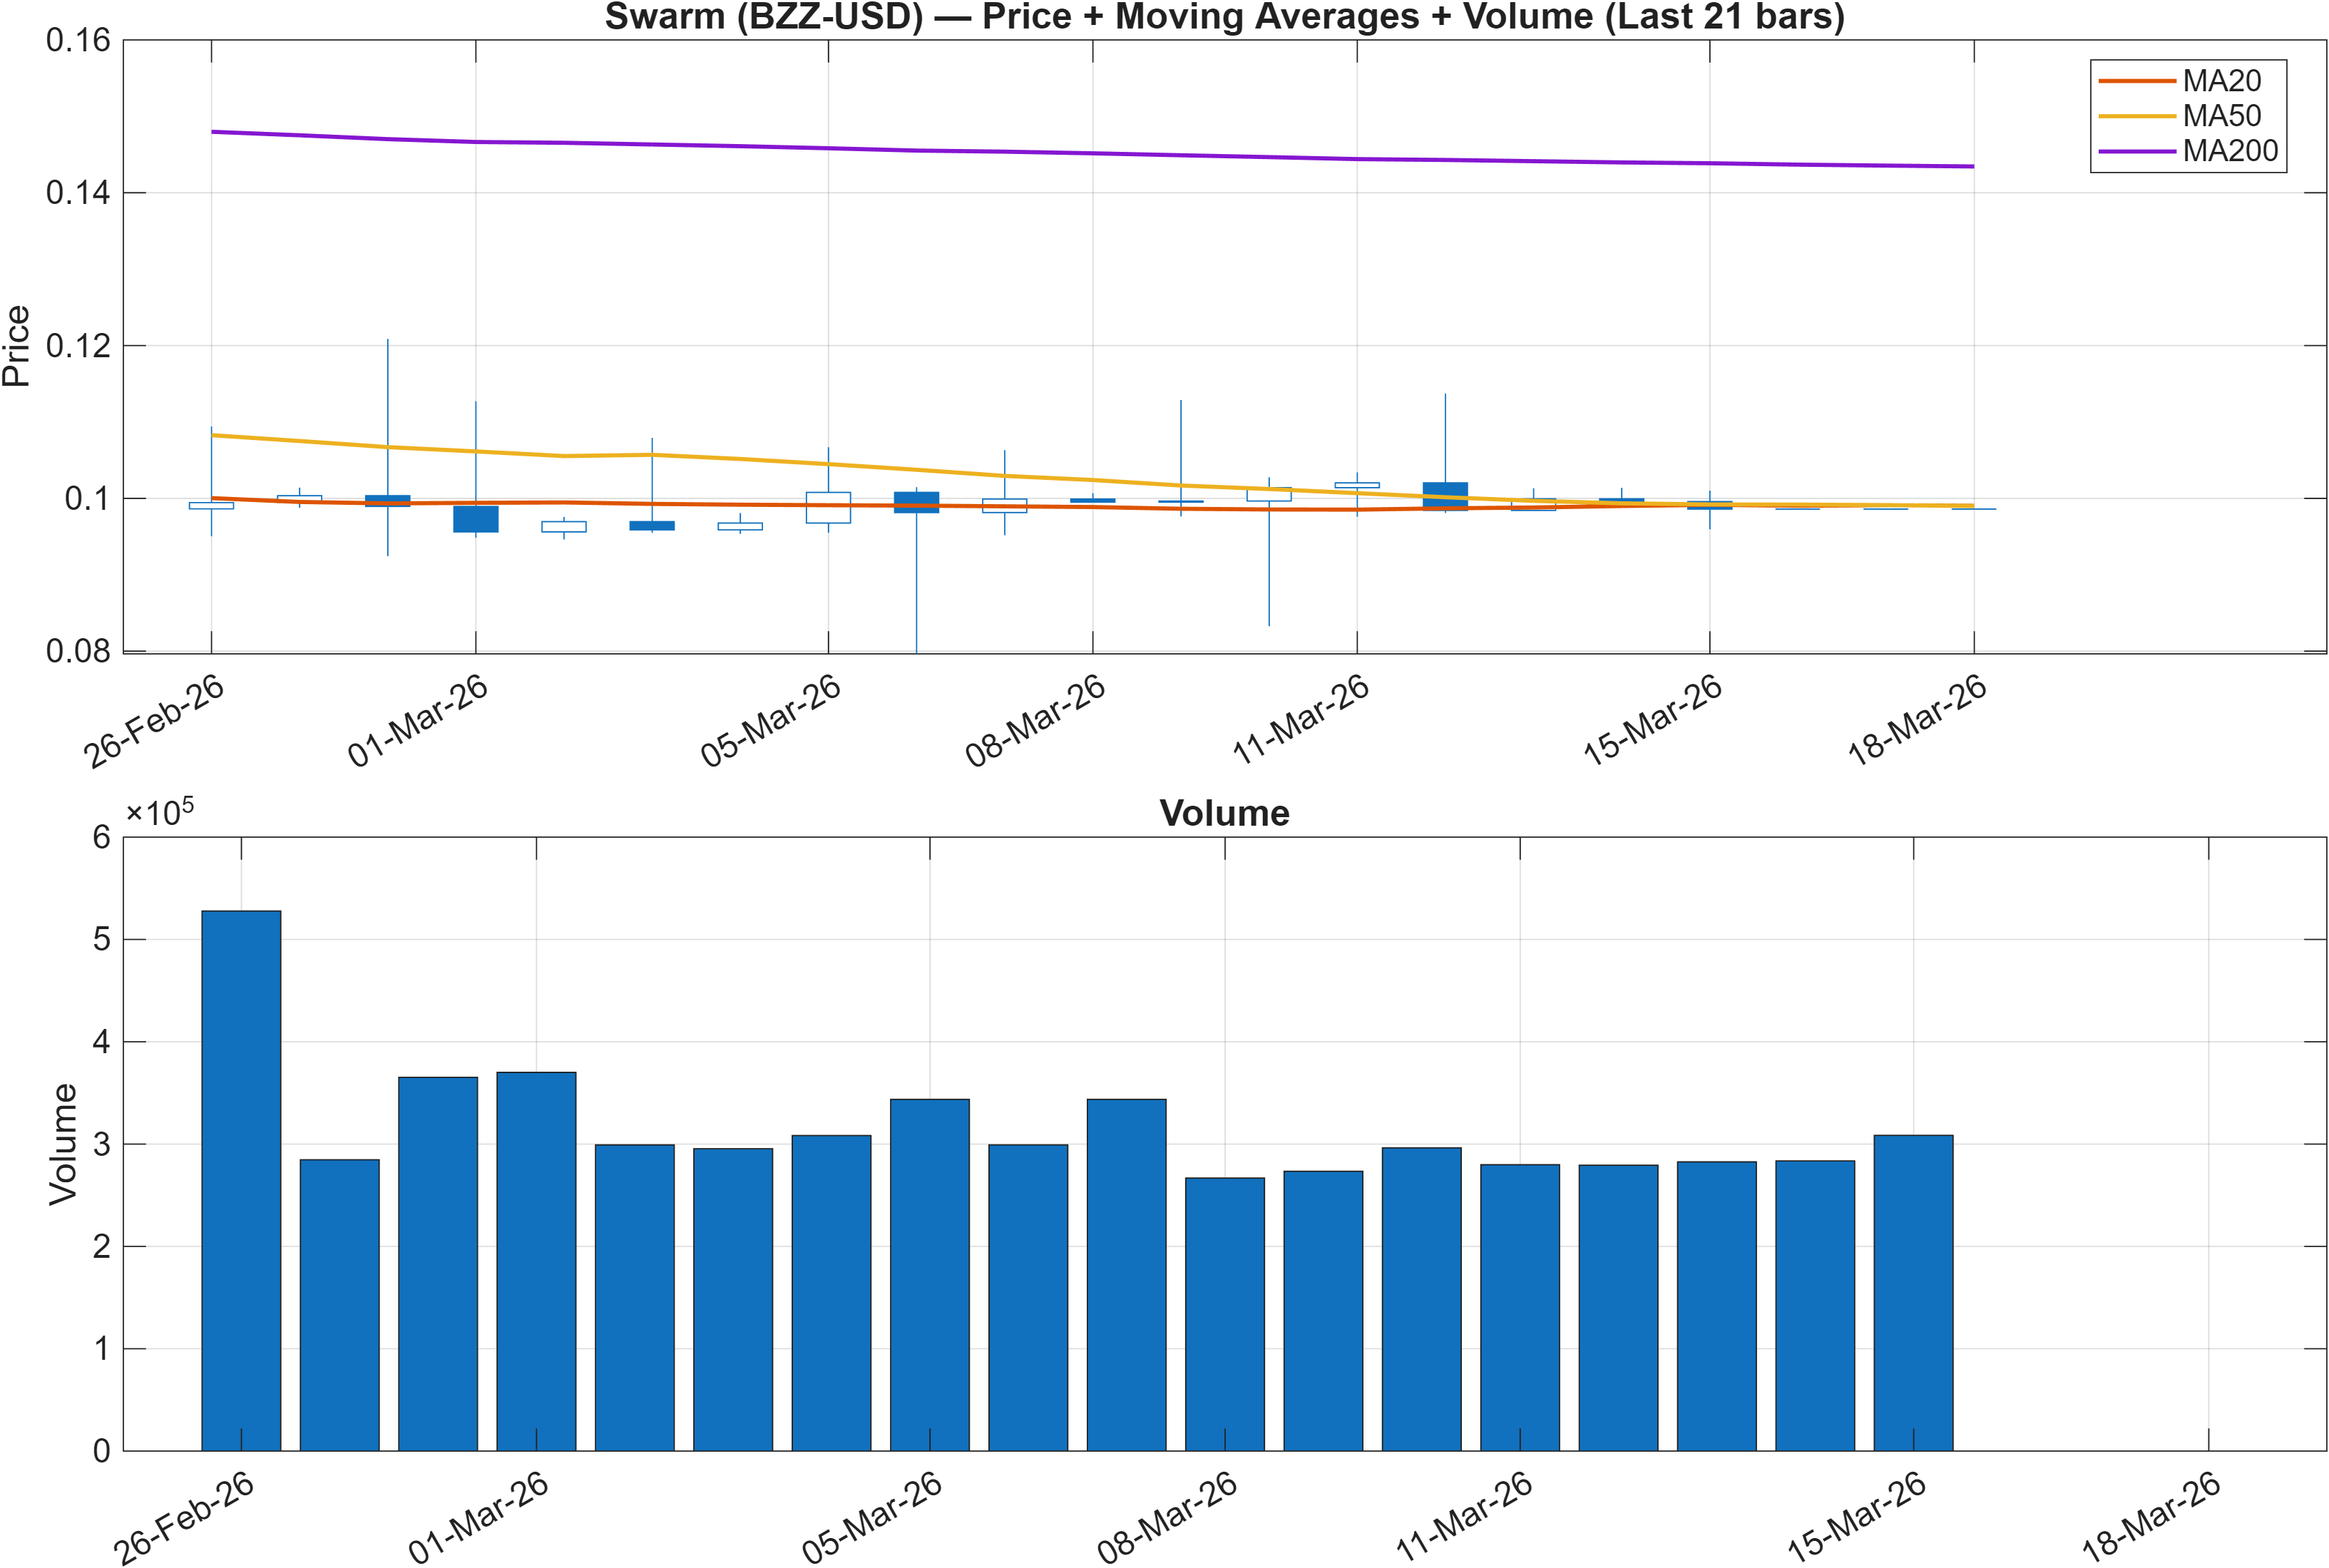
Interpretation: Close vs MA50 = Bearish, MA50 vs MA200 = Bearish.
Trend structure: bearish overlay vs neutral cross-horizon ranks
The moving-average configuration sets a clearly defensive backdrop: price below the MA50 and MA50 below MA200 reflect a downtrend-like structure rather than a confirmed recovery. This matters because, even when momentum oscillators stabilize, a bearish moving-average stack can keep rallies mean-reverting until price action reclaims the faster average and the MA50 begins flattening.
The interesting tension is that the broader KGNAI rank set is not uniformly bearish—daily and 3‑monthly ranks cluster around #519 and #505 (neutral), suggesting the market may be shifting from directional selling to range negotiation. In such a regime, trend signals can lag: moving averages often stay bearish while the market compresses and “works off” downside pressure through time rather than immediate upside follow-through.
From a market-structure perspective, this is where volume context becomes important. The scenario framework later defines a volume-qualified break above 0.1858 as a continuation trigger; that aligns with the idea that trend repair usually requires a decisive expansion phase, not a slow drift. Conversely, with support identified at 0.0949, a failure to hold that area would likely reinforce the bearish MA stack and keep the short-term rank pressure (weekly #651) relevant.
Overall, Section 2 reads as trend still impaired, while other sections (momentum/confluence) determine whether that impairment is stabilizing or accelerating.
3) Momentum & volatility dashboard
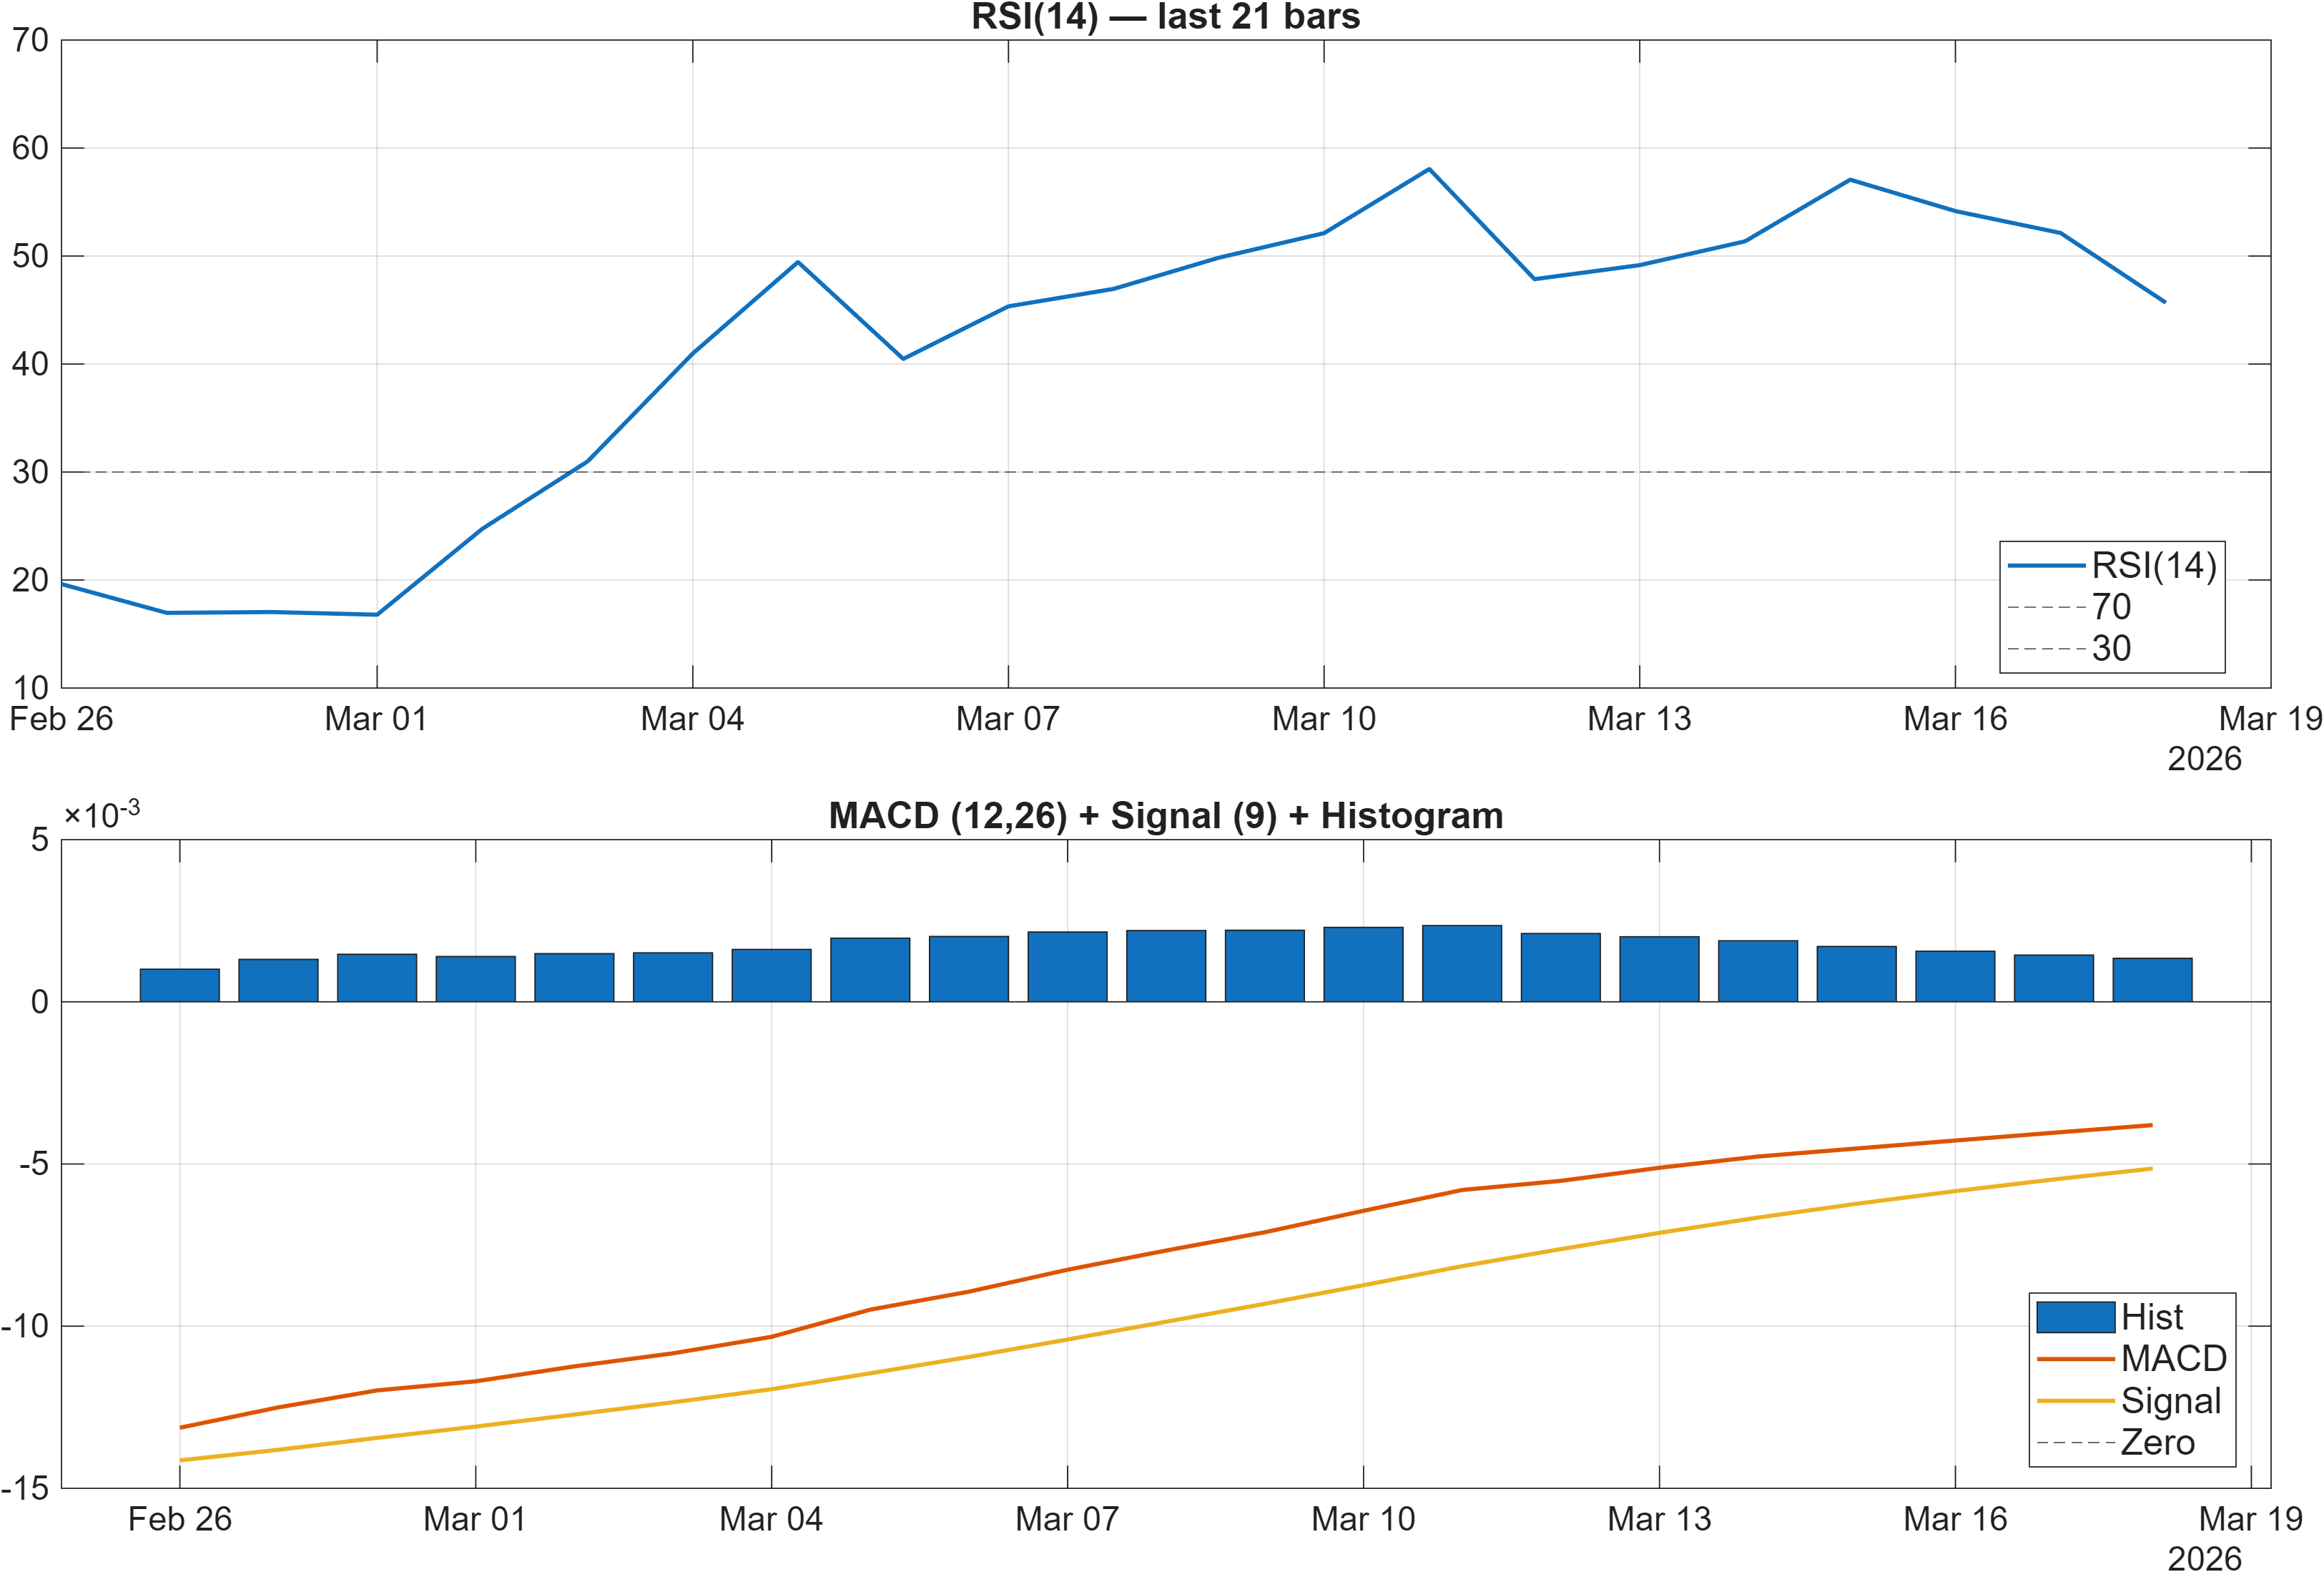
Interpretation: RSI bias = Neutral, MACD hist = 0.0013.
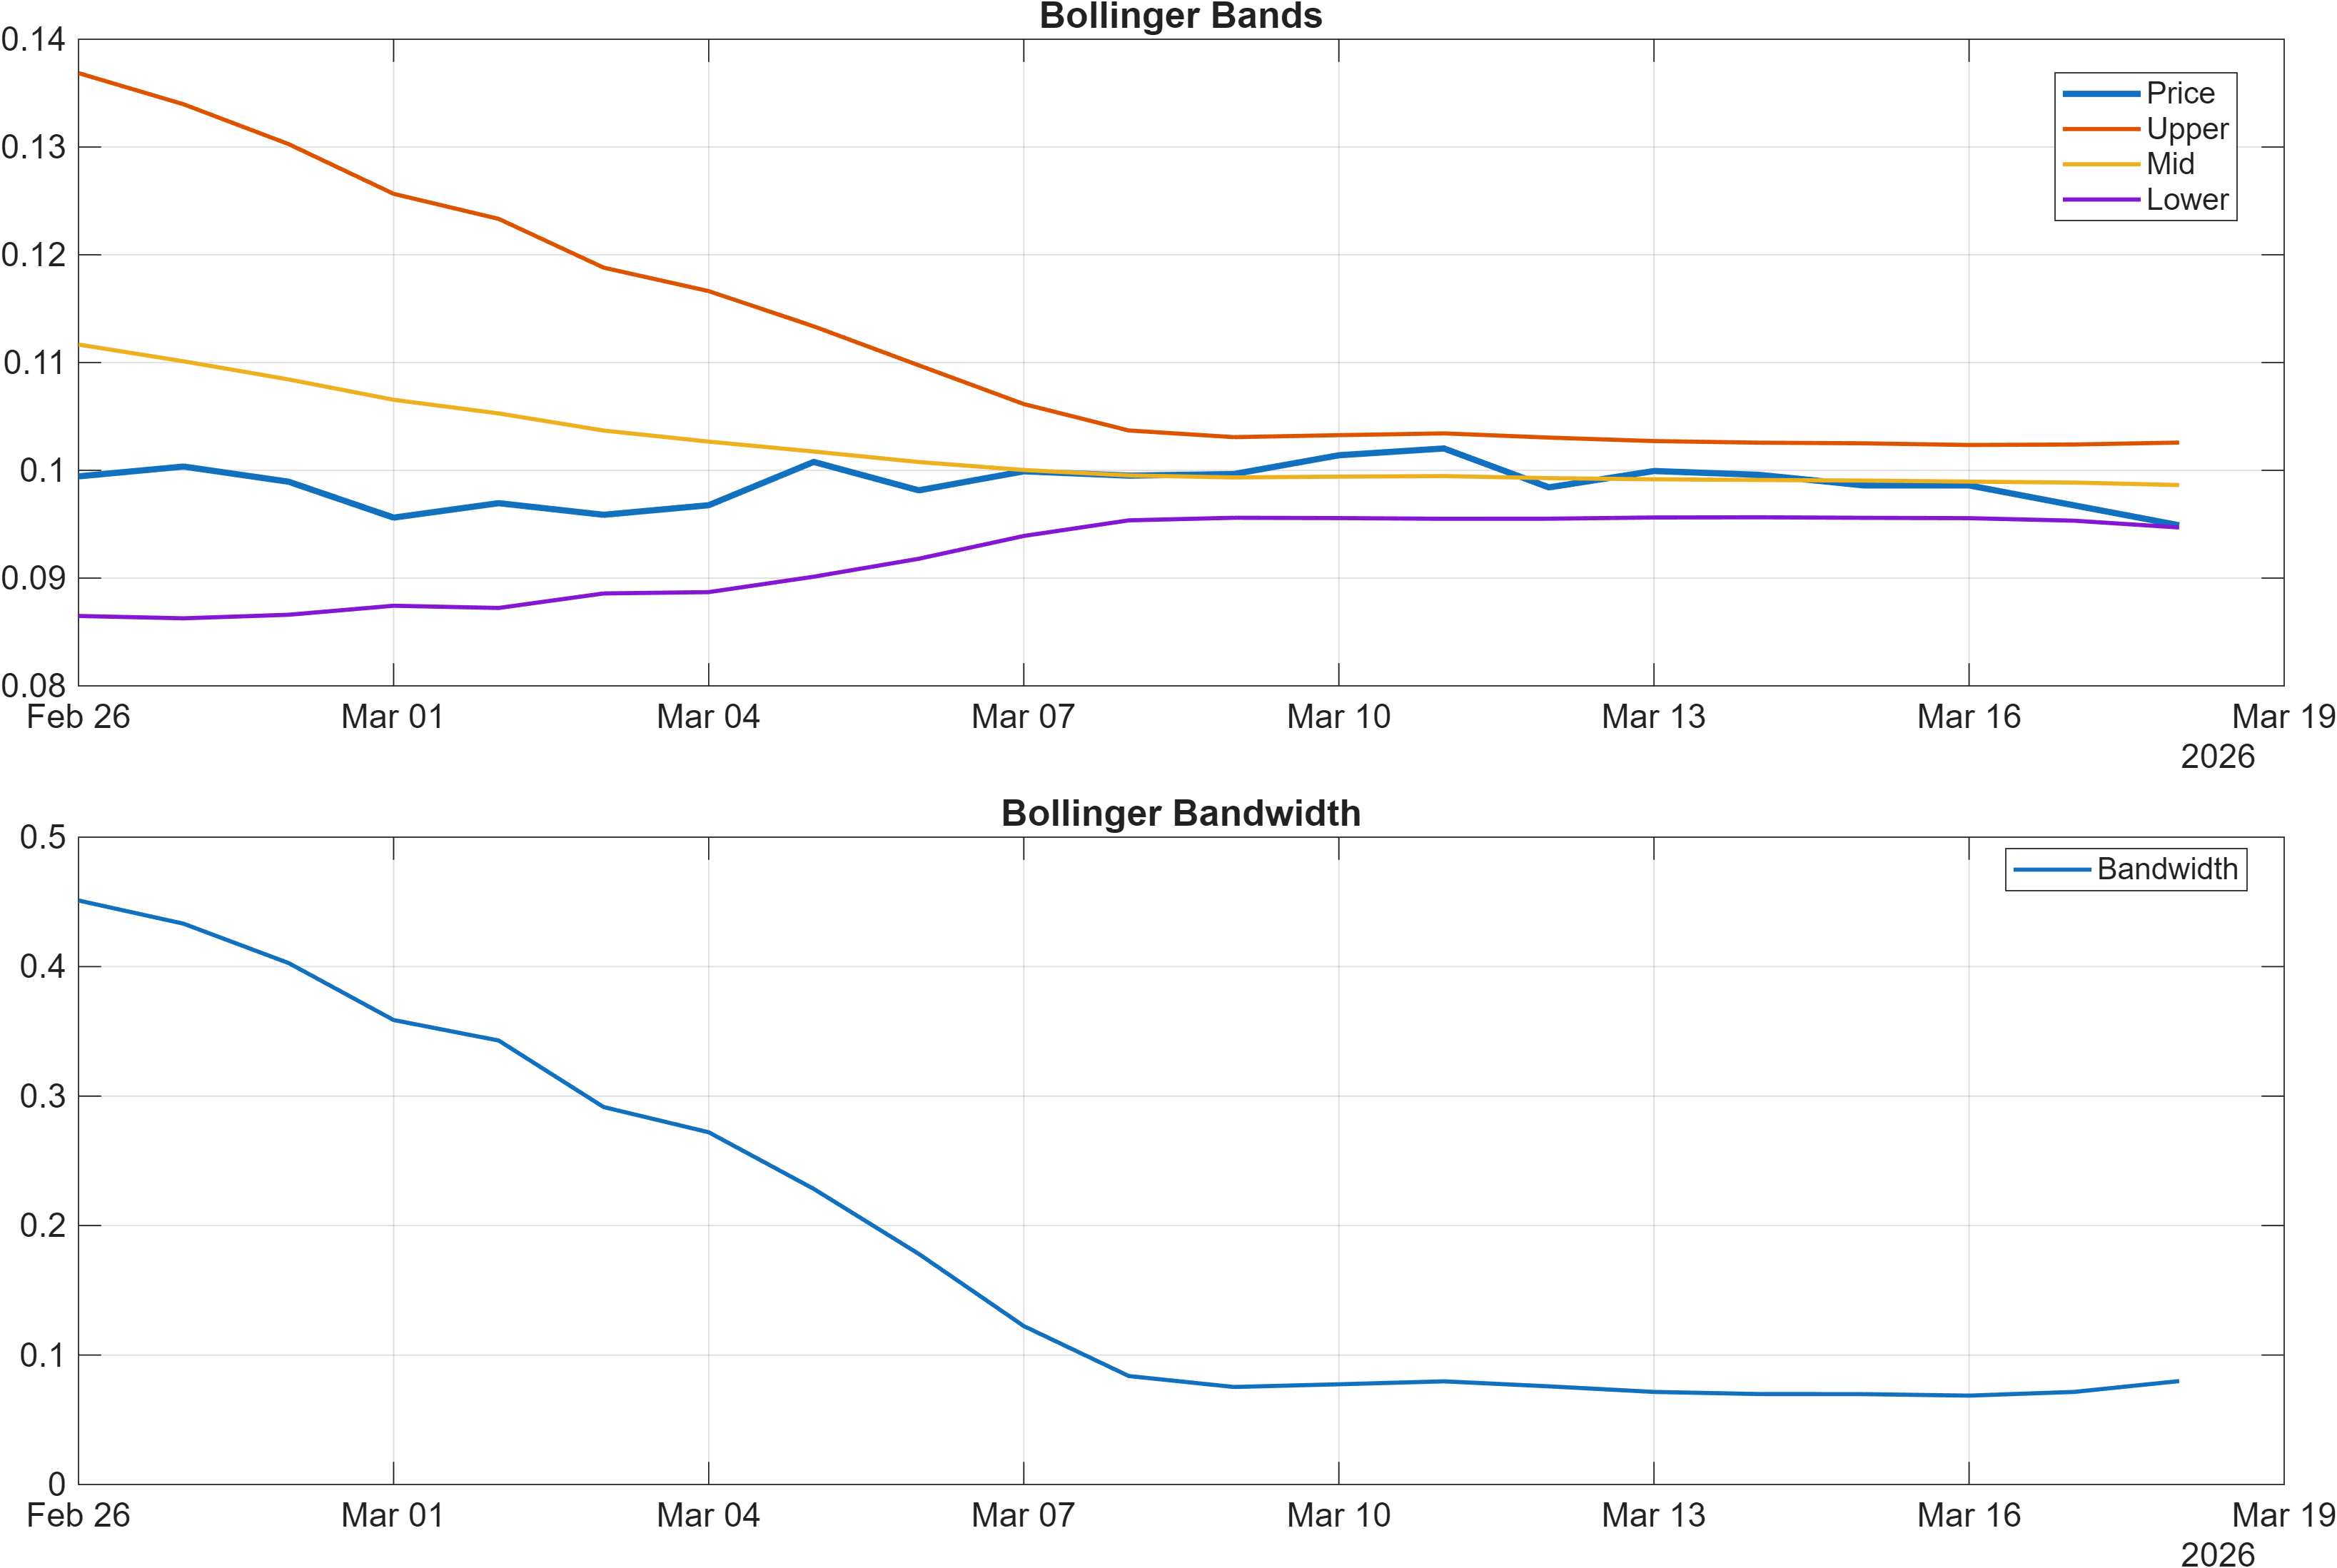
Interpretation: Bandwidth (volatility regime) latest = 0.0799.
Momentum: early stabilization signals, not a confirmed upside regime
Momentum inputs are split but informative. The RSI bias is neutral (with RSI(14) at 45.68 in the signal table), which is consistent with a market that is not in an oversold capitulation phase, but also not strong enough to sustain bullish trend conditions. At the same time, MACD histogram being slightly positive (0.0013; table shows 0.00134) suggests marginal positive impulse—often seen during basing attempts or short-covering rallies within broader bearish structure.
Volatility, measured via Bollinger Bandwidth, is also relatively contained at roughly 0.0799 (table: 0.07986). A tighter bandwidth regime can support two different narratives: either (1) compression before expansion (breakout risk rises), or (2) range persistence where oscillators mean-revert around neutral and directional conviction remains limited.
The momentum-to-volatility mix therefore argues for a conditional framework rather than a directional assumption. With the moving-average backdrop still bearish (Section 2), small positive MACD readings can fade quickly if expansion resolves downward—particularly if price drifts toward the support area near 0.0949. Conversely, if expansion resolves upward, the same compression can enable a sharper move toward the resistance band around 0.1858.
Net read: momentum is not deteriorating aggressively, but volatility compression means the next expansion phase is likely to be the deciding information event.
4) Support / Resistance zones
Support ~ 0.0949 | Resistance ~ 0.1858
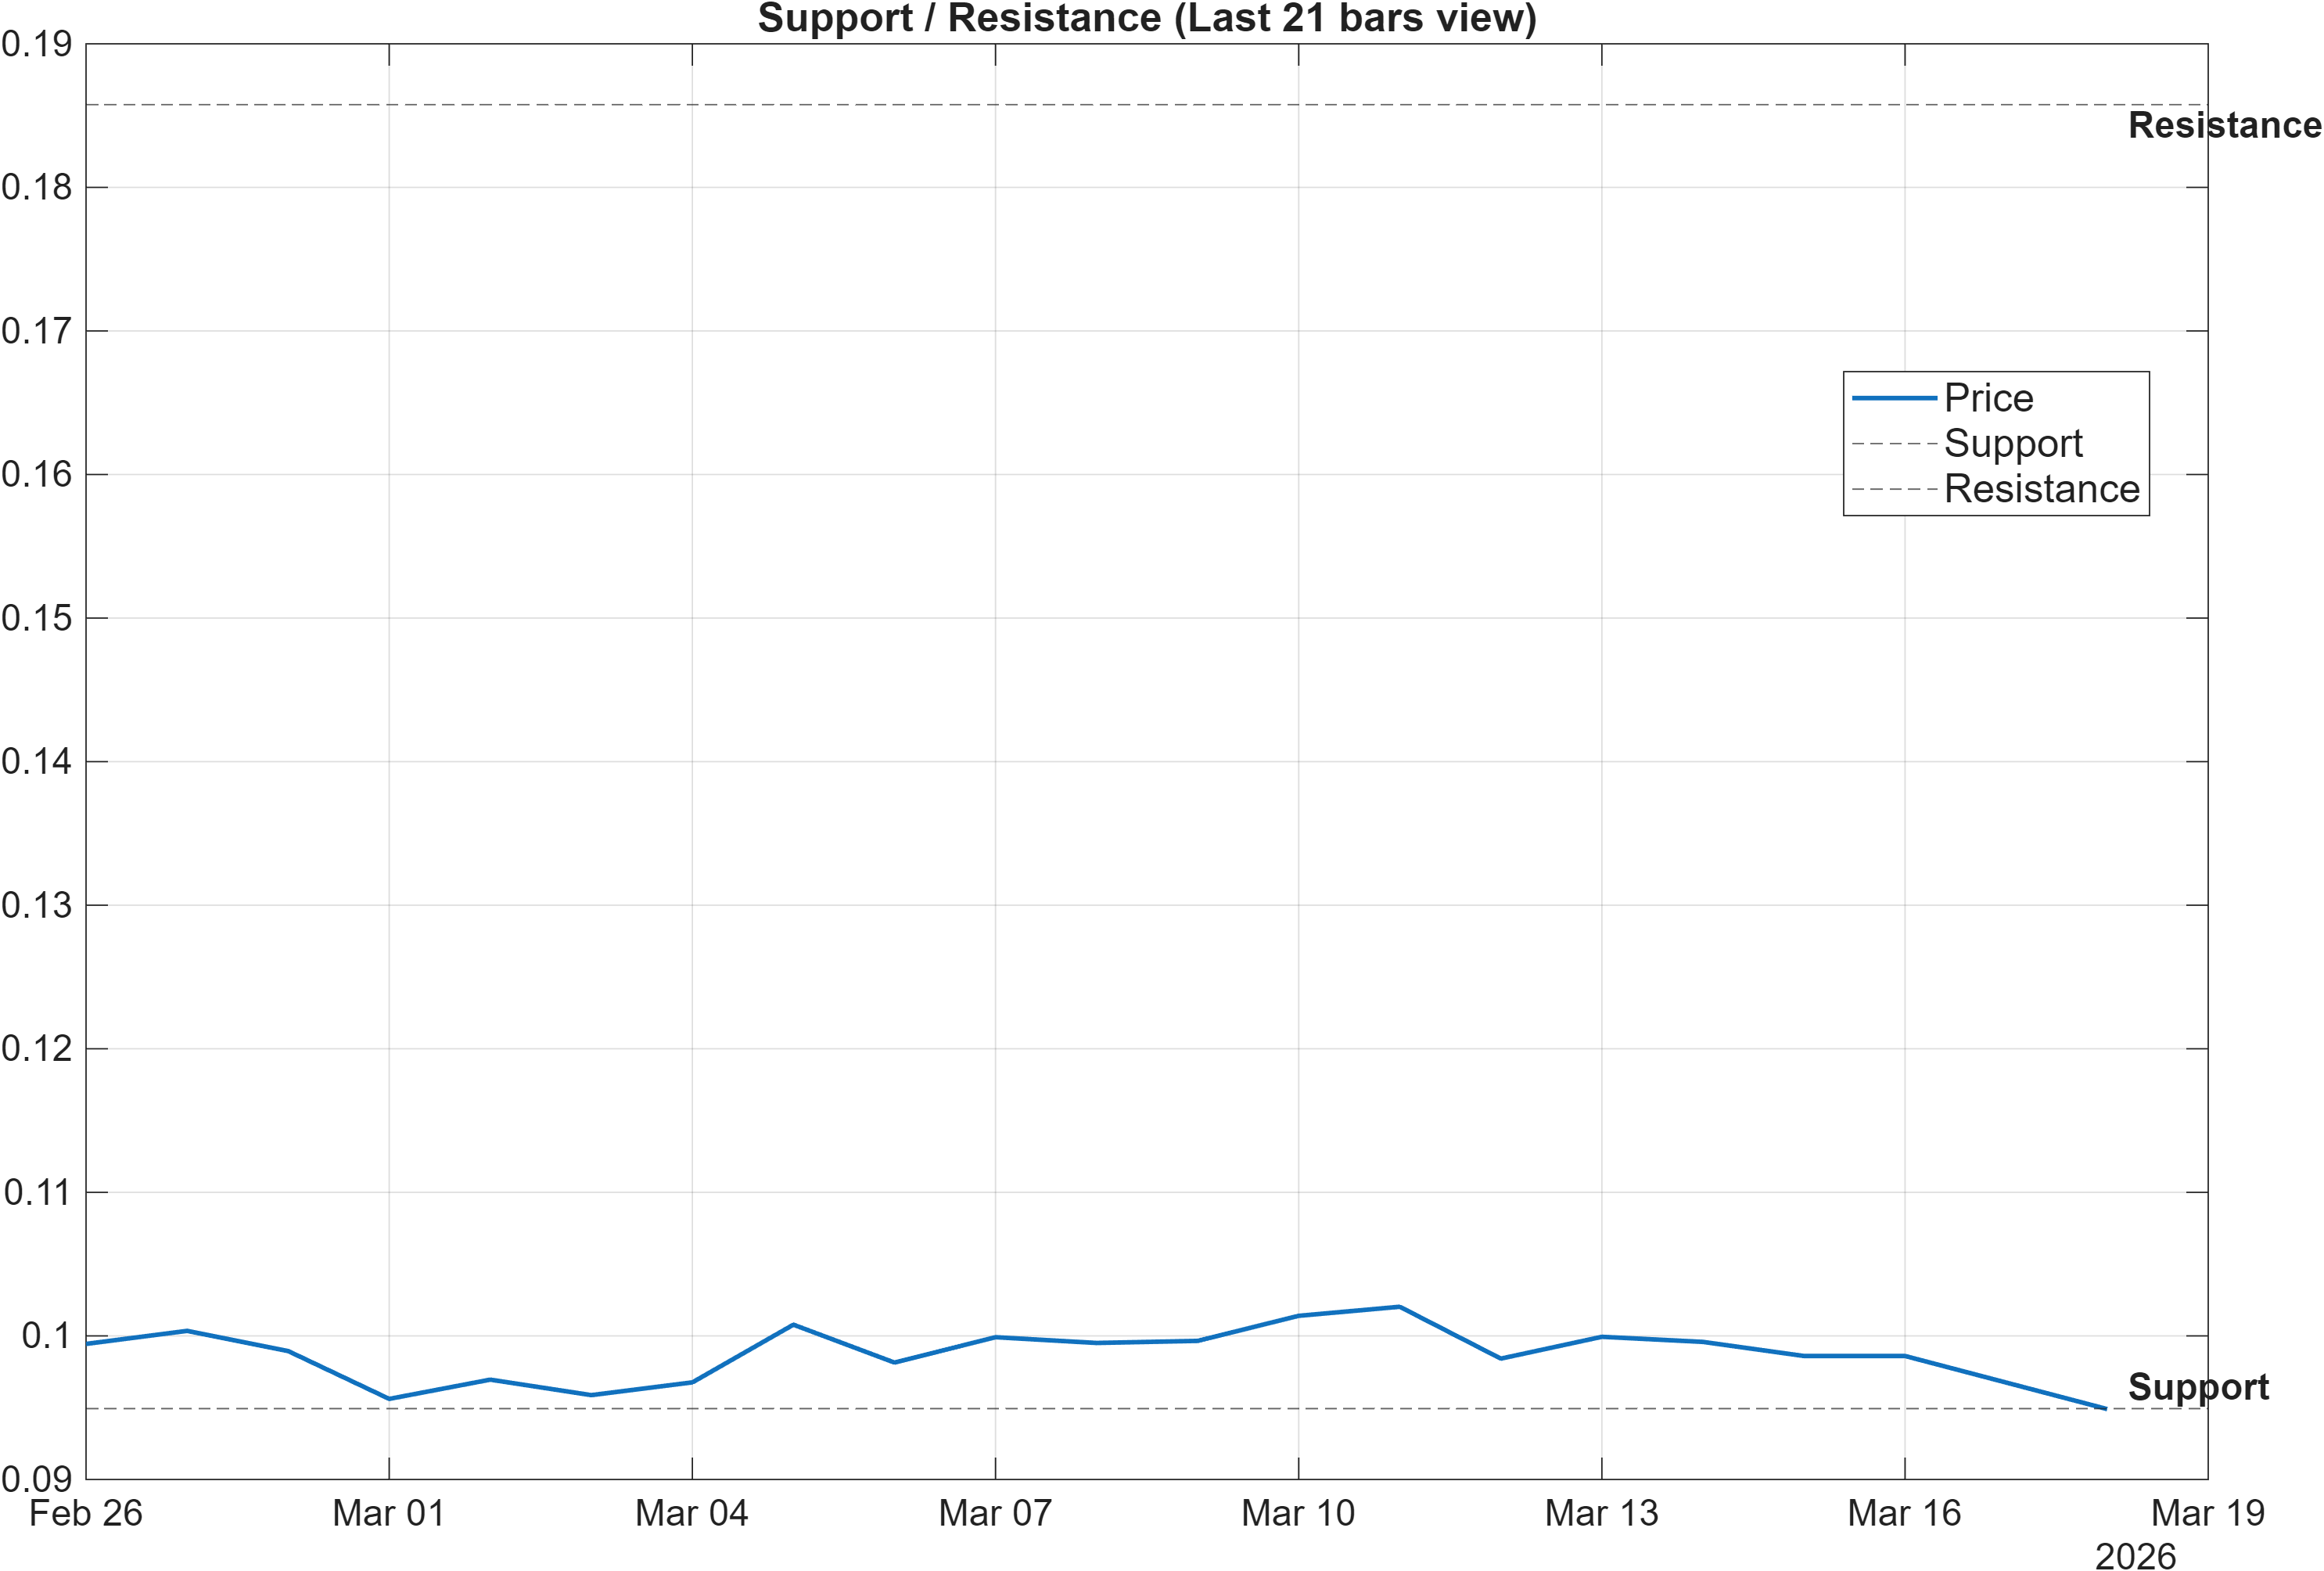
Scenario view: Break above resistance with volume → continuation. Close below support → signal deterioration risk.
Decision zones: mapping probability rather than point forecasts
With momentum largely neutral and volatility compressed, the distance between mapped levels becomes the primary organizing structure for risk. Support at 0.0949 is the key downside reference: a close below that area would not just be a marginal move—it would represent a loss of the level that the current framework treats as the boundary for “deterioration risk.” In range conditions, support failures tend to pull multiple signals into alignment (momentum, trend, and rank pressure) because stops and liquidity become more one-sided.
Resistance at 0.1858 defines the upside hurdle for changing the narrative from “bearish overlay with stabilization” to something closer to “trend repair.” The scenario explicitly requires a break above resistance with volume for continuation. That condition matters because, with the moving-average stack bearish, a low-volume drift above a level can be prone to reversal, whereas a volume-confirmed push is more consistent with broader participation.
Two additional reference points in the technical signal table help contextualize these zones. The 20-day highest high (HHIGH(20)) is 0.1209 and the 20-day lowest low (LLOW(20)) is 0.07965. Without turning those into extra “levels,” they suggest the recent trading envelope has been materially below the stated resistance, reinforcing that 0.1858 is a higher-order barrier rather than a nearby trigger.
Net read: levels are widely spaced; in such setups, confirmation quality (close/volume behavior at the zones) tends to dominate indicator micro-signals.
5) Quant Technical Dashboard (18 Signals)
KGNAI AI Technical Analysis Score (Deep Reinforcement Learning): Rank #770 out of 800 (Rank 1 represents the strongest technical positioning and a higher probability of favorable price behavior. As ranks increase toward the maximum, the probability of favorable outcomes weakens and bearish positioning becomes more dominant.) | Label: Bearish | Score: -0.925
18-Signal Technical Confluence Score: 0.111 (Neutral)
Overall Technical Score (18-signal confluence + DRL rank blend): -0.200 (Neutral)
Note: The blended score reflects signal strength weighted against broader AI technical ranking, which may temporarily diverge.
Blended technical score breakdown: -0.200 (Neutral | Bull 6 / Bear 4 / Neutral 8)
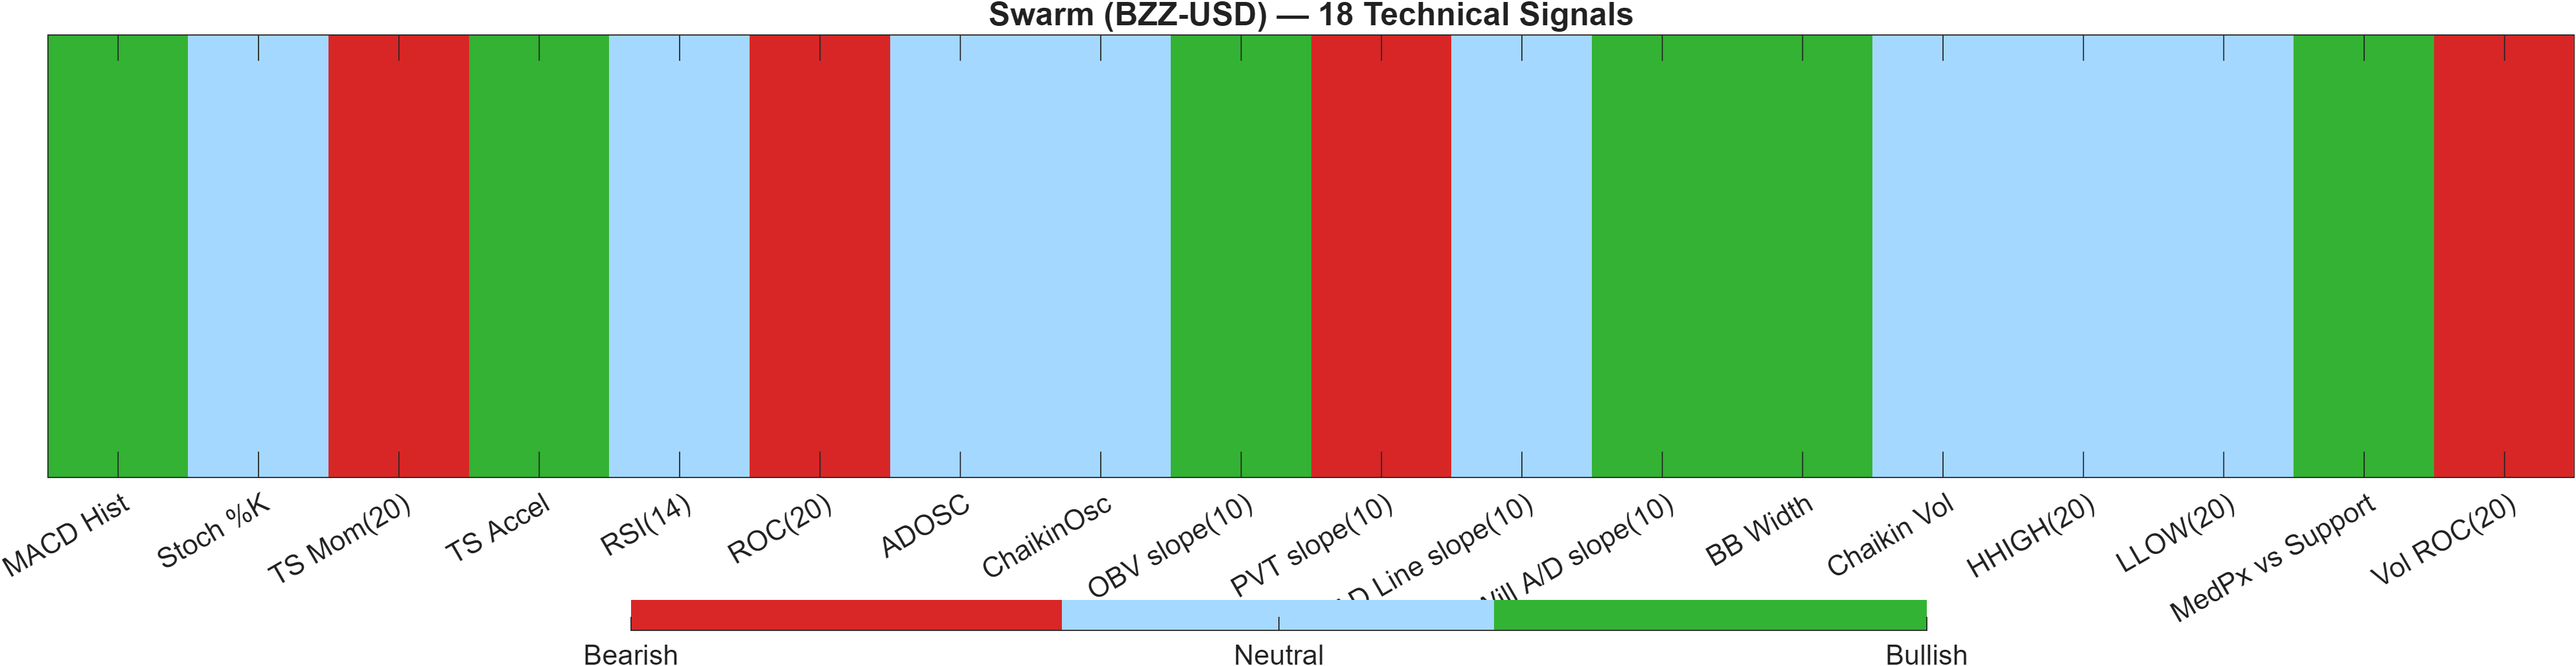
Signal table (Bull/Bear/Neutral)
| Indicator | Value | Signal |
|---|---|---|
| MACD Hist | 0.00134 | Bullish |
| Stoch %K | 50.32 | Neutral |
| TS Mom(20) | -0.00175 | Bearish |
| TS Accel | 0.03049 | Bullish |
| RSI(14) | 45.68 | Neutral |
| ROC(20) | -5.428 | Bearish |
| ADOSC | — | Neutral |
| ChaikinOsc | — | Neutral |
| OBV slope(10) | 2.608e+05 | Bullish |
| PVT slope(10) | -2243 | Bearish |
| AD Line slope(10) | — | Neutral |
| Will A/D slope(10) | 0.006582 | Bullish |
| BB Width | 0.07986 | Bullish |
| Chaikin Vol | -59.09 | Neutral |
| HHIGH(20) | 0.1209 | Neutral |
| LLOW(20) | 0.07965 | Neutral |
| MedPx vs Support | 0.003663 | Bullish |
| Vol ROC(20) | -100 | Bearish |
Interpretation: Indicator-level signals form the base confluence, which is then adjusted using a separate AI-driven technical ranking model. The final technical score summarizes this combined view.
Confluence vs AI technical rank: a controlled disagreement
The dashboard presents a notable divergence between signal-level confluence and the broader AI technical rank model. On the one hand, the 18-signal confluence score is 0.111, labeled Neutral, with a balanced mix (Bull 6 / Bear 4 / Neutral 8). On the other, the DRL technical rank is #770 out of 800 with a Bearish label and score -0.925.
This combination is often associated with local stabilization inside a weak broader structure. The signal table shows a small set of constructive readings—e.g., MACD Hist 0.00134 (Bullish), OBV slope(10) 2.608e+05 (Bullish), and BB Width 0.07986 (Bullish)—while trend/momentum still contains soft spots such as ROC(20) -5.428 (Bearish) and Vol ROC(20) -100 (Bearish).
The blended overall technical score remains -0.200 (Neutral), which is consistent with a market that is not presenting a clean directional edge. In disciplined terms, this is a “wait for level validation” environment: confluence is not decisively bearish, but the AI rank suggests the technical context is still fragile.
6) News sentiment + extractive gist
Note: Instrument-specific news matches were not found, so the digest includes broader market/sector headlines. Links are provided for verification.
Sentiment score (avg): 0.026 | Positive: 12% | Neutral: 88% | Negative: 0%
KGNAI AI News Sentiment Score (normalized -1 to +1): Not available (as of —) | Label: Not available | Overall news score: 0.03
Positive Developments
Recent coverage across major financial outlets indicates a constructive tone around broader crypto market resilience and participation, with attention on headline-level price stability in large-cap assets and the implications for risk appetite across the altcoin complex. The provided sentiment mix is skewed heavily toward neutral classifications (88%) with a modest positive share (12%) and no negatives in the dataset, consistent with a “cautiously constructive” information tape rather than an exuberant one. In practice, that backdrop can help explain why BZZ’s momentum metrics are not aggressively bearish: a neutral-to-positive sector narrative often reduces the probability of disorderly selloffs while volatility remains compressed (Bandwidth near 0.0799). For BZZ-USD specifically, this type of environment typically makes technical levels—support at 0.0949 and resistance at 0.1858—more influential than single-day news catalysts, especially when instrument-specific coverage is not available in the provided data.
Neutral / Mixed Developments
A large portion of the digest reflects informational or interpretive items that shape expectations without forcing immediate repricing. That aligns with the reported average sentiment score of 0.026, which is close to flat and consistent with “context-setting” news rather than directional shocks. When the tape is predominantly neutral, market microstructure often shifts toward mean reversion, with traders responding more to chart-defined triggers (e.g., moving-average reclaim attempts) than to incremental headlines. This maps to BZZ’s mixed technical posture: the 18-signal confluence is 0.111 (neutral) even as the broader AI technical rank remains weak at #770. In such a regime, headline flow may primarily affect the timing of volatility expansion rather than determining its direction.
Negative / Risk Signals
Even with a dataset showing 0% negative classifications, risk signals remain relevant through policy and regulatory uncertainty themes that can surface quickly across the crypto complex. The key issue for BZZ-USD is less about a single adverse headline and more about how a risk-off shift could interact with an already bearish trend overlay (Close vs MA50 bearish; MA50 vs MA200 bearish) and a weak DRL technical rank (#770/800). In that setup, downside outcomes tend to be expressed via level breaks rather than gradual drift: a close below 0.0949 would be the technical “translation” of deteriorating sentiment into price behavior. With volatility compression (Bandwidth 0.0799), adverse catalysts can also arrive as sudden range expansion rather than a slow grind, which is why confirmation around support is central.
- What to monitor next: whether price action approaches 0.0949 with weakening momentum (RSI staying below neutral levels) or stabilizes.
- What to monitor next: whether any upside attempt can clear 0.1858 with visible volume expansion, consistent with the scenario framework.
- What to monitor next: whether broad market tone remains neutral (avg sentiment 0.026) or shifts materially, coinciding with Bollinger Bandwidth expansion from 0.0799.
Sources referenced: Reuters, Bloomberg, Yahoo Finance, MarketWatch, Investing.com
Snapshot: AI Rank (Short–Mid–Long): Mixed (Bearish–Neutral–Neutral) · Technical Confluence: Neutral · Key Levels: Support ~0.09 | Resistance ~0.19 · News Sentiment: Neutral
7) Sources
- SEC will consider most crypto assets not securities under federal law — https://cointelegraph.com/news/sec-interpretation-crypto-assets-not-securities?utm_source=rss_feed&utm_medium=rss&utm_campaign=rss_partner_inbound
- Here’s what happened in crypto today — https://cointelegraph.com/news/what-happened-in-crypto-today?utm_source=rss_feed&utm_medium=rss&utm_campaign=rss_partner_inbound
- US lawmakers introduce bill to crack down on prediction markets war bets — https://cointelegraph.com/news/us-lawmakers-prediction-market-bets-war-bill?utm_source=rss_feed&utm_medium=rss&utm_campaign=rss_partner_inbound
- Moody’s brings credit ratings onchain with Canton Network integration — https://cointelegraph.com/news/moody-s-brings-credit-ratings-onchain-with-canton-network-integration?utm_source=rss_feed&utm_medium=rss&utm_campaign=rss_partner_inbound
- Bitcoin holds $70K, bringing spot ETF buyers close to breakeven: Is the bull market back? — https://cointelegraph.com/news/bitcoin-holds-dollar70k-bringing-spot-etf-buyers-close-breakeven-is-bull-market-back?utm_source=rss_feed&utm_medium=rss&utm_campaign=rss_partner_inbound
- Tether launches AI training framework for smartphones and consumer GPUs — https://cointelegraph.com/news/tether-launches-ai-training-framework-for-smartphones-and-consumer-gpus?utm_source=rss_feed&utm_medium=rss&utm_campaign=rss_partner_inbound
- Arizona AG files charges against Kalshi over ‘illegal gambling‘ — https://cointelegraph.com/news/arizona-criminal-charges-kalshi-gambling?utm_source=rss_feed&utm_medium=rss&utm_campaign=rss_partner_inbound
- SOL price signal tied to previous 142% rally flashes again: Are the bulls back? — https://cointelegraph.com/news/sol-price-signal-tied-to-previous-142percent-rally-flashes-again-are-the-bulls-back?utm_source=rss_feed&utm_medium=rss&utm_campaign=rss_partner_inbound
You may also like: How KGNAI AI ranks instruments across global markets
Disclaimer: KGNAI provides AI-generated analytics and educational market commentary only. This is not financial advice. Markets involve risk. Always do your own research.