
Bittensor (TAO22974-USD) Technical & Rank Review — 20-Mar-2026 (Shared Control, Bullish Confluence)
Bittensor (TAO22974-USD) enters 20-Mar-2026 with a cross-horizon profile that is constructive in the near term but less uniformly confirmed across longer windows. In KGNAI’s 800-instrument crypto universe, the weekly rank sits near the very top (#5), while the daily rank (#144) remains in the upper portion of the distribution and the monthly rank (#223) signals a more balanced, “cooler” stance rather than persistent leadership. On the technical side, the 18-signal confluence is Bullish (0.667) and the blended technical score is also Bullish (0.629), supported by momentum readings such as RSI(14) at 88.23 and a positive MACD histogram (7.1349 / 7.135). Volatility context is important: Bollinger bandwidth is 0.7596, implying an expanded regime where continuation and mean-reversion risks can both rise. News sentiment is mechanically Neutral (0.000; 100% neutral), keeping the bias primarily technical.
- Rank stance (Short / Mid / Long): Daily Bullish (#144), Weekly Bullish (#5), Monthly Neutral (#223); 3-Monthly: Not available for this horizon.
- Technical confluence: Bullish (18-signal score 0.667; blended score 0.629).
- Key levels: Support ~ 156.9023 | Resistance ~ 268.0590.
- News sentiment bias: Neutral (avg 0.000; 100% neutral).
- Confirmation / invalidation: Follow-through is better supported on a break above 268.0590 with volume; deterioration risk increases on a close below 156.9023.
KGNAI evaluates assets using large cross-sectional datasets built from millions of structured data points. Inputs incorporate fundamental metrics, technical structures, and systematically processed news sentiment. Statistical models, machine learning, and AI frameworks are used to assess relative positioning, signal alignment, and probabilistic behavior across broad universes.
- Ranks are comparative across the tracked universe, not absolute price targets.
- Confluence reflects alignment among independent signal groups.
- Support/resistance levels are probabilistic decision zones, not guarantees.
- Sentiment provides contextual bias within the broader analytical framework.
As of: 20-Mar-2026
Ticker: TAO22974-USD
1) KGNAI AI Analysis
Region: CRYPTO
Total universe size: 800 ranked instruments
- Daily rank: #144 out of 800 — Bullish
- Weekly rank: #5 out of 800 — Bullish
- Monthly rank: #223 out of 800 — Neutral
- 3-Monthly rank: Not available for this horizon — Not available
The rank curve is the central tension in this snapshot: weekly leadership (#5, effectively top percentile) contrasts with a more ordinary daily position (#144, still constructive but less dominant) and a neutral monthly posture (#223). That pattern often appears when a strong impulse phase is present but the longer-window comparative edge has not fully re-established itself, or when the market is repricing quickly after a prior consolidation.
The phrase “market control is shared” fits the rank dispersion: the short window reads as supportive, the mid window is still favorable, and the longer window is not yet aligned enough to call broad-based trend leadership. Practically, this creates a regime where signal confirmation matters more than a single metric—especially around the stated decision zones at 156.9023 (support) and 268.0590 (resistance).
KGNAI’s framework treats ranks as cross-sectional positioning rather than deterministic outcomes. With an 800-instrument universe, moving from #223 (monthly) toward the higher-conviction tiers typically requires persistence in multiple independent components—momentum, trend structure, and participation—rather than isolated indicator strength. In this report, the later sections show that technical confluence is bullish (0.667) even while the DRL technical rank sits at #184, a divergence that frames the near-term opportunity set as constructive but not uniformly confirmed across models.
KGNAI ranks each instrument across large universes using multiple proprietary AI tests and statistical models (millions of data points). Lower ranks generally indicate stronger probability of favorable performance behavior, while higher ranks indicate weaker probability and more bearish positioning.
Term view: Short-term: Bullish. Mid-term: Neutral. Long-term: Neutral.
Want the full universe and complete rank tables? Unlock full access on KGNAI: https://www.kgnai.com/pricing
2) Price & trend overview
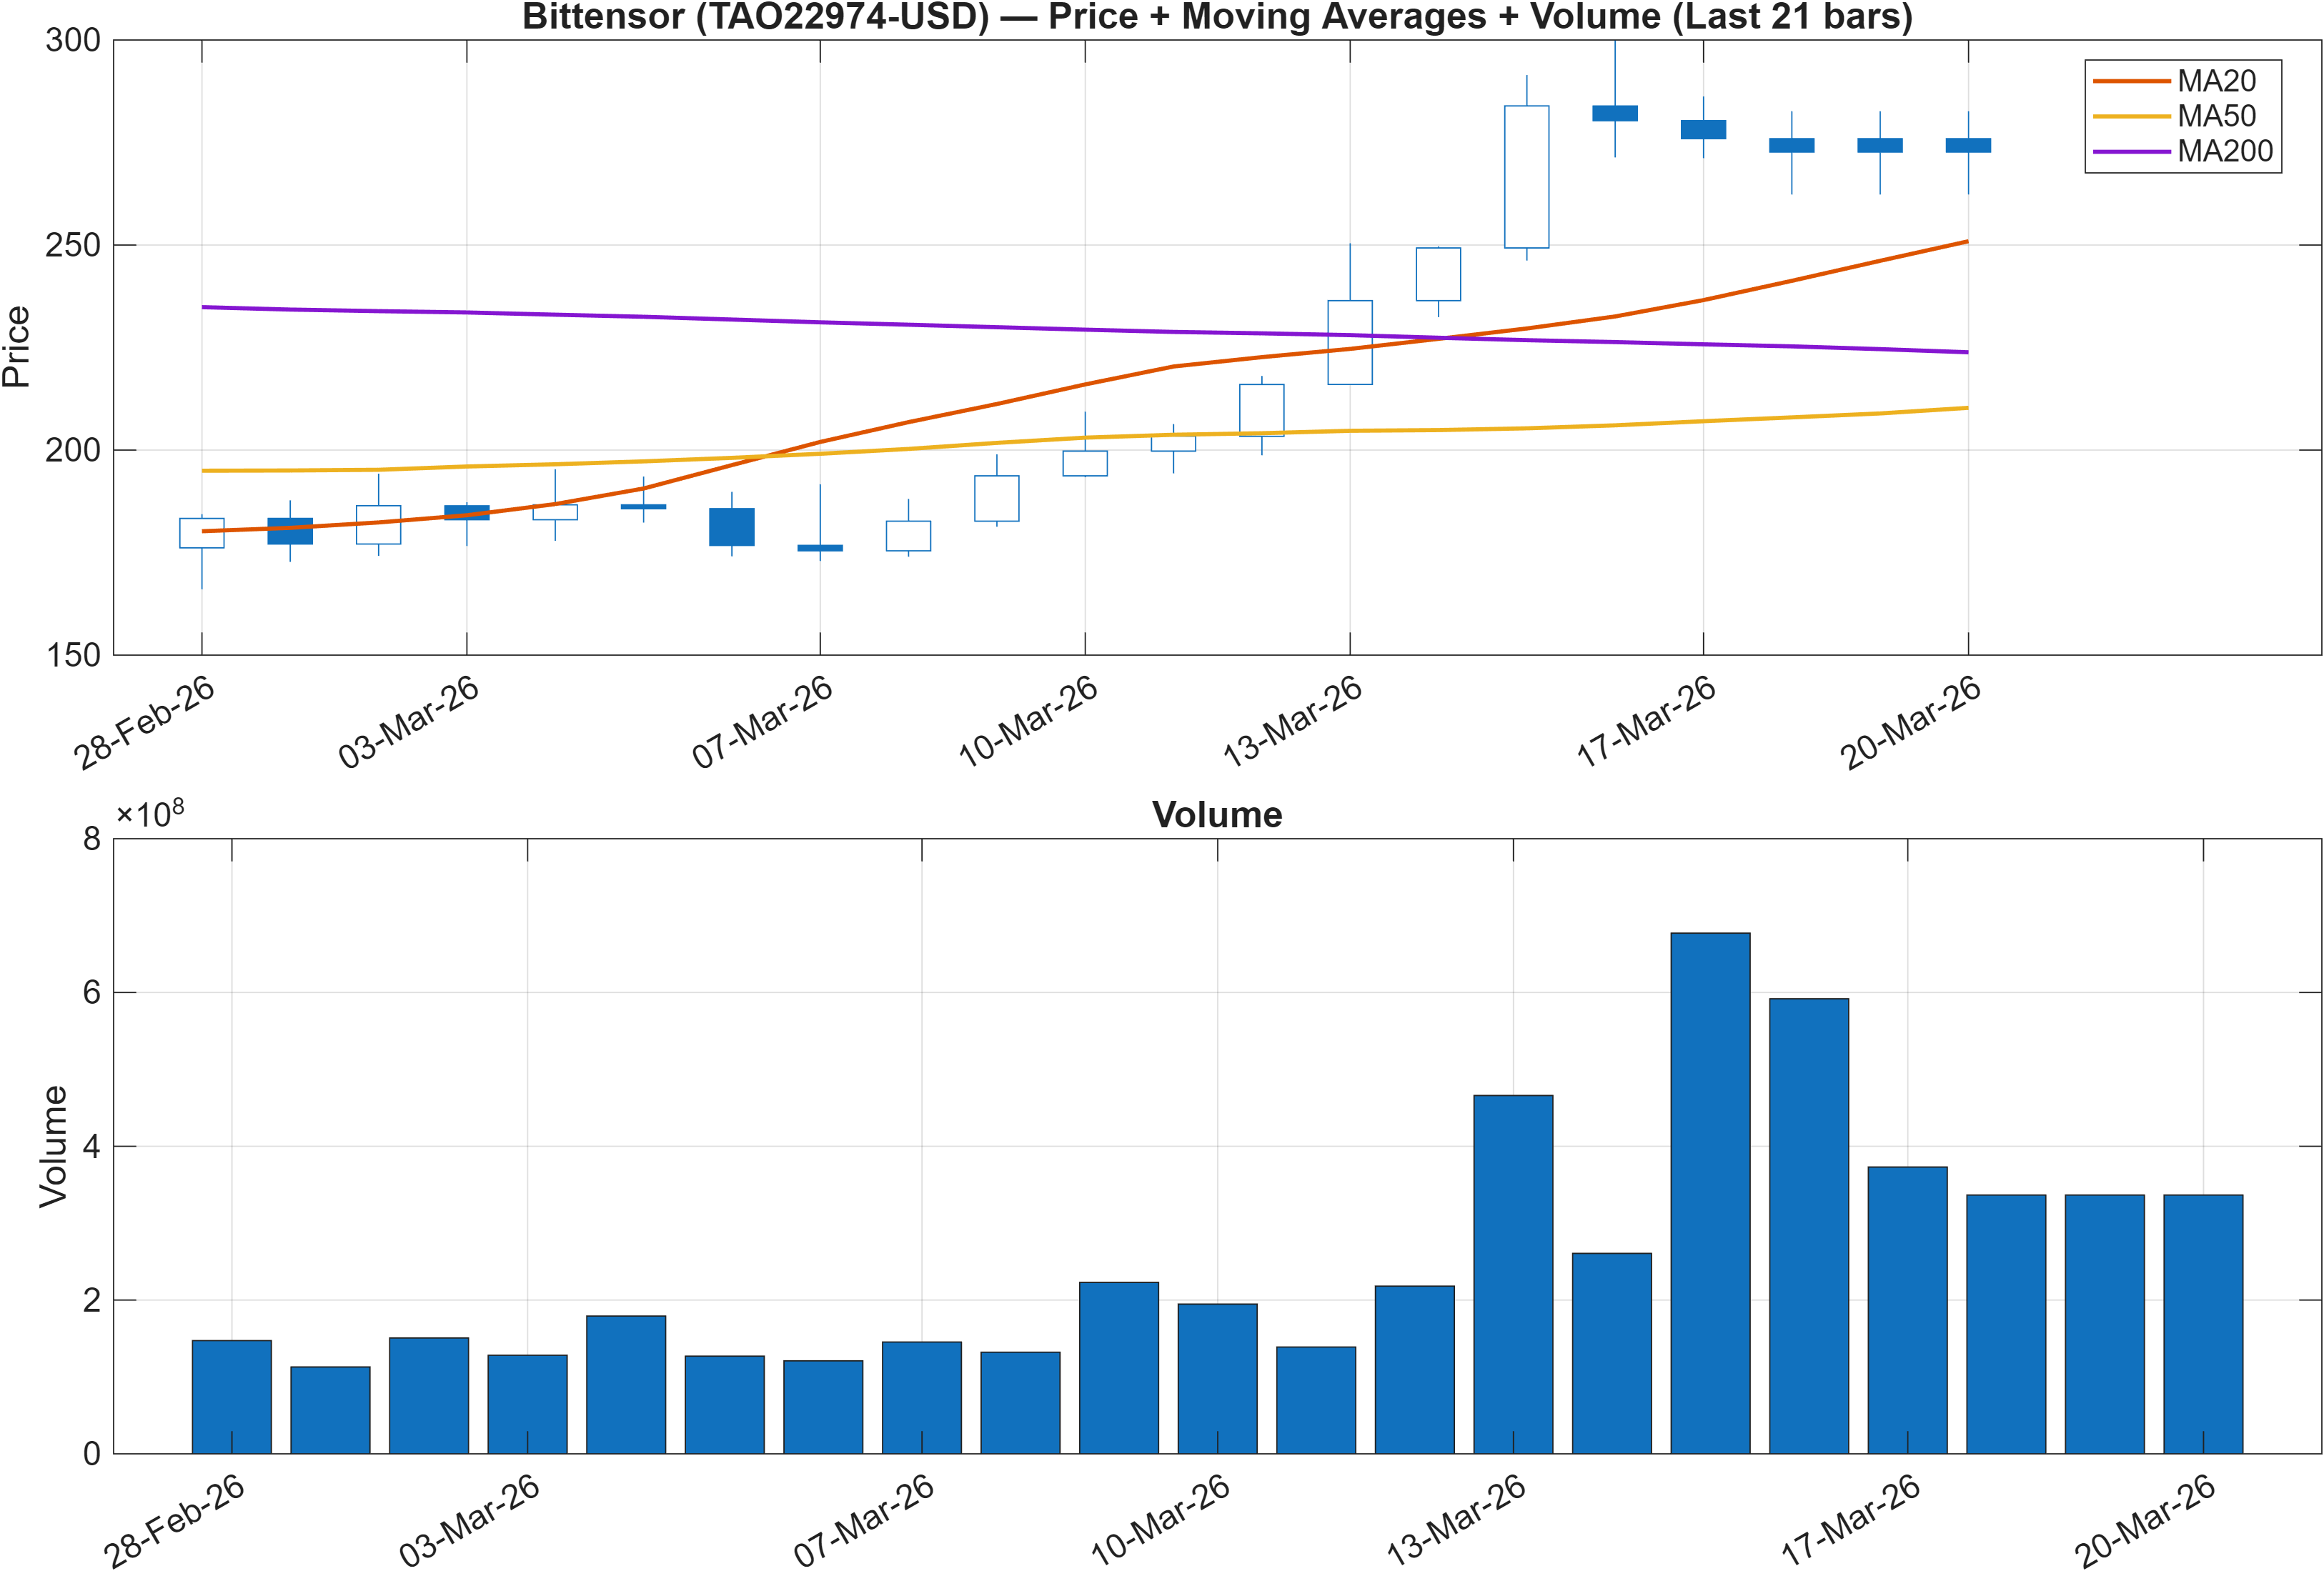
Trend structure is explicitly mixed by construction: the stated interpretation flags Close vs MA50 as Bullish while MA50 vs MA200 remains Bearish. This is a classic “recovery-within-a-bigger-structure” configuration—price can be acting well relative to the intermediate baseline without yet flipping the long moving-average stack into a fully trend-following alignment.
That split helps explain why weekly rank strength (#5) can coexist with a neutral monthly rank (#223). When the short/intermediate trend turns up ahead of the long trend, cross-sectional models often reward recent persistence (weekly) while reserving longer-horizon confirmation until the slower structure improves. In these regimes, level behavior tends to matter: a move that sustains above the 268.0590 resistance zone is typically more consistent with “trend continuation,” while weakness that re-tests and loses 156.9023 can shift the profile from recovery to deterioration risk.
Participation cues are also relevant because a price move that is not supported by volume/flow tends to be less stable. Later signal diagnostics are broadly supportive on that dimension (multiple accumulation/volume-flow measures are bullish), which complements the “Close vs MA50 bullish” statement even while the longer MA relationship remains a constraint. Overall, the price/trend panel suggests a market that is trying to build trend persistence but has not fully transitioned into an unambiguous long-trend regime.
Interpretation: Close vs MA50 = Bullish, MA50 vs MA200 = Bearish.
3) Momentum & volatility dashboard
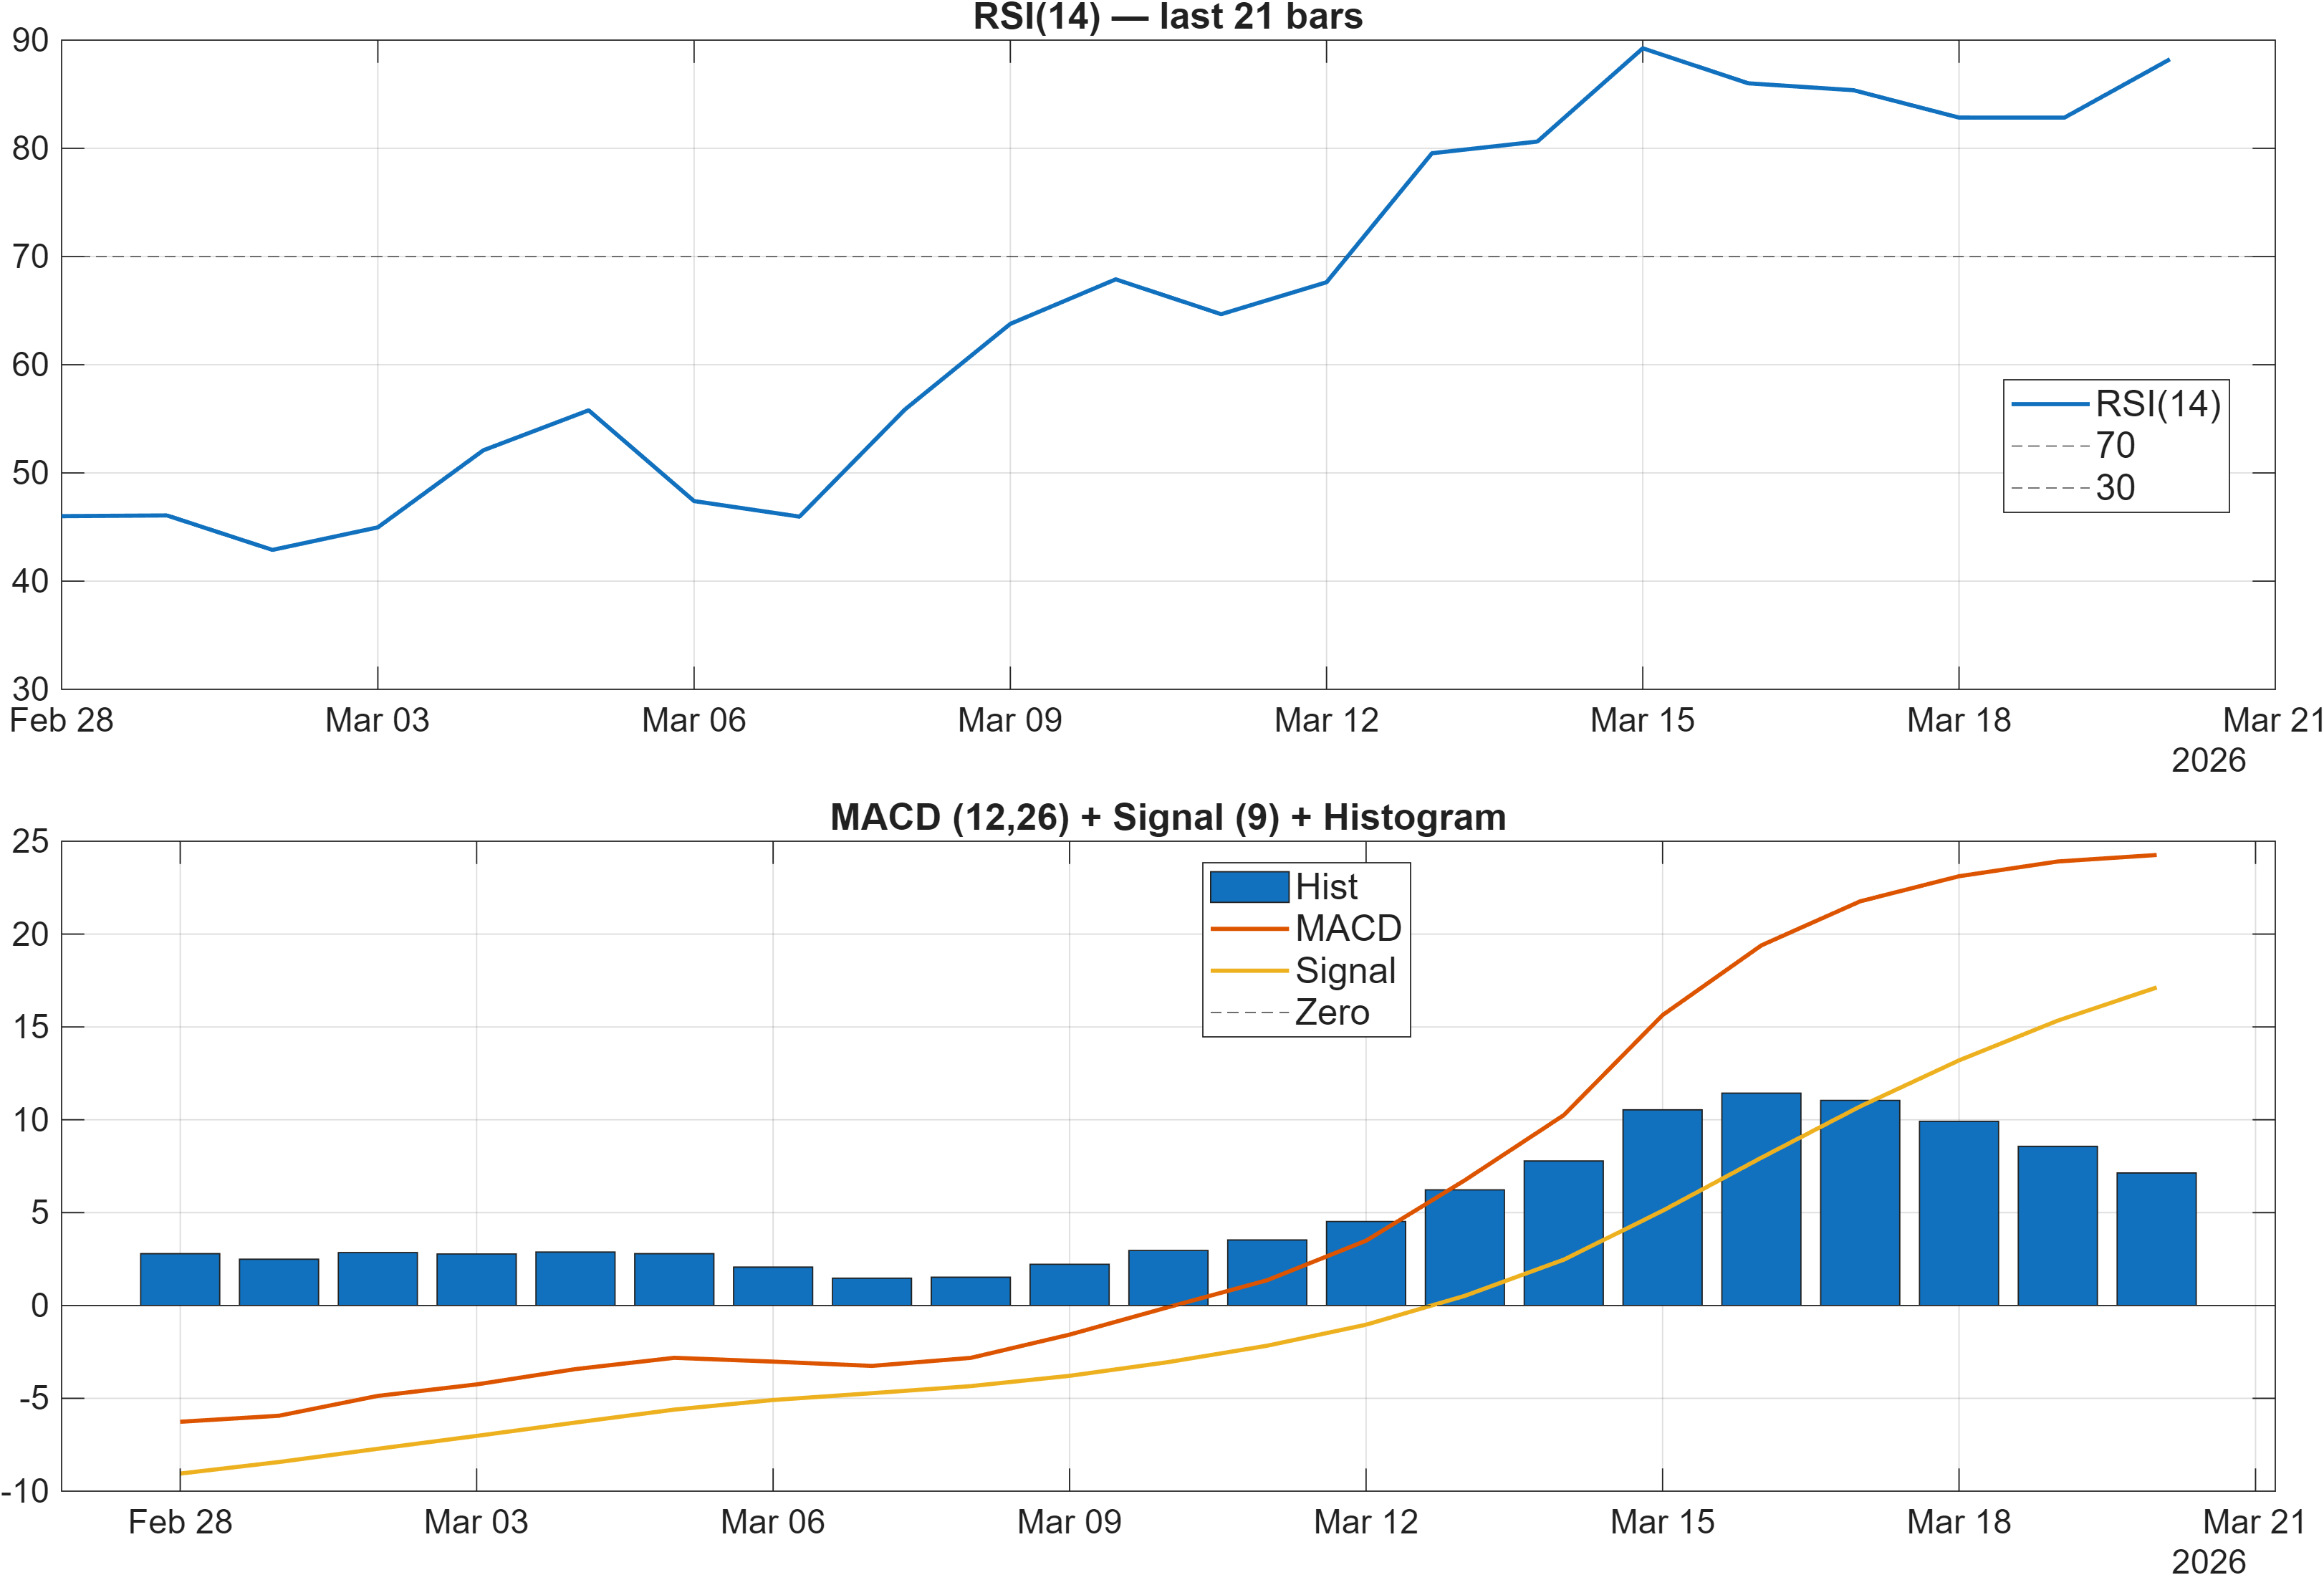
Momentum is the clearest area of strength. RSI(14) is 88.23 (bullish per the signal table) and the MACD histogram is positive at 7.1349 (also shown as 7.135 in the 18-signal table). Together, these readings indicate a strong upside impulse, but they also raise an analytical constraint: very elevated RSI levels can coincide with either sustained trending behavior or late-stage acceleration that becomes sensitive to reversals.
The volatility panel adds nuance. Bollinger bandwidth at 0.7596 is presented as the latest volatility regime value and is labeled neutral in the signal table (BB Width). Expanded bandwidth commonly reflects a market that has moved from compression into expansion—conditions that can support continuation but also widen the distribution of outcomes around key levels. In other words, directional momentum may be strong, but the path dependency tends to increase: reactions around support/resistance matter more than in quiet regimes.
Internally, the momentum complex remains consistent with the bullish confluence: TS Mom(20) is bullish at 95.58 and ROC(20) is bullish at 52.9. The main balancing factor is not the presence of bearish momentum signals—those are not prominent here—but rather whether the current volatility/impulse combination can remain orderly. The dashboard therefore reads as momentum-led strength under a higher-volatility envelope, which often demands tighter confirmation from participation and level holds.
Interpretation: RSI bias = Bullish, MACD hist = 7.1349.
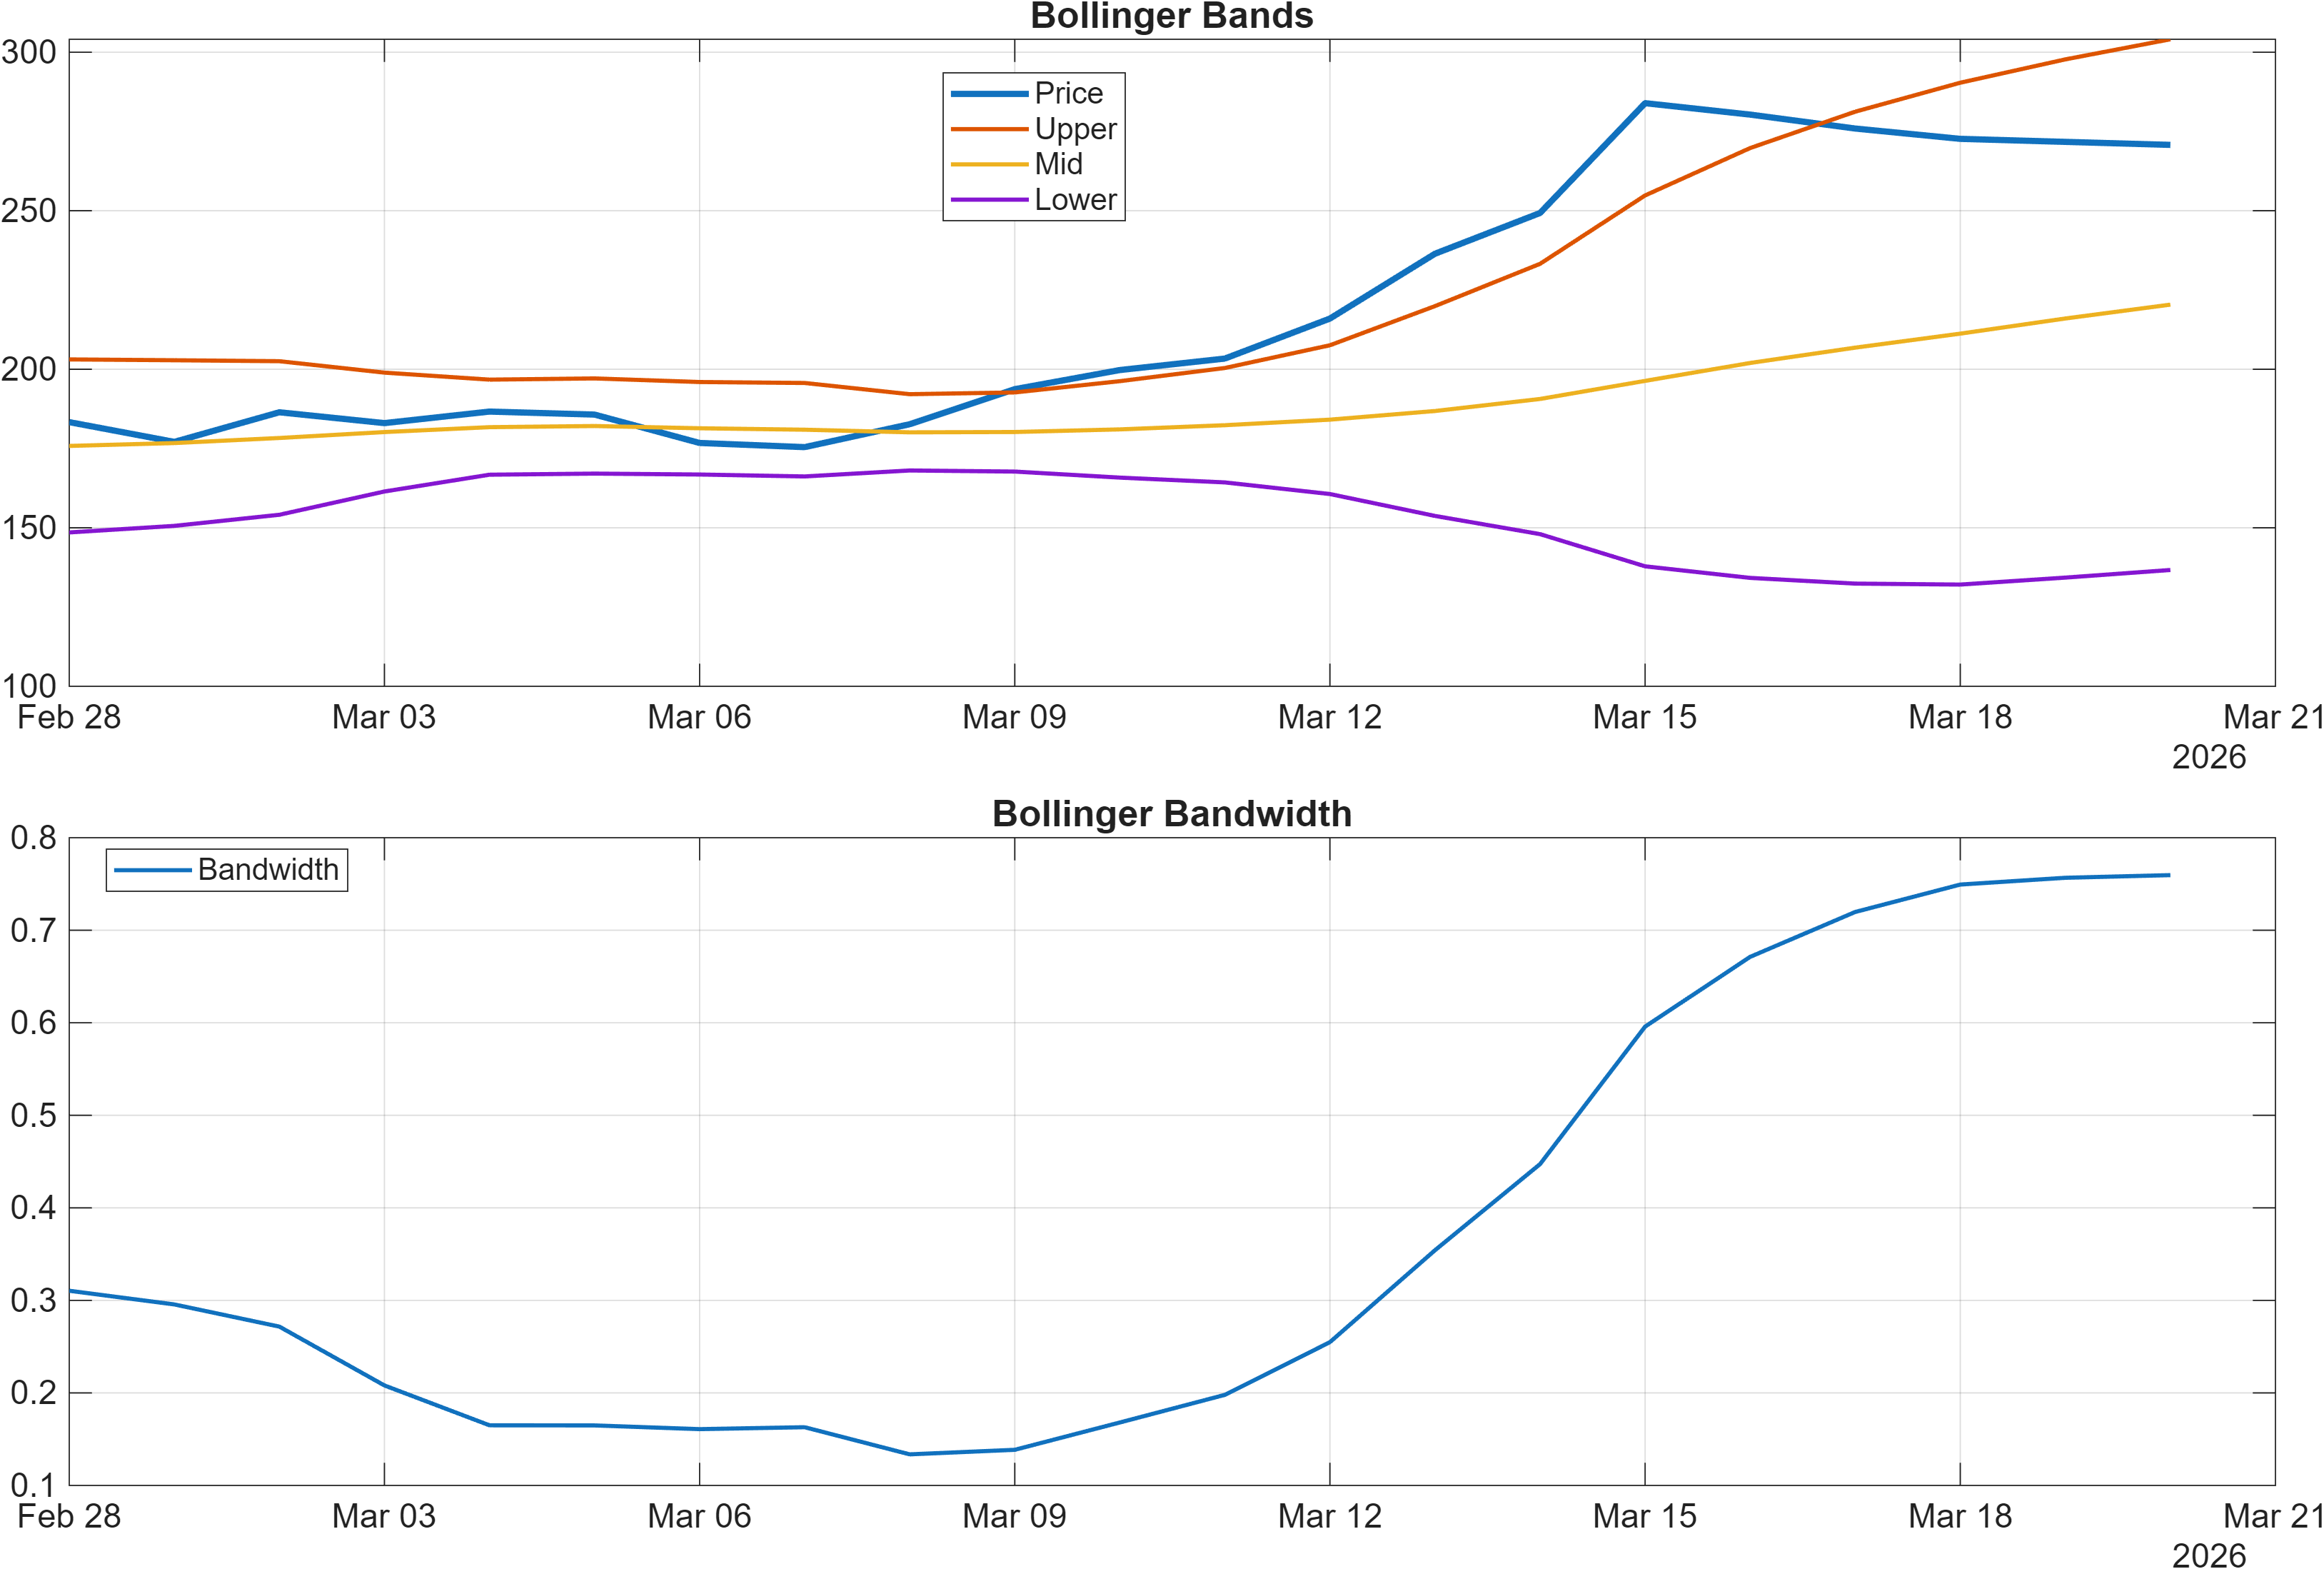
Interpretation: Bandwidth (volatility regime) latest = 0.7596.
4) Support / Resistance zones
Support ~ 156.9023 | Resistance ~ 268.0590
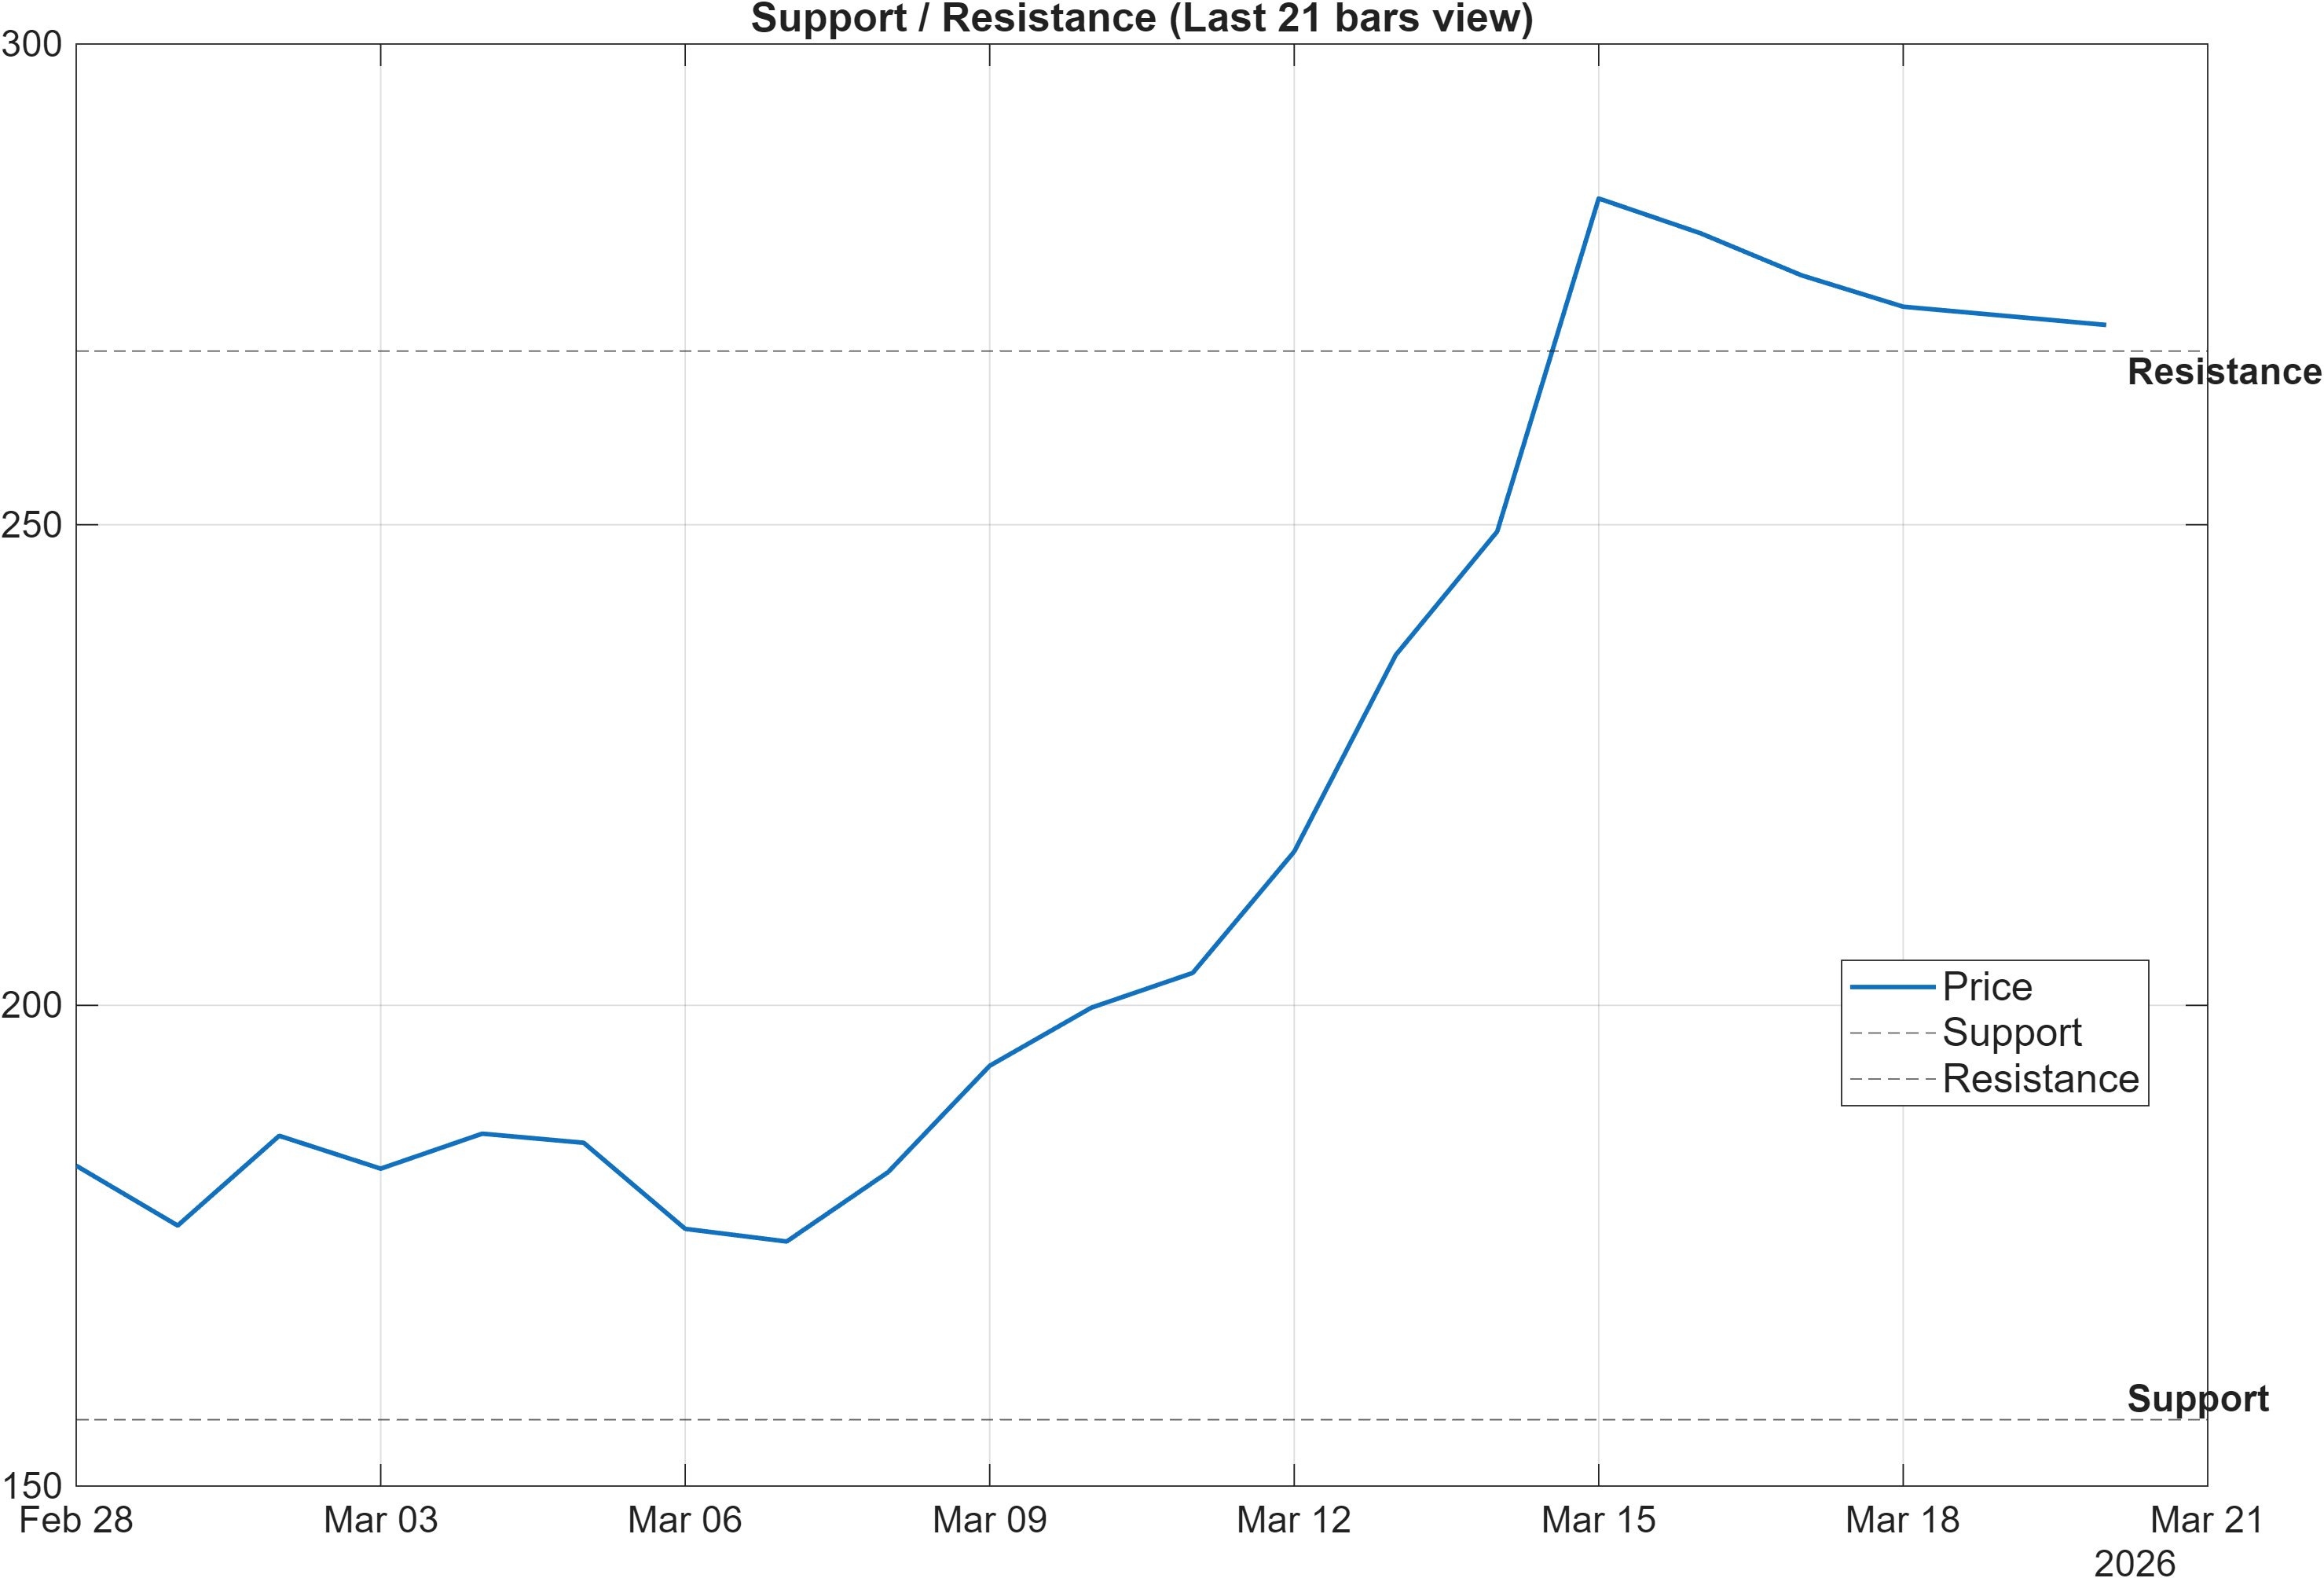
The current map is clean: 156.9023 is the primary probabilistic support zone and 268.0590 is the primary probabilistic resistance zone. With momentum elevated (RSI(14) 88.23; MACD histogram 7.1349) and volatility expanded (bandwidth 0.7596), these levels function less like “lines” and more like decision regions that help distinguish continuation from fading strength.
A key nuance is the interaction between level tests and participation. Several flow/accumulation measures in the 18-signal panel are bullish (for example ADOSC at 41.97 and OBV slope(10) at 4.595e+08), which can improve the quality of a resistance challenge if the break is accompanied by sustained activity. Conversely, if price compresses beneath resistance while volatility remains elevated, reversals can become sharper—especially when RSI is already high.
The scenario framing provided is appropriately conditional: “Break above resistance with volume → continuation. Close below support → signal deterioration risk.” Given the rank dispersion (weekly #5 vs monthly #223), the most informative development is whether TAO22974-USD can convert short-window strength into structural confirmation. In practice, that conversion tends to show up as successful retests above prior resistance or higher-lows above support rather than one-off spikes.
Scenario view: Break above resistance with volume → continuation. Close below support → signal deterioration risk.
5) Quant Technical Dashboard (18 Signals)
KGNAI AI Technical Analysis Score (Deep Reinforcement Learning): Rank #184 out of 800 (Rank 1 represents the strongest technical positioning and a higher probability of favorable price behavior. As ranks increase toward the maximum, the probability of favorable outcomes weakens and bearish positioning becomes more dominant.) | Label: Neutral | Score: 0.540
18-Signal Technical Confluence Score: 0.667 (Bullish)
Overall Technical Score (18-signal confluence + DRL rank blend): 0.629 (Bullish)
Note: The blended score reflects signal strength weighted against broader AI technical ranking, which may temporarily diverge.
Blended technical score breakdown: 0.629 (Bullish | Bull 13 / Bear 1 / Neutral 4)
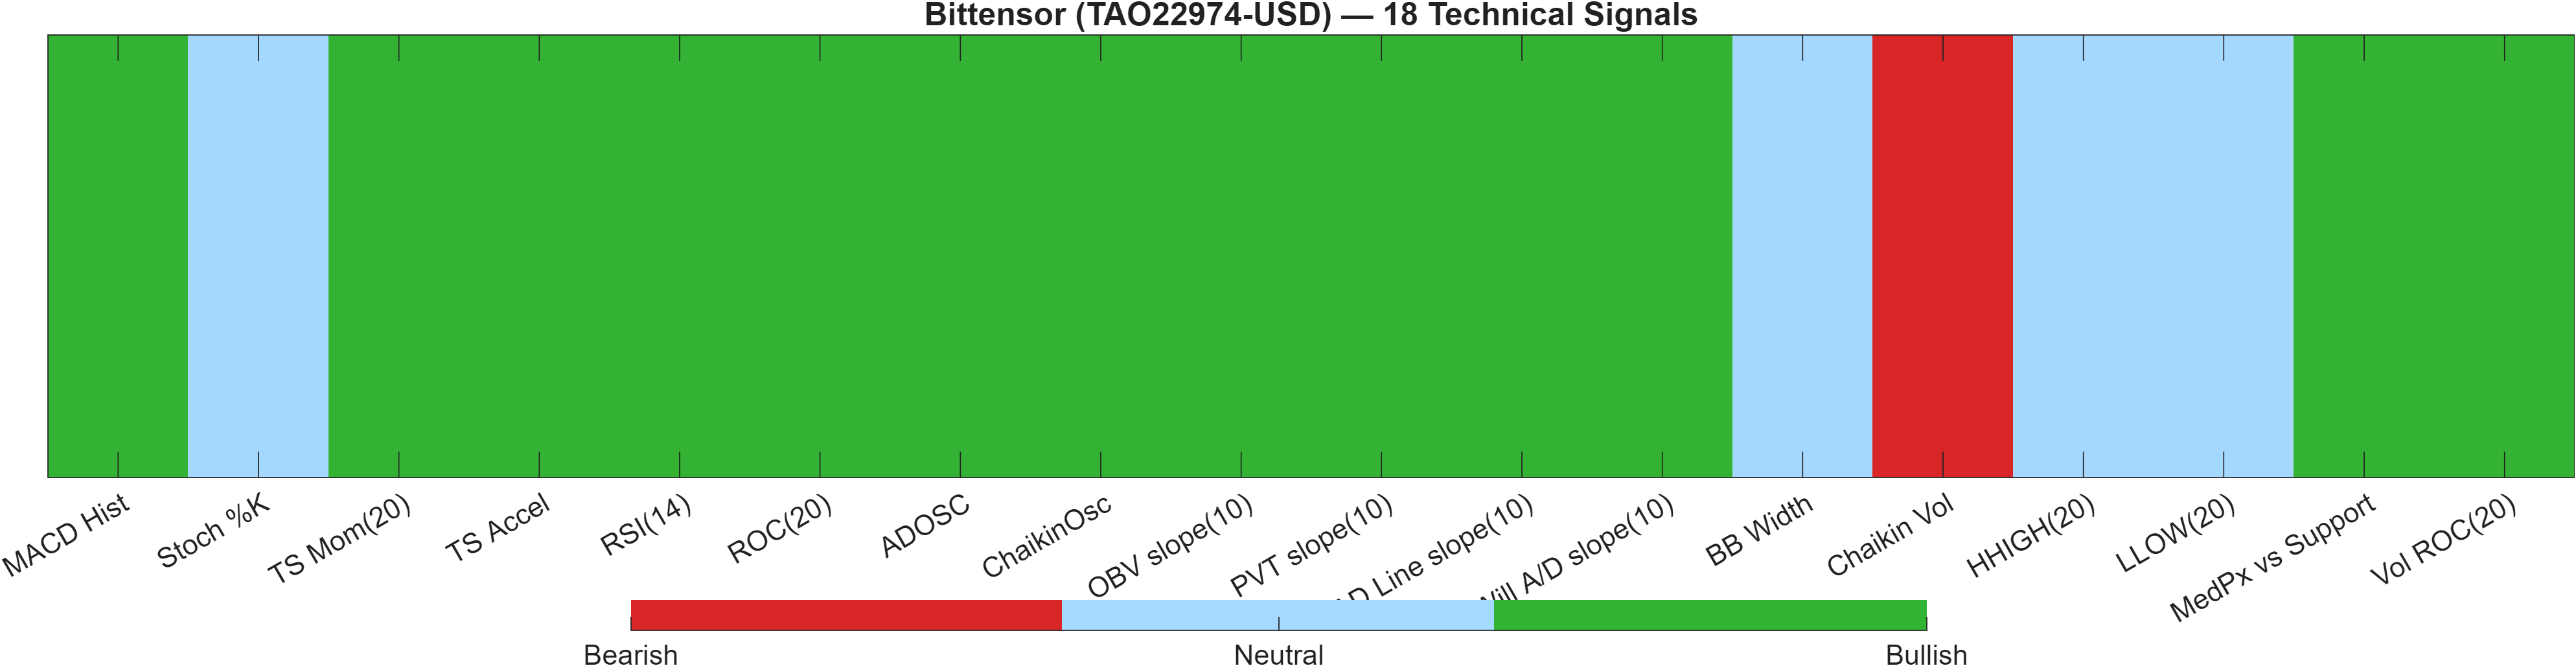
This dashboard highlights a constructive breadth profile with a meaningful model-level caveat. The confluence layer is Bullish at 0.667, and the blended technical score remains Bullish at 0.629 with Bull 13 / Bear 1 / Neutral 4. At the same time, the DRL technical rank is #184 with a Neutral label and score 0.540, implying the reinforcement-learning model is less convinced than the indicator ensemble.
The indicator mix suggests strength is not confined to one category. Momentum is aligned (RSI(14) 88.23; TS Accel 72.9; MACD histogram 7.135), and participation indicators also lean supportive (ADOSC 41.97; AD Line slope(10) 6.919e+08; PVT slope(10) 1.511e+08). When both momentum and volume-flow confirm, trends tend to be more resilient than momentum-only moves.
The primary friction points are contained rather than broad. Only one explicit bearish reading appears in the table (Chaikin Vol at 43.47), while BB Width at 0.7596 is neutral, consistent with a volatility regime that can amplify both continuation and pullback phases. The DRL vs confluence divergence is therefore best read as signal agreement on direction with less agreement on stability—a setup where reaction around 268.0590 and 156.9023 can quickly shift the balance.
Signal table (Bull/Bear/Neutral)
| Indicator | Value | Signal |
|---|---|---|
| MACD Hist | 7.135 | Bullish |
| Stoch %K | 74.23 | Neutral |
| TS Mom(20) | 95.58 | Bullish |
| TS Accel | 72.9 | Bullish |
| RSI(14) | 88.23 | Bullish |
| ROC(20) | 52.9 | Bullish |
| ADOSC | 41.97 | Bullish |
| ChaikinOsc | 1.177e+08 | Bullish |
| OBV slope(10) | 4.595e+08 | Bullish |
| PVT slope(10) | 1.511e+08 | Bullish |
| AD Line slope(10) | 6.919e+08 | Bullish |
| Will A/D slope(10) | 61.55 | Bullish |
| BB Width | 0.7596 | Neutral |
| Chaikin Vol | 43.47 | Bearish |
| HHIGH(20) | 299.9 | Neutral |
| LLOW(20) | 172.7 | Neutral |
| MedPx vs Support | 115.6 | Bullish |
| Vol ROC(20) | 198 | Bullish |
Interpretation: Indicator-level signals form the base confluence, which is then adjusted using a separate AI-driven technical ranking model. The final technical score summarizes this combined view.
6) News sentiment + extractive gist
Sentiment score (avg): 0.000 | Positive: 0% | Neutral: 100% | Negative: 0%
KGNAI AI News Sentiment Score (normalized -1 to +1): Not available (as of —) | Label: Not available | Overall news score: 0.00
Positive Developments
Recent coverage across major financial outlets indicates a constructive narrative focused on ecosystem visibility and product-related milestones, with attention on decentralized AI training themes and model/subnet activity. The tone is notable less for overt optimism in the sentiment engine (which remains mechanically neutral at 0.000 and 100% neutral classification) and more for the type of discussion: network activity, community attention, and broader recognition dynamics. When price momentum is already elevated (RSI(14) 88.23; MACD histogram 7.1349), “visibility” stories can coincide with intensified participation—consistent with the bullish cluster of volume/flow indicators such as ADOSC (41.97) and Vol ROC(20) (198). The key analytical point is that these developments may support attention and liquidity conditions, but the quant sentiment classification in the provided data does not register them as positive; therefore, they function as context rather than a measurable sentiment tailwind in this snapshot.
Neutral / Mixed Developments
The news signal itself is best interpreted as Neutral: an average score of 0.000, with 0% positive and 0% negative. That distribution often appears when the pipeline is dominated by descriptive or event-style coverage that the model does not score as directional, even if market participants interpret it as supportive. For the tape, this means the principal drivers remain technical—particularly the bullish confluence (0.667) and the mixed longer-trend read (Close vs MA50 bullish, MA50 vs MA200 bearish). As a result, the more reliable framework is to treat coverage as a backdrop while monitoring whether price action confirms at resistance (268.0590) or loses support (156.9023).
Negative / Risk Signals
The primary “risk” signal from the news block is not negative sentiment—none is detected in the provided distribution—but rather the absence of a measurable directional tilt despite heightened market activity. When momentum is extreme (RSI(14) 88.23) and volatility is expanded (bandwidth 0.7596), a neutral sentiment tape can coincide with faster regime shifts because there is less stabilizing narrative consensus embedded in the sentiment measure. Additionally, the report indicates the KGNAI AI News Sentiment Score is Not available (normalized -1 to +1), which limits model-based cross-checking versus other assets. In practice, this places more weight on technical invalidation logic: a close below 156.9023 would be a clearer deterioration risk marker than any news-based read in this dataset.
- Whether price can accept above 268.0590 with participation consistent with bullish volume/flow signals (e.g., ADOSC 41.97; Vol ROC(20) 198).
- Whether elevated momentum (RSI(14) 88.23; MACD histogram 7.1349) cools via consolidation rather than a sharp reversal in an expanded volatility regime (bandwidth 0.7596).
- Whether rank alignment improves from monthly #223 toward the stronger tiers as weekly leadership (#5) persists.
Snapshot: AI Rank (Short–Mid–Long): Mixed (Bullish–Neutral–Neutral) · Technical Confluence: Bullish · Key Levels: Support ~156.90 | Resistance ~268.06 · News Sentiment: Neutral
7) Sources
Sources referenced: Reuters, Bloomberg, Yahoo Finance, MarketWatch, Investing.com
You may also like: How KGNAI AI ranks instruments across global markets
Disclaimer: KGNAI provides AI-generated analytics and educational market commentary only. This is not financial advice. Markets involve risk. Always do your own research.