
WBTC-USD (Wrapped Bitcoin) — 15-Mar-2026 Technicals Lean Constructive, but Blended Signals Stay Neutral
Wrapped Bitcoin (WBTC-USD) enters 15-Mar-2026 with a constructive cross-horizon rank profile inside KGNAI’s CRYPTO universe of 800 instruments, while the blended technical composite remains more restrained. Weekly, monthly, and 3-month ranks sit in the upper tier (including #33, #30, and #23), suggesting persistent relative strength even as the daily rank (#144) signals a less aggressive near-term edge. On the indicator layer, momentum remains supportive: RSI(14) at 62.74 and MACD histogram at 668.6262 indicate upside bias, while Bollinger Bandwidth at 0.1302 frames a volatility regime that is neither compressed nor extreme. The key tactical boundary is defined by support near 64455.9697 and resistance near 91654.1932, where confirmation vs invalidation should be assessed using both price acceptance and volume behavior. News sentiment reads broadly neutral with a slight positive tilt (avg 0.037).
- Rank stance (Short / Mid / Long): Bullish / Bullish / Bullish (daily #144; weekly #33; monthly #30; 3-month #23).
- Technical confluence: Bullish on 18-signal score (0.556), but overall blended technical score is Neutral at 0.242.
- Key levels: Support ~ 64455.9697 | Resistance ~ 91654.1932.
- News sentiment bias: Neutral (avg 0.037; 25% positive / 63% neutral / 12% negative).
- Confirmation / invalidation: Acceptance above 91654.1932 with volume supports continuation; sustained weakness below 64455.9697 raises deterioration risk.
KGNAI evaluates assets using large cross-sectional datasets built from millions of structured data points. Inputs incorporate fundamental metrics, technical structures, and systematically processed news sentiment. Statistical models, machine learning, and AI frameworks are used to assess relative positioning, signal alignment, and probabilistic behavior across broad universes.
- Ranks are comparative across the tracked universe, not absolute price targets.
- Confluence reflects alignment among independent signal groups.
- Support/resistance levels are probabilistic decision zones, not guarantees.
- Sentiment provides contextual bias within the broader analytical framework.
1) KGNAI AI Analysis
Region: CRYPTO
Total universe size: 800 ranked instruments
- Daily rank: #144 out of 800 — Bullish
- Weekly rank: #33 out of 800 — Bullish
- Monthly rank: #30 out of 800 — Bullish
- 3-Monthly rank: #23 out of 800 — Bullish
The rank stack shows a clear time-horizon advantage that strengthens as the window extends. Weekly (#33), monthly (#30), and 3-month (#23) readings position WBTC-USD in the upper slice of the 800-instrument universe, consistent with persistent relative strength characteristics rather than a one-session anomaly. By contrast, the daily rank (#144) is still bullish but sits further from the top cohort, implying that near-term behavior may be more sensitive to pullbacks, liquidity shocks, or regime noise than the medium-horizon profile suggests.
This configuration often matters when deciding whether to treat strength as trend persistence (supported by the multi-week/month placement) or as late-stage momentum (suggested when daily positioning lags the longer windows). Here, the longer-horizon dominance argues that any short-term volatility should be evaluated as a potential test of conviction rather than immediate structural failure—provided key levels hold.
KGNAI’s framework also highlights that rankings are probabilistic and recalculated with incoming data. The current alignment—bullish across short/mid/long term views—adds consistency, while the daily-vs-longer horizon spread signals the need for confirmation via price acceptance at nearby decision zones.
Term view: Short-term: Bullish. Mid-term: Bullish. Long-term: Bullish.
Want the full universe and complete rank tables? Unlock full access on KGNAI: https://www.kgnai.com/pricing
2) Price & trend overview
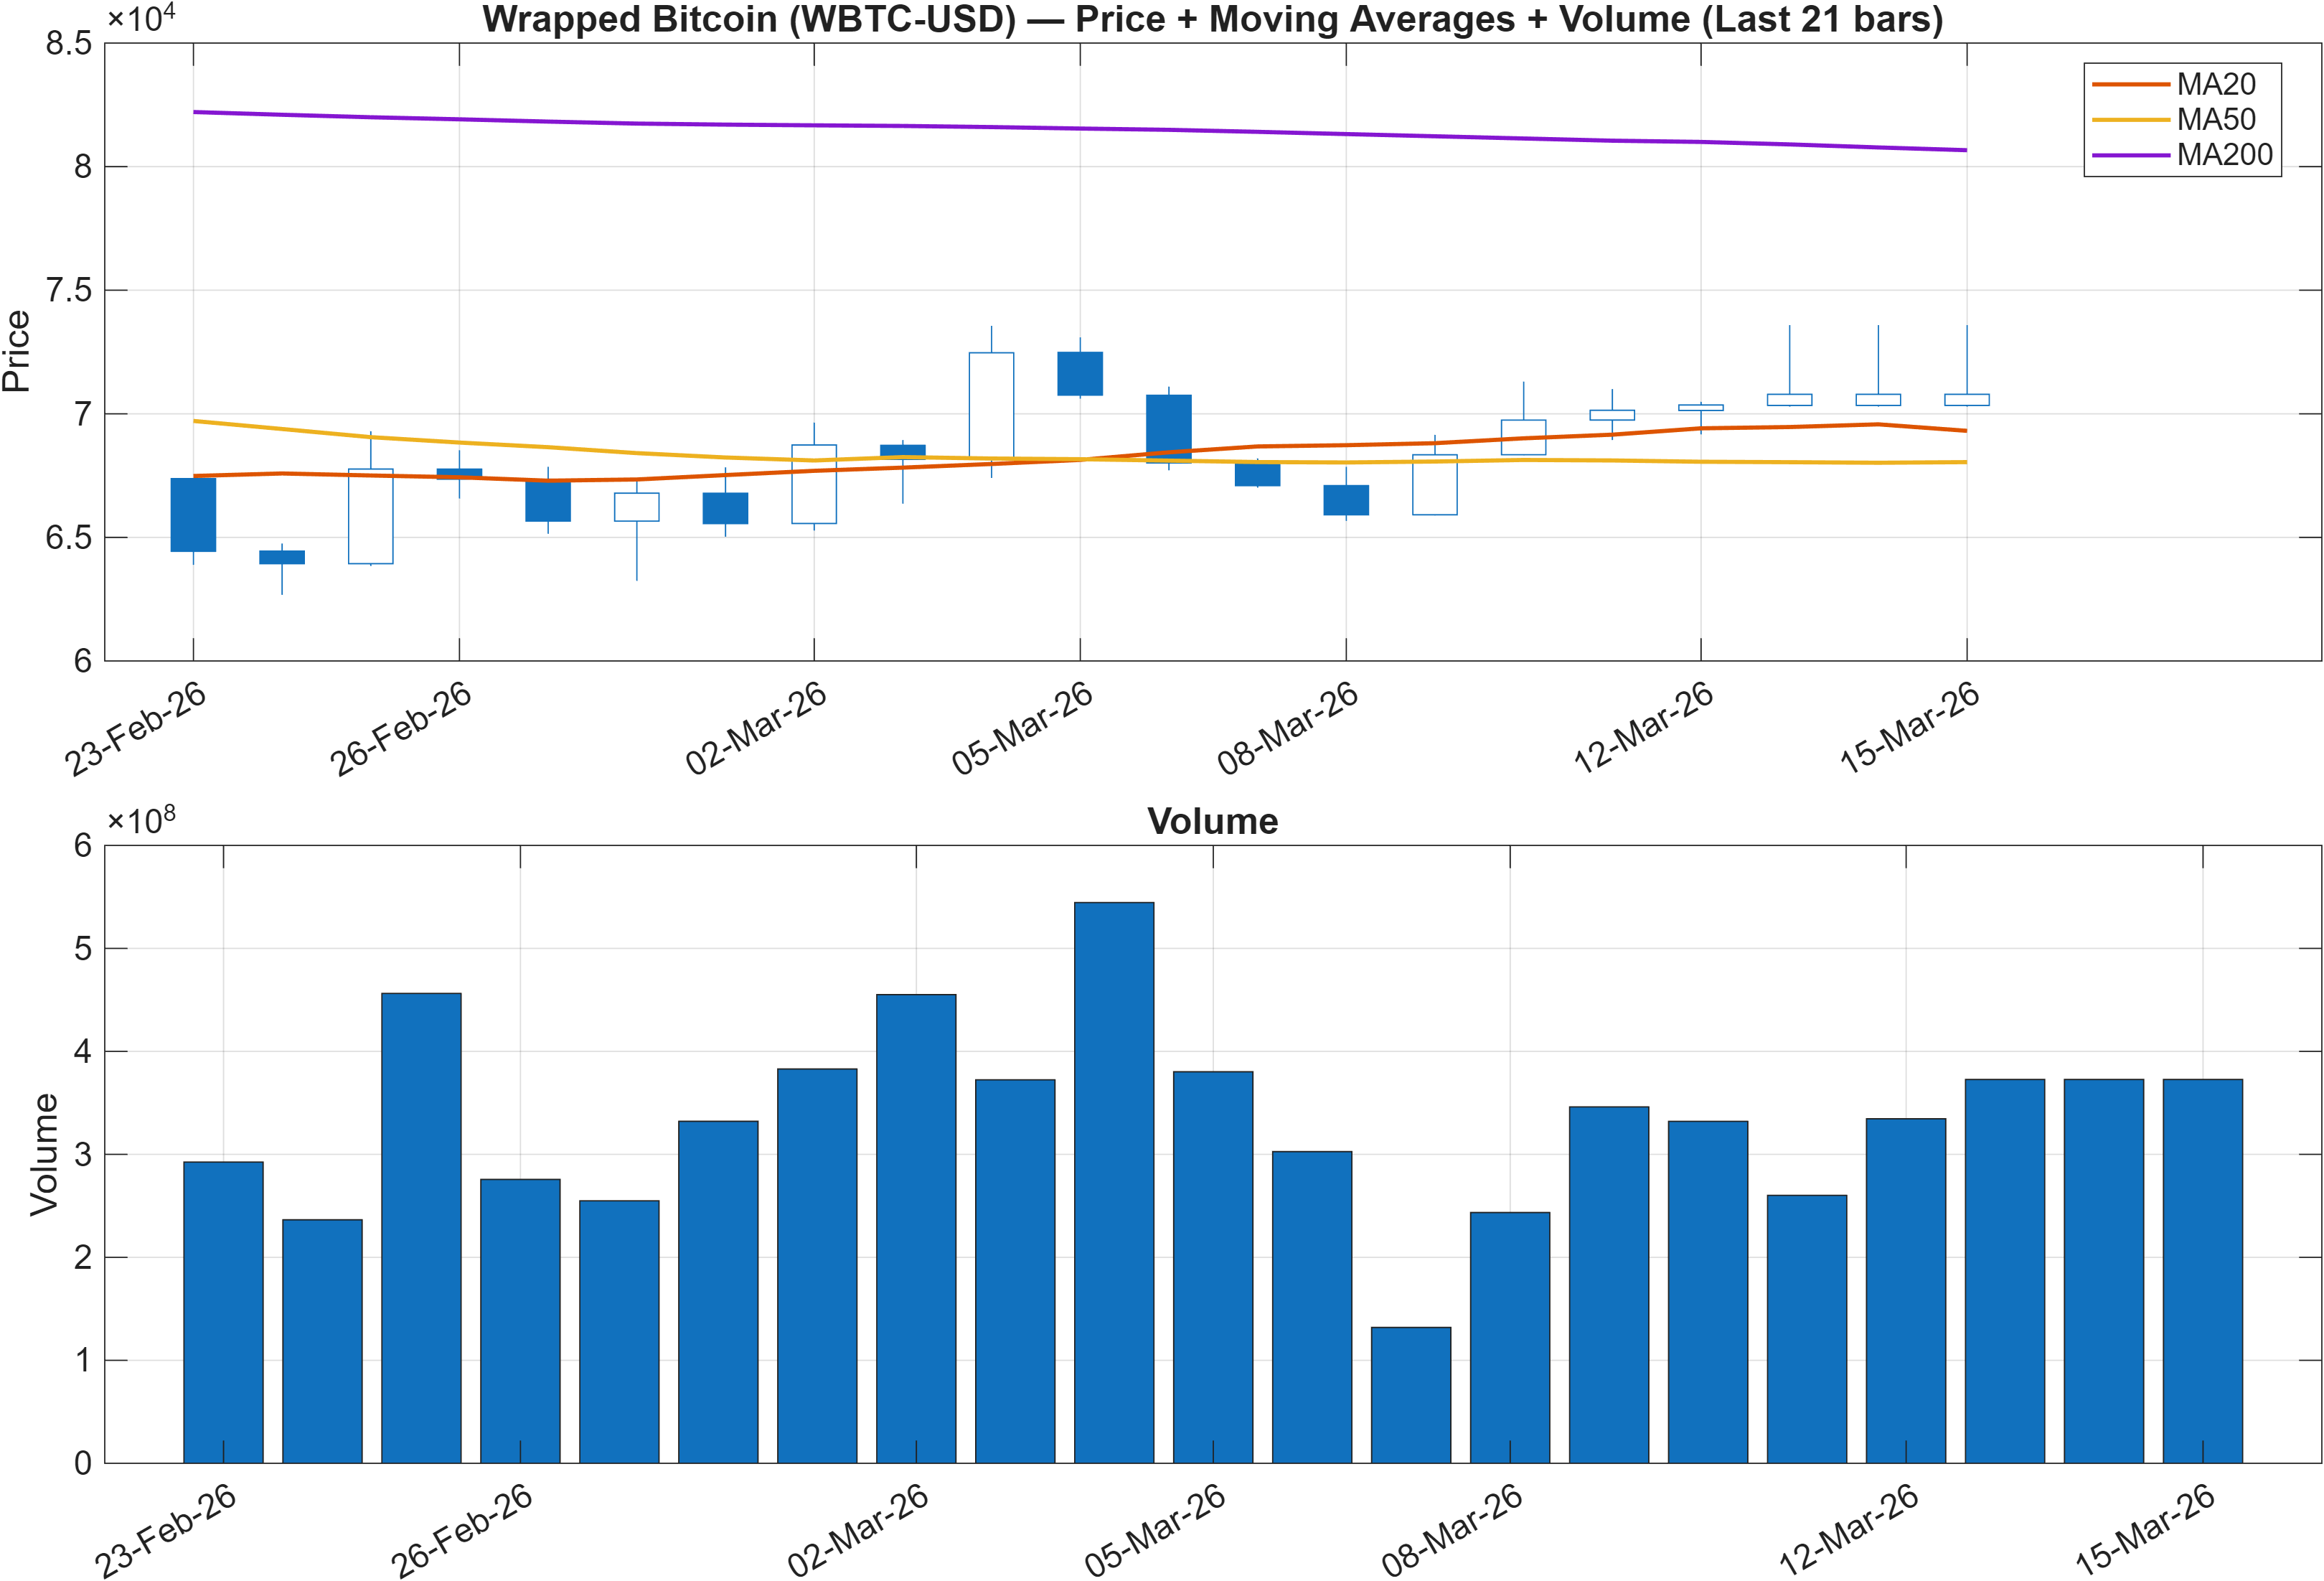
Interpretation: Close vs MA50 = Bullish, MA50 vs MA200 = Bearish.
Trend structure is best described as constructive but not fully synchronized across moving-average horizons. The close sitting above the MA50 is a classic confirmation that nearer-term trend participants remain in control, aligning with bullish ranks on weekly (#33) and monthly (#30) horizons. However, the MA50 remaining below the MA200 keeps the longer-term moving-average regime flagged as bearish, which can matter in crypto when broader risk appetite or liquidity conditions tighten.
That split typically produces two practical implications for market structure: first, rallies can persist while the market is “repairing” the longer-term trend, but second, pullbacks may be sharper because longer-horizon holders are not yet fully aligned with the move. In this context, the support zone at 64455.9697 becomes a key reference for whether trend repair is holding, while resistance at 91654.1932 marks where a market often needs additional participation (volume expansion and follow-through) to validate continuation.
With the daily rank at #144 (bullish but not top-cohort), the price/MA configuration argues for monitoring trend persistence vs exhaustion: strength above MA50 can coexist with a larger regime still transitioning. A clean shift toward broader alignment would typically be reflected by sustained price strength that keeps pullbacks shallow relative to the 64455.9697 area and maintains constructive momentum readings.
3) Momentum & volatility dashboard
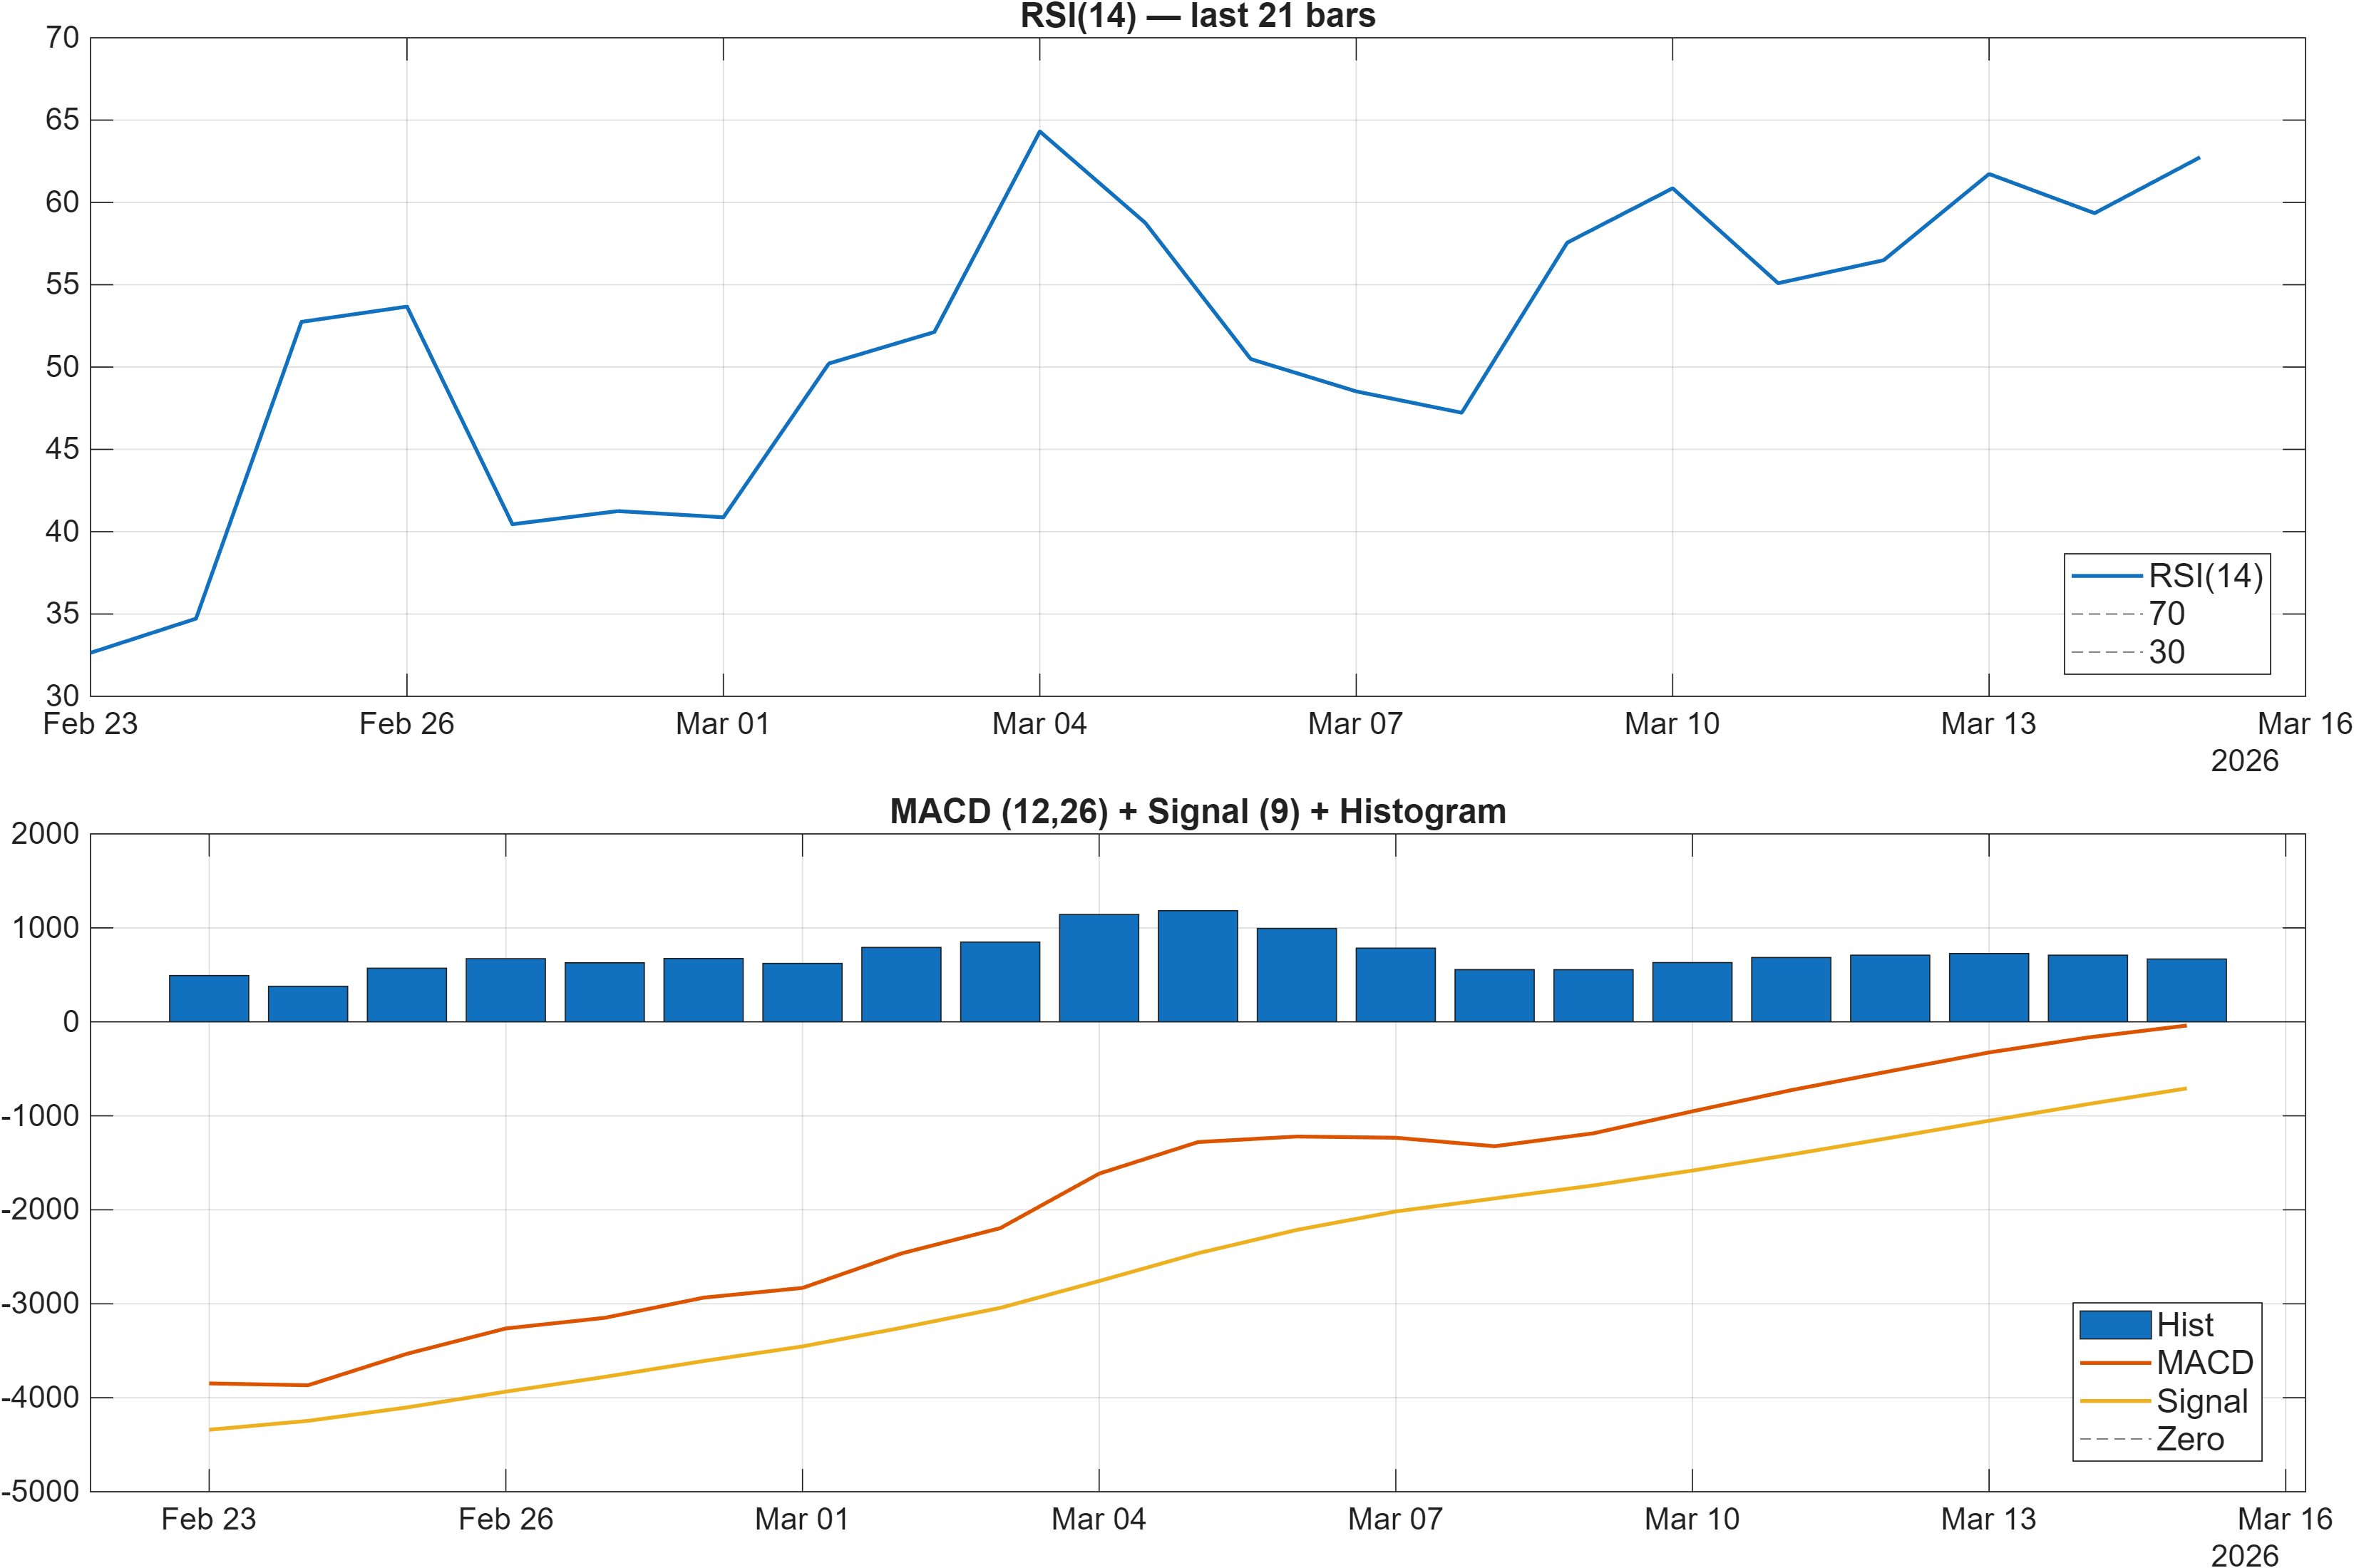
Interpretation: RSI bias = Bullish, MACD hist = 668.6262.
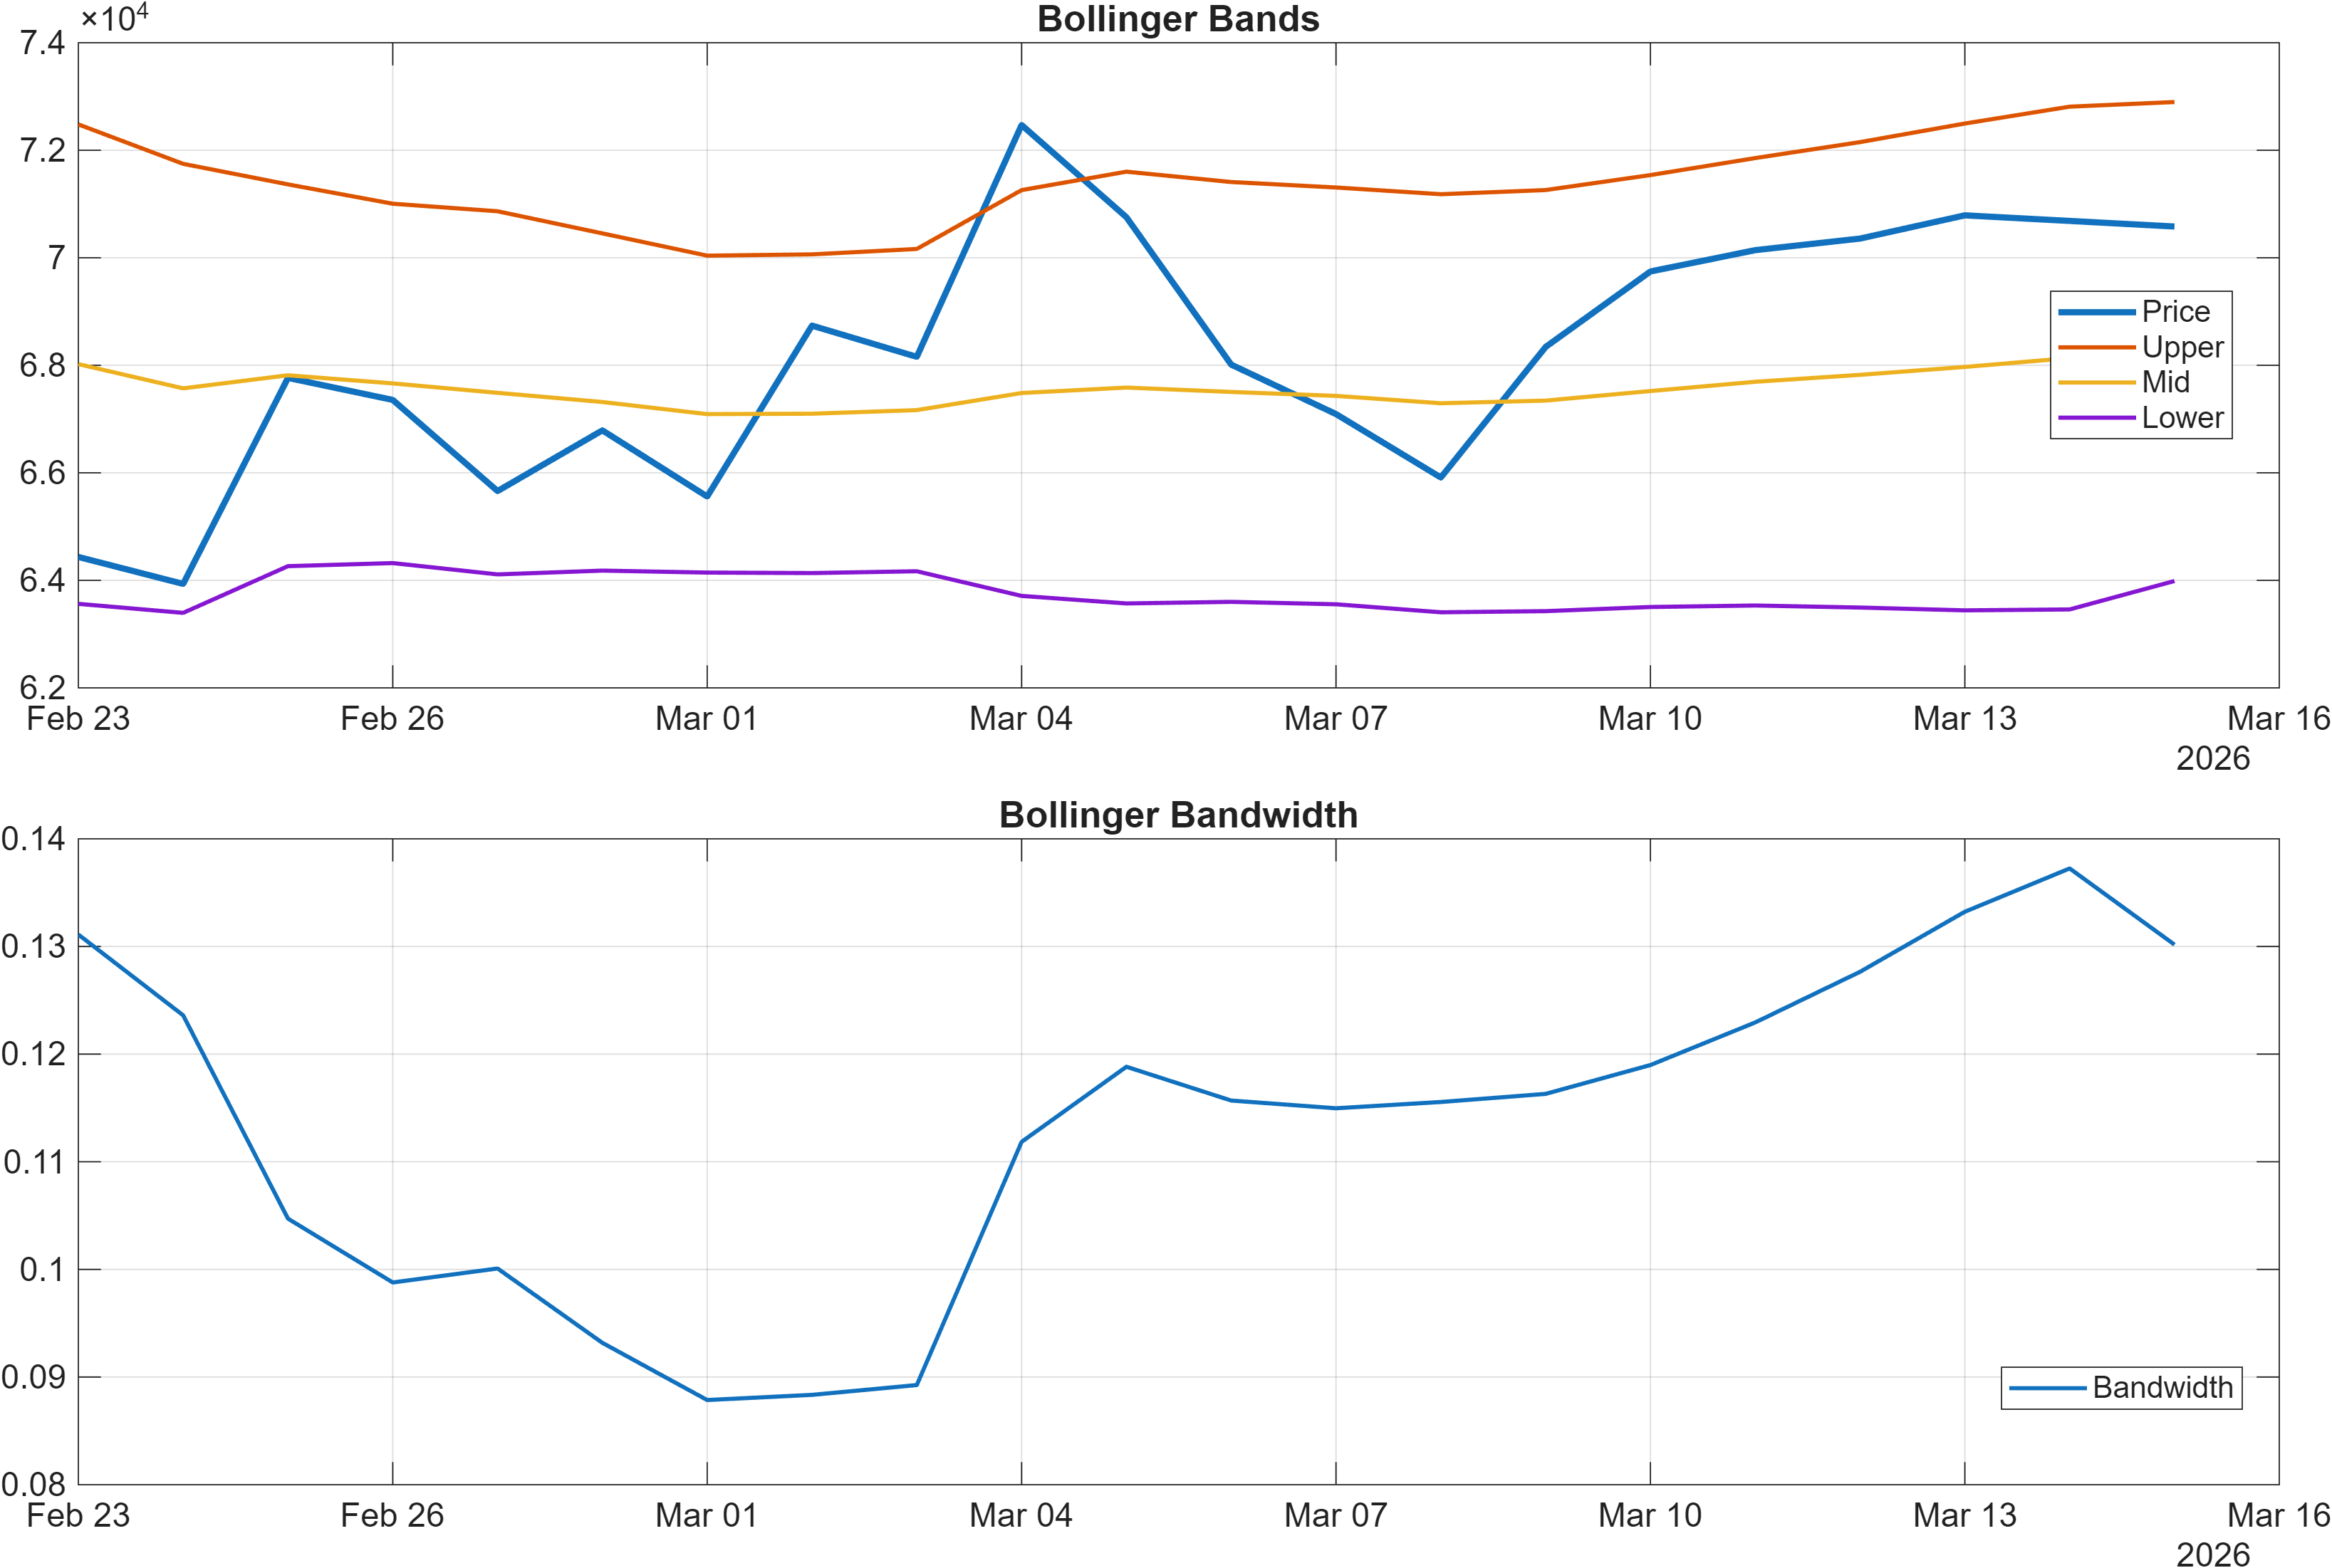
Interpretation: Bandwidth (volatility regime) latest = 0.1302.
Momentum signals are broadly consistent with a market that remains bid on dips rather than mean-reverting. RSI(14) at 62.74 sits in a constructive zone—firmly positive without reading as an immediate extreme—while the MACD histogram at 668.6262 reinforces that upside momentum is still present. This aligns with the confluence-heavy posture reflected in the 18-signal layer (0.556 bullish) and supports the idea that the weekly/monthly rank strength is not purely residual.
Volatility, however, looks more like managed expansion than a squeeze-release event. Bollinger Bandwidth at 0.1302 indicates neither tight compression nor runaway volatility, which often corresponds to trend phases where continuation can occur but requires periodic resets. In practice, that tends to raise the value of key structural levels: if volatility is not extreme, the market often respects nearby support/resistance zones more cleanly.
A useful cross-check is the internal consistency between momentum and ranks: the daily rank (#144) being less dominant than the 3-month (#23) suggests momentum can remain positive while short-term positioning becomes more sensitive to any loss of pace. If RSI begins to roll over from the low-60s while MACD histogram contracts materially from 668.6262, that would be consistent with momentum normalization rather than a definitive trend break—unless it coincides with acceptance below 64455.9697.
4) Support / Resistance zones
Support ~ 64455.9697 | Resistance ~ 91654.1932
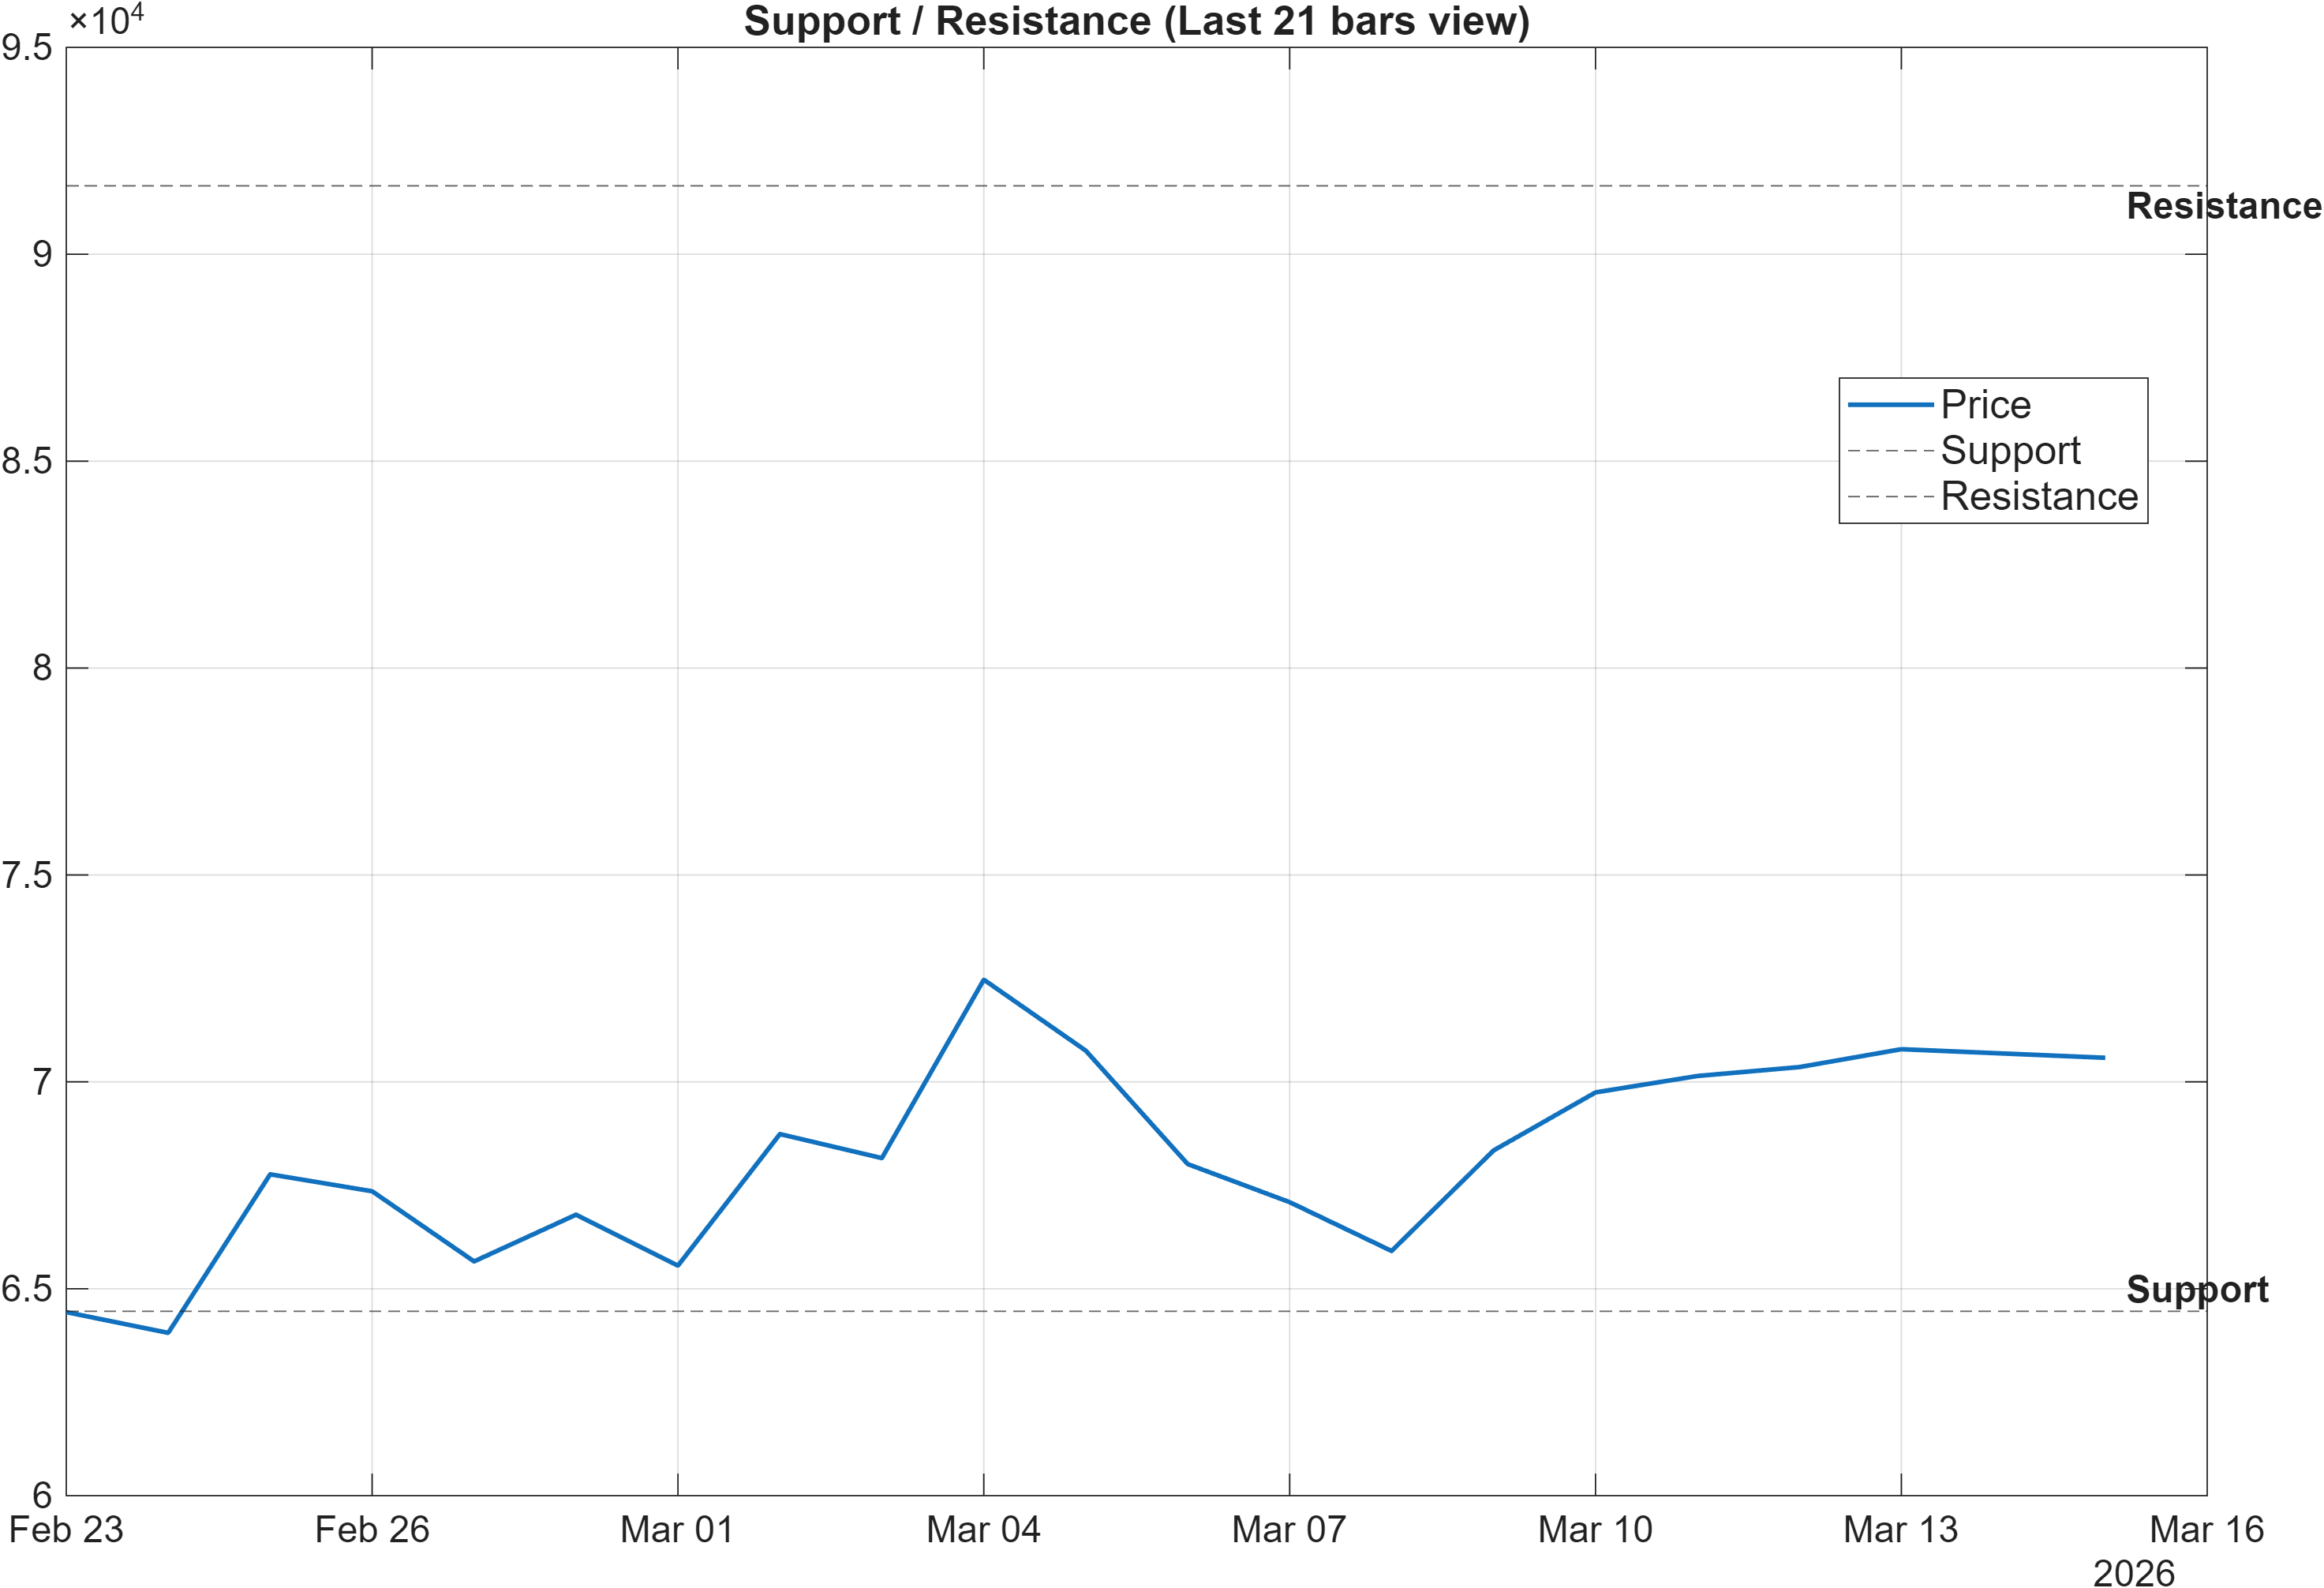
Scenario view: Break above resistance with volume → continuation. Close below support → signal deterioration risk.
The current map is defined by a wide but clean decision band: 64455.9697 as support and 91654.1932 as resistance. With medium-horizon ranks in the upper tier (#33 weekly; #30 monthly; #23 3-month), these levels function less as “targets” and more as validation points for whether the market is continuing to reward trend-following behavior.
From a regime perspective, the moving-average split (close above MA50 but MA50 below MA200) increases the importance of how price behaves around resistance. A break above 91654.1932 that holds with volume would reduce the probability that the current rally is merely a countertrend phase within a longer-term bearish MA regime. Conversely, repeated failure near resistance—especially if paired with fading momentum (e.g., RSI drifting down from 62.74 and MACD histogram losing lift from 668.6262)—would be consistent with an upper-band rejection type of outcome.
On the downside, the support level at 64455.9697 is the main line separating a normal pullback from a potential regime slip. Because volatility (bandwidth 0.1302) is not signaling an extreme environment, the market’s reaction at support may be relatively informative: quick defense can preserve the bullish rank stack, while sustained acceptance below support would more directly challenge the “bullish across horizons” stance.
5) Quant Technical Dashboard (18 Signals)
KGNAI AI Technical Analysis Score (Deep Reinforcement Learning): Rank #596 out of 800 (Rank 1 represents the strongest technical positioning and a higher probability of favorable price behavior. As ranks increase toward the maximum, the probability of favorable outcomes weakens and bearish positioning becomes more dominant.) | Label: Neutral | Score: -0.490
18-Signal Technical Confluence Score: 0.556 (Bullish)
Overall Technical Score (18-signal confluence + DRL rank blend): 0.242 (Neutral)
Note: The blended score reflects signal strength weighted against broader AI technical ranking, which may temporarily diverge.
Blended technical score breakdown: 0.242 (Neutral | Bull 12 / Bear 2 / Neutral 4)
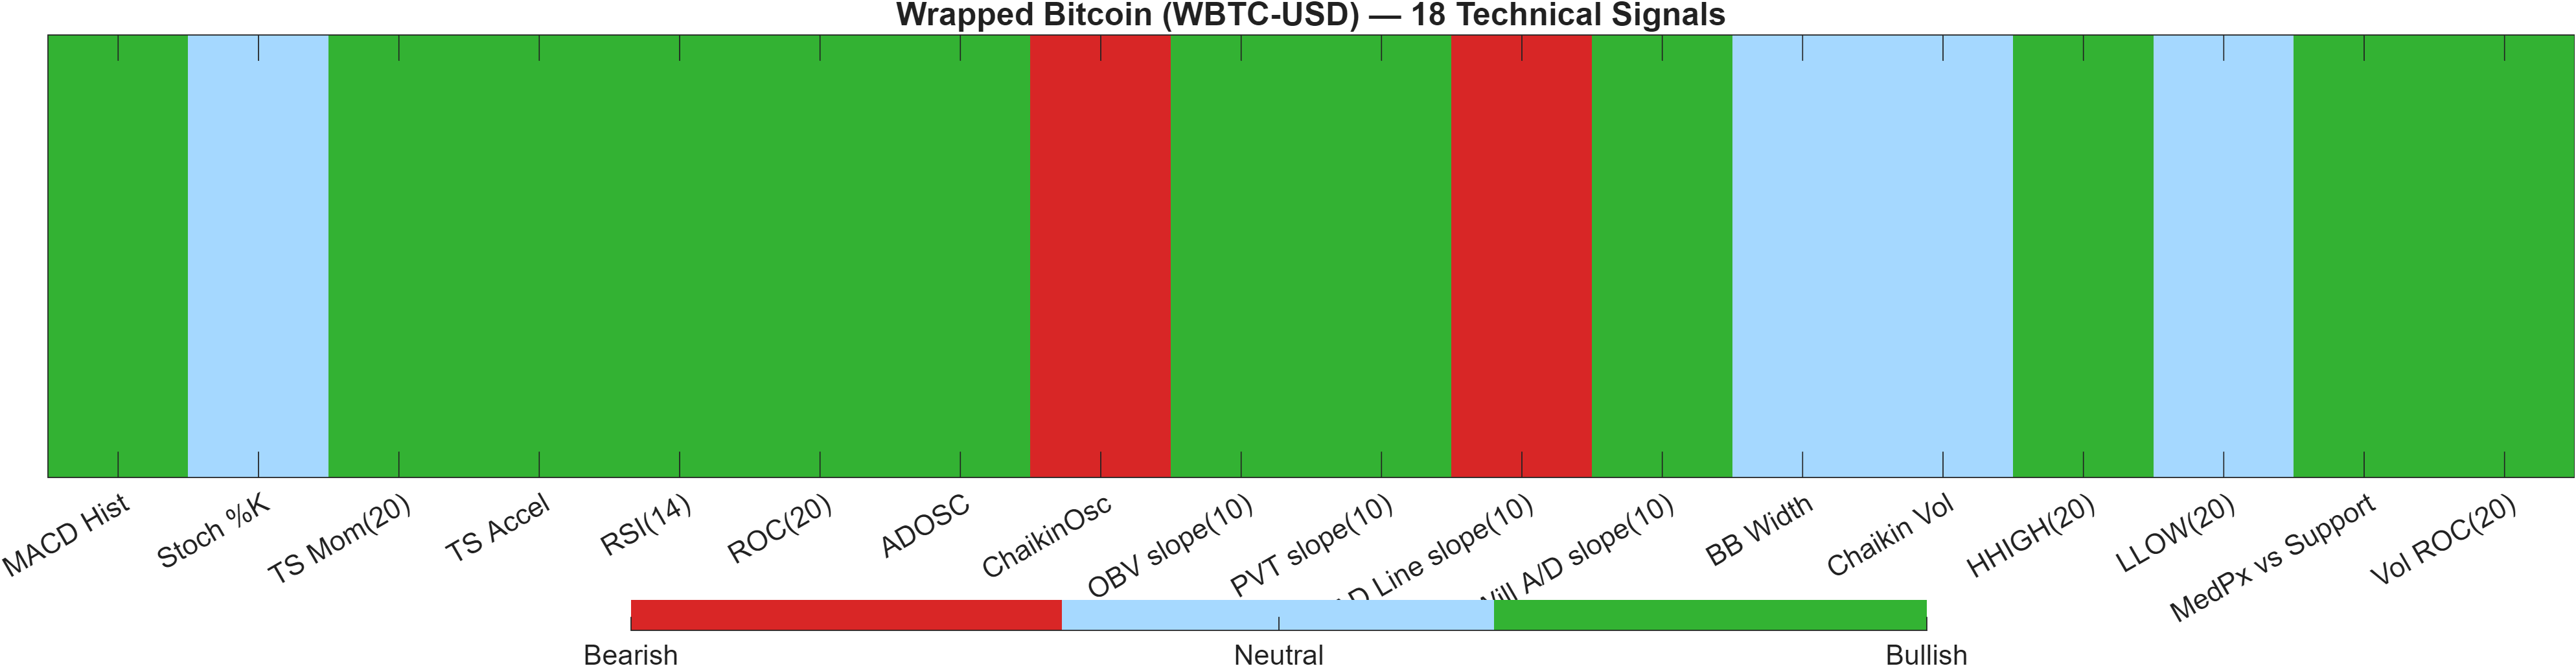
Signal table (Bull/Bear/Neutral)
| Indicator | Value | Signal |
|---|---|---|
| MACD Hist | 668.6 | Bullish |
| Stoch %K | 64.67 | Neutral |
| TS Mom(20) | 6855 | Bullish |
| TS Accel | 5823 | Bullish |
| RSI(14) | 62.74 | Bullish |
| ROC(20) | 10.4 | Bullish |
| ADOSC | 56.81 | Bullish |
| ChaikinOsc | -2.189e+08 | Bearish |
| OBV slope(10) | 9.674e+08 | Bullish |
| PVT slope(10) | 6.573e+06 | Bullish |
| AD Line slope(10) | -8.583e+08 | Bearish |
| Will A/D slope(10) | 646.5 | Bullish |
| BB Width | 0.1302 | Neutral |
| Chaikin Vol | -15.62 | Neutral |
| HHIGH(20) | 7.359e+04 | Bullish |
| LLOW(20) | 6.267e+04 | Neutral |
| MedPx vs Support | 7483 | Bullish |
| Vol ROC(20) | 57.63 | Bullish |
Interpretation: Indicator-level signals form the base confluence, which is then adjusted using a separate AI-driven technical ranking model. The final technical score summarizes this combined view.
The technical dashboard is a case study in confluence vs model-level caution. On the surface, the 18-signal confluence score is 0.556 (Bullish), supported by a strong skew in the breakdown (Bull 12 / Bear 2 / Neutral 4). Momentum and participation metrics contribute meaningfully: RSI(14) at 62.74, ROC(20) at 10.4, and Vol ROC(20) at 57.63 collectively indicate upside bias with active engagement rather than a low-liquidity drift. MACD histogram at 668.6 also fits that constructive profile.
The divergence appears in the Deep Reinforcement Learning technical rank: #596 out of 800 with a score of -0.490, labeled Neutral. This model-level placement pulls the overall blended technical score down to 0.242 (Neutral), implying the system is discounting the indicator cluster—often a sign that broader pattern libraries, regime features, or cross-sectional comparisons do not fully confirm the same strength.
For decision-making, the key is not choosing one lens over the other, but recognizing what the blend is communicating: the tape is constructive, yet conviction is not universal. In such setups, confirmation tends to be clearest at structural thresholds (resistance 91654.1932) and invalidation at support (64455.9697), especially if momentum measures soften from their current levels.
6) News sentiment + extractive gist
Note: Instrument-specific news matches were not found, so the digest includes broader market/sector headlines. Links are provided for verification.
Sentiment score (avg): 0.037 | Positive: 25% | Neutral: 63% | Negative: 12%
KGNAI AI News Sentiment Score (normalized -1 to +1): Not available (as of —) | Label: Not available | Overall news score: 0.04
Positive Developments
Recent coverage across major financial outlets indicates a modestly constructive backdrop for large-cap crypto, reflected in the sentiment mix (25% positive) and a slightly positive average score of 0.037. The positive thread is less about WBTC-specific catalysts and more about market plumbing and adoption narratives—such as stablecoin growth and ongoing institutional engagement themes. For WBTC-USD, this matters primarily through risk appetite transmission: when broader crypto conditions support liquidity and participation, technical break attempts near the upper boundary (91654.1932) have a higher likelihood of holding, and momentum readings such as RSI(14) 62.74 and MACD histogram 668.6262 tend to remain supported. The current news tone therefore acts as a mild tailwind rather than a decisive driver, reinforcing the “constructive but needs confirmation” framing implied by the blended technical score (0.242, Neutral).
Neutral / Mixed Developments
The dominant share of coverage is neutral (63%), consistent with a market that is processing macro and regulatory narratives without a single unifying impulse. In that environment, price often responds more to technical structure than to headlines, elevating the role of support 64455.9697 and resistance 91654.1932 as decision zones. A neutral news mix can also coincide with choppier rotations, which is consistent with a daily rank (#144) that is bullish but less emphatic than the multi-week ranks (#33 weekly; #23 3-month). With volatility regime not extreme (bandwidth 0.1302), a neutral tape typically favors incremental follow-through over sudden discontinuities—unless macro-sensitive narratives intensify.
Negative / Risk Signals
Negative items (12%) skew toward familiar crypto risk buckets: execution hazards in DeFi workflows, episodic liquidity shocks, and macro uncertainty that can abruptly reprice risk assets. While these are not instrument-specific, they can still influence WBTC-USD through broader positioning and deleveraging channels. The analytical risk is a sentiment–price mismatch where technical momentum remains strong (e.g., MACD histogram 668.6262) even as risk narratives accumulate, increasing the probability of fast pullbacks to structural support at 64455.9697. This is one reason the DRL rank remains relatively weak at #596 (Neutral), despite bullish indicator confluence (0.556). In short, the negative slice is not dominant, but it raises the value of disciplined level-based confirmation.
- Whether price acceptance improves above 91654.1932 alongside volume confirmation.
- Any shift in the sentiment mix away from the current 63% neutral baseline.
- Whether risk events coincide with a loss of momentum from RSI(14) 62.74 and MACD histogram 668.6262.
Sources referenced: Reuters, Bloomberg, Yahoo Finance, MarketWatch, Investing.com
7) Sources
Not available in the provided data.
Snapshot: AI Rank (Short–Mid–Long): Bullish (Bullish–Bullish–Bullish) · Technical Confluence: Bullish · Key Levels: Support ~64455.97 | Resistance ~91654.19 · News Sentiment: Neutral
You may also like: How KGNAI AI ranks instruments across global markets
Disclaimer: KGNAI provides AI-generated analytics and educational market commentary only. This is not financial advice. Markets involve risk. Always do your own research.