
TIME-USD (Chrono.tech) — 24-Apr-2026 Quant Signal Review with Rank/Technical Divergence (Neutral Bias)
TIME-USD (Chrono.tech) enters 24-Apr-2026 with a cross-signal mismatch: KGNAI’s cross-sectional ranks are exceptionally strong on the daily horizon (#1 out of 800) and constructive on the monthly horizon (#82), while intermediate windows remain muted (weekly #430, 3-month #372). At the same time, the technical stack leans defensive: the blended technical score is -0.394 (Bearish) and the DRL technical rank is #718, consistent with weak trend placement versus major moving averages. Momentum is not signaling capitulation (RSI bias is neutral with RSI(14) 40.21), but MACD remains negative (-0.1073) and volatility is not clearly compressing (bandwidth 1.2639). With news sentiment fully neutral (0.000), price behavior around the key decision levels is likely to dominate near-term validation.
- Rank stance: Short-term top of universe (Daily #1/800) vs mid-term lower half (Weekly #430/800) vs long-horizon upper quartile (Monthly #82/800).
- Technical confluence: Bearish overall blend (-0.394), despite an 18-signal confluence labeled Neutral (-0.222).
- Key levels: Support ~ 2.1497 and Resistance ~ 3.2115 frame the primary decision zone.
- News sentiment bias: Neutral (avg 0.000; 100% neutral).
- Confirmation / invalidation: A break above 3.2115 with volume supports continuation; a close below 2.1497 increases deterioration risk per the scenario framework.
What KGNAI Measures
KGNAI evaluates assets using large cross-sectional datasets built from millions of structured data points. Inputs incorporate fundamental metrics, technical structures, and systematically processed news sentiment. Statistical models, machine learning, and AI frameworks are used to assess relative positioning, signal alignment, and probabilistic behavior across broad universes.
How to Read This Report
- Ranks are comparative across the tracked universe, not absolute price targets.
- Confluence reflects alignment among independent signal groups.
- Support/resistance levels are probabilistic decision zones, not guarantees.
- Sentiment provides contextual bias within the broader analytical framework.
1) KGNAI AI Analysis
Region: CRYPTO
Total universe size: 800 ranked instruments
- Daily rank: #1 out of 800 — Bullish
- Weekly rank: #430 out of 800 — Neutral
- Monthly rank: #82 out of 800 — Bullish
- 3-Monthly rank: #372 out of 800 — Neutral
TIME-USD’s ranking profile is best described as short-horizon strength with incomplete time-frame confirmation. The daily placement at #1 indicates the strongest cross-sectional behavior in the tracked crypto universe on that horizon, but it sits alongside a much softer weekly #430 and 3-month #372. That spread suggests either (a) an early-stage rotation that has not propagated through intermediate windows, or (b) a transient impulse that has not yet produced persistent trend evidence.
The monthly rank at #82 places the asset in the upper quartile of the universe, which matters because it indicates the longer-horizon statistical profile remains constructive relative to peers even while near-term trend structure is still contested. This multi-horizon split is consistent with a market where short-term relative strength appears before medium-term technical repair.
The provided term view remains Neutral across short-, mid-, and long-term, which fits the idea that ranks alone are not treated as a standalone regime call. Practically, this is a “prove it” setup: the daily signal is strong, but intermediate confirmation should be monitored through the price structure around 2.1497 and 3.2115, and through whether momentum (e.g., MACD hist -0.1073) can transition away from negative territory.
Want the full universe and complete rank tables? Unlock full access on KGNAI: https://www.kgnai.com/pricing
2) Price & trend overview
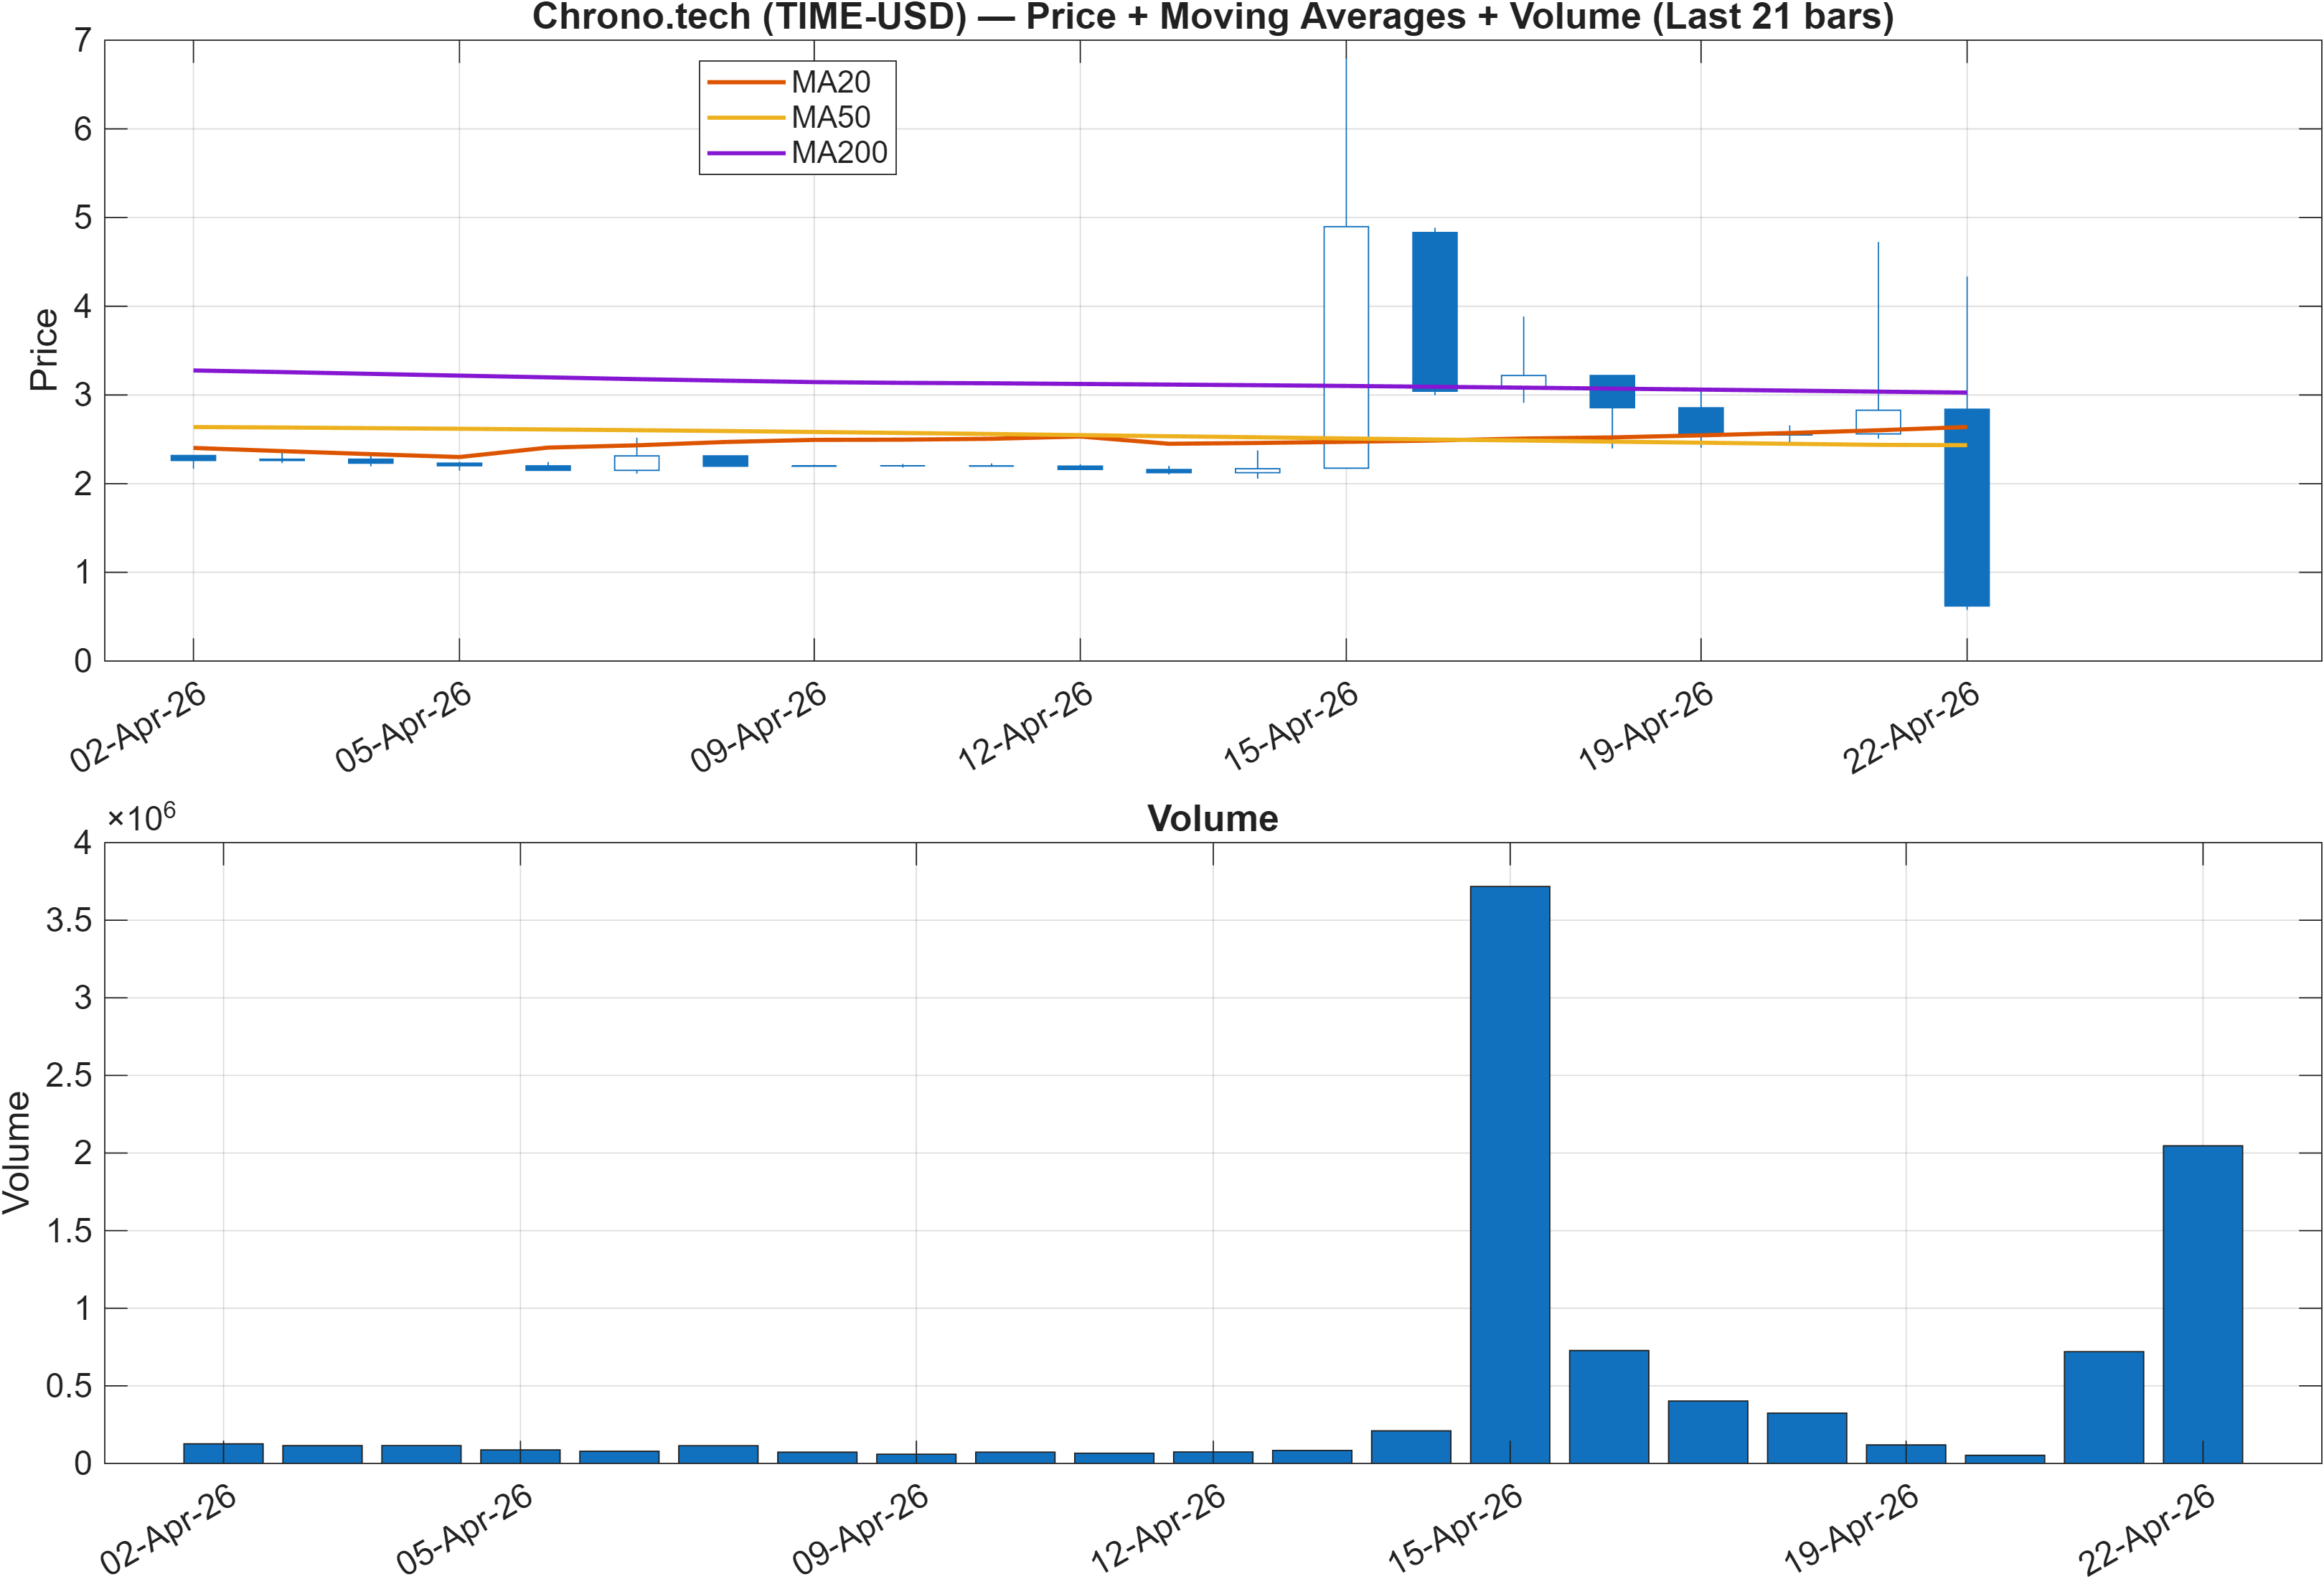
Trend positioning is currently characterized by bearish moving-average alignment, with the close below the MA50 and the MA50 below the MA200. In market-structure terms, that combination typically reflects a regime where rallies can face overhead supply until the shorter average stabilizes and begins to turn. This matters given the rank divergence: even with a daily #1 rank, the trend template suggests the market still requires evidence that strength is translating into sustained direction.
The most actionable takeaway is that the chart is in a repair phase rather than a clean trend continuation phase. That aligns with the blended technical score being -0.394 (Bearish) despite the 18-signal confluence printing -0.222 (Neutral)—a common pattern when a subset of indicators improves before trend metrics confirm. Put differently, the internal condition can start to firm up while the “headline” trend remains negative.
From a level-based framing, the market is effectively bracketed by support ~2.1497 and resistance ~3.2115. When price is below key moving averages, these zones often act as the primary decision points that separate mean-reversion rallies from genuine regime transitions. Any attempt to reclaim the upper boundary is more credible when it coincides with improving momentum signals (e.g., MACD histogram moving up from -0.1073) and when volatility behavior avoids abrupt expansion against the move.
Overall, the trend layer argues for discipline: the setup is not purely bearish, but it is not yet structurally “cleared” in a way that would remove the burden of proof.
3) Momentum & volatility dashboard
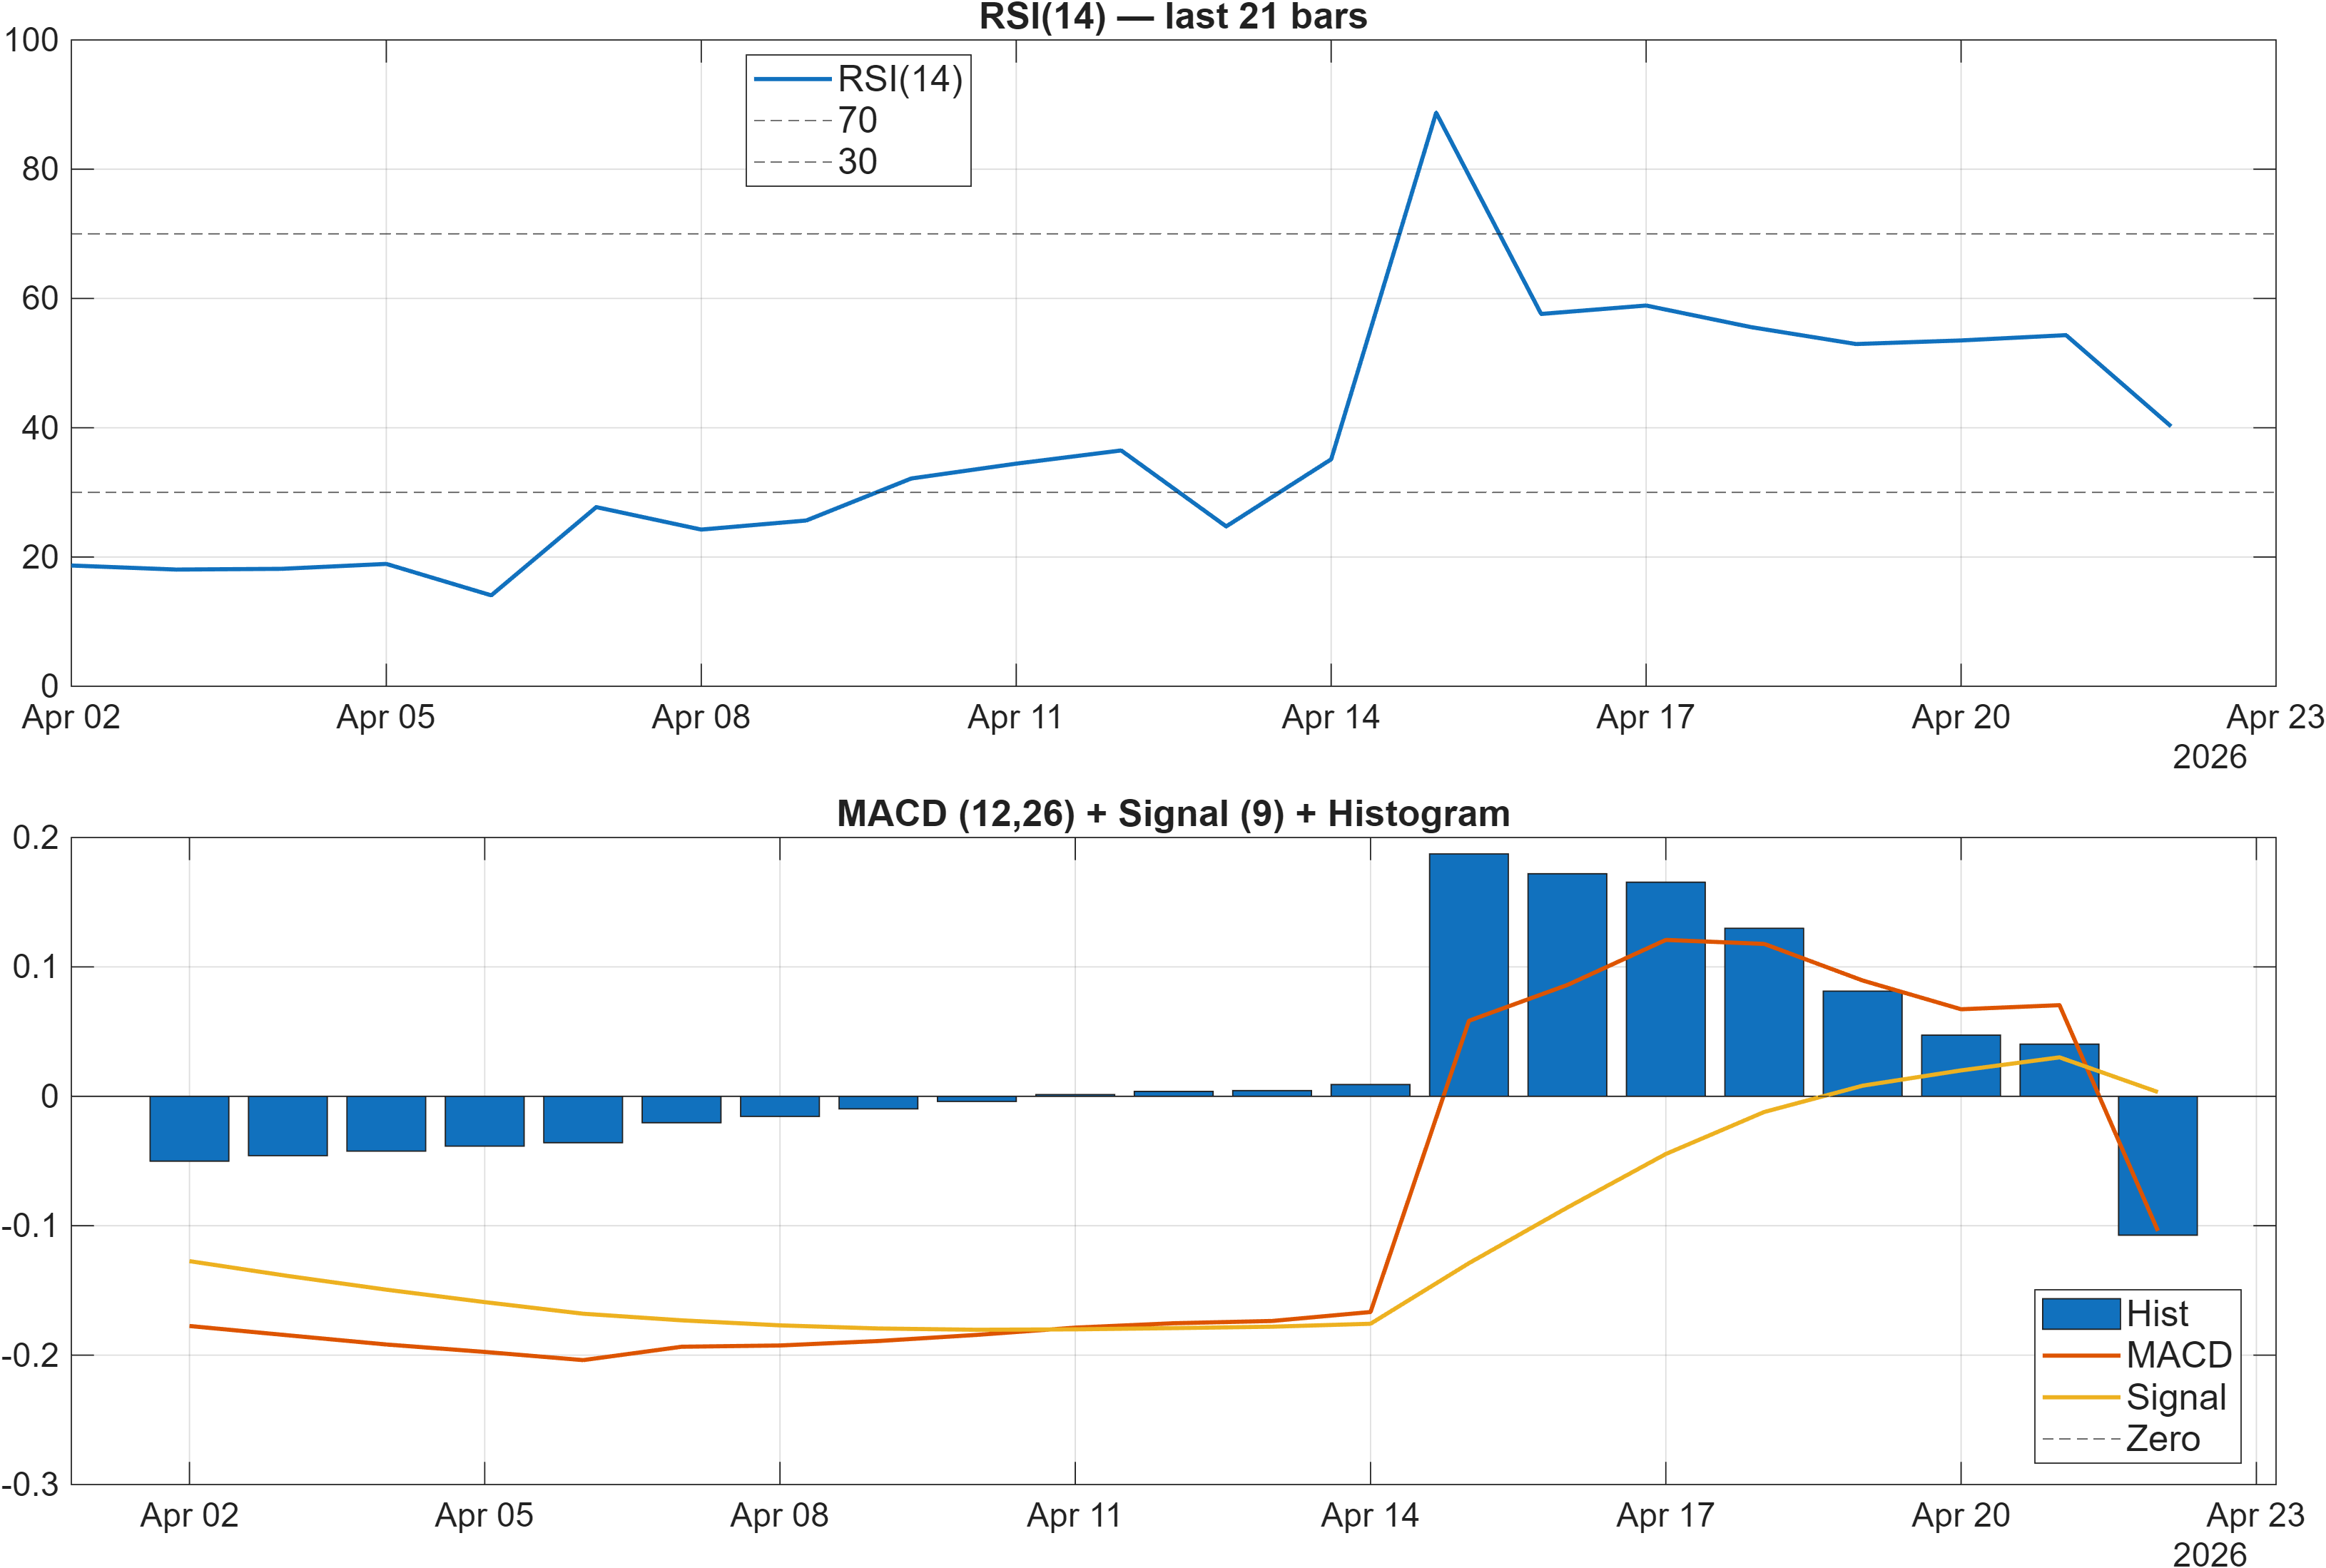
Momentum signals are mixed rather than directionally decisive. The RSI bias is labeled neutral, but the underlying reading of RSI(14) 40.21 sits below the midline and therefore aligns more with a defensive posture than with a strong upside impulse. Meanwhile, the MACD histogram at -0.1073 remains negative, implying bearish momentum persistence even if the rate of decline may be changing.
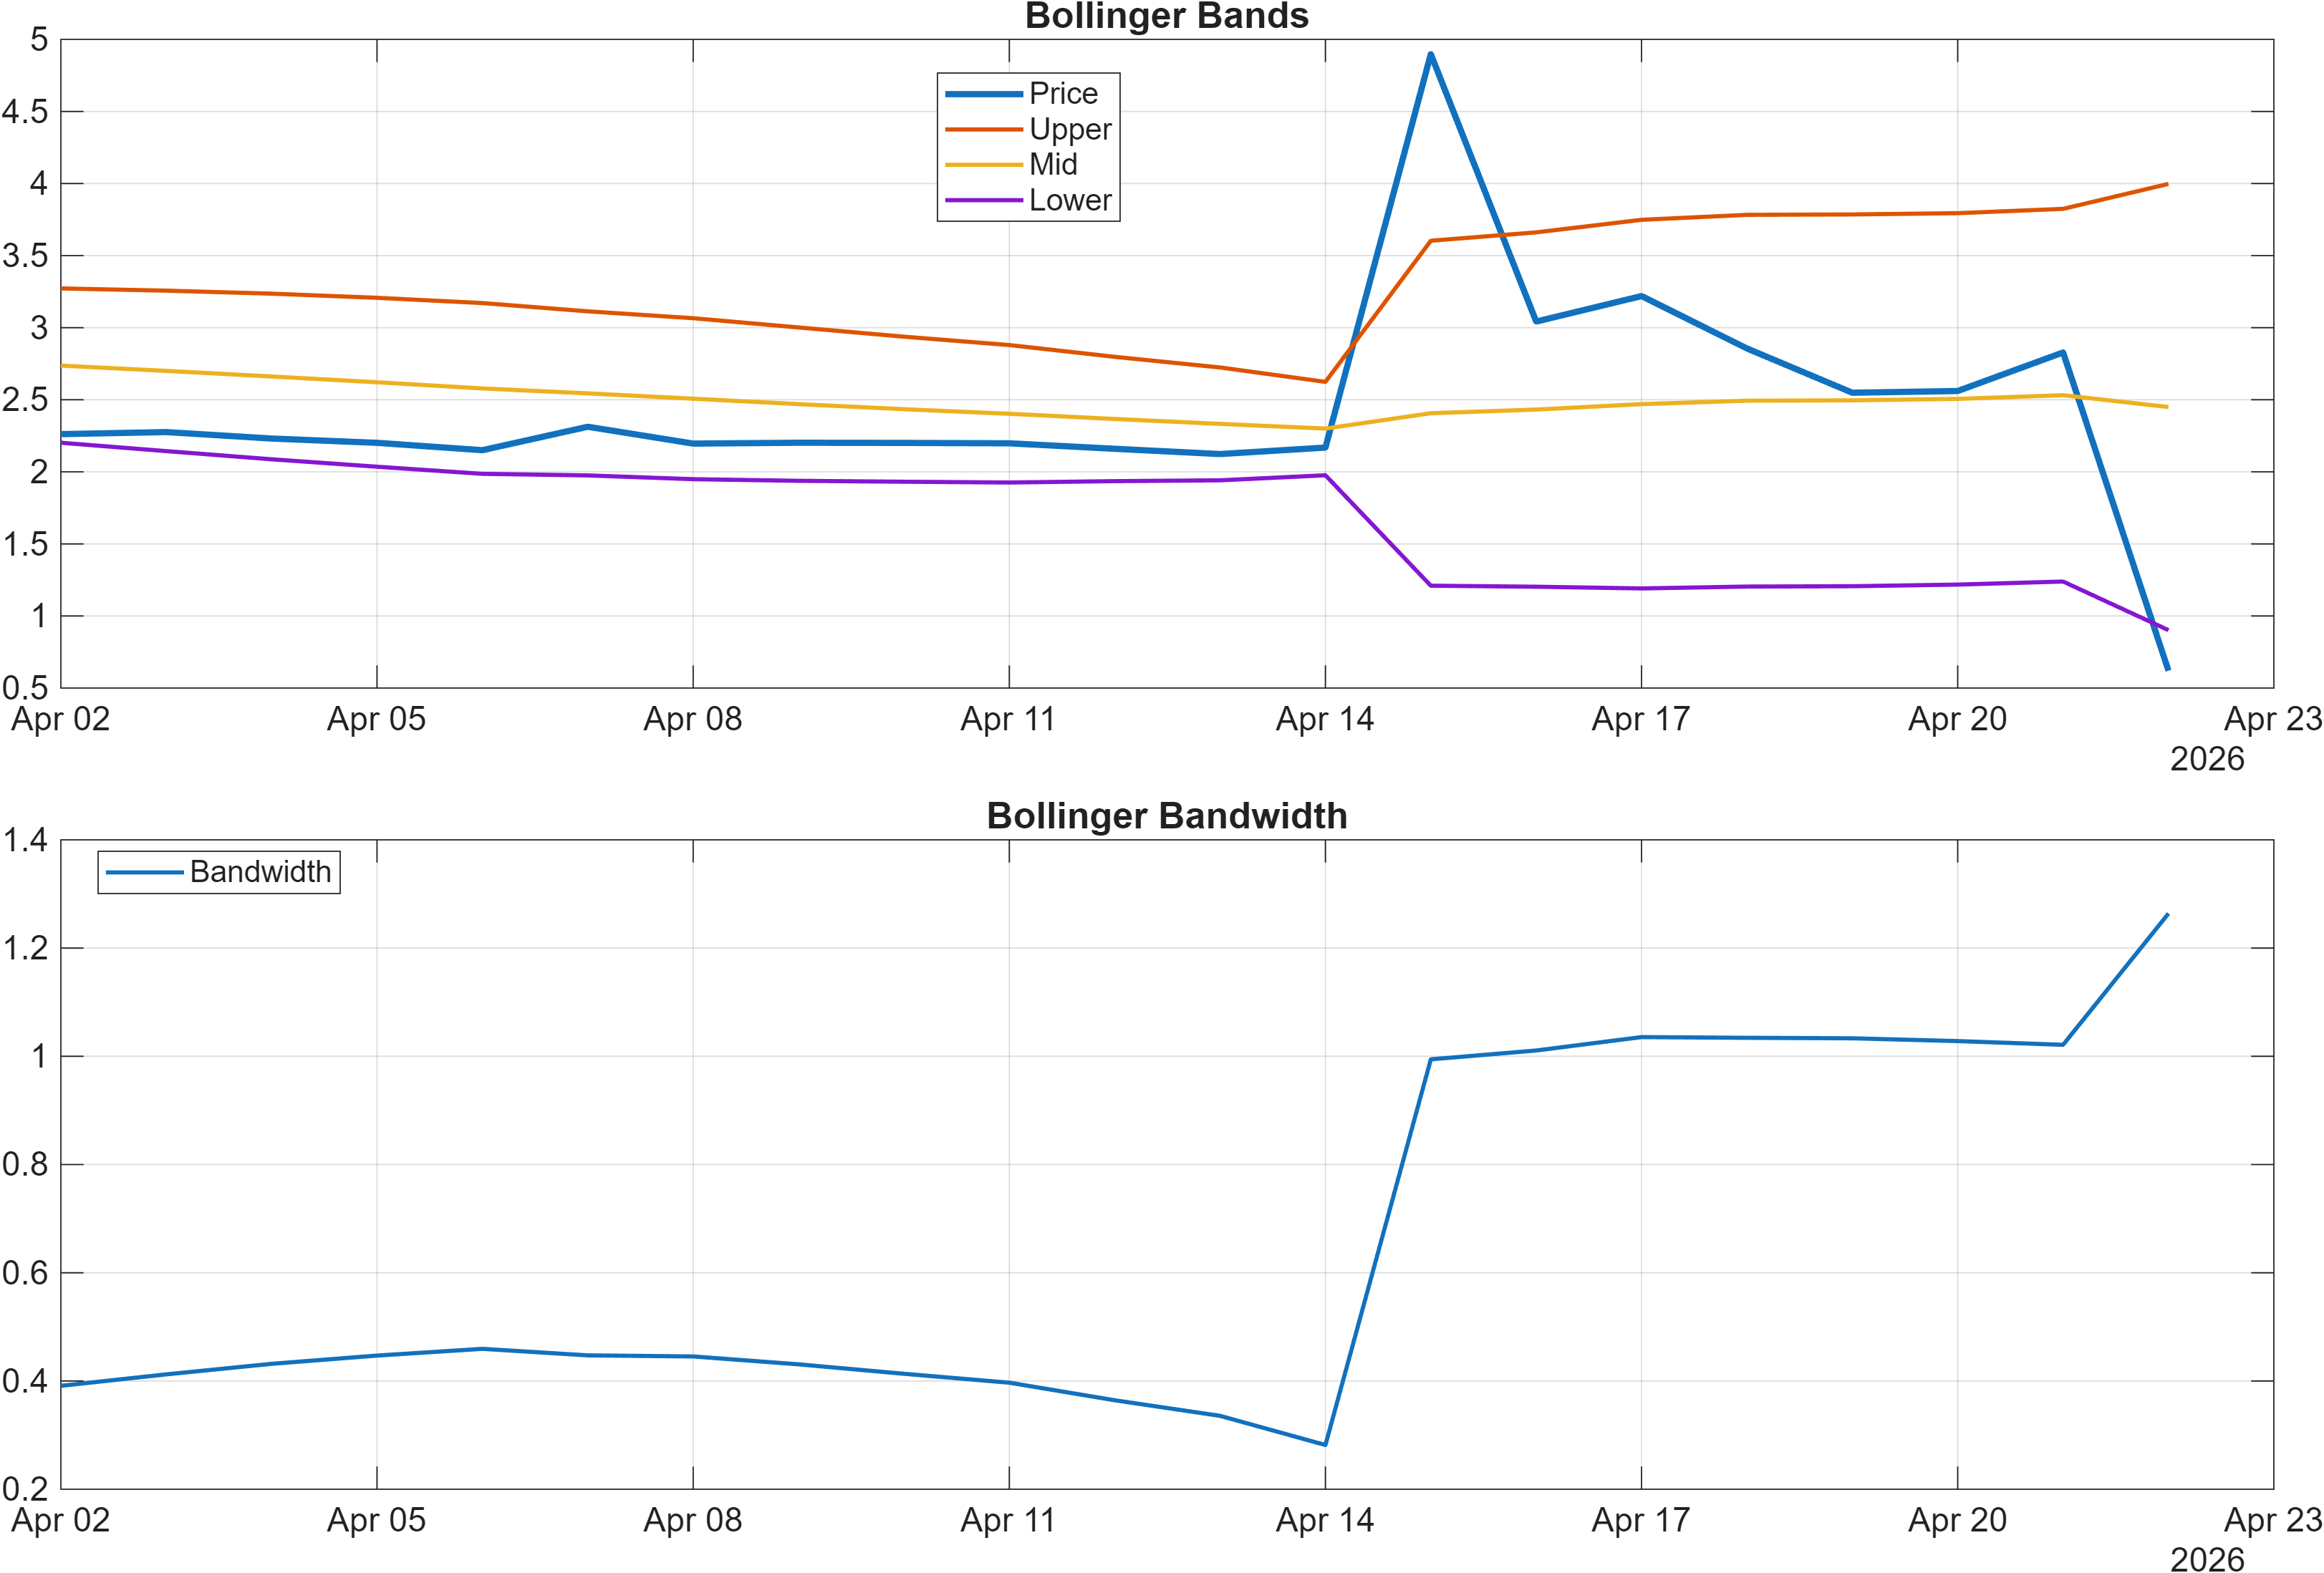
Volatility context adds nuance. The latest Bollinger bandwidth is 1.2639, and the BB Width signal in the 18-indicator table is 1.264 and marked neutral—consistent with a regime that is not clearly in tight compression nor in a breakout expansion. When volatility is neutral, levels tend to matter more: moves often require follow-through evidence rather than relying on an obvious squeeze dynamic.
Internally, some fast oscillators can improve before trend does (e.g., Stoch %K is 0.71 and bullish), but broader momentum measures are still heavy (TS Mom(20) -1.655 and ROC(20) -72.73 are bearish). This combination tends to appear in counter-trend rebound attempts: short-term mean reversion can occur without confirming a durable shift in intermediate momentum.
The practical read is a market that may be stabilizing at the margin, but where negative MACD and sub-50 RSI argue that any improvement still needs validation through price reclaiming key zones—especially 3.2115.
4) Support / Resistance zones
Support ~ 2.1497 | Resistance ~ 3.2115
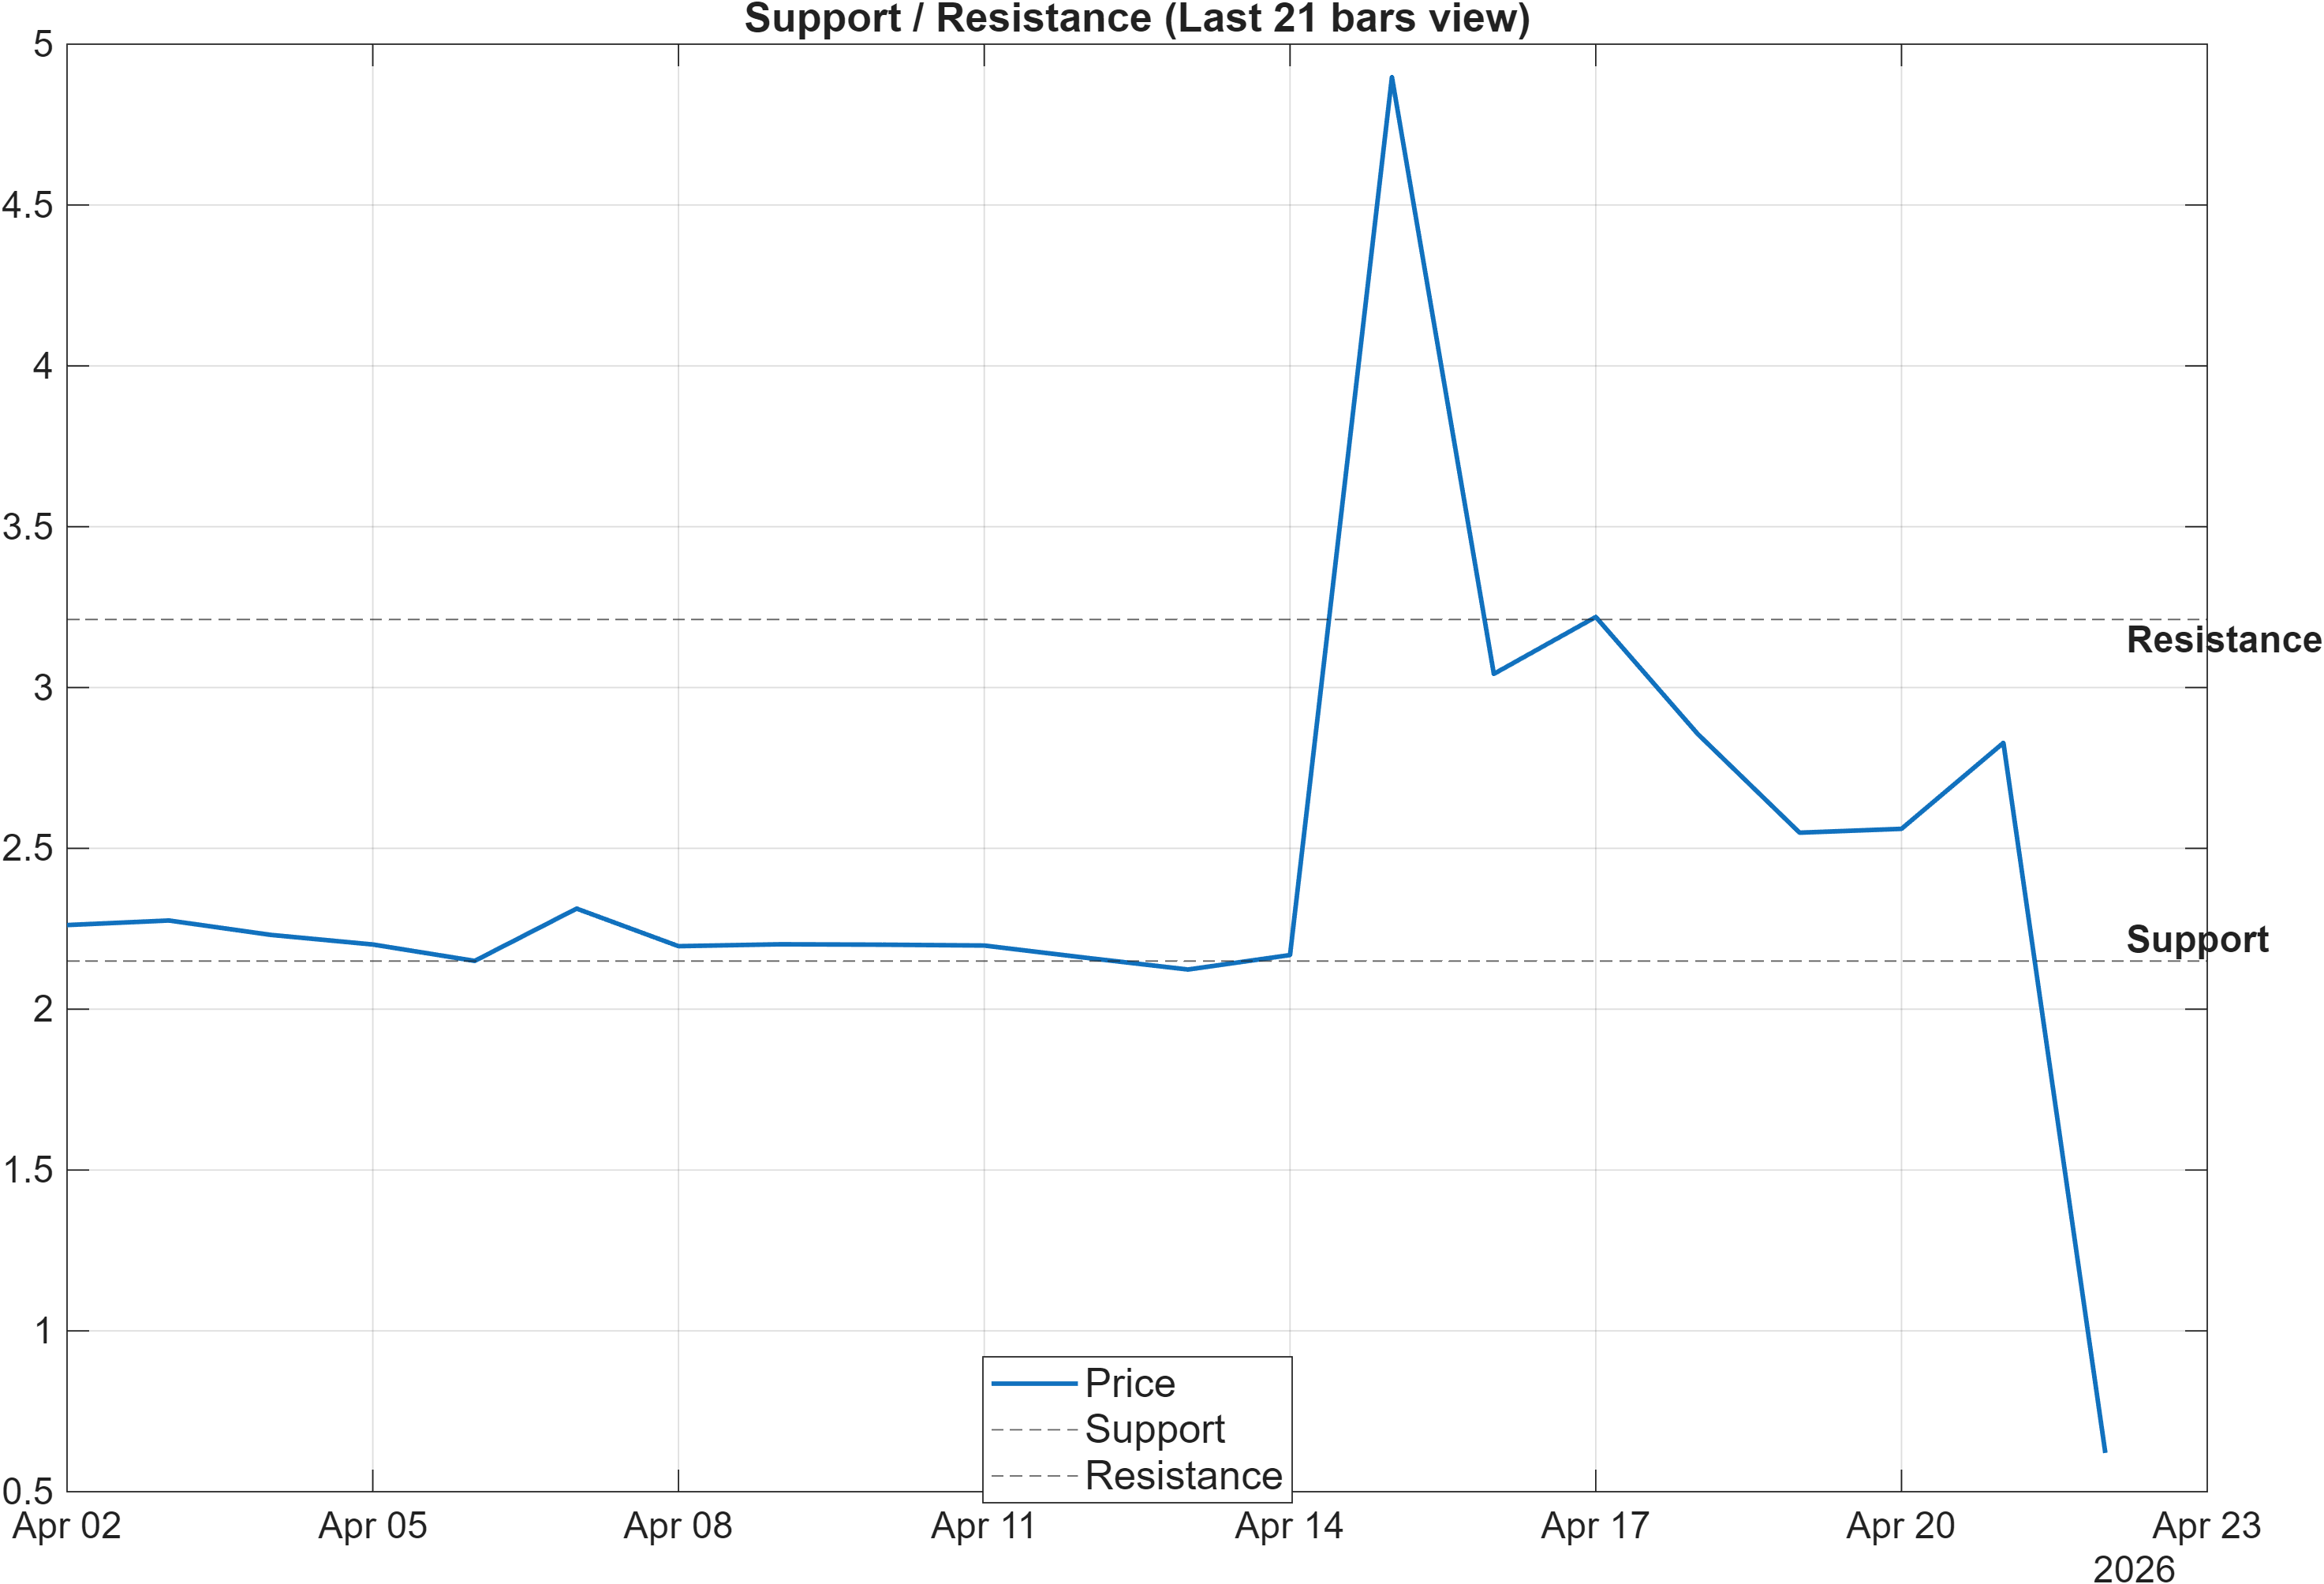
The level map is relatively clean: 2.1497 defines the primary downside reference and 3.2115 defines the primary upside reference. With the moving-average structure bearish and the blended technical score at -0.394, these zones function as probabilistic decision points rather than simple price markers.
The scenario framing is explicit: a break above resistance with volume supports continuation, while a close below support increases deterioration risk. In practice, these are the two outcomes that would help resolve the present contradiction between a standout daily rank (#1) and weak trend alignment (close below MA50; MA50 below MA200).
When momentum is mixed—neutral RSI bias but negative MACD histogram (-0.1073)—breakouts above resistance tend to be more reliable if they coincide with evidence that bearish momentum is unwinding (MACD histogram rising toward zero) and if volatility does not spike in a way that reverses quickly. Conversely, weakness through 2.1497 would fit with the more bearish elements in the dashboard (e.g., ROC(20) -72.73, TS Accel -0.9243) and would likely reinforce the DRL technical model’s cautionary positioning (#718).
Net: treat the 2.1497–3.2115 band as the operating range for signal confirmation. Until one side is decisively resolved, the evidence set supports a measured, regime-aware interpretation rather than a single-direction thesis.
5) Quant Technical Dashboard (18 Signals)
KGNAI AI Technical Analysis Score (Deep Reinforcement Learning): Rank #718 out of 800 (Rank 1 represents the strongest technical positioning and a higher probability of favorable price behavior. As ranks increase toward the maximum, the probability of favorable outcomes weakens and bearish positioning becomes more dominant.) | Label: Bearish | Score: -0.795
18-Signal Technical Confluence Score: -0.222 (Neutral)
Overall Technical Score (18-signal confluence + DRL rank blend): -0.394 (Bearish)
Note: The blended score reflects signal strength weighted against broader AI technical ranking, which may temporarily diverge.
Blended technical score breakdown: -0.394 (Bearish | Bull 6 / Bear 10 / Neutral 2)
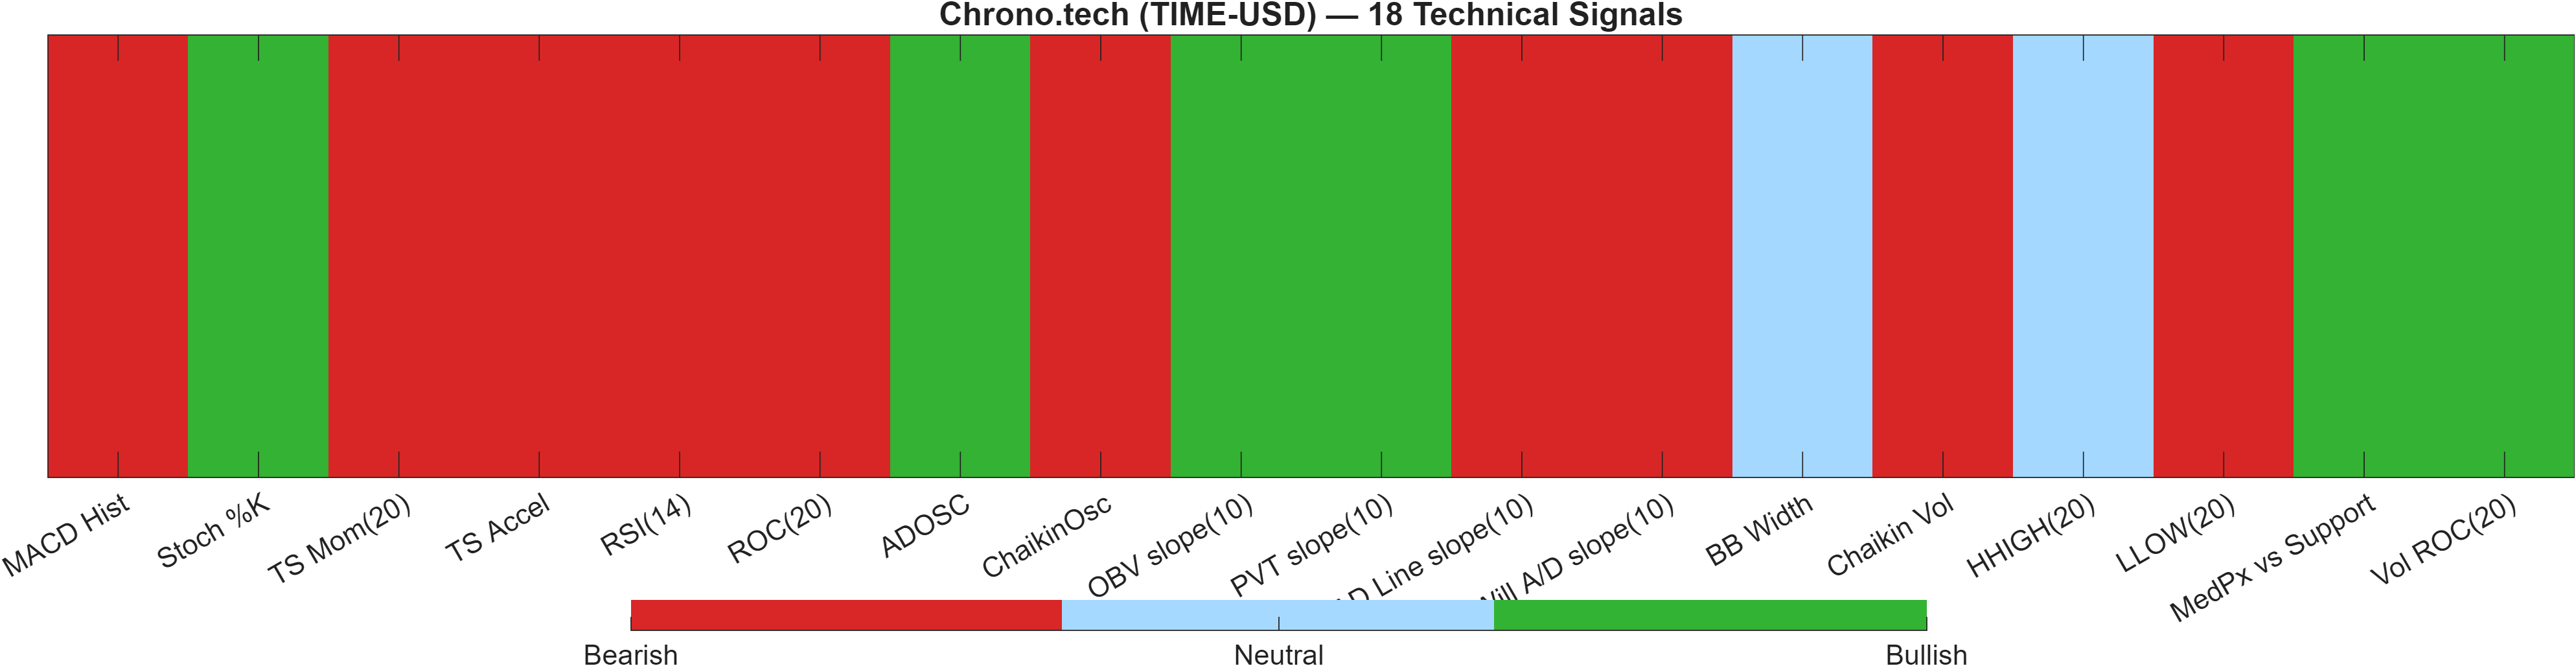
The technical dashboard highlights a compression of “headline” neutrality into a bearish blended conclusion. On the surface, the 18-signal confluence score is -0.222 (neutral), but the Deep Reinforcement Learning layer is far weaker (rank #718/800, score -0.795), pulling the combined view to -0.394 (Bearish). This is a key analytical nuance: the system is detecting that while some indicators are improving, the broader technical “state” still resembles weaker peer positioning.
Signal table (Bull/Bear/Neutral)
| Indicator | Value | Signal |
|---|---|---|
| MACD Hist | -0.1073 | Bearish |
| Stoch %K | 0.71 | Bullish |
| TS Mom(20) | -1.655 | Bearish |
| TS Accel | -0.9243 | Bearish |
| RSI(14) | 40.21 | Bearish |
| ROC(20) | -72.73 | Bearish |
| ADOSC | 20.49 | Bullish |
| ChaikinOsc | -9.761e+05 | Bearish |
| OBV slope(10) | 1.801e+06 | Bullish |
| PVT slope(10) | 2.859e+06 | Bullish |
| AD Line slope(10) | -2.821e+06 | Bearish |
| Will A/D slope(10) | -2.946 | Bearish |
| BB Width | 1.264 | Neutral |
| Chaikin Vol | 1304 | Bearish |
| HHIGH(20) | 6.793 | Neutral |
| LLOW(20) | 0.5764 | Bearish |
| MedPx vs Support | 0.3063 | Bullish |
| Vol ROC(20) | 1682 | Bullish |
The indicator mix shows why the confluence is not outright bearish: there are meaningful bullish pockets in volume/flow and oscillator behavior (e.g., ADOSC 20.49 bullish; OBV slope(10) 1.801e+06 bullish; Vol ROC(20) 1682 bullish). However, the core momentum/trend cluster remains negative (RSI(14) 40.21 bearish; ROC(20) -72.73 bearish; MACD hist -0.1073 bearish). When that split persists, the market often behaves as fragile-to-resistance until price can reclaim and hold above the key ceiling at 3.2115.
Interpretation: Indicator-level signals form the base confluence, which is then adjusted using a separate AI-driven technical ranking model. The final technical score summarizes this combined view.
6) News sentiment + extractive gist
Sentiment score (avg): 0.000 | Positive: 0% | Neutral: 100% | Negative: 0%
KGNAI AI News Sentiment Score (normalized -1 to +1): Not available (as of —) | Label: Not available | Overall news score: 0.00
Positive Developments
Recent coverage across major financial outlets leans process-improvement rather than price-catalyst, which fits the measured sentiment print (avg 0.000, with 100% neutral classification). The constructive angle is largely about ecosystem maturity and operational safeguards: commentary around DeFi risk controls and platform-level reliability improvements tends to reduce tail-risk perceptions at the margin, even if it does not translate into immediate directional demand for TIME-USD. Broader industry updates and leadership transitions are also framed as part of a normal maturation cycle—more reflective of risk management and organizational evolution than a direct negative shock. In a tape where technicals remain net bearish (overall technical score -0.394), “quietly constructive” coverage is most relevant as a backdrop: it can support stability near 2.1497 if price is otherwise attempting to base.
Neutral / Mixed Developments
The newsflow is dominated by sector-level narratives rather than asset-specific drivers, and the dataset’s own sentiment breakdown reinforces that neutrality (Positive 0%, Neutral 100%, Negative 0%). In this context, the practical impact is typically indirect: market participants may map general crypto risk appetite onto smaller instruments, but without a clear TIME-USD-specific catalyst, technical levels carry more weight. This matches the current analytical setup where ranks diverge by horizon (daily #1 vs weekly #430) and where momentum remains mixed (RSI bias neutral; MACD histogram -0.1073). The net effect is a “wait for confirmation” environment, with attention centered on whether price behavior can resolve the 2.1497–3.2115 bracket.
Negative / Risk Signals
Although the quantified news sentiment is not negative (avg 0.000; Negative 0%), coverage themes still include risk reminders common to the crypto complex—particularly around exploits, operational resilience, and periods of market-wide risk-off behavior. For TIME-USD, the main implication is not a discrete headline risk but the possibility that macro crypto volatility can dominate idiosyncratic signals. That matters because the technical state is already cautious: the DRL technical rank is #718 and the overall technical score is -0.394, suggesting the market is not priced as structurally strong. In such conditions, risk narratives can amplify reactions around key levels—especially if price threatens 2.1497 or fails repeatedly near 3.2115 without momentum repair.
- Whether price can reclaim 3.2115 with confirming participation (volume) as the scenario framework specifies.
- Whether negative momentum readings (e.g., MACD hist -0.1073) continue improving toward zero alongside RSI stabilization.
- Whether any shift away from 100% neutral sentiment coincides with a break of 2.1497 or a hold above resistance.
Snapshot: AI Rank (Short–Mid–Long): Neutral (Neutral–Neutral–Neutral) · Technical Confluence: Neutral · Key Levels: Support ~2.15 | Resistance ~3.21 · News Sentiment: Neutral
7) Sources
- Not available in the provided data.
You may also like: How KGNAI AI ranks instruments across global markets
Disclaimer: KGNAI provides AI-generated analytics and educational market commentary only. This is not financial advice. Markets involve risk. Always do your own research.