
FARM-USD (Harvest Finance) — 01-May-2026 Neutral stance amid bearish trend structure and mixed momentum
As of 01-May-2026, FARM-USD (Harvest Finance) sits in a statistically neutral zone across KGNAI’s short-, mid-, and longer-horizon ranking framework, even as classical trend signals lean bearish. The daily rank (#244/800) and monthly rank (#213/800) are positioned in the upper third of the tracked crypto universe, while the weekly rank (#421/800) drifts into the lower half—an internal dispersion that typically corresponds to a market searching for direction rather than trending cleanly. On the chart, price relative to the MA50 is bearish and the MA50 vs MA200 relationship is also bearish, reinforcing a downside-tilted regime. Momentum is less decisive: RSI reads 40.12 and is labeled bearish in the signal set, while the broader RSI bias is described as neutral and MACD histogram remains negative (-0.0313). Volatility is moderate (bandwidth 0.1000), keeping focus on decision zones near support at 11.1620 and resistance at 13.9879.
- Rank stance (Short / Mid / Long): Neutral / Neutral / Neutral (daily #244, weekly #421, monthly #213 out of 800)
- Technical confluence: Neutral (18-signal confluence -0.278; overall technical score -0.188; DRL technical rank #391/800)
- Key levels: Support ~ 11.1620 | Resistance ~ 13.9879
- News sentiment bias: Neutral (sentiment score avg 0.000; 100% neutral)
- Confirmation / invalidation condition: A close below 11.1620 increases deterioration risk; sustained strength above 13.9879 with volume would improve continuation odds.
KGNAI evaluates assets using large cross-sectional datasets built from millions of structured data points. Inputs incorporate fundamental metrics, technical structures, and systematically processed news sentiment. Statistical models, machine learning, and AI frameworks are used to assess relative positioning, signal alignment, and probabilistic behavior across broad universes.
- Ranks are comparative across the tracked universe, not absolute price targets.
- Confluence reflects alignment among independent signal groups.
- Support/resistance levels are probabilistic decision zones, not guarantees.
- Sentiment provides contextual bias within the broader analytical framework.
1) KGNAI AI Analysis
Region: CRYPTO
Total universe size: 800 ranked instruments
- Daily rank: #244 out of 800 — Neutral
- Weekly rank: #421 out of 800 — Neutral
- Monthly rank: #213 out of 800 — Neutral
- 3-Monthly rank: #282 out of 800 — Neutral
The rank stack is consistently labeled Neutral, but the dispersion across horizons is analytically meaningful. The monthly rank of #213 places FARM-USD in the upper third of the 800-instrument universe, while the weekly rank of #421 is closer to the mid-to-lower portion. When shorter and longer horizons cluster near the upper third (daily #244, 3-month #282) but the weekly lags, the profile often reflects an intermediate consolidation: the market is not sufficiently weak to collapse in the cross-sectional model, yet not strong enough to produce consistent intermediate-term leadership.
This “middle-ground” posture aligns with the term view—short-, mid-, and long-term all marked Neutral—and suggests the model is not detecting a persistent edge in either direction relative to peers. For portfolio construction, this is typically a signal to size exposure around risk constraints rather than conviction. In practice, the ranking distribution argues for treating the weekly horizon (#421) as the current soft spot that needs improvement before any more constructive regime characterization is warranted.
The key inference is stability without leadership: FARM-USD is not screening as an extreme underperformer, but it is also not earning persistent, multi-horizon confirmation that would place it in the top-decile cohort. Monitoring whether the weekly rank migrates toward the monthly/daily cluster (or away from it) is often more informative than focusing on a single day’s position.
Term view: Short-term: Neutral. Mid-term: Neutral. Long-term: Neutral.
2) Price & trend overview
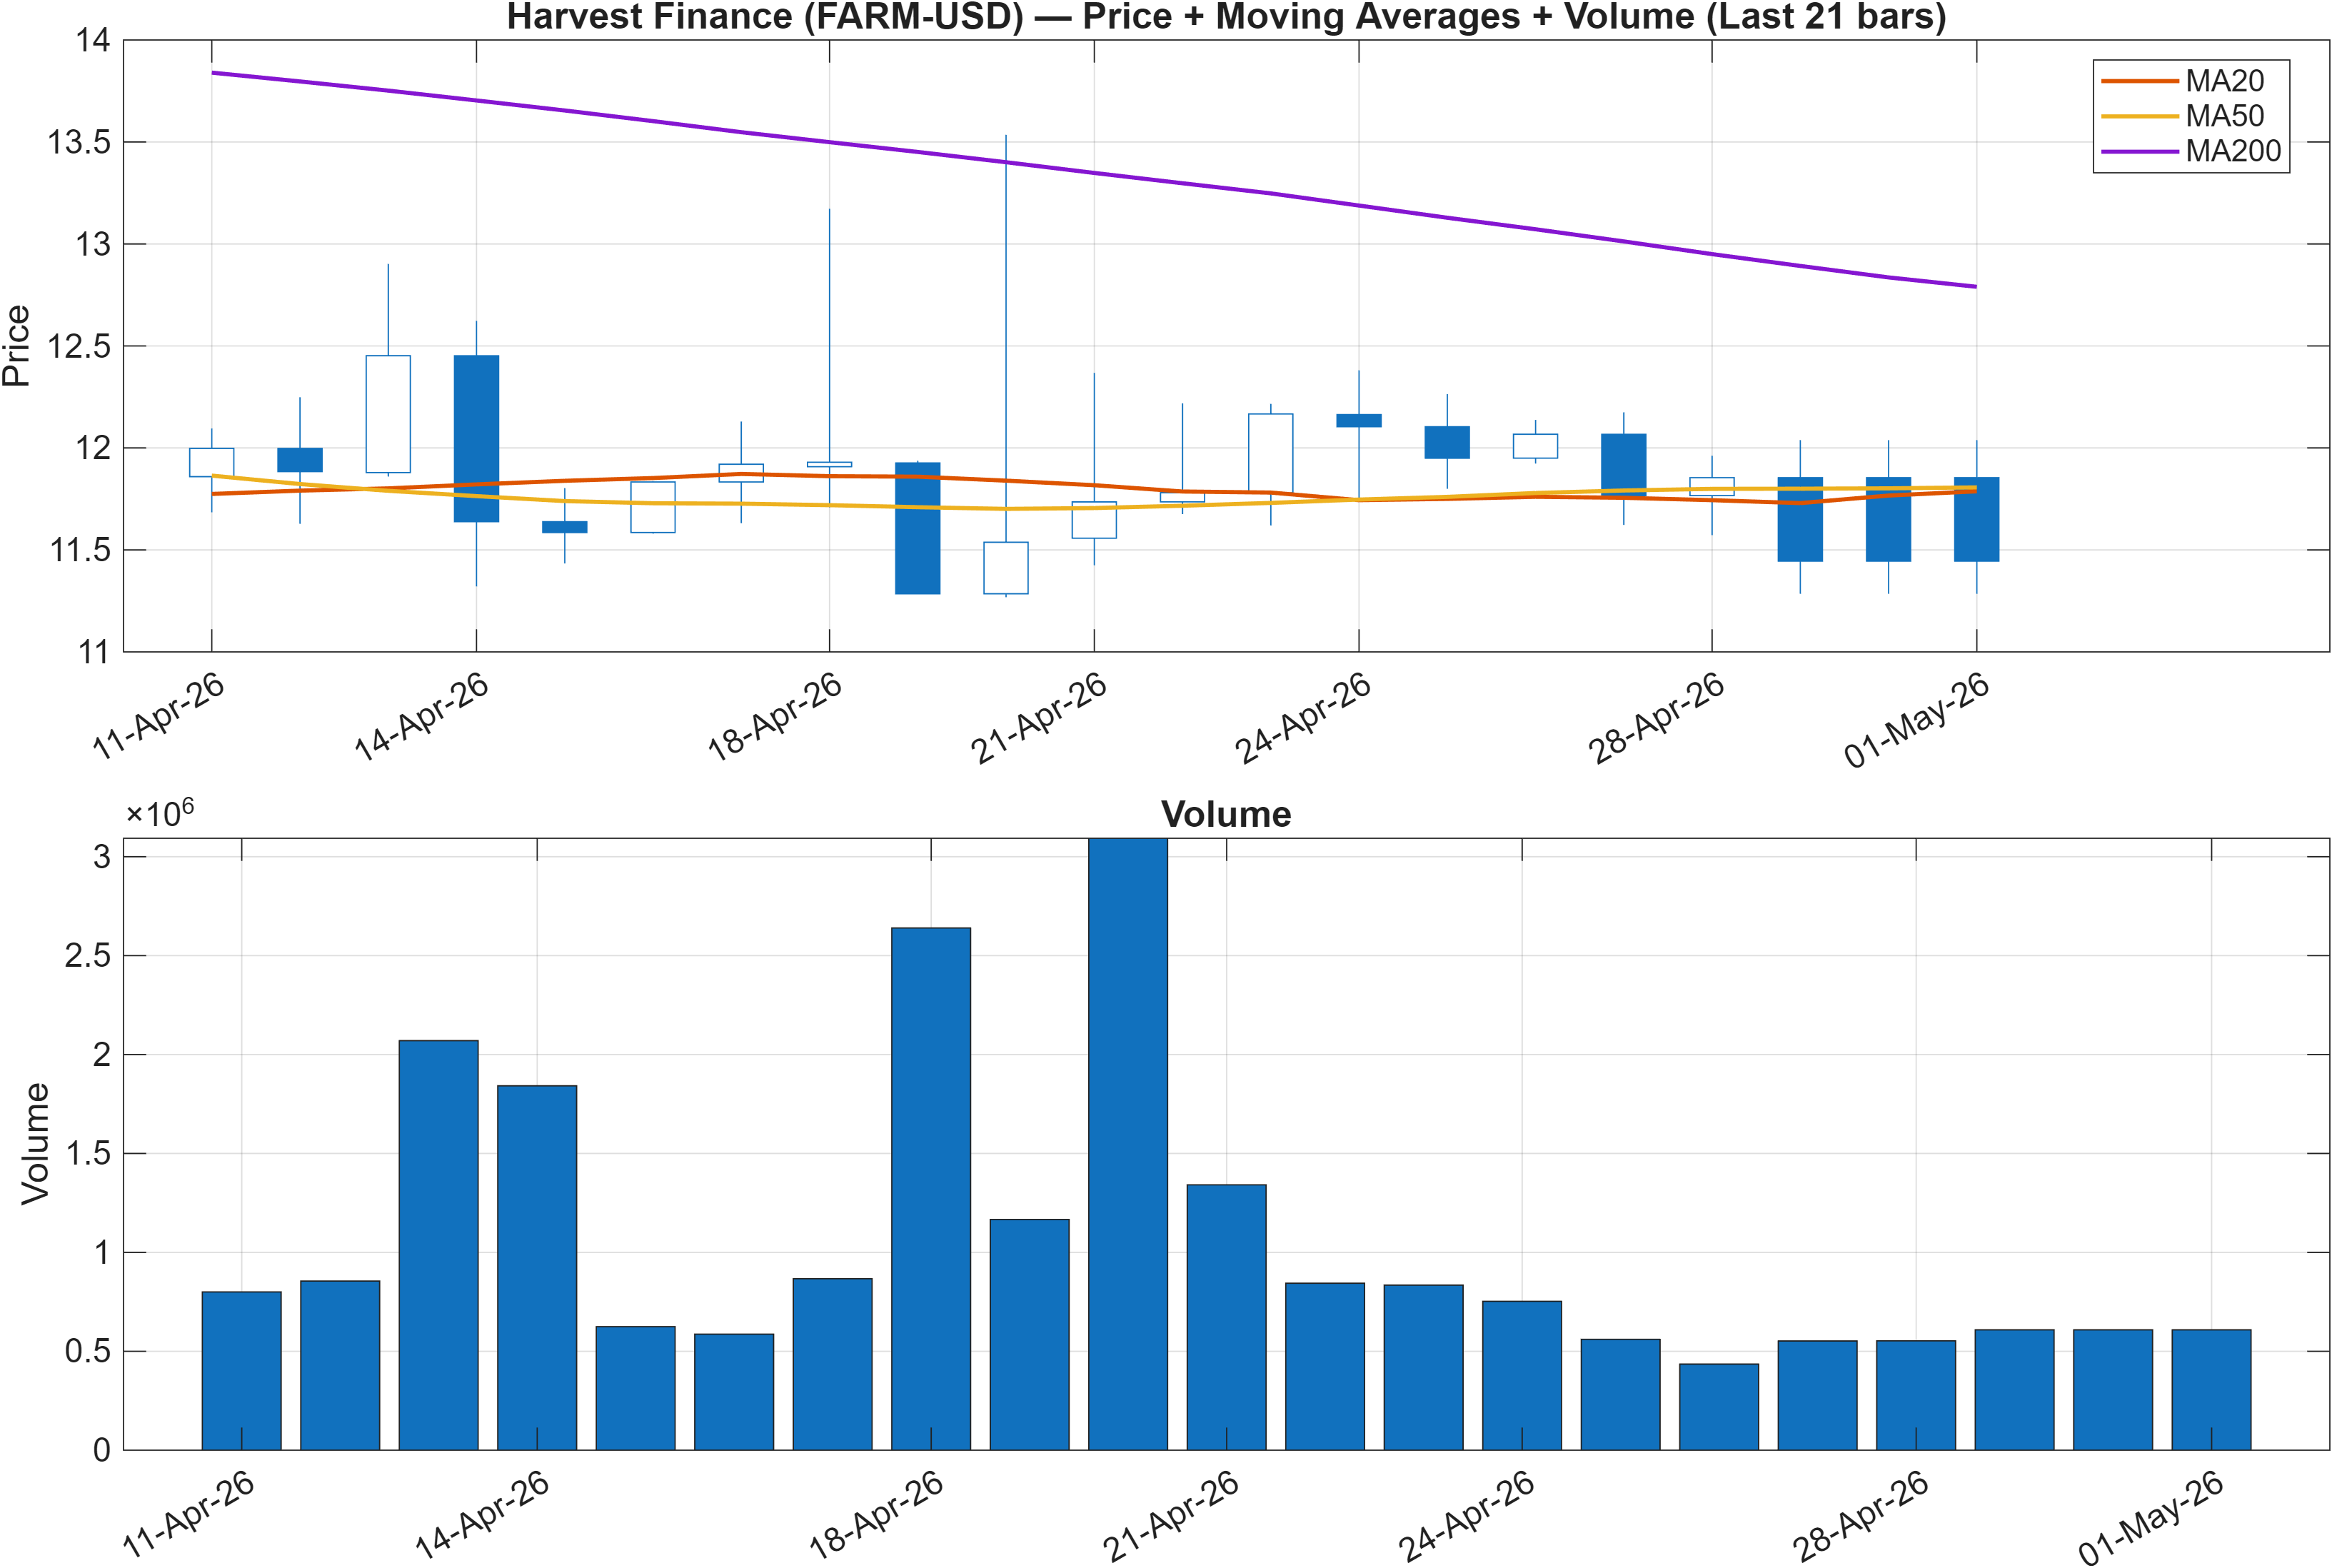
Interpretation: Close vs MA50 = Bearish, MA50 vs MA200 = Bearish.
Trend structure is the clearest directional input in this report: the close sits below the MA50 and the MA50 is below the MA200, a combination that typically characterizes a downtrend regime rather than a transient pullback. This matters because, in bearish moving-average stacks, bullish momentum signals often need to be stronger and more persistent to translate into durable upside rather than short-covering or mean-reversion bounces.
The broader KGNAI ranks remain neutral (daily #244, monthly #213), which introduces a useful tension: cross-sectional positioning is not deeply weak, but the trend filter is still negative. In market structure terms, that combination frequently appears when an asset has stopped deteriorating relative to peers but has not yet rebuilt enough trend support to be treated as directionally constructive.
With the key levels in view (support 11.1620, resistance 13.9879), the moving-average configuration suggests prioritizing reaction quality at these zones. A bullish case typically requires evidence that rallies can sustain above trend proxies; a bearish case is reinforced if price continues to fail beneath the MA50 while testing or breaking the support band. Until that shifts, the default read is a bearish trend context with neutral cross-sectional standing—often a setup for range-bound trading with downside sensitivity.
3) Momentum & volatility dashboard
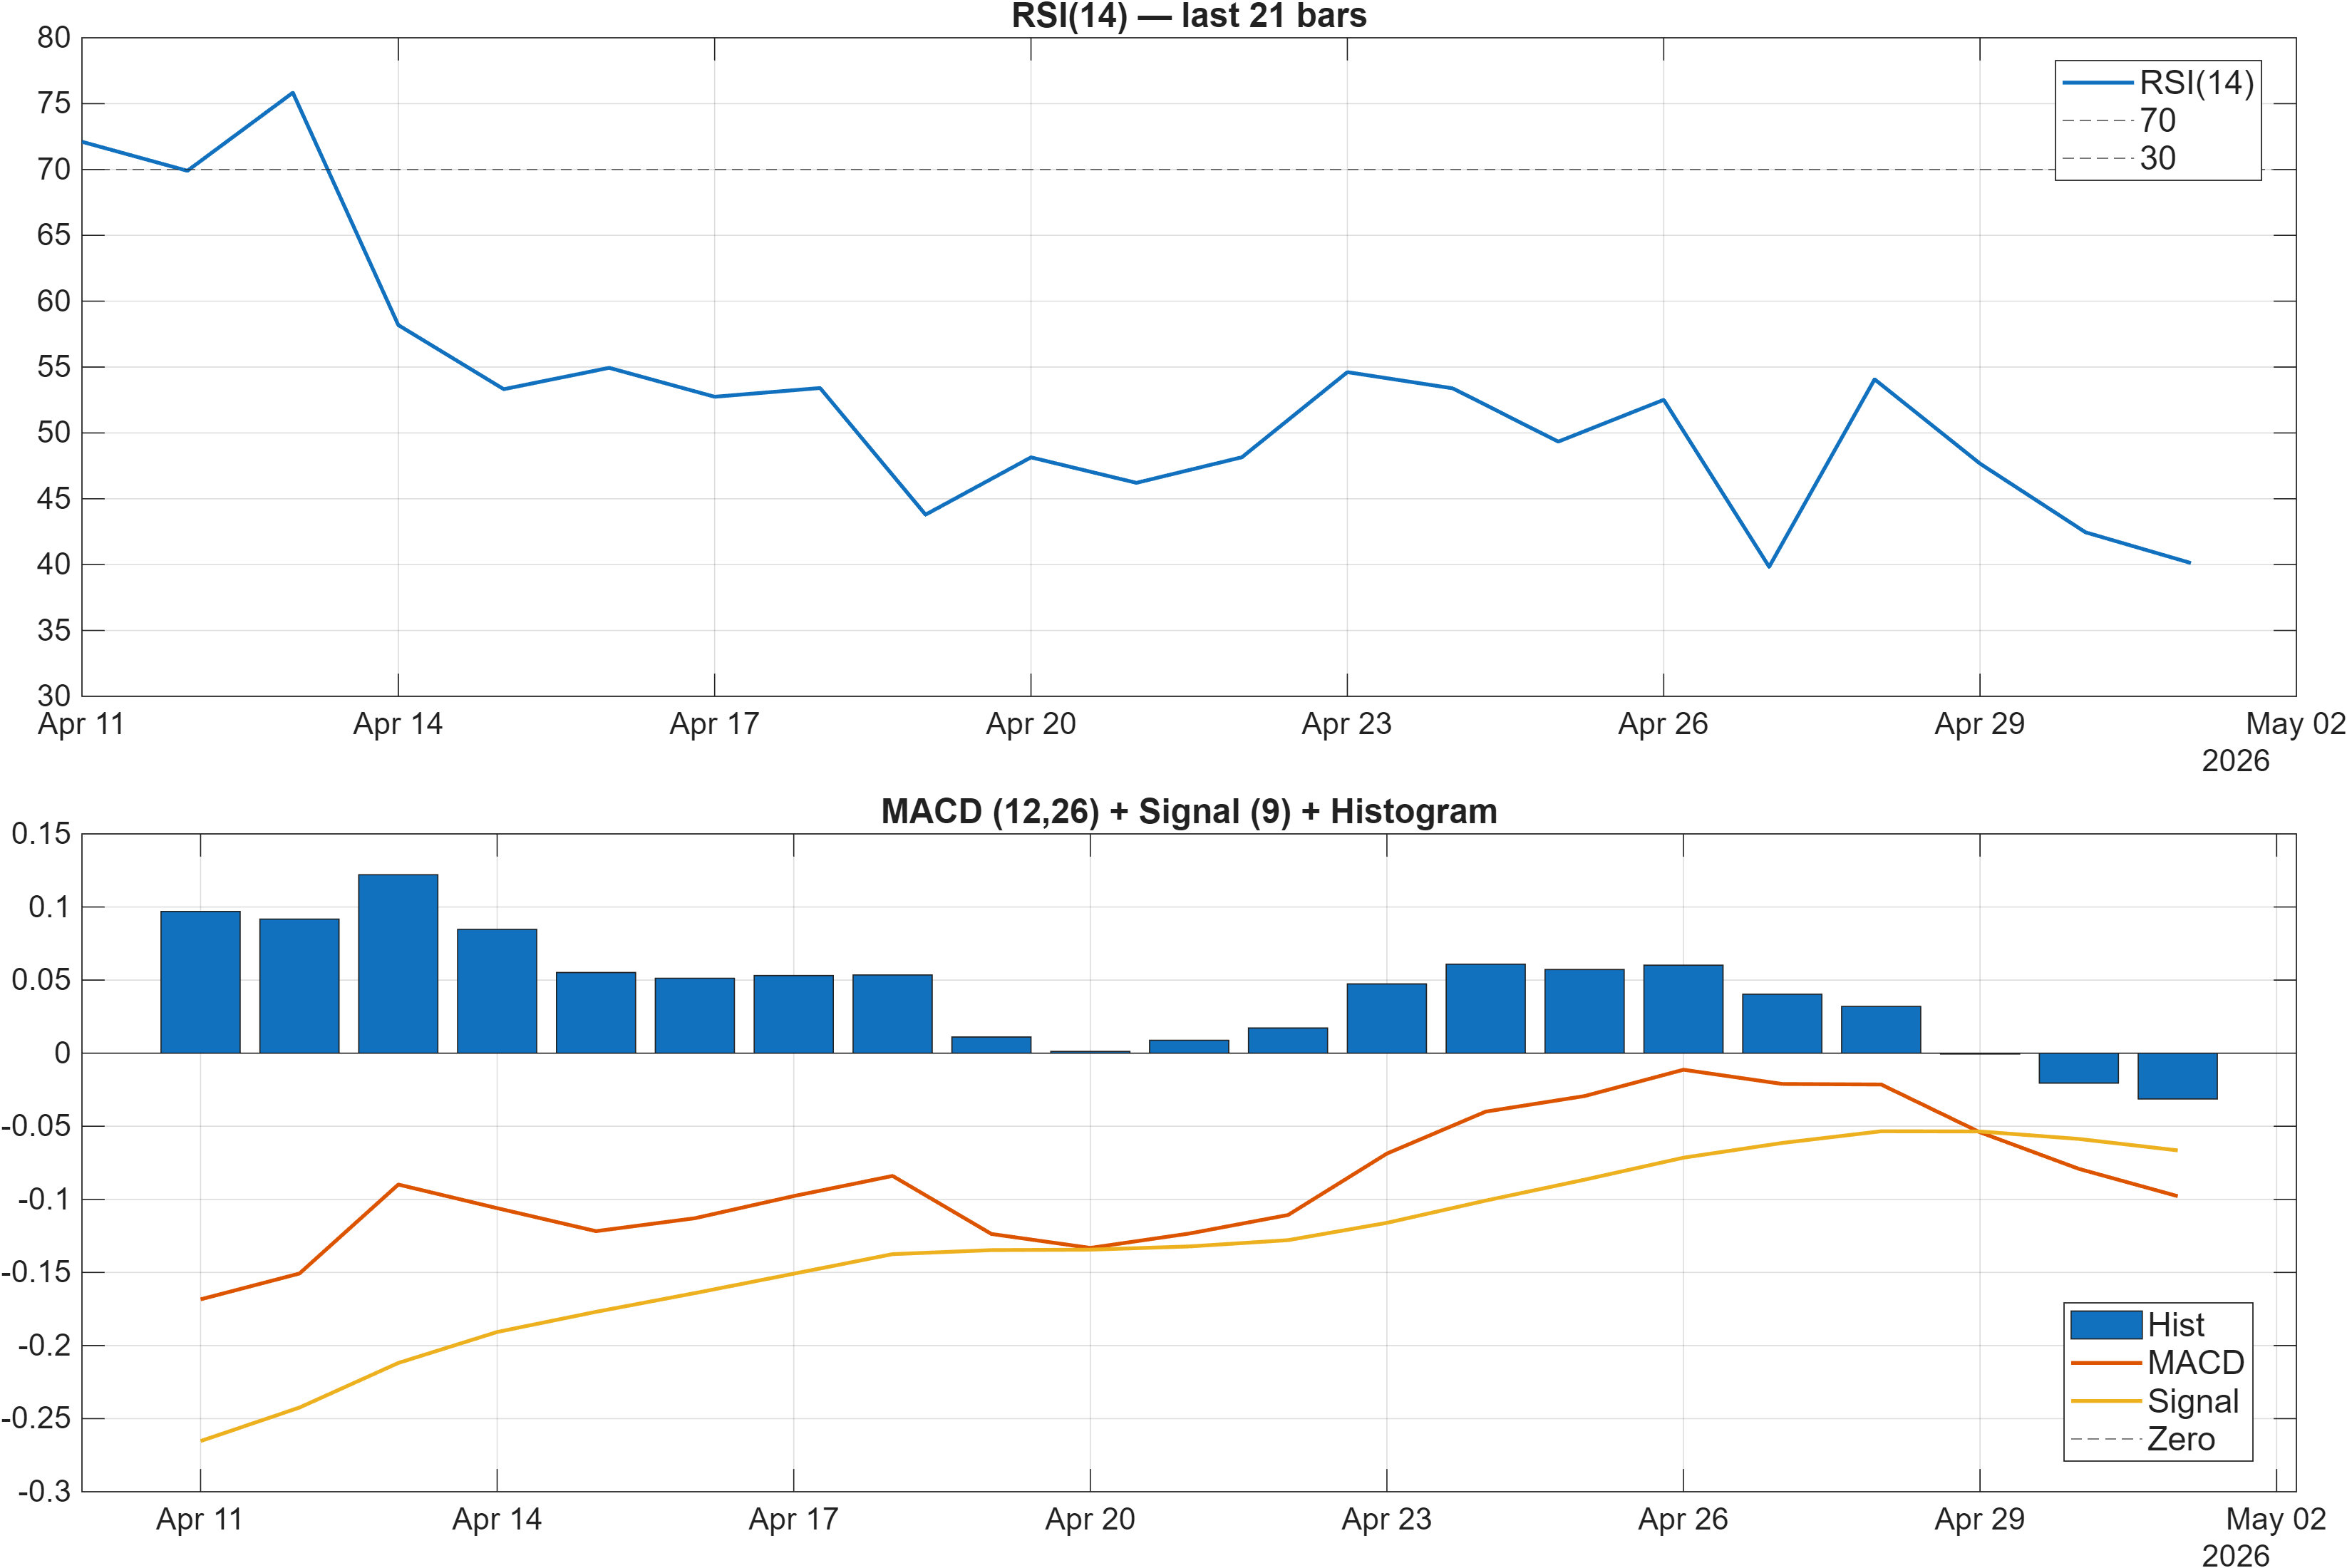
Interpretation: RSI bias = Neutral, MACD hist = -0.0313.
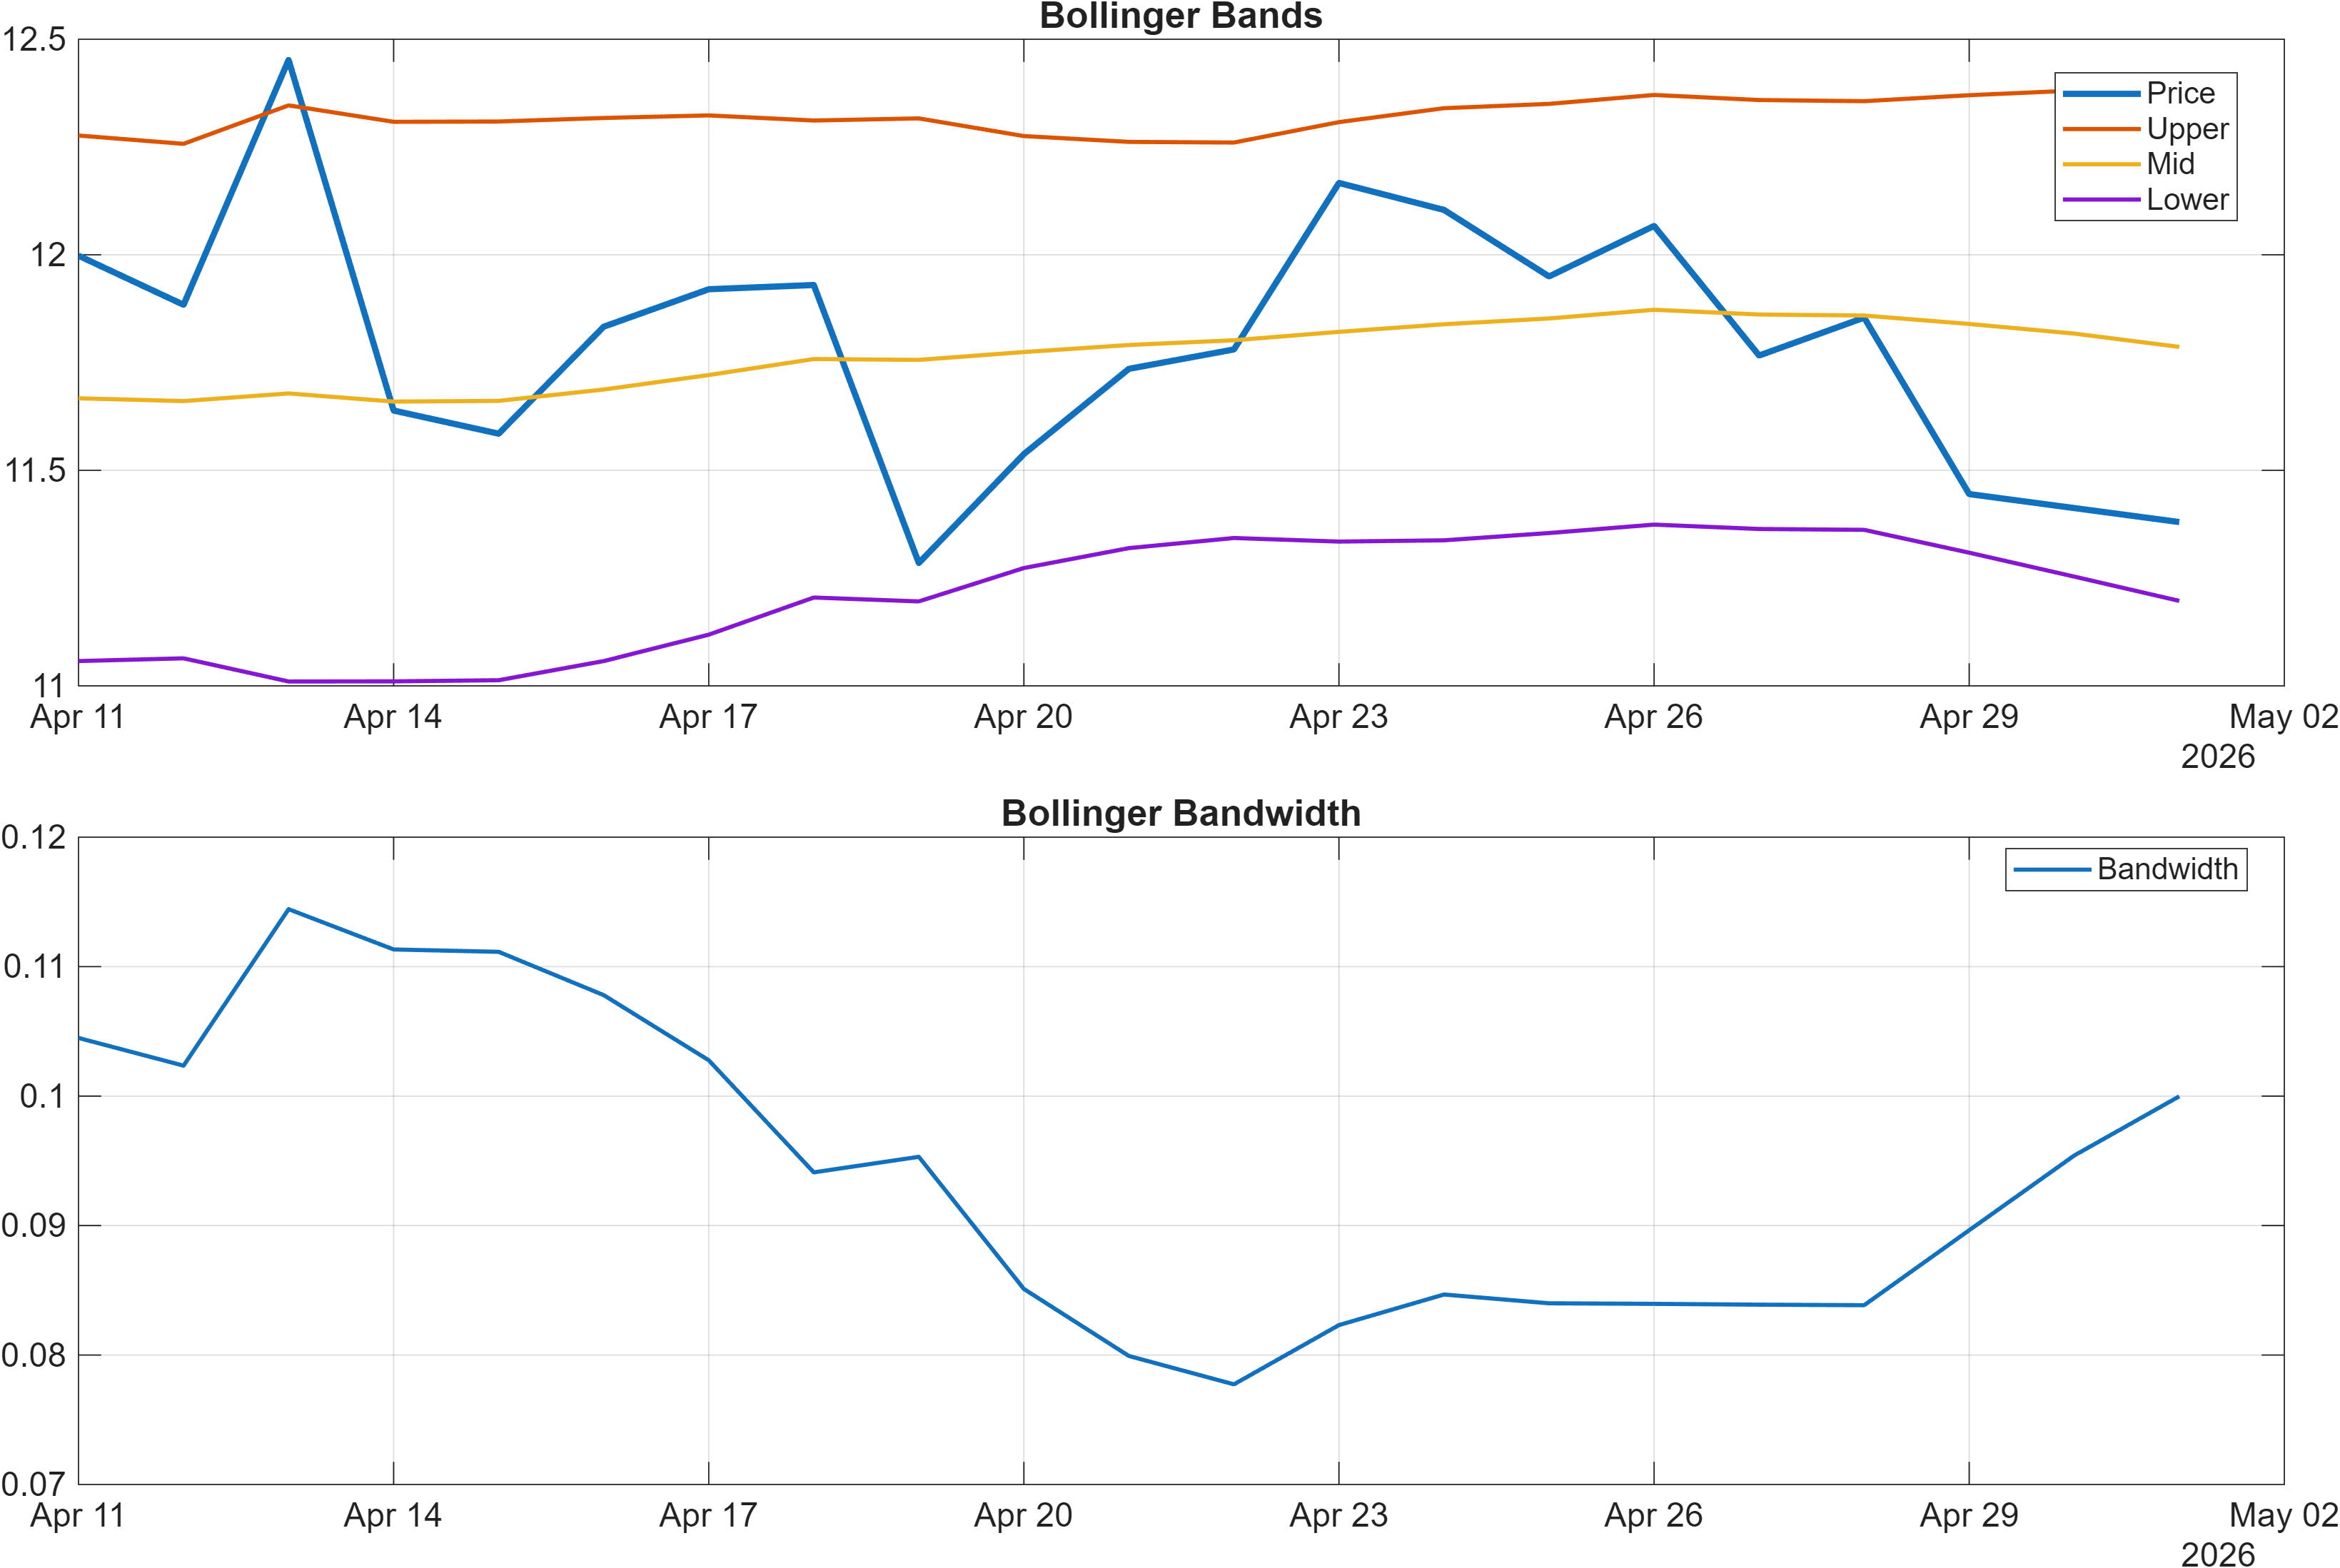
Interpretation: Bandwidth (volatility regime) latest = 0.1000.
Momentum is mixed, and the nuance matters. The MACD histogram is still negative at -0.0313, keeping the intermediate momentum impulse on the defensive. At the same time, the report flags RSI bias as Neutral while the signal table later classifies RSI(14) at 40.12 as bearish—an example of how oscillator “direction” and “state” can diverge. A ~40 RSI reading often indicates weak momentum but not necessarily capitulation, which can be consistent with a market that is compressing rather than accelerating lower.
Volatility adds context: Bollinger bandwidth at 0.1000 points to a moderate regime rather than an extreme expansion. In practice, moderate bandwidth frequently corresponds to range definition—levels tend to matter more, and false breaks are common if volume confirmation is absent. That complements the trend picture from Section 2: bearish structure can persist, but without high volatility, price action may oscillate around key averages and zones before committing.
For short-horizon monitoring, two elements stand out: whether MACD histogram can work back toward zero (reducing downside momentum), and whether RSI can reclaim a more balanced zone from the current 40.12 reading. If those improvements occur while volatility remains contained, it often indicates a stabilization phase rather than immediate trend reversal. Conversely, if volatility expands while MACD stays negative, the bearish moving-average stack gains follow-through risk.
4) Support / Resistance zones
Support ~ 11.1620 | Resistance ~ 13.9879
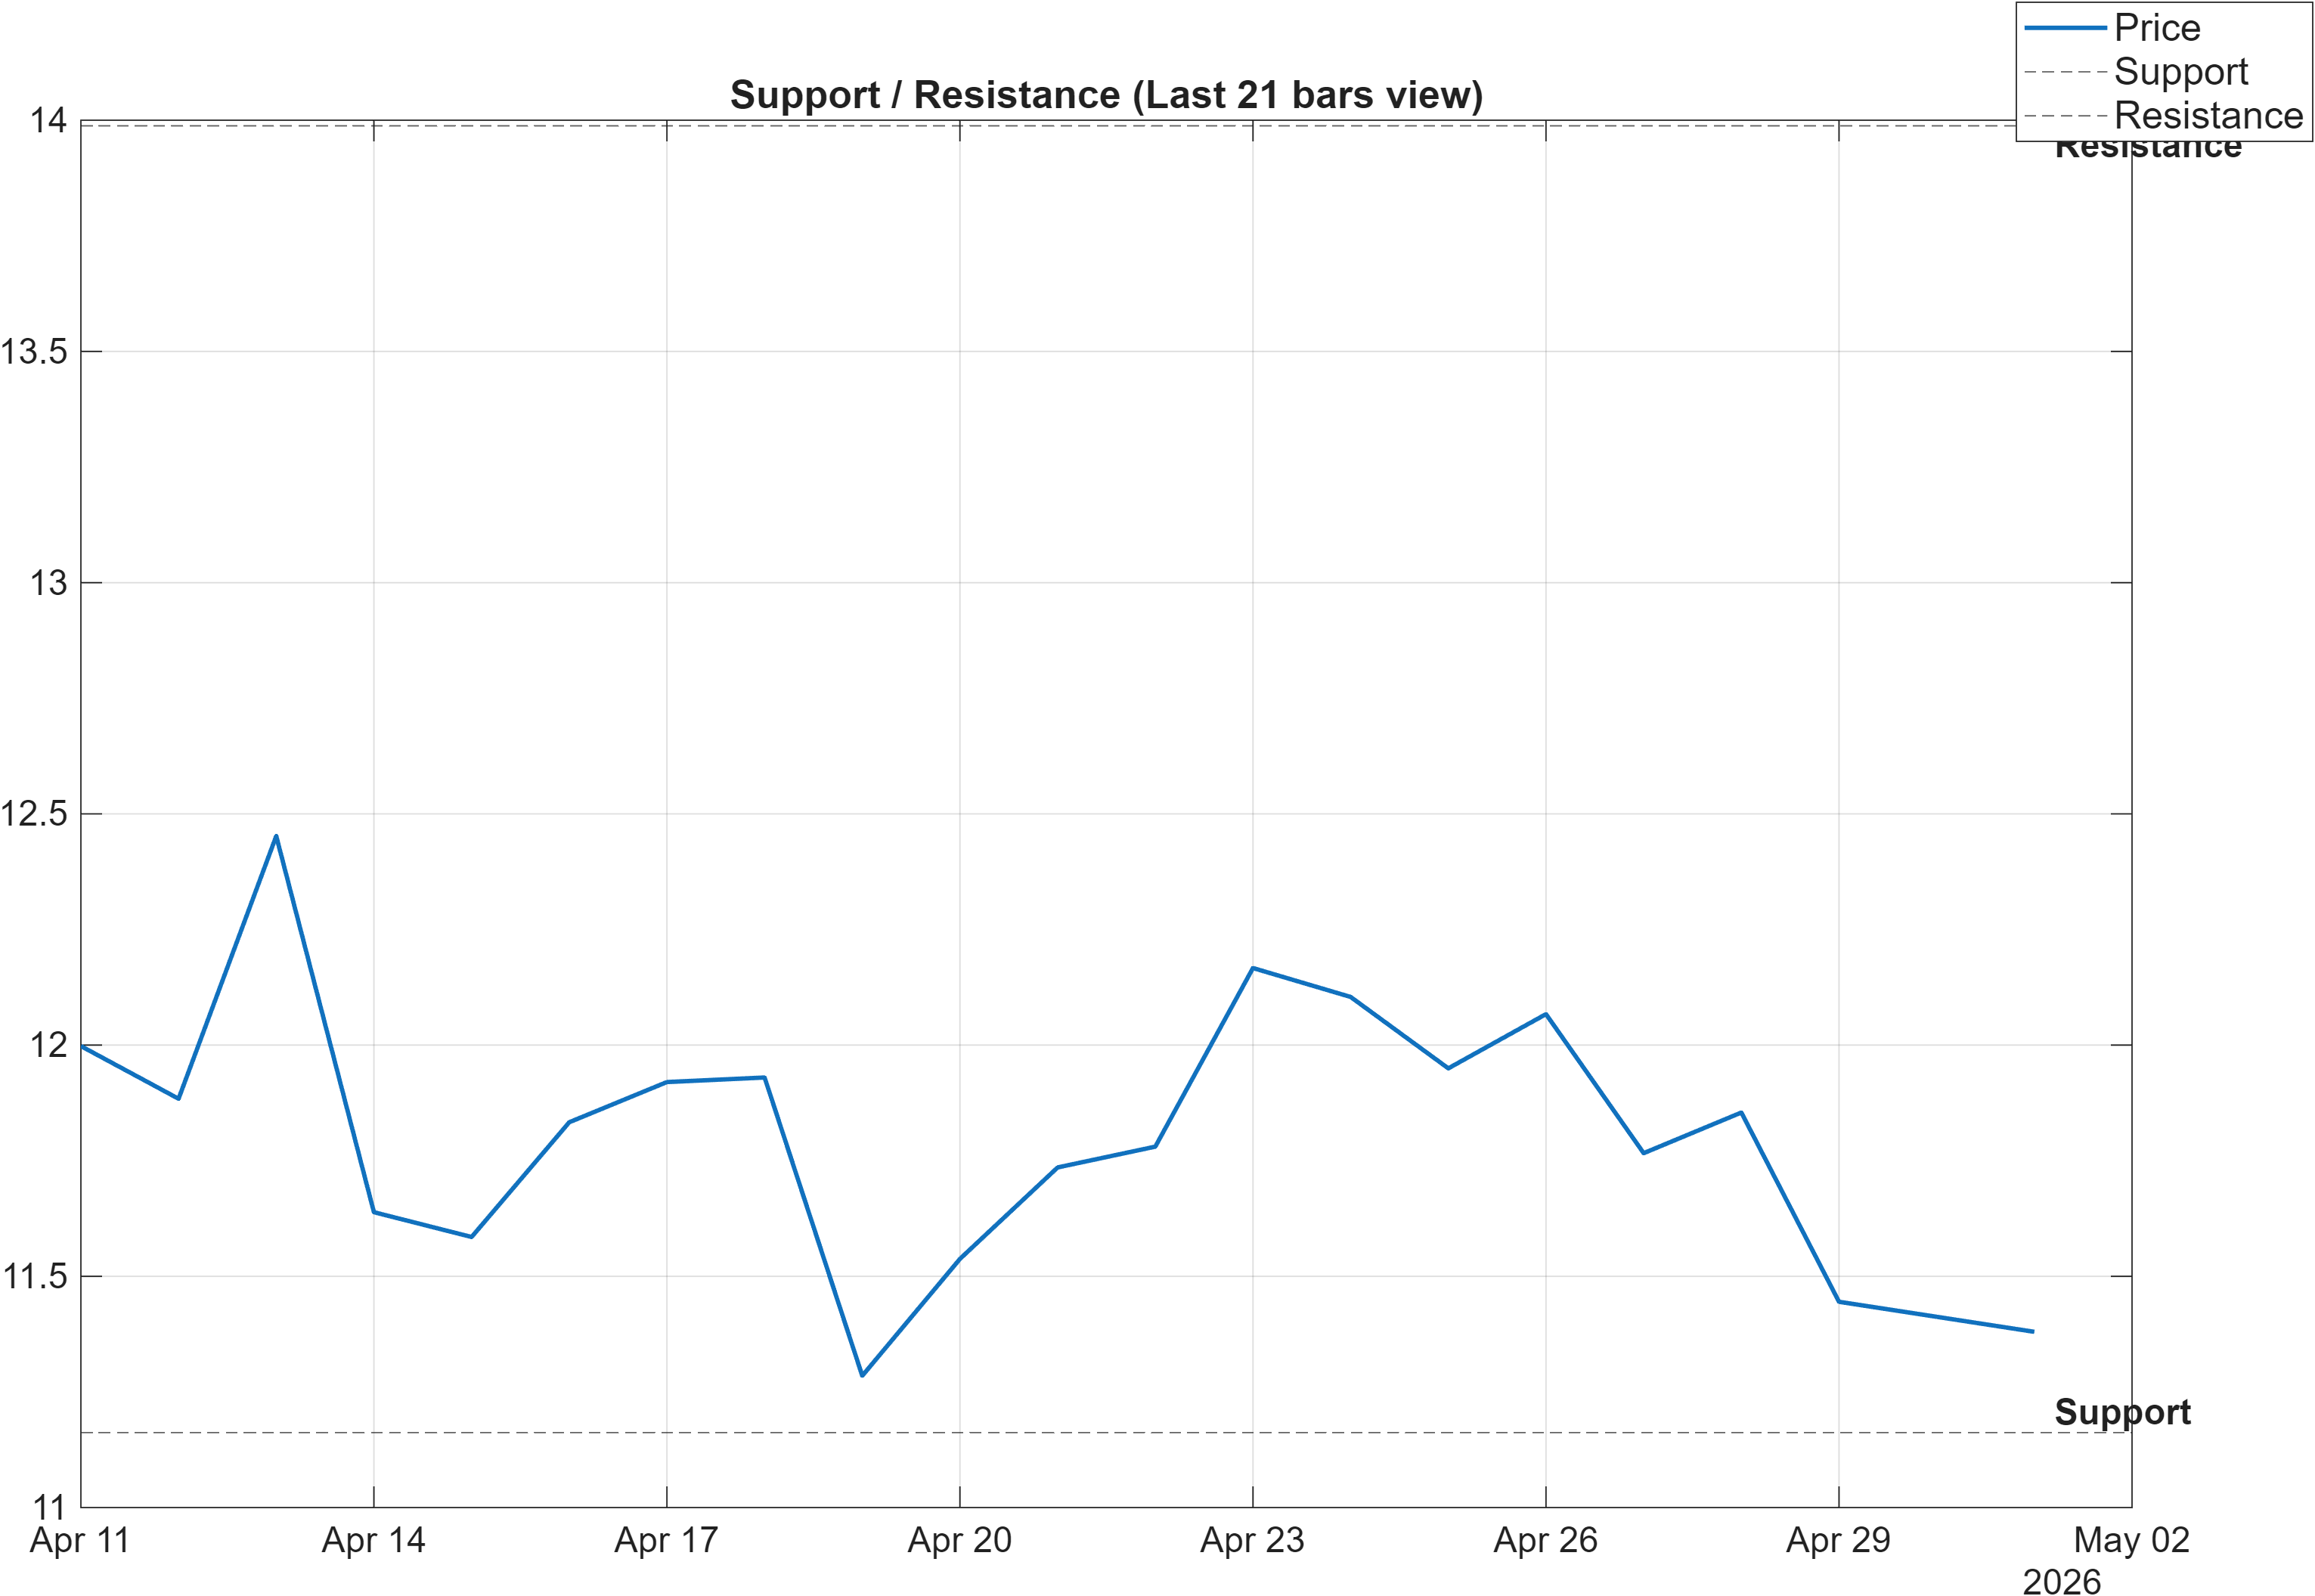
Scenario view: Break above resistance with volume → continuation. Close below support → signal deterioration risk.
With trend filters bearish and momentum mixed, the 11.1620–13.9879 corridor becomes the primary decision framework. In bearish regimes, support is less about calling a bottom and more about measuring whether selling pressure is still capable of producing new lows. A close below 11.1620 would therefore act as a regime-confirmation event for deterioration risk, especially if it aligns with negative momentum measures such as MACD histogram (-0.0313) remaining below zero.
Resistance at 13.9879 is the more demanding hurdle because it must overcome both structural headwinds (close vs MA50 bearish; MA50 vs MA200 bearish) and the confluence backdrop described later (overall technical score -0.188, still labeled neutral). A move above resistance “with volume” is specified as the continuation trigger; in market-structure terms, volume confirmation is the mechanism that reduces the probability of a thin-liquidity breakout that reverses quickly back into the prior range.
The implied asymmetry is straightforward: rallies into resistance need confirmation, while breaks of support can be self-reinforcing even without dramatic volatility, particularly when volatility is only moderate (bandwidth 0.1000). Until price exits this zone with confirmation, the highest-confidence approach is to treat levels as probabilistic boundaries around which the neutral KGNAI rank stance can persist. This is consistent with “middle-ground” positioning: neither side has decisive control unless the range resolves.
5) Quant Technical Dashboard (18 Signals)
KGNAI AI Technical Analysis Score (Deep Reinforcement Learning): Rank #391 out of 800 (Rank 1 represents the strongest technical positioning and a higher probability of favorable price behavior. As ranks increase toward the maximum, the probability of favorable outcomes weakens and bearish positioning becomes more dominant.) | Label: Neutral | Score: 0.022
18-Signal Technical Confluence Score: -0.278 (Neutral)
Overall Technical Score (18-signal confluence + DRL rank blend): -0.188 (Neutral)
Note: The blended score reflects signal strength weighted against broader AI technical ranking, which may temporarily diverge.
Blended technical score breakdown: -0.188 (Neutral | Bull 5 / Bear 10 / Neutral 3)
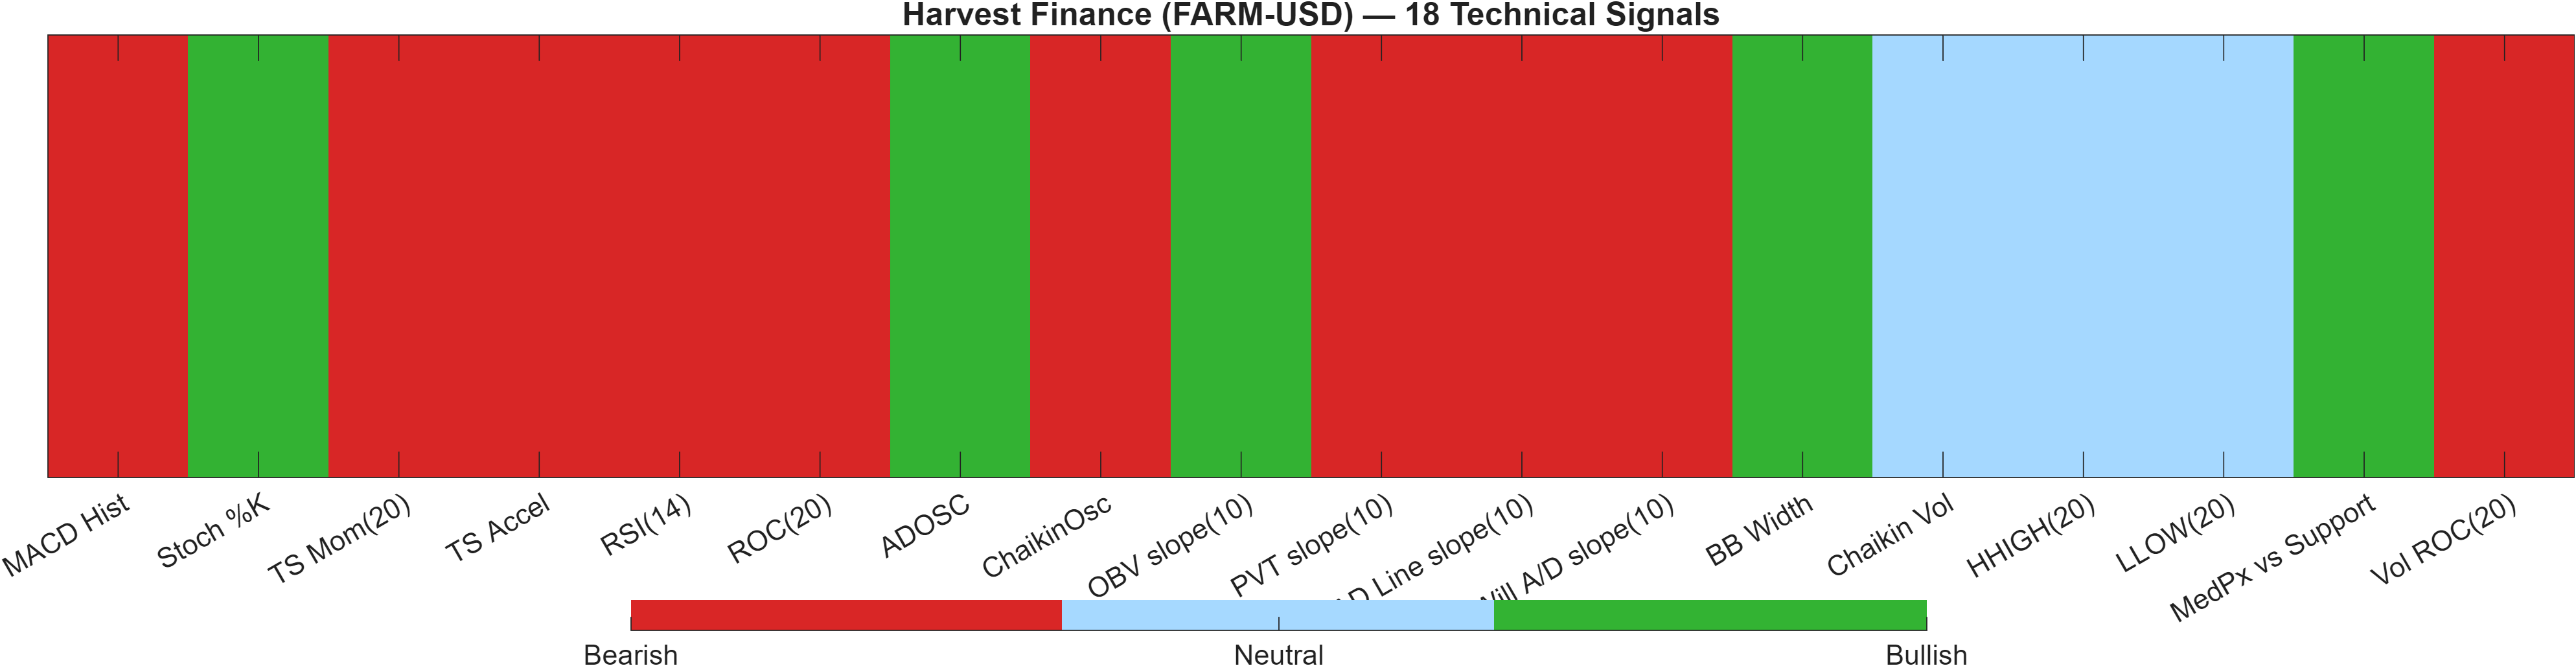
The technical dashboard is best read as a netting mechanism: multiple weak or bearish signals can coexist with a neutral label when countervailing signals prevent a clean directional conclusion. Here, the confluence score is -0.278 (Neutral) and the blended overall technical score is -0.188 (Neutral). Despite neutrality, the internal composition leans defensive: Bear 10 vs Bull 5 vs Neutral 3. That skew supports the bearish trend framing from moving averages while still acknowledging that the bullish subset is non-trivial.
The DRL technical rank at #391/800 reinforces the same idea: not a leadership profile, but also not an extreme outlier. The DRL score of 0.022 sits close to the model’s neutrality boundary, suggesting limited directional conviction from the reinforcement-learning lens. When both confluence and DRL settle near neutral, market behavior often becomes level-dependent, where support/resistance and volatility regime (bandwidth 0.1000) play a larger role than any single oscillator.
From the signal set itself, bearish momentum inputs (e.g., MACD histogram negative at -0.03132 and TS Mom(20) -0.4391) face off against select bullish/mean-reversion cues (e.g., Stoch %K at 14.62). This is a classic configuration for “bearish trend with oversold pockets”—conditions that can produce sharp rebounds but still struggle to convert into sustained upside unless trend filters improve. The practical consequence is that the neutral label should not be interpreted as “no risk,” but rather as non-decisive evidence with a modest bearish tilt inside the basket.
Signal table (Bull/Bear/Neutral)
| Indicator | Value | Signal |
|---|---|---|
| MACD Hist | -0.03132 | Bearish |
| Stoch %K | 14.62 | Bullish |
| TS Mom(20) | -0.4391 | Bearish |
| TS Accel | -0.226 | Bearish |
| RSI(14) | 40.12 | Bearish |
| ROC(20) | -4.241 | Bearish |
| ADOSC | 22.85 | Bullish |
| ChaikinOsc | -7.922e+05 | Bearish |
| OBV slope(10) | 1.929e+05 | Bullish |
| PVT slope(10) | -6788 | Bearish |
| AD Line slope(10) | -8.383e+05 | Bearish |
| Will A/D slope(10) | -0.5157 | Bearish |
| BB Width | 0.09998 | Bullish |
| Chaikin Vol | -26.92 | Neutral |
| HHIGH(20) | 13.54 | Neutral |
| LLOW(20) | 11.27 | Neutral |
| MedPx vs Support | 0.4996 | Bullish |
| Vol ROC(20) | -28.84 | Bearish |
Interpretation: Indicator-level signals form the base confluence, which is then adjusted using a separate AI-driven technical ranking model. The final technical score summarizes this combined view.
6) News sentiment + extractive gist
Note: Instrument-specific news matches were not found, so the digest includes broader market/sector headlines. Links are provided for verification.
Sentiment score (avg): 0.000 | Positive: 0% | Neutral: 100% | Negative: 0%
KGNAI AI News Sentiment Score (normalized -1 to +1): Not available (as of —) | Label: Not available | Overall news score: 0.00
Positive Developments
Recent coverage across major financial outlets indicates a generally constructive backdrop for the broader crypto ecosystem, centered on usage expansion and market plumbing rather than single-token catalysts. Stablecoin adoption themes—especially in regions where dollar-linked instruments are used for day-to-day transactions—support a narrative of crypto utility broadening beyond speculative cycles. In parallel, discussion around major-asset positioning and cost-basis “support zones” reflects a market that is monitoring institutional flows and positioning compression for signs of the next directional phase. While these items are not FARM-USD specific, they can influence risk appetite and liquidity conditions across smaller-cap and DeFi-adjacent tokens. With FARM-USD’s ranks neutral (daily #244/800; monthly #213/800) and technicals mildly negative (overall -0.188), a constructive macro-crypto tone can help stabilize relative behavior even when trend structure remains bearish.
Neutral / Mixed Developments
The news mix is dominated by sector-level context rather than idiosyncratic developments, consistent with the sentiment distribution showing 100% Neutral and an average score of 0.000. That neutrality can be informative: when coverage emphasizes market structure, flows, and surveillance rather than protocol-specific catalysts, price tends to become more sensitive to technical levels and liquidity conditions. For FARM-USD, this increases the weight placed on the defined range between support at 11.1620 and resistance at 13.9879, as well as on whether volatility remains moderate (bandwidth 0.1000) or begins to expand. In short, the informational backdrop is not currently providing a directional bias strong enough to override the chart-driven regime.
Negative / Risk Signals
Recent coverage across major financial outlets also highlights ongoing scrutiny around market integrity, surveillance, and potential enforcement attention in adjacent crypto venues. Even when not directly tied to FARM-USD, these themes can translate into intermittent risk-off bursts, thinner liquidity, or heightened sensitivity to adverse technical breaks—particularly in assets already carrying bearish trend signals (close vs MA50 bearish; MA50 vs MA200 bearish). With MACD histogram still negative (-0.0313) and the signal basket skewed toward bearish readings (Bear 10 vs Bull 5), a risk headline cluster can act as a catalyst for support tests rather than initiating a clean trend by itself. The practical risk is less about a single story and more about confidence shocks that compress or withdraw liquidity near key levels.
- Whether sector-wide risk appetite improves enough to support a sustained move above 13.9879 with volume.
- Any renewed market-integrity or enforcement-related tone that coincides with a retest of 11.1620.
- Signs of volatility expansion beyond the current bandwidth reading of 0.1000.
Sources referenced: Reuters, Bloomberg, Yahoo Finance, MarketWatch, Investing.com
Snapshot: AI Rank (Short–Mid–Long): Neutral (Neutral–Neutral–Neutral) · Technical Confluence: Neutral · Key Levels: Support ~11.16 | Resistance ~13.99 · News Sentiment: Neutral
7) Sources
- Stablecoins overtake Bitcoin in Latin America crypto purchases — Bitso — https://cointelegraph.com/news/stablecoins-surpass-bitcoin-latin-america-crypto-purchases-bitso-report?utm_source=rss_feed&utm_medium=rss&utm_campaign=rss_partner_inbound
- Bitcoin’s $75K cost basis emerges as key support zone for current bull trend — https://cointelegraph.com/markets/bitcoins-75k-cost-basis-cluster-emerges-as-key-support-zone-for-cycle?utm_source=rss_feed&utm_medium=rss&utm_campaign=rss_partner_inbound
- Insider trading backlash forces Polymarket to step up surveillance — https://cointelegraph.com/news/polymarket-chainalysis-insider-betting-detection-prediction-markets?utm_source=rss_feed&utm_medium=rss&utm_campaign=rss_partner_inbound
- Sentora brings institutional DeFi to the public with the launch of its Smart Yield platform — https://cointelegraph.com/press-releases/sentora-brings-institutional-defi-to-the-public-with-the-launch-of-its-smart-yield-platform?utm_source=rss_feed&utm_medium=rss&utm_campaign=rss_partner_inbound
- Three reasons why $3K ETH price target is back for May — https://cointelegraph.com/markets/three-reasons-why-3k-eth-price-target-is-still-in-play?utm_source=rss_feed&utm_medium=rss&utm_campaign=rss_partner_inbound
- Bitcoin Coinbase Premium threatens bear flag repeat with BTC price at $76K — https://cointelegraph.com/markets/bitcoin-coinbase-premium-threatens-bear-flag-repeat-with-btc-price-at-76k?utm_source=rss_feed&utm_medium=rss&utm_campaign=rss_partner_inbound
- HederaCon 2026 comes to Miami Beach on May 4 — Last chance to join leaders in tokenization and digital finance — https://cointelegraph.com/press-releases/hederacon-2026-comes-to-miami-beach-on-may-4-last-chance-to-join-leaders-in-tokenization-and-digital-finance?utm_source=rss_feed&utm_medium=rss&utm_campaign=rss_partner_inbound
- Here’s what happened in crypto today — https://cointelegraph.com/news/what-happened-in-crypto-today?utm_source=rss_feed&utm_medium=rss&utm_campaign=rss_partner_inbound
You may also like: How KGNAI AI ranks instruments across global markets
Disclaimer: KGNAI provides AI-generated analytics and educational market commentary only. This is not financial advice. Markets involve risk. Always do your own research.