
LEASH-USD (Doge Killer) Technical, Rank & Sentiment Review — 03-May-2026 (Bullish ranks vs mixed technical posture)
LEASH-USD (Doge Killer) presents a split profile on 03-May-2026: cross-sectional ranks point to strength on longer horizons, while several near-term technical components remain strained. Within a 799-instrument crypto universe, the Monthly rank (#5) and 3-Monthly rank (#58) suggest the asset is positioned in the upper tier on a relative basis, yet the Weekly rank (#285) sits closer to the middle of the pack, implying slower follow-through at the intermediate cadence. On price structure, the moving-average read-through remains bearish (Close vs MA50 bearish; MA50 vs MA200 bearish), consistent with a market still working through trend repair. Momentum and breadth are similarly mixed: RSI bias is bearish while MACD histogram is flat (0.0000), and volatility (Bollinger bandwidth 1.9713) indicates a regime where expansion risk is non-trivial. News flow is neutral in the provided data (sentiment average 0.000).
- Rank stance (Short / Mid / Long): Neutral / Bullish / Bullish (Daily #31; Weekly #285; Monthly #5; 3-Monthly #58 out of 799).
- Technical confluence: Neutral (18-signal confluence 0.000; blended technical score -0.241).
- Key levels: Support ~ 0.0000 | Resistance ~ 0.0000.
- News sentiment bias: Neutral (avg 0.000; 100% neutral in provided data).
- Confirmation / invalidation: A break above resistance with volume supports continuation; a close below support elevates deterioration risk (per scenario view).
What KGNAI Measures
KGNAI evaluates assets using large cross-sectional datasets built from millions of structured data points. Inputs incorporate fundamental metrics, technical structures, and systematically processed news sentiment. Statistical models, machine learning, and AI frameworks are used to assess relative positioning, signal alignment, and probabilistic behavior across broad universes.
How to Read This Report
- Ranks are comparative across the tracked universe, not absolute price targets.
- Confluence reflects alignment among independent signal groups.
- Support/resistance levels are probabilistic decision zones, not guarantees.
- Sentiment provides contextual bias within the broader analytical framework.
1) KGNAI AI Analysis
Region: CRYPTO
Total universe size: 799 ranked instruments
- Daily rank: #31 out of 799 — Bullish
- Weekly rank: #285 out of 799 — Neutral
- Monthly rank: #5 out of 799 — Bullish
- 3-Monthly rank: #58 out of 799 — Bullish
The rank stack for LEASH-USD is characterized by time-horizon divergence: shorter cadence signals are constructive, but not uniformly reinforced by the intermediate horizon. The Monthly rank (#5) places LEASH-USD in the extreme upper tier of the 799-instrument universe, while the 3-Monthly rank (#58) remains in a strong upper band, consistent with a longer-horizon relative bid. By contrast, the Weekly rank (#285) pulls the profile toward the center of the distribution, implying that recent relative behavior has been less dominant than the broader monthly signal suggests.
This mismatch matters because regime transitions often show up first as a compression in cross-horizon agreement: a strong monthly rank alongside a middling weekly rank can occur when a prior impulse is still being recognized by slower models, while faster models detect stalling or mean-reversion pressure. The Daily rank (#31) being bullish partially offsets that concern, indicating near-term relative behavior is still competitive versus peers—yet the weekly layer argues for caution around persistence.
KGNAI’s stated term view—Short-term: Neutral, Mid-term: Bullish, Long-term: Bullish—fits the observable rank geometry: supportive longer-horizon positioning with an intermediate “gap” that can translate into choppier path dependence. In practical risk framing, the monthly strength is a tailwind for relative selection, while the weekly neutrality increases sensitivity to confirmation from price structure and momentum (covered in Sections 2–3).
2) Price & trend overview
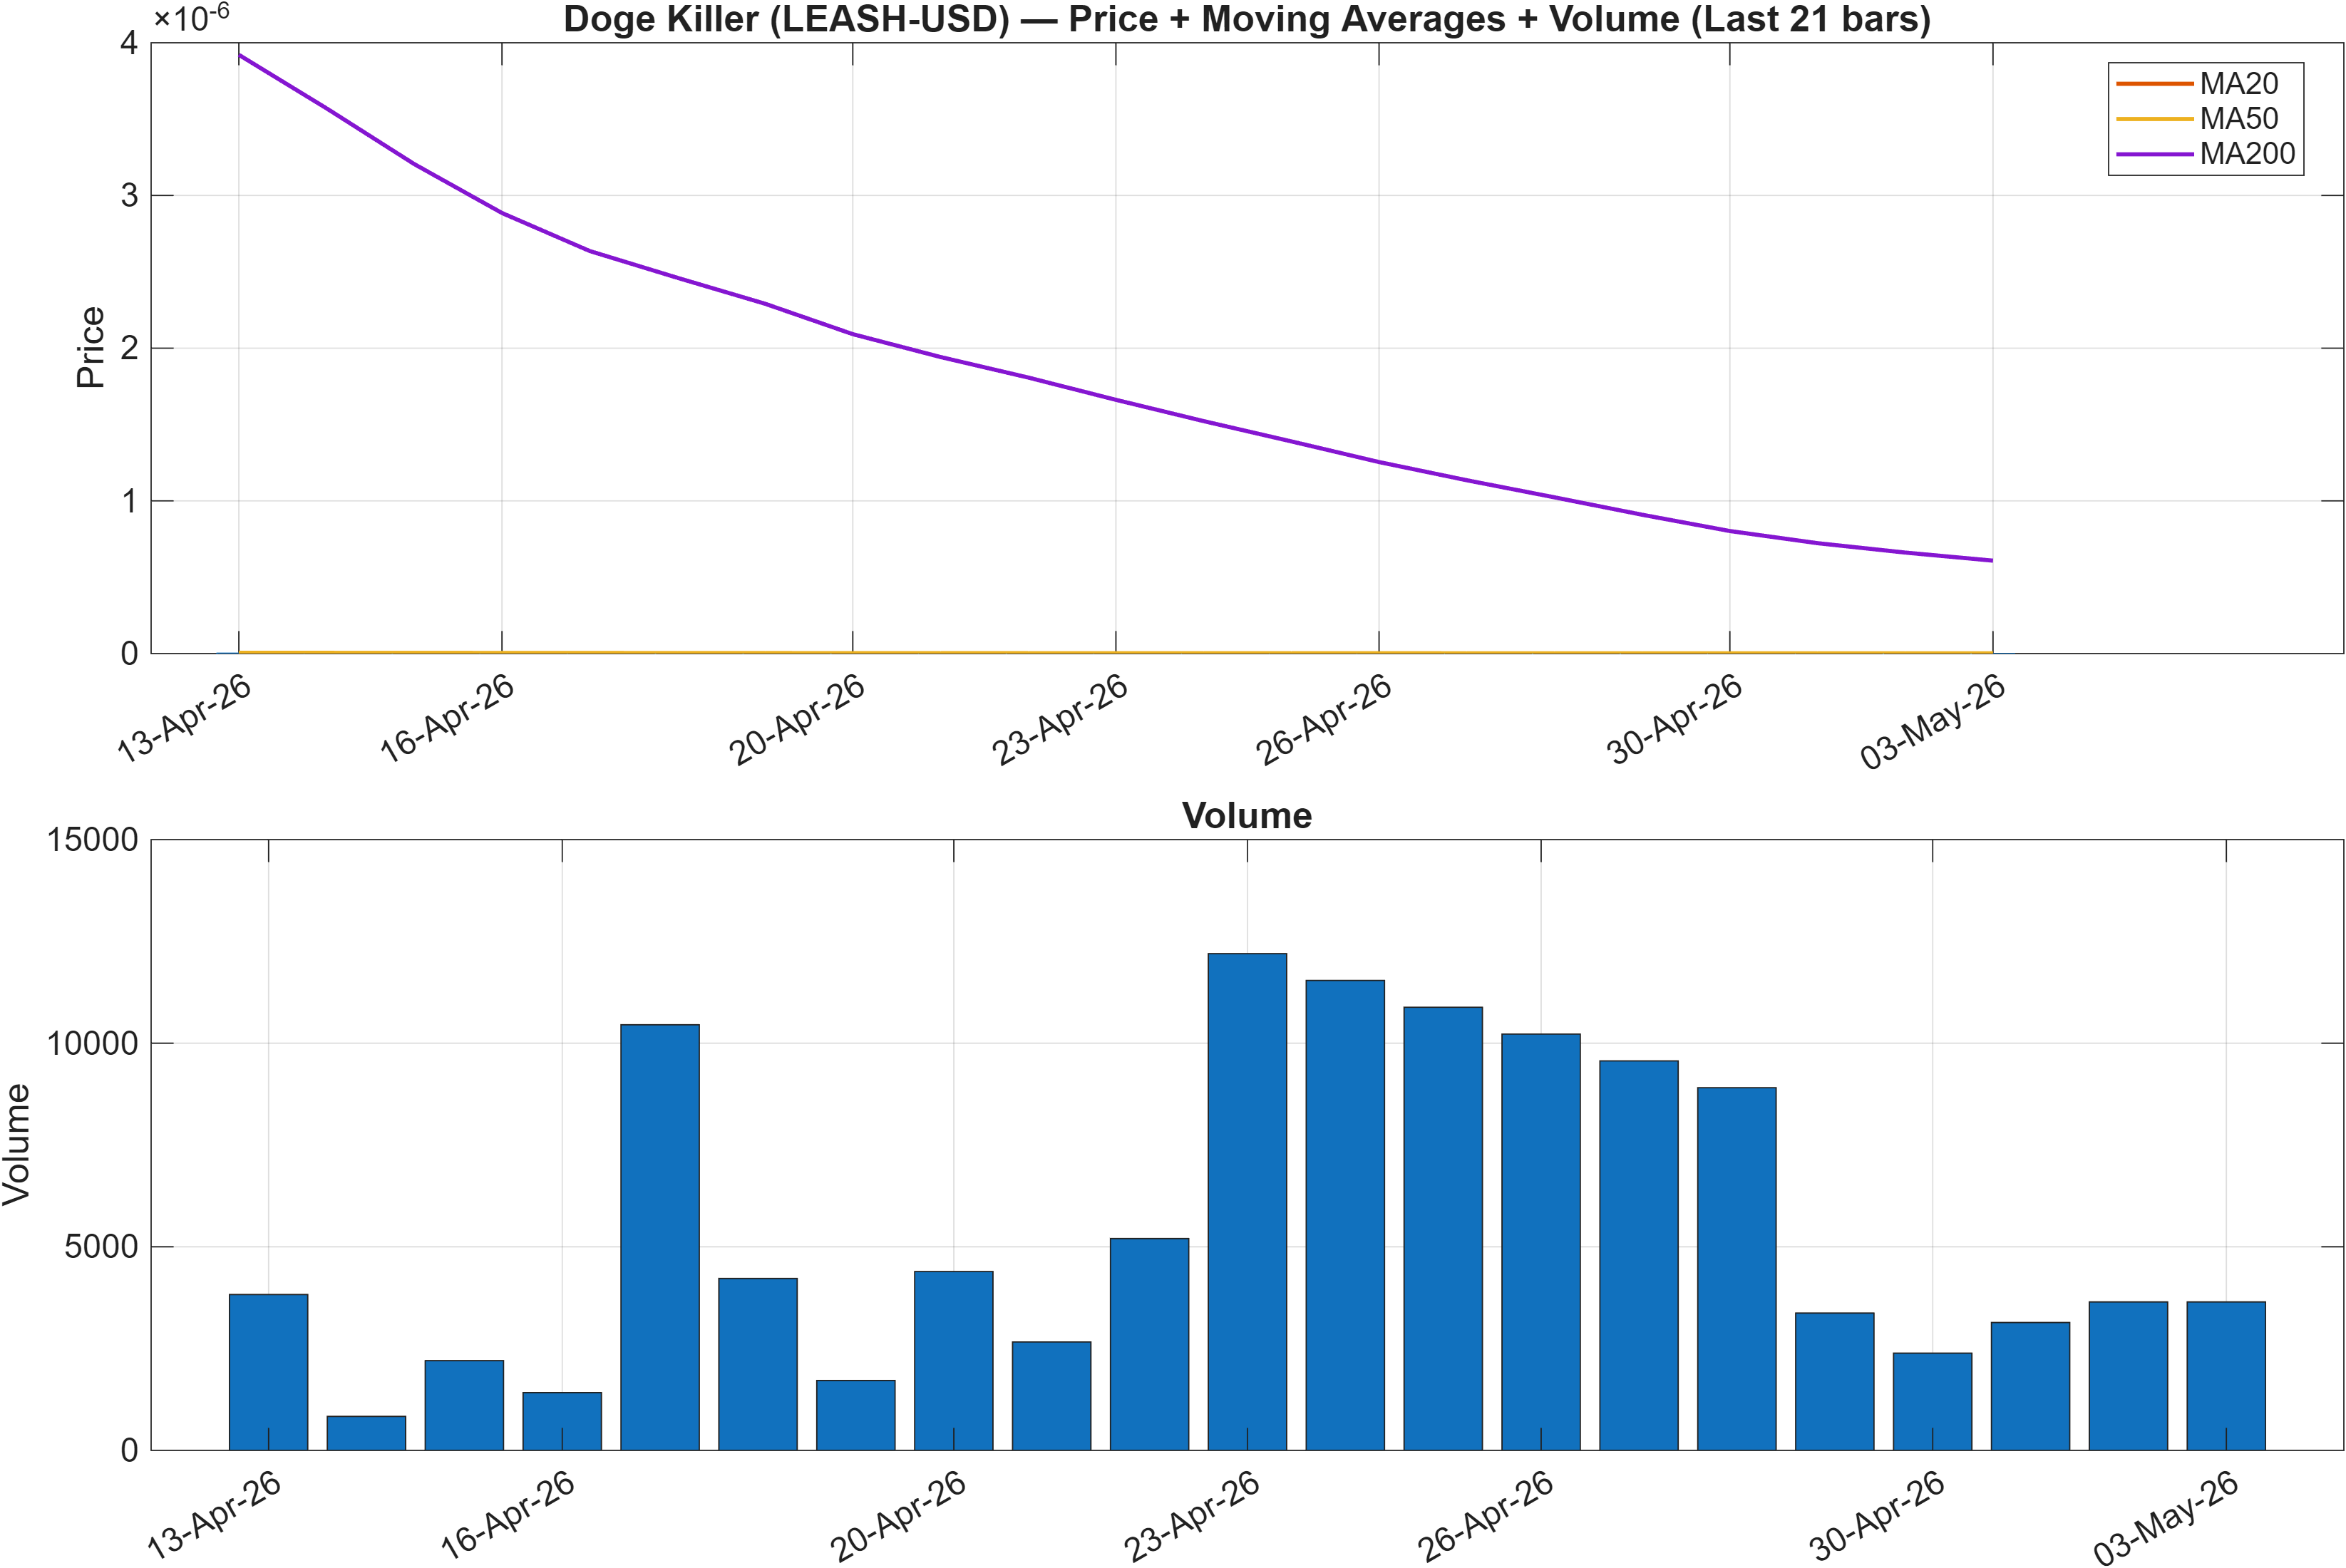
The trend read is defined by bearish moving-average alignment, with the interpretation stating Close vs MA50 = Bearish and MA50 vs MA200 = Bearish. That configuration typically reflects two concurrent conditions: (1) price is trading below the intermediate trend proxy (MA50), and (2) the intermediate trend remains weaker than the longer baseline (MA200). In other words, even if tactical rebounds occur, the prevailing structure still requires evidence of repair before a “clean” uptrend can be argued purely from trend filters.
This is where the rank/price tension becomes analytically useful. A Monthly rank of #5 can coexist with bearish MA structure when the asset is outperforming peers on a relative basis despite weak absolute trend shape, or when prior outperformance has not yet been reflected in slower trend filters. Conversely, a strong rank can also occur after large downside moves if peer weakness is even more severe; that possibility is consistent with the broader technical dashboard later showing a DRL technical rank of #721, which is deep in the weaker tail of the universe.
The most actionable inference is not directional forecasting, but regime identification: LEASH-USD currently looks more like a market in rebuilding/transition than one in fully re-established trend continuation. This interpretation dovetails with the intermediate weekly rank being neutral (#285), suggesting trend strength is not broadly confirmed across models. For readers integrating the moving-average lens with support/resistance (Section 4), bullish continuation typically benefits from a shift in these MA interpretations from bearish toward neutral/positive, rather than relying on one-off price spikes.
3) Momentum & volatility dashboard
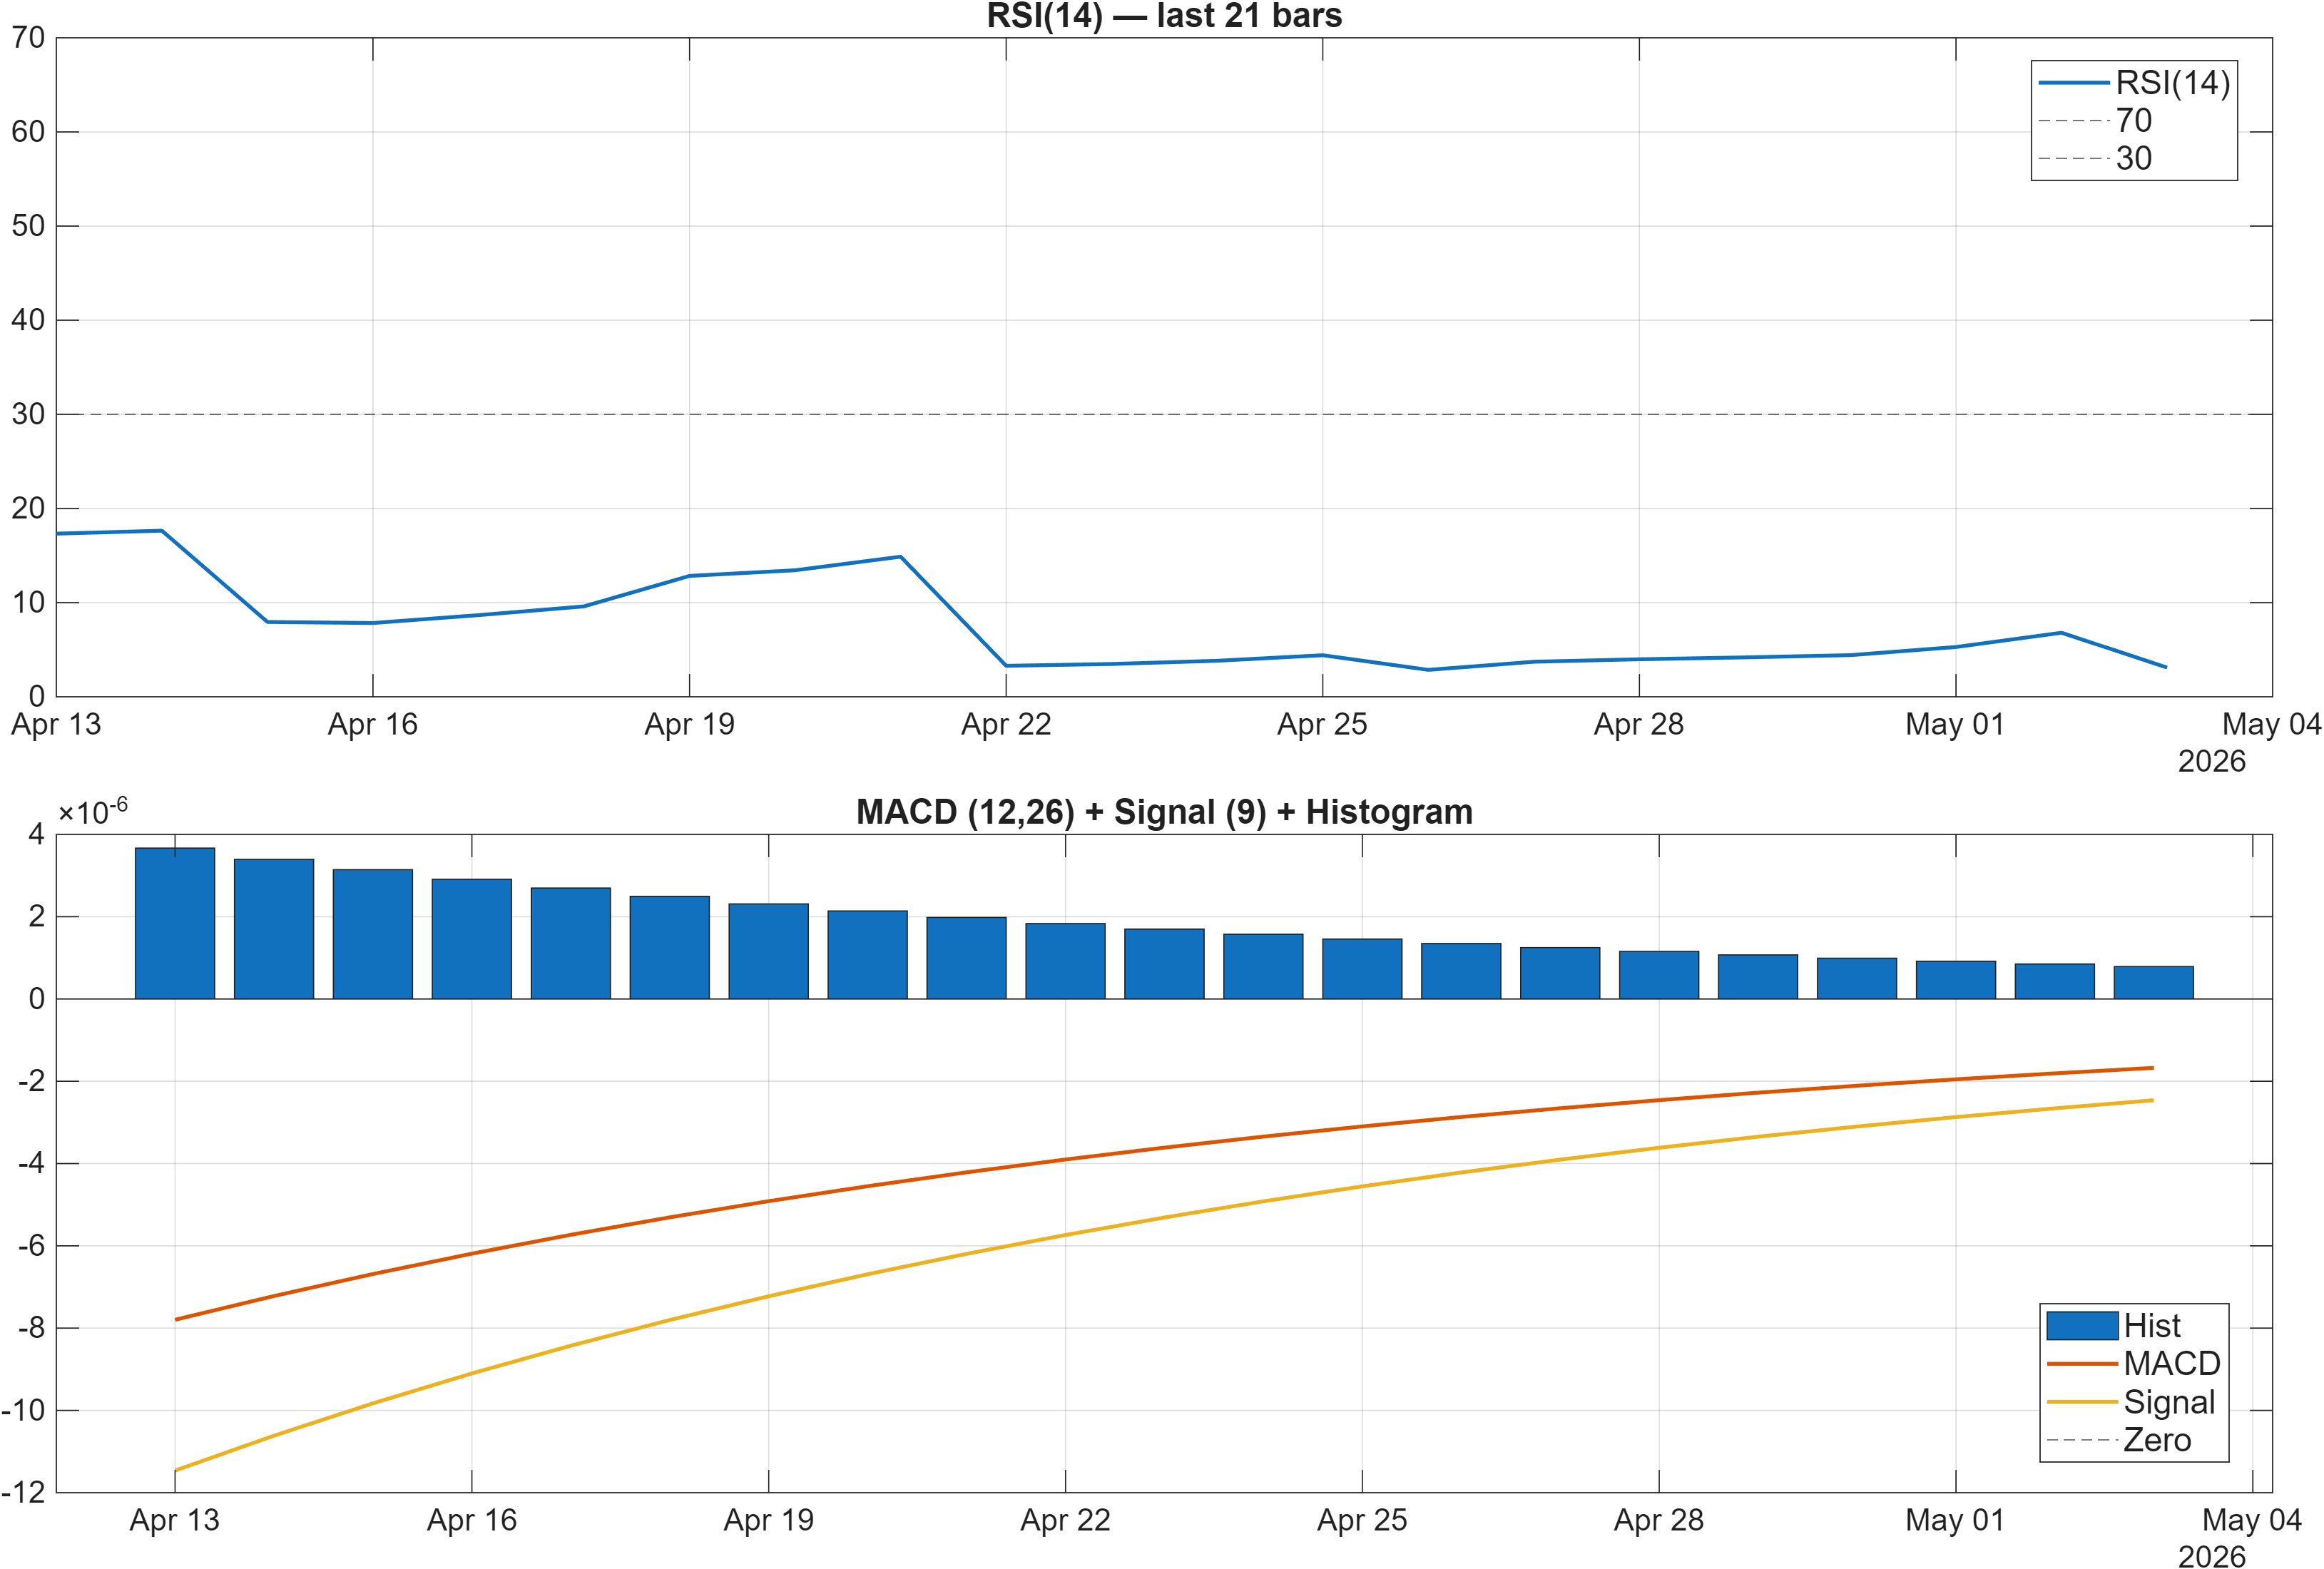
Momentum readings lean toward compression rather than impulse. The dashboard interpretation flags RSI bias = Bearish, a condition commonly associated with weak bid support and limited upside follow-through. At the same time, the MACD hist = 0.0000 suggests the MACD spread is effectively flat at the margin—often seen when downside momentum is no longer accelerating, but upside momentum has not established dominance either.
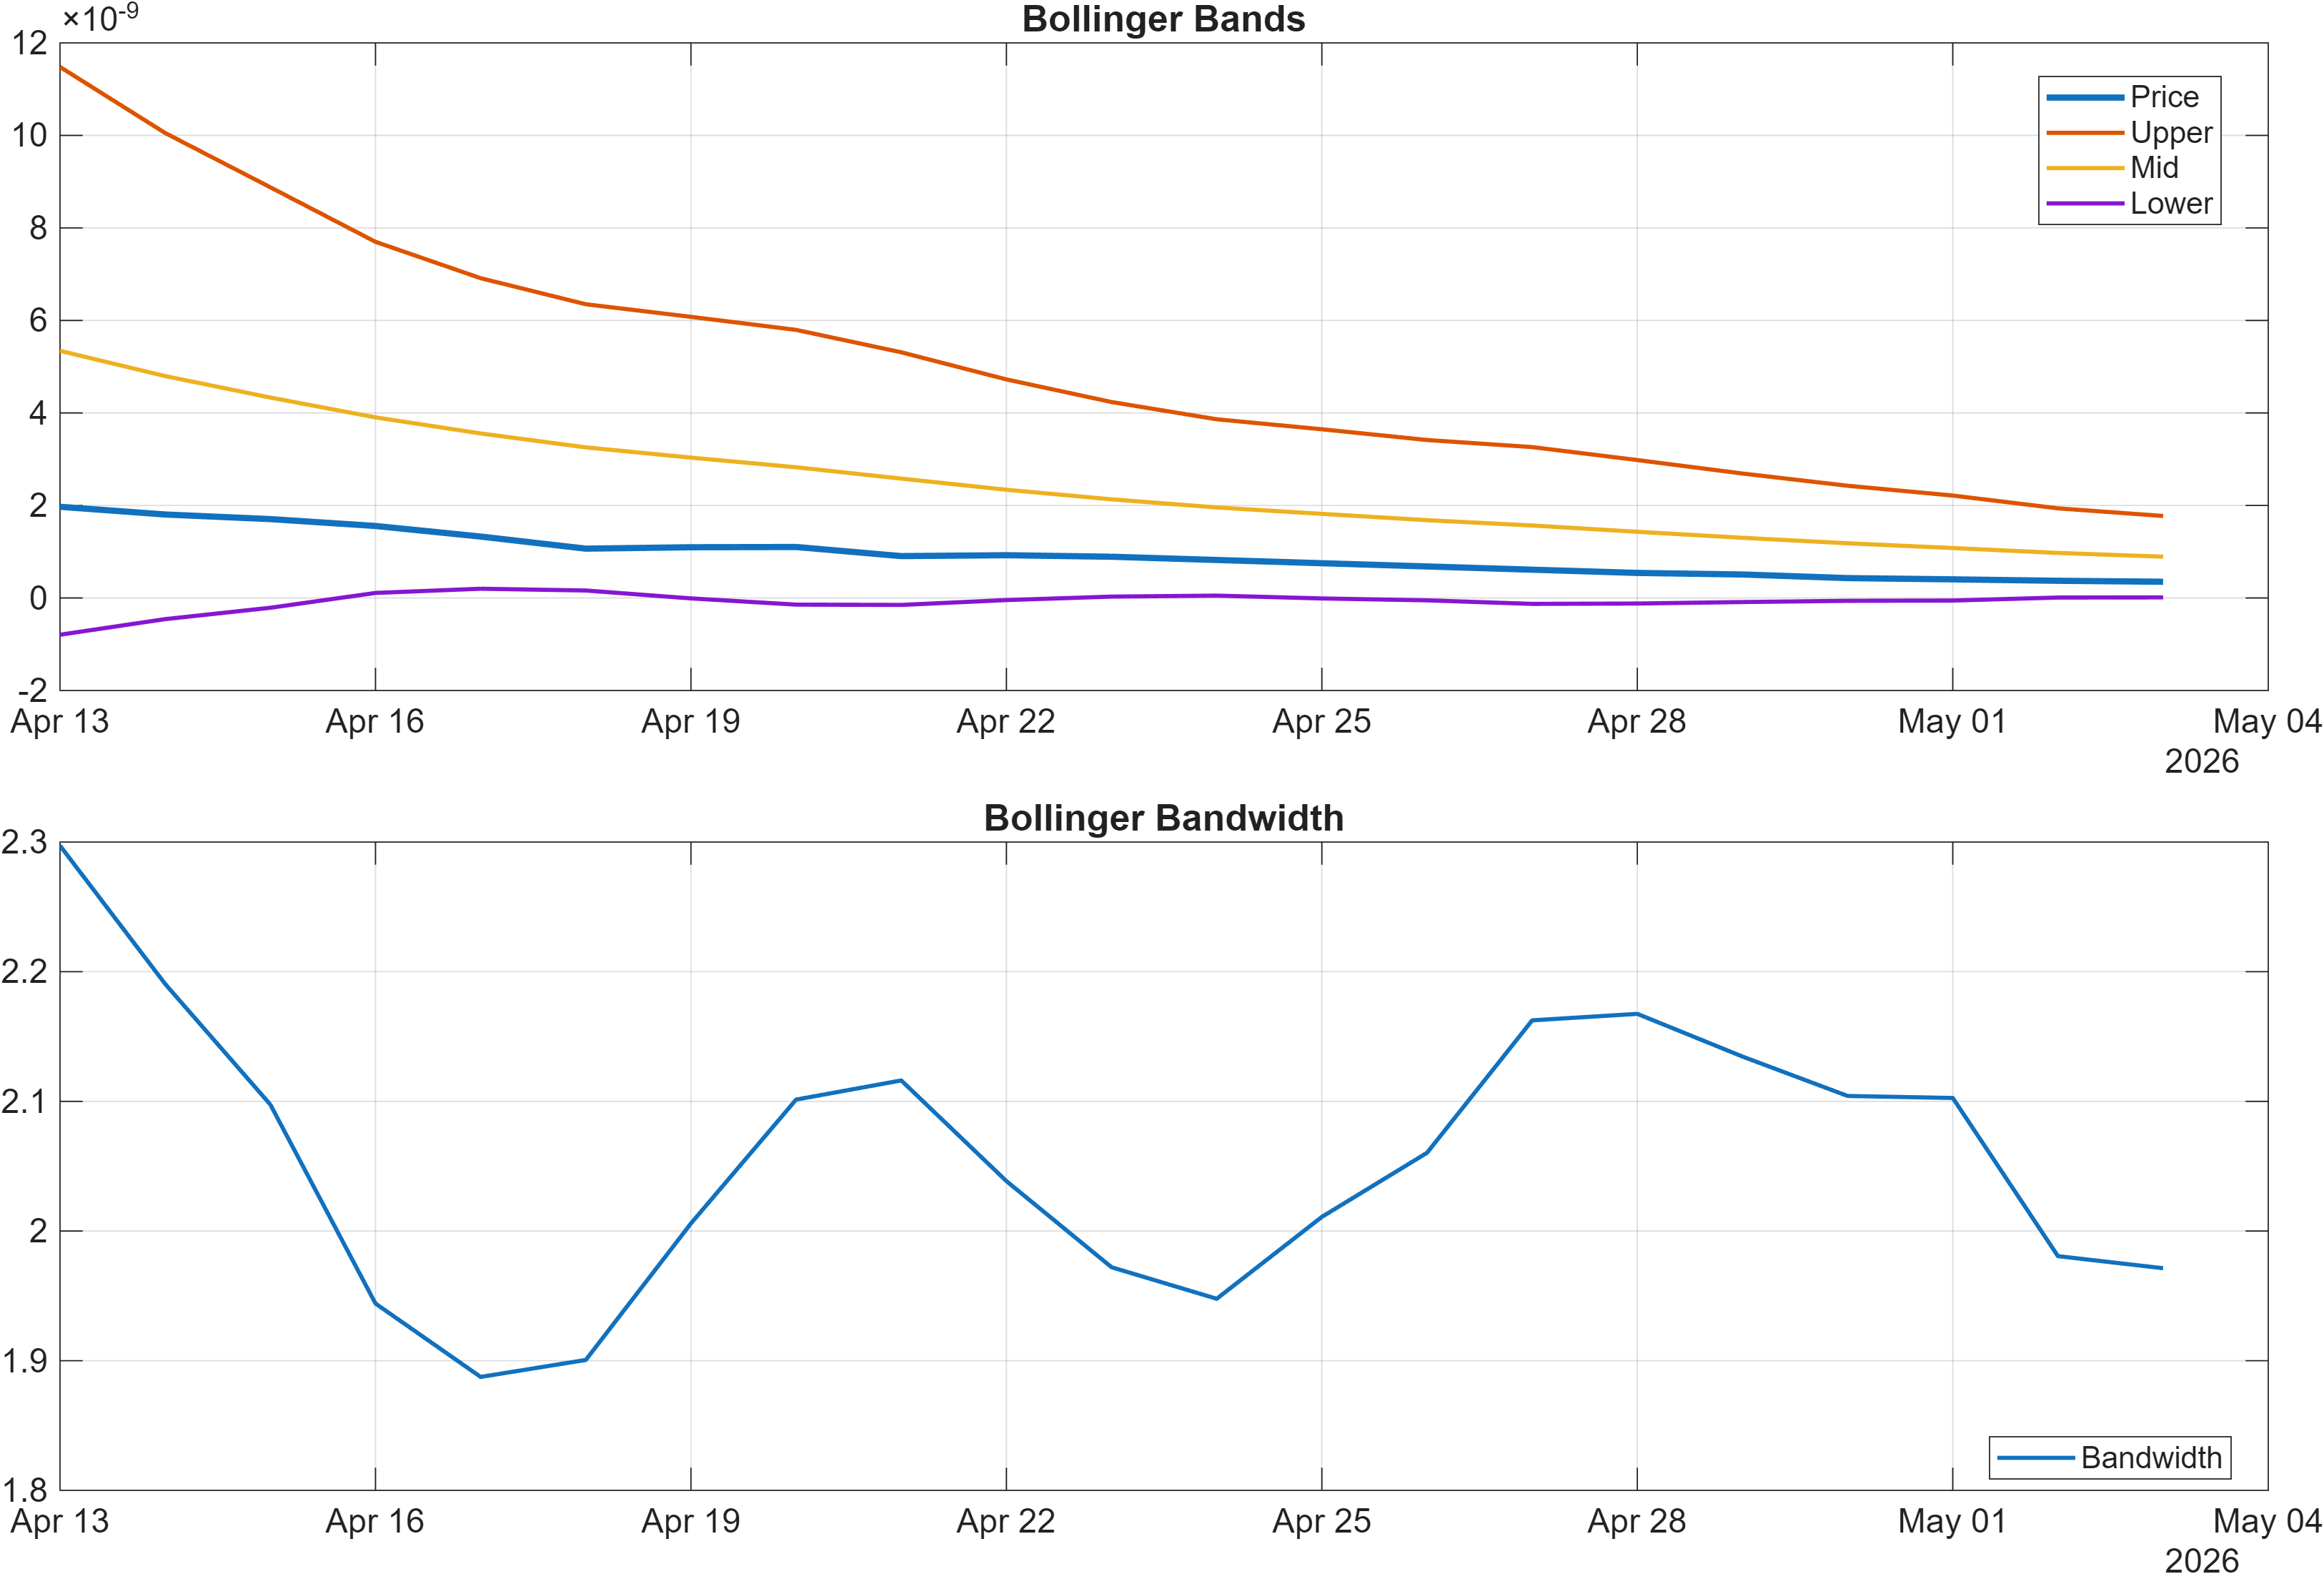
Volatility context adds a second layer. The latest Bollinger bandwidth is 1.9713, indicating a volatility regime that is not trivially tight. In practice, that reduces the reliability of single-indicator “mean reversion” narratives: wider bandwidth can amplify whipsaws, especially when trend filters (Section 2) are bearish. It also means that if a directional move emerges, it can travel quickly through levels—making confirmation criteria (break/hold logic around resistance/support) more important than usual.
A useful way to reconcile these signals is momentum asymmetry: RSI bearish implies sellers have recently had the advantage, while MACD histogram at 0.0000 implies that advantage may not be strengthening. That combination can precede either stabilization or renewed weakness, depending on whether price structure improves. In the broader signal set (Section 5), the presence of mixed oscillator and volume-derived readings—e.g., a bullish MACD histogram value in the signal table alongside bearish RSI framing—supports the view that LEASH-USD is in a “testing” phase where momentum signals are not yet synchronized.
4) Support / Resistance zones
Support ~ 0.0000 | Resistance ~ 0.0000
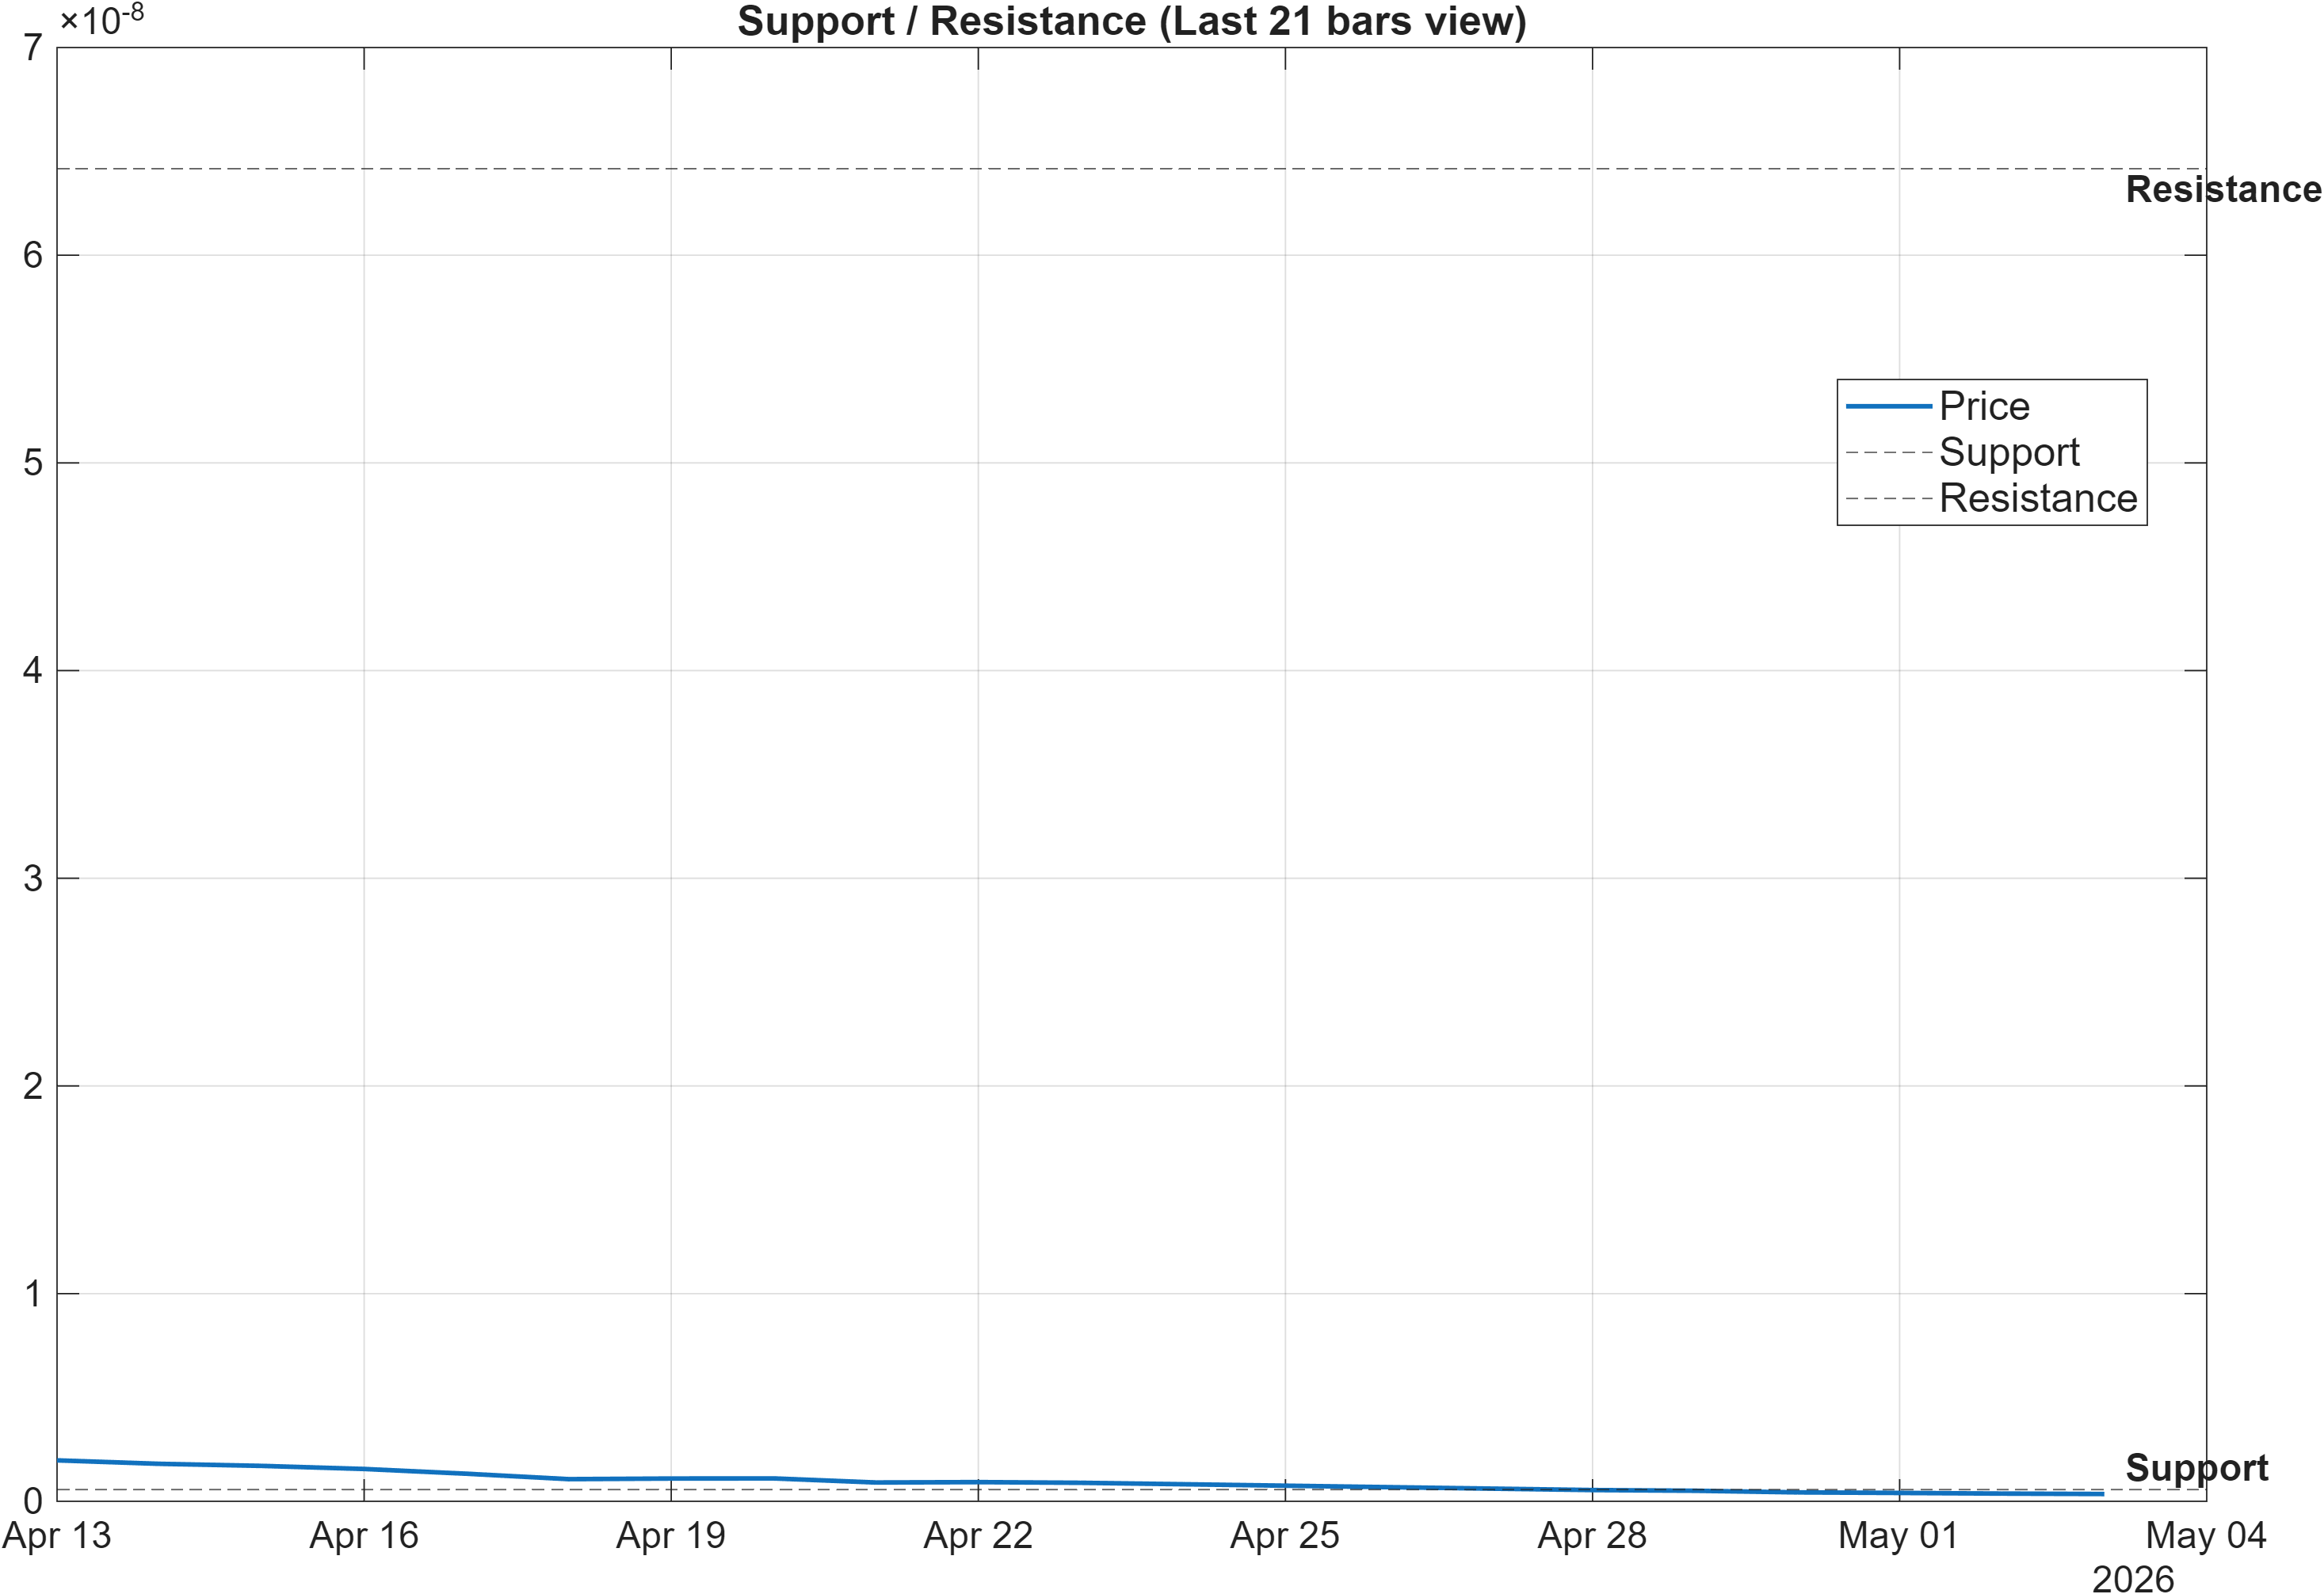
The provided structural zones list Support ~ 0.0000 and Resistance ~ 0.0000. With both levels printed at the same rounded value, the practical takeaway is less about the absolute number and more about process: treating the nearby area as a decision band where confirmation should be sought from volume, trend filters, and momentum alignment rather than from the level alone.
The scenario guidance is explicit: break above resistance with volume → continuation, while a close below support → signal deterioration risk. Because the moving-average state is bearish (Close vs MA50 and MA50 vs MA200 both bearish), a resistance break that lacks volume confirmation can be more vulnerable to failure, especially in a volatility regime with bandwidth at 1.9713. Conversely, a hold above resistance that is accompanied by improving oscillator behavior (for example, RSI shifting away from a bearish bias and MACD histogram sustaining above the flatline rather than returning to 0.0000) would represent a clearer cross-confirmation event.
This section also acts as a bridge between ranks and technicals. A strong longer-horizon rank (e.g., Monthly #5) is most useful when the market is approaching a zone where continuation can be validated. If price instead breaks down—“close below support”—the interpretation suggests increased deterioration risk, which would be consistent with the weak tail positioning shown by the AI technical rank in Section 5 (#721 of 799). Given the rounding of the published levels, readers should prioritize the directional behavior around the zone and the confirmation tools already provided in the report, rather than assuming precision in the printed supports/resistances.
5) Quant Technical Dashboard (18 Signals)
KGNAI AI Technical Analysis Score (Deep Reinforcement Learning): Rank #721 out of 799 (Rank 1 represents the strongest technical positioning and a higher probability of favorable price behavior. As ranks increase toward the maximum, the probability of favorable outcomes weakens and bearish positioning becomes more dominant.) | Label: Bearish | Score: -0.805
18-Signal Technical Confluence Score: 0.000 (Neutral)
Overall Technical Score (18-signal confluence + DRL rank blend): -0.241 (Neutral)
Note: The blended score reflects signal strength weighted against broader AI technical ranking, which may temporarily diverge.
Blended technical score breakdown: -0.241 (Neutral | Bull 8 / Bear 8 / Neutral 2)
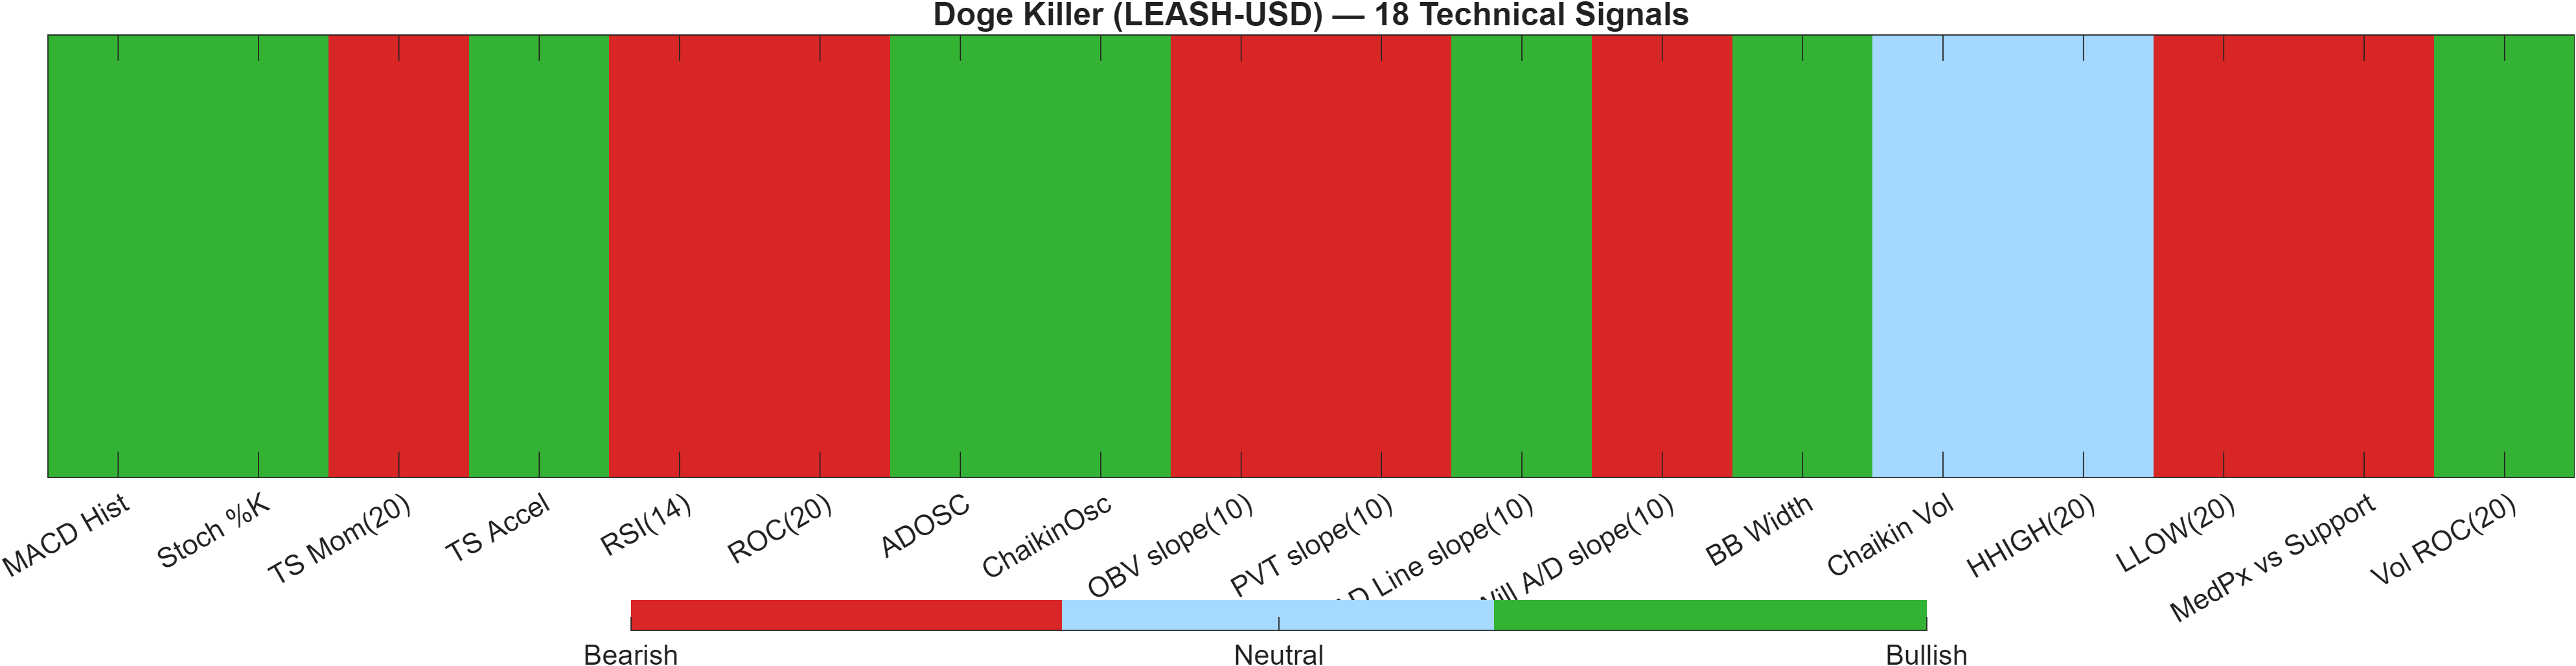
The technical dashboard is best read as an alignment vs divergence exercise across independent signal families. On one hand, the 18-signal confluence score is 0.000 (Neutral) with a perfectly balanced split (Bull 8 / Bear 8 / Neutral 2), indicating no dominant technical “vote.” On the other hand, the Deep Reinforcement Learning layer flags a substantially weaker posture: DRL technical rank #721 out of 799 with a Bearish label and score -0.805. The combined outcome lands at -0.241 (Neutral), which mathematically reflects that the DRL model is pulling down an otherwise evenly split indicator stack.
This kind of configuration often occurs when classical indicators are internally offsetting—some hinting at stabilization or short-covering, others consistent with persistent downtrend mechanics—while the broader pattern-recognition model continues to recognize weak technical conditions in the cross-sectional context. In other words, neutral confluence does not equal “low risk”; it can also mean high disagreement, which tends to reduce signal reliability and increase the importance of levels (Section 4) and regime cues (Sections 2–3).
Signal table (Bull/Bear/Neutral)
| Indicator | Value | Signal |
|---|---|---|
| MACD Hist | 7.872e-07 | Bullish |
| Stoch %K | 3.104 | Bullish |
| TS Mom(20) | -1.433e-09 | Bearish |
| TS Accel | 7.747e-09 | Bullish |
| RSI(14) | 3.104 | Bearish |
| ROC(20) | -80.54 | Bearish |
| ADOSC | 83.62 | Bullish |
| ChaikinOsc | 1710 | Bullish |
| OBV slope(10) | -6.367e+04 | Bearish |
| PVT slope(10) | -5840 | Bearish |
| AD Line slope(10) | 1710 | Bullish |
| Will A/D slope(10) | -5.475e-10 | Bearish |
| BB Width | 1.971 | Bullish |
| Chaikin Vol | -61.9 | Neutral |
| HHIGH(20) | 1.852e-09 | Neutral |
| LLOW(20) | 3.544e-10 | Bearish |
| MedPx vs Support | -2.015e-10 | Bearish |
| Vol ROC(20) | 336.6 | Bullish |
Within that split, selected values illustrate the cross-currents: the signal table shows ROC(20) at -80.54 (Bearish) and RSI(14) at 3.104 (Bearish), both consistent with stressed momentum conditions, while Vol ROC(20) at 336.6 (Bullish) and a bullish BB Width (1.971) indicate activity/volatility dynamics that can accompany sharp counter-moves. The neutral confluence score (0.000) is therefore less a “no signal” state and more a description of offsetting forces—a backdrop where validation through price-level behavior becomes the higher-confidence filter.
6) News sentiment + extractive gist
Note: Some headlines were matched using a looser (title-only) rule to avoid missing relevant coverage.
Sentiment score (avg): 0.000 | Positive: 0% | Neutral: 100% | Negative: 0%
KGNAI AI News Sentiment Score (normalized -1 to +1): Not available (as of —) | Label: Not available | Overall news score: 0.00
Positive Developments
Recent coverage across major financial outlets is largely descriptive and ecosystem-oriented, with limited asset-specific catalysts identified in the provided data. The qualitative tone tilts constructive in the sense that it highlights continued operational and payments-related integrations in the broader crypto rails landscape, which can improve perceived utility and user access over time. However, the measurable output in this report remains neutral: the sentiment average is 0.000 with 0% positive and 100% neutral, indicating that whatever constructive framing exists has not been scored as incremental positivity by the sentiment classifier. For LEASH-USD, that means the news backdrop functions more as a contextual tailwind for the asset class rather than a direct driver. With technicals showing a neutral blended score (-0.241) and bearish trend filters, constructive-but-not-positive news flow tends to matter most when price confirms via a clean break/hold at resistance rather than as a standalone signal.
Neutral / Mixed Developments
The news dataset provided is effectively one-tone—entirely neutral by classification—so the dominant takeaway is absence of differentiated narrative pressure rather than a balanced mix of competing headlines. That can be stabilizing in the short run, but it also removes a common catalyst channel that sometimes helps resolve technical indecision. With MACD histogram at 0.0000 and a 0.000 confluence score, LEASH-USD already sits in a technically “undecided” state at the indicator-aggregation level. Neutral news flow typically leaves resolution to market structure variables: volatility regime (bandwidth 1.9713), liquidity/volume confirmation, and whether the asset can improve its bearish moving-average posture. In short, news is not providing a directional bias in the supplied data; it mainly reduces the risk of headline-driven whipsaws while keeping the focus on charts and ranks.
Negative / Risk Signals
No explicitly negative sentiment is registered in the provided data (0% negative), and the normalized KGNAI news sentiment score is Not available in the provided data. Even so, risk is not absent: the more relevant “risk signal” is informational opacity—a neutral-only sentiment profile can occur when coverage is thin, repetitive, or not directly tied to the instrument, which limits the usefulness of sentiment as a confirmatory layer. In addition, the technical stack already contains risk-leaning elements independent of news, including the bearish RSI bias and a weak AI technical posture (DRL rank #721, score -0.805). When sentiment is neutral and non-discriminating, technical deterioration (for example, a close below support) can dominate the decision framework because there is little countervailing narrative support. Monitoring should therefore emphasize confirmation through volume and structure rather than expecting headlines to resolve the setup.
- What to monitor next: Whether price can break and hold above resistance with volume (scenario continuation condition).
- What to monitor next: Whether bearish trend filters (Close vs MA50; MA50 vs MA200) begin to repair alongside momentum stabilization.
- What to monitor next: Any shift away from the neutral-only sentiment profile (avg 0.000; 100% neutral) that could add directional context.
Sources referenced: Reuters, Bloomberg, Yahoo Finance, MarketWatch, Investing.com
Snapshot: AI Rank (Short–Mid–Long): Mixed (Bullish tilt) (Neutral–Bullish–Bullish) · Technical Confluence: Neutral · Key Levels: Support ~0.00 | Resistance ~0.00 · News Sentiment: Neutral
7) Sources
- Crypto.com Pay Ignites a New Era in South Korea as KG Inicis Unleashes Nationwide Payments Integration, Transforming Tourist Spending Through Seamless Digital Asset Adoption - Travel And Tour World — https://news.google.com/rss/articles/CBMiwwJBVV95cUxOU2Z3T0NrUk1YTm05cjZZTXVQUXpkT2lvR2xjTC1rcTdJMUFNUzVENlFxdklQRWcxbWdkampJMFZkX1paVDVRVmpPbzZHcEozTW5Cekg0YkZOc2lmSjAxRUhEYzRUSTN0SmlpQlVpQk9xTFhxMlFiWHZPTFZGVnl6b0tFVl9JOS1VR2FBMDFacm9qR0VoZVNZM053UC1yVTNDcm1GSFd3VzhBaWpGU05KdXdERG1KZkJWc1ZUbnE5X1czbzl4dWlSUk9iWHJXaHNrb1RYUVZmTFpNMkZaODlNcFZsejhPbDQ5WVl2QzJOZXpQUHdGeU1SdUROeWhxSjZ5a3dENkpaM1FSQjRydUtDMWRlUjk0MDltNG05MWNhZzZ2R3VwRDIzbDRfbzNhRXBzX0s3OWQ4Y2Q0U2NBZVVmQXQ5OA?oc=5
You may also like: How KGNAI AI ranks instruments across global markets
Disclaimer: KGNAI provides AI-generated analytics and educational market commentary only. This is not financial advice. Markets involve risk. Always do your own research.