
Zephyr Protocol (ZEPH28492-USD) Technical Analysis — 29-Apr-2026 | Neutral ranks, bearish technical confluence
Zephyr Protocol (ZEPH28492-USD) screens as a mixed regime across KGNAI horizons as of 29-Apr-2026: the short-term rank is weak while weekly and monthly positioning stabilizes in neutral territory. Price structure remains pressured versus key moving averages, and the blended technical read is bearish, suggesting that any rebound attempts still require confirmation rather than assumption. Momentum is not strongly oversold by RSI, but several rate-of-change and volume-derived measures lean negative, consistent with muted follow-through. Volatility conditions are not extreme, with Bollinger bandwidth at 0.1914, implying the market may be oscillating within defined decision zones rather than trending cleanly. The actionable framework centers on probabilistic levels: support near 0.3586 as the near-term invalidation area and resistance near 0.5074 as the primary confirmation threshold for sustained recovery.
- Rank stance (Short / Mid / Long): Short Bearish | Mid Neutral | Long Neutral
- Technical confluence: Bearish (18-signal confluence -0.389; blended technical score -0.538)
- Key levels: Support ~ 0.3586 | Resistance ~ 0.5074
- News sentiment bias: Neutral (avg -0.037; 88% neutral, 12% negative)
- Confirmation / invalidation: A sustained push above 0.5074 with participation supports continuation; a close below 0.3586 increases deterioration risk.
KGNAI evaluates assets using large cross-sectional datasets built from millions of structured data points. Inputs incorporate fundamental metrics, technical structures, and systematically processed news sentiment. Statistical models, machine learning, and AI frameworks are used to assess relative positioning, signal alignment, and probabilistic behavior across broad universes.
- Ranks are comparative across the tracked universe, not absolute price targets.
- Confluence reflects alignment among independent signal groups.
- Support/resistance levels are probabilistic decision zones, not guarantees.
- Sentiment provides contextual bias within the broader analytical framework.
1) KGNAI AI Analysis
Region: CRYPTO
Total universe size: 800 ranked instruments
- Daily rank: #641 out of 800 — Bearish
- Weekly rank: #610 out of 800 — Neutral
- Monthly rank: #630 out of 800 — Neutral
- 3-Monthly rank: Not available for this horizon — Not available
Cross-sectional ranks place ZEPH28492-USD in the lower third of the universe on a daily basis (rank #641 out of 800), while the weekly and monthly ranks (#610 and #630) are closer to the boundary between weak-neutral and weak-bearish regimes. That profile typically signals fragile stabilization: the instrument is not demonstrating broad leadership, yet the medium-term ranking drift is not accelerating lower.
The absence of a 3-month rank is a practical constraint for regime classification. Without that horizon, the report leans more heavily on the agreement (or disagreement) between the short-term rank and the technical dashboards. Here, the near-term rank is clearly weak, which raises the bar for interpreting any single-session rebound as durable.
The term view provided by KGNAI remains Short-term: Bearish, Mid-term: Neutral, Long-term: Neutral. In institutional terms, this resembles a market that has not earned sustained risk-on treatment, but also has not deteriorated enough in the medium horizons to justify treating every bounce as a pure mean-reversion fade. The analytical focus shifts to confirmation at resistance and protection around support rather than forecasting a directional path.
Framework reminder: lower rank numbers indicate stronger probability of favorable performance behavior; higher ranks indicate weaker probability and more bearish positioning.
2) Price & trend overview
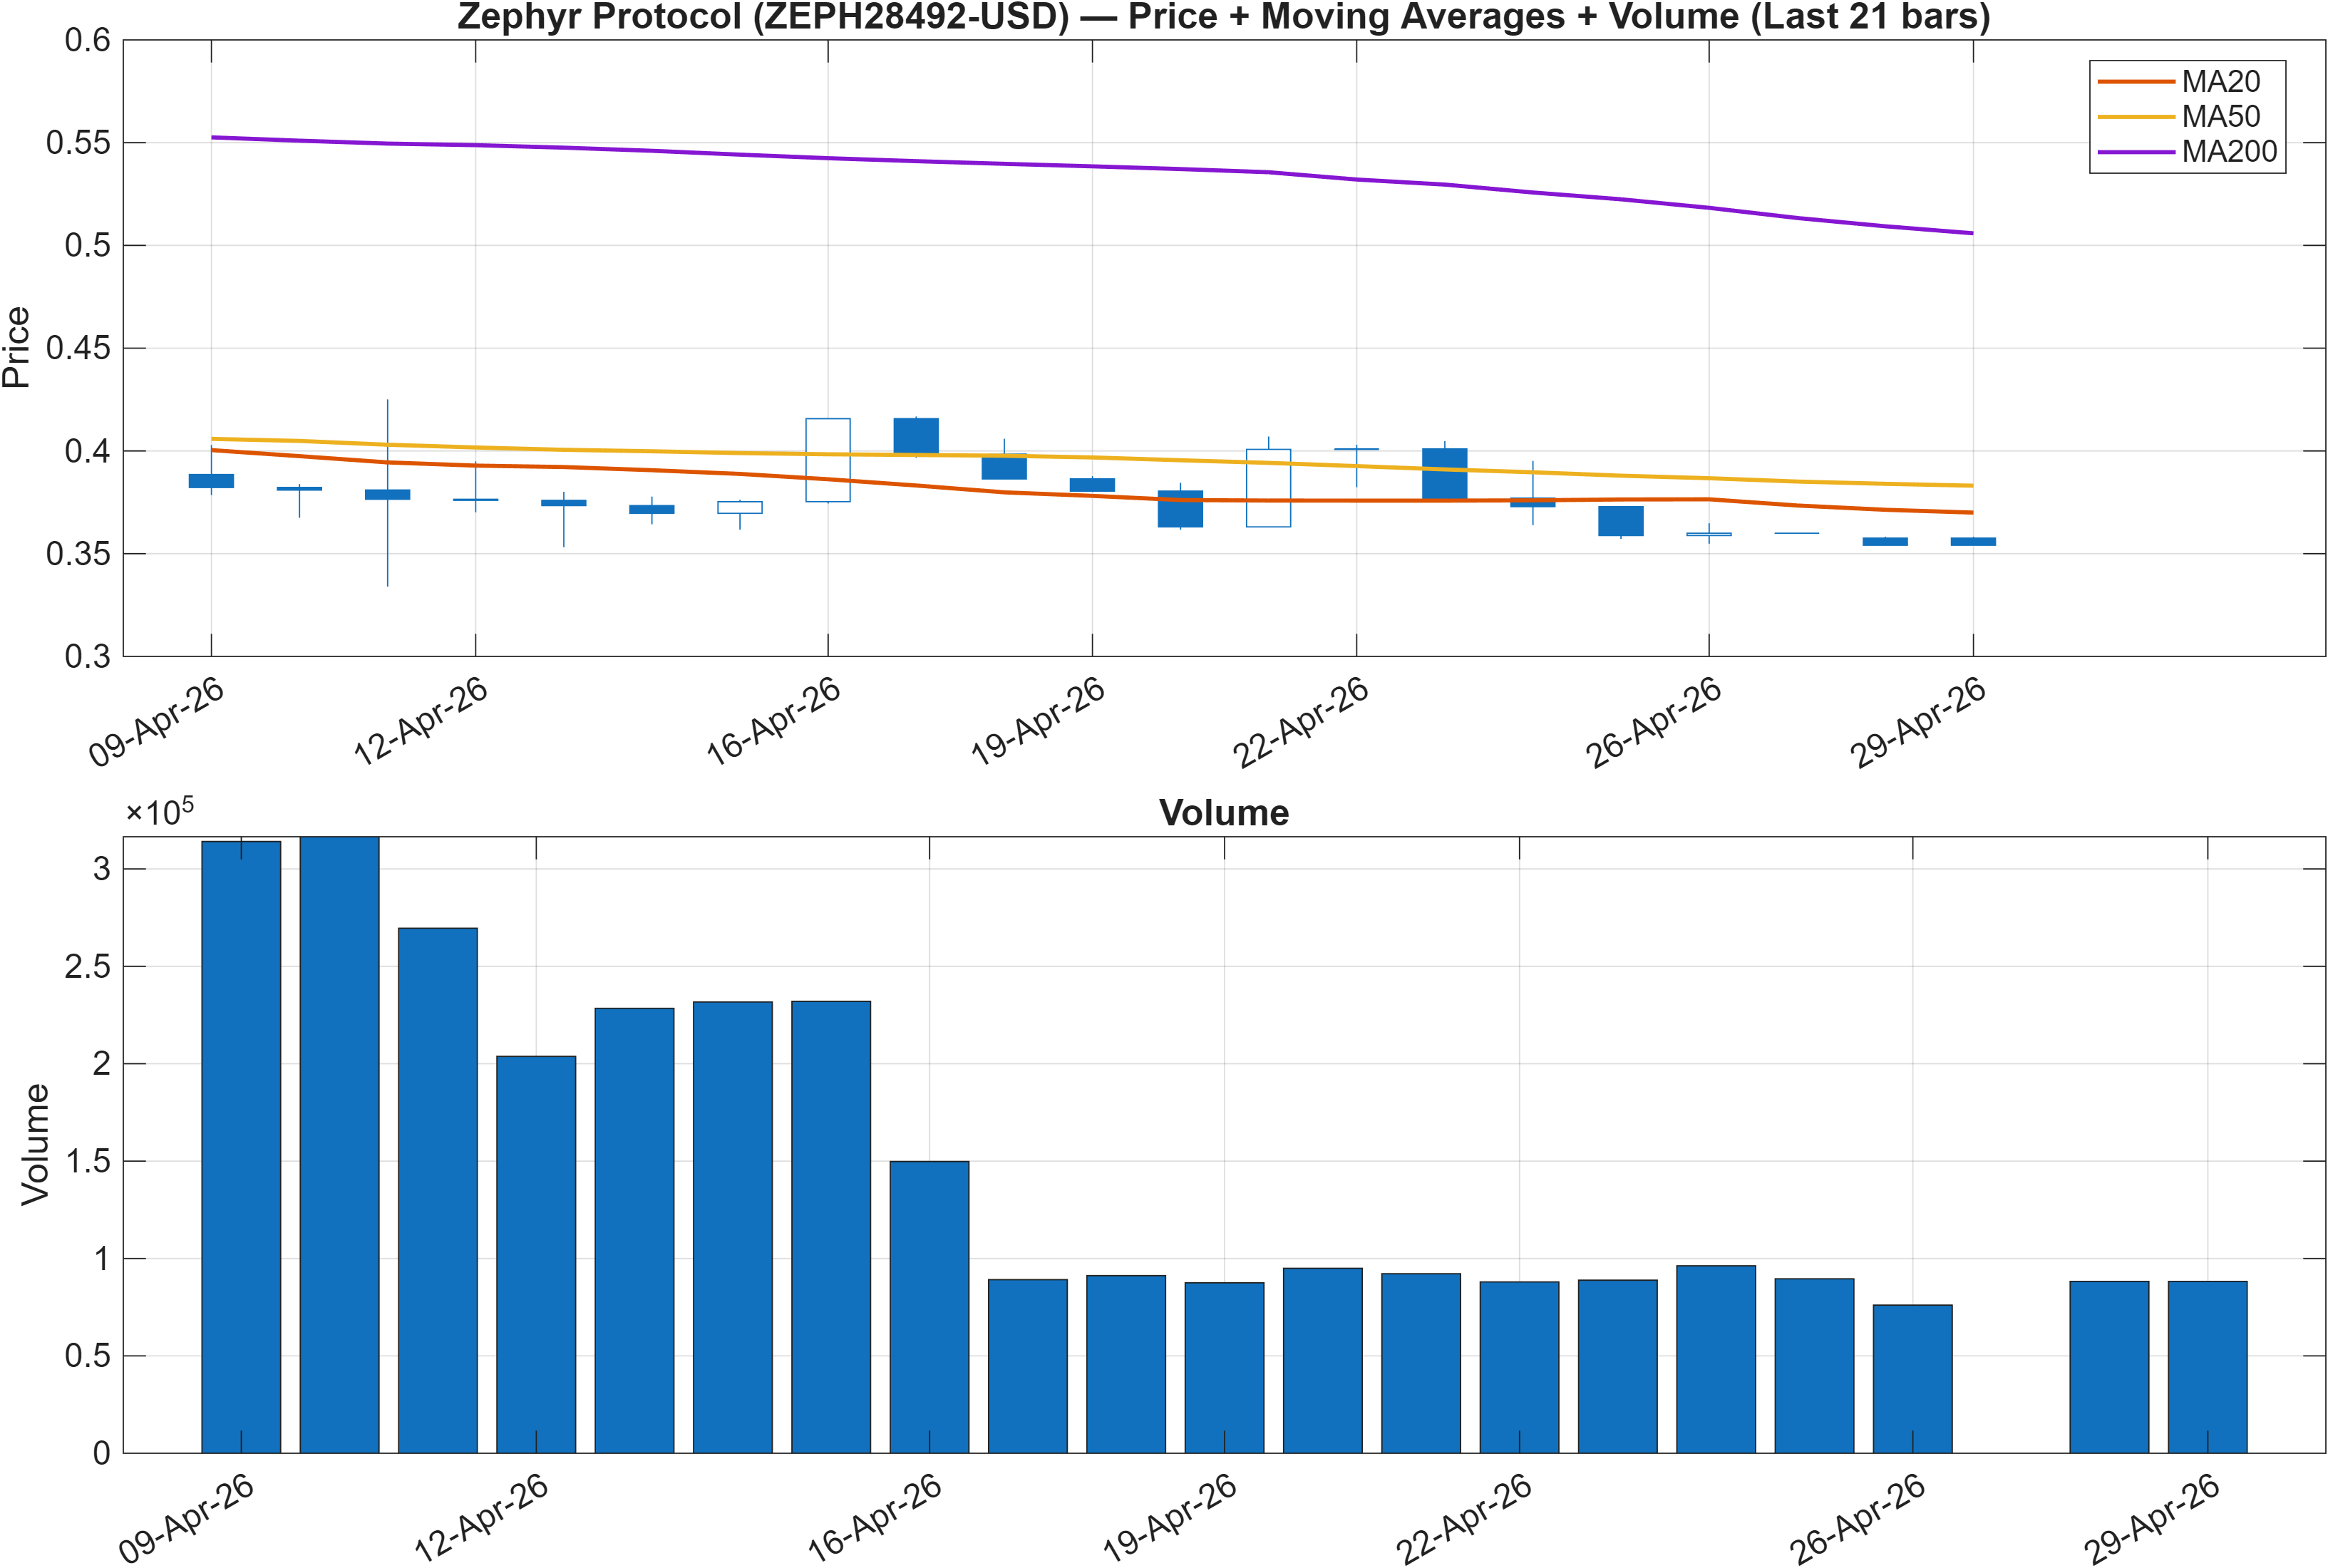
Trend structure remains defined by a double bearish moving-average condition: the close is below the MA50 and the MA50 is below the MA200. In practice, this configuration tends to shift the burden of proof onto bulls, because recoveries often face overhead supply from trend-following participants who use the MA50 as a risk reference. A single upswing can still occur, but it is less likely to transition into a durable trend unless it is accompanied by sustained closes back above intermediate averages.
This trend read aligns with the weak short-term rank (#641) and the bearish blended technical score (-0.538) discussed later. The more interesting nuance is that weekly and monthly ranks are Neutral, suggesting the selloff may be less impulsive than the moving-average stack implies. That mix can occur in range-like markets where the longer-term distribution is not collapsing, but the shorter-term tape stays heavy.
From a market-structure standpoint, the key question is whether price action is compressing toward a decision or simply drifting within a weak trend channel. The report’s explicit decision zones—support at 0.3586 and resistance at 0.5074—serve as the cleanest way to evaluate that. Until price demonstrates acceptance above resistance, the moving-average regime argues for treating rallies as unproven and managing exposure with tight conditional logic.
Interpretation: Close vs MA50 = Bearish, MA50 vs MA200 = Bearish.
3) Momentum & volatility dashboard
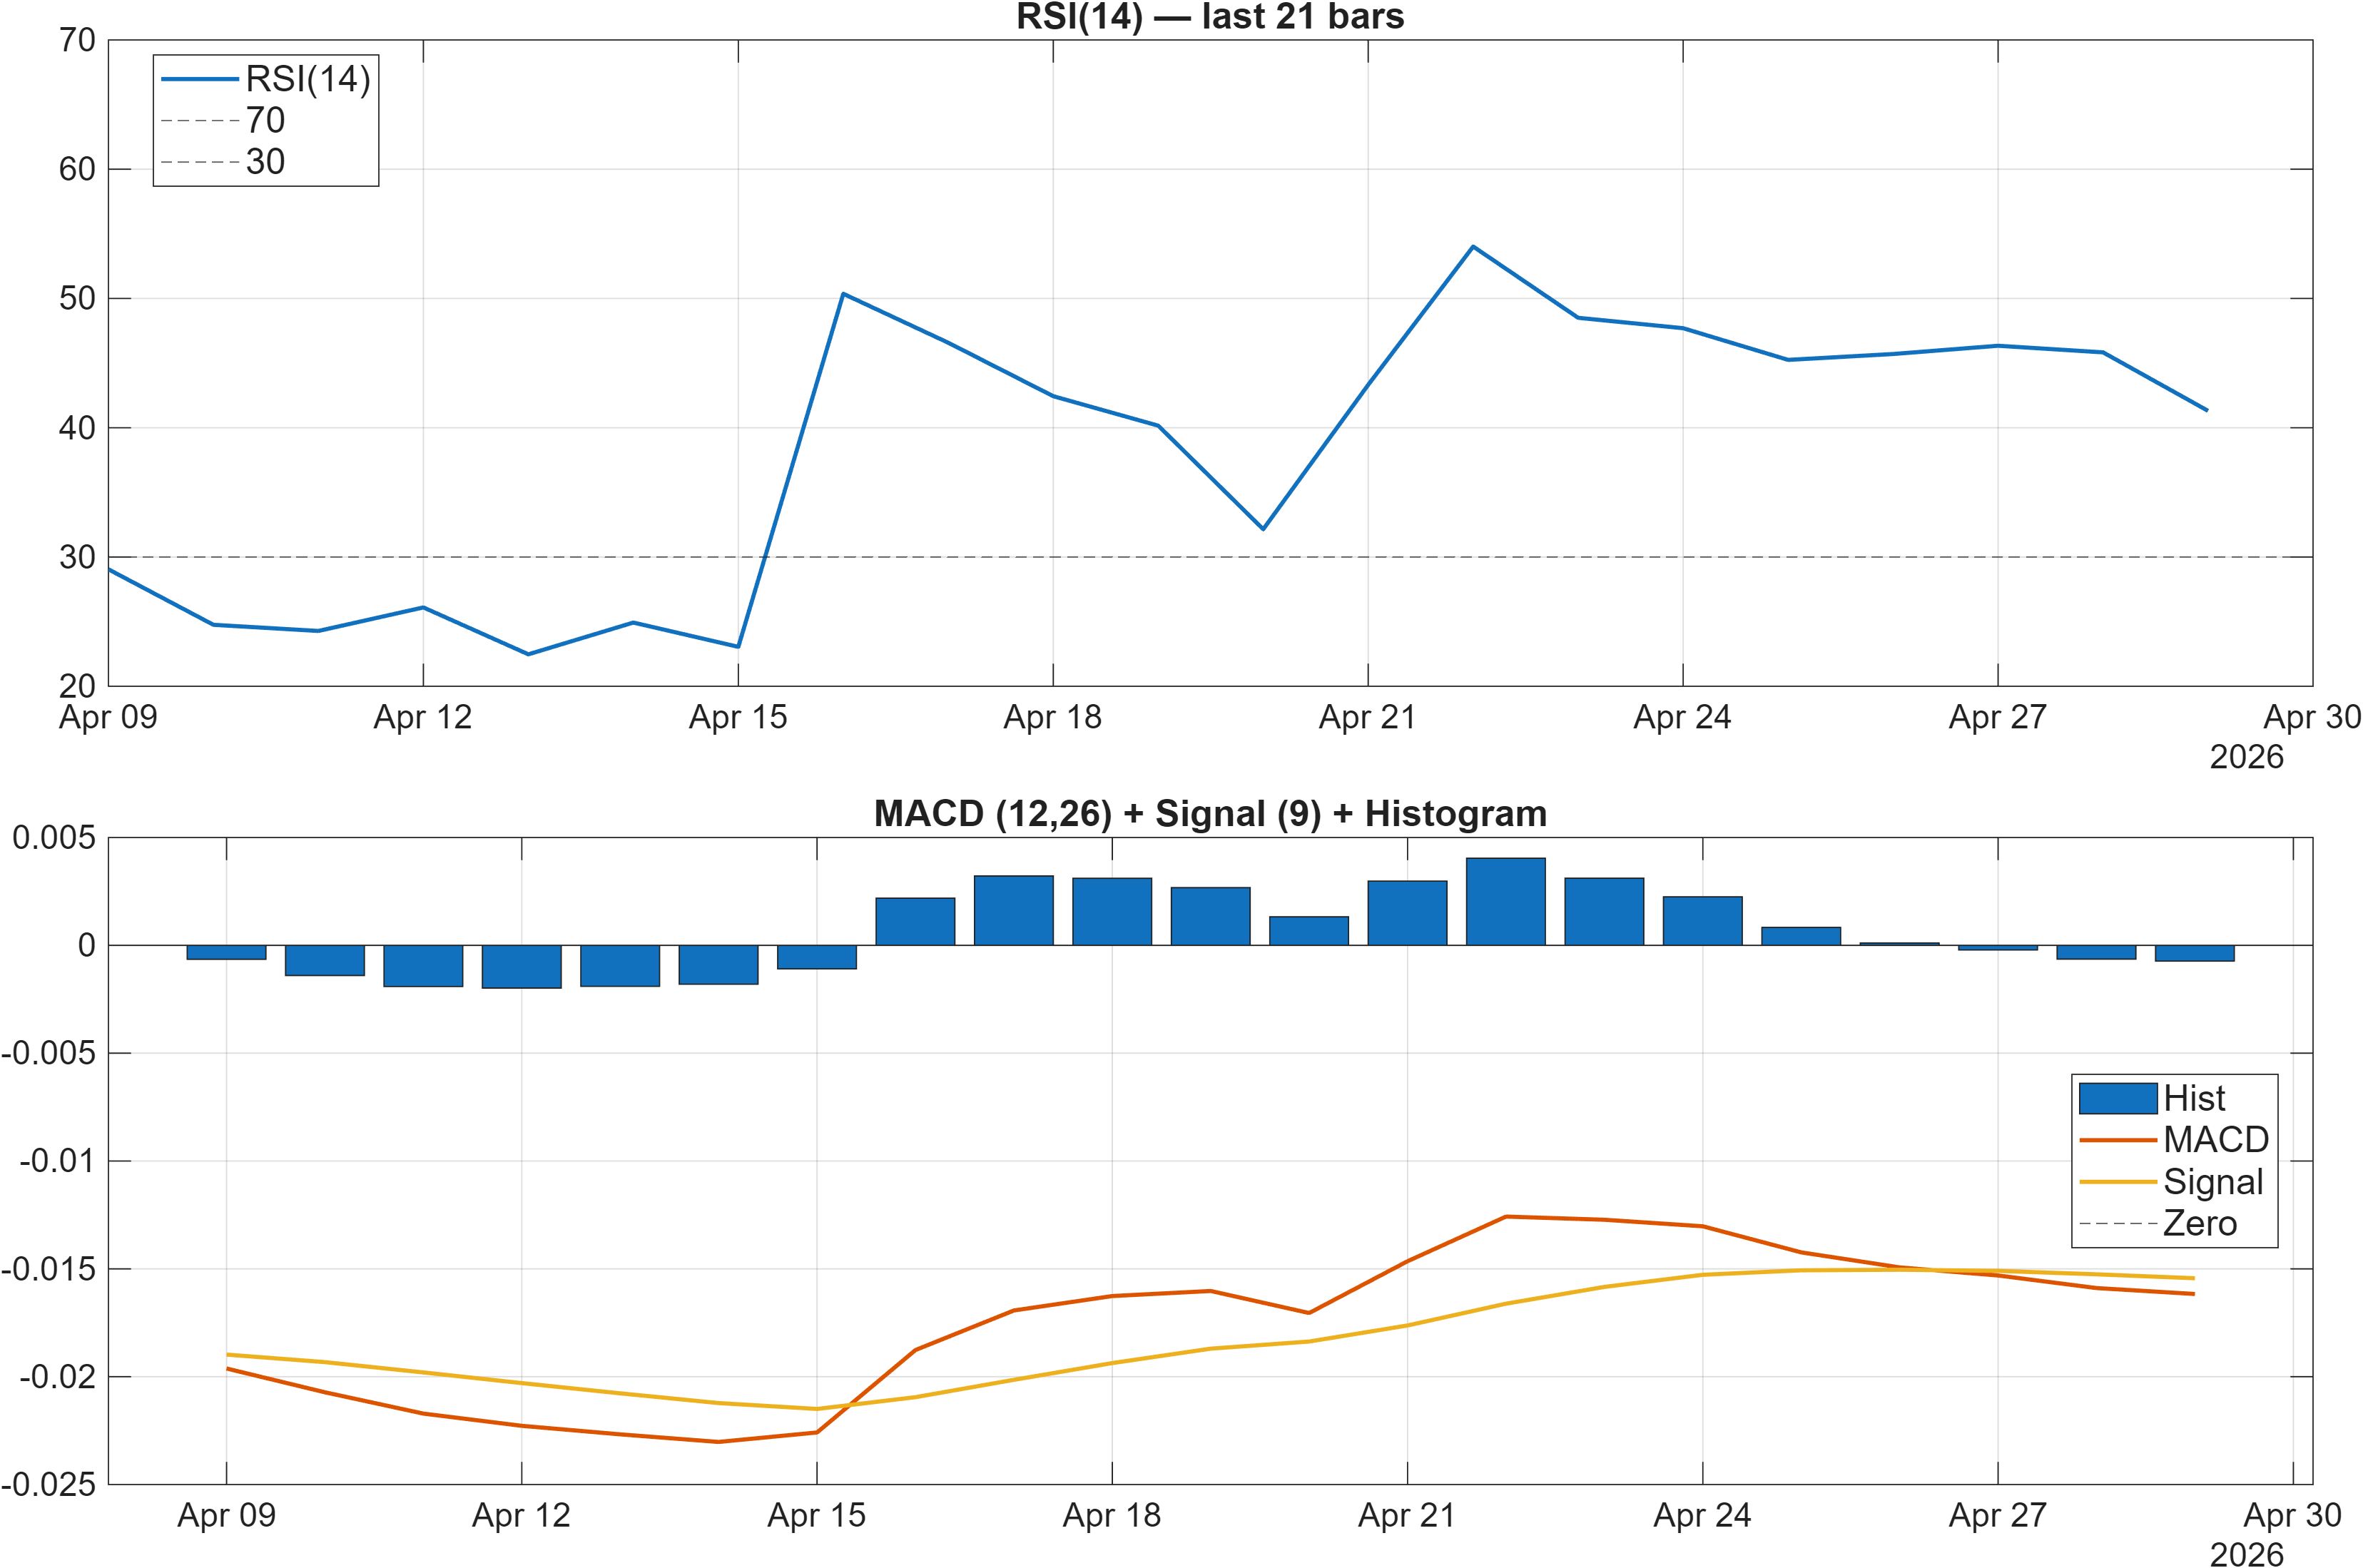
Momentum signals show limited evidence of reversal strength. RSI is flagged as neutral in the dashboard, but the signal table classifies RSI(14) at 41.31 as bearish—consistent with a market that is not deeply oversold, yet still below the typical midline levels associated with sustained upside pressure. This is a “weak momentum” profile: downside has not exhausted enough to force a mechanical snapback, but upside has not rebuilt enough to earn trend-following demand.
MACD reinforces that cautious stance. The MACD histogram is negative (dashboard: -0.0007; table: -0.0007306), which generally reflects downside momentum persistence or at least a lack of positive acceleration. Meanwhile, time-series momentum remains soft with TS Mom(20) at -0.02684 and ROC(20) at -10.27, both consistent with an asset that has been losing altitude over the lookback window rather than building a higher-low sequence.
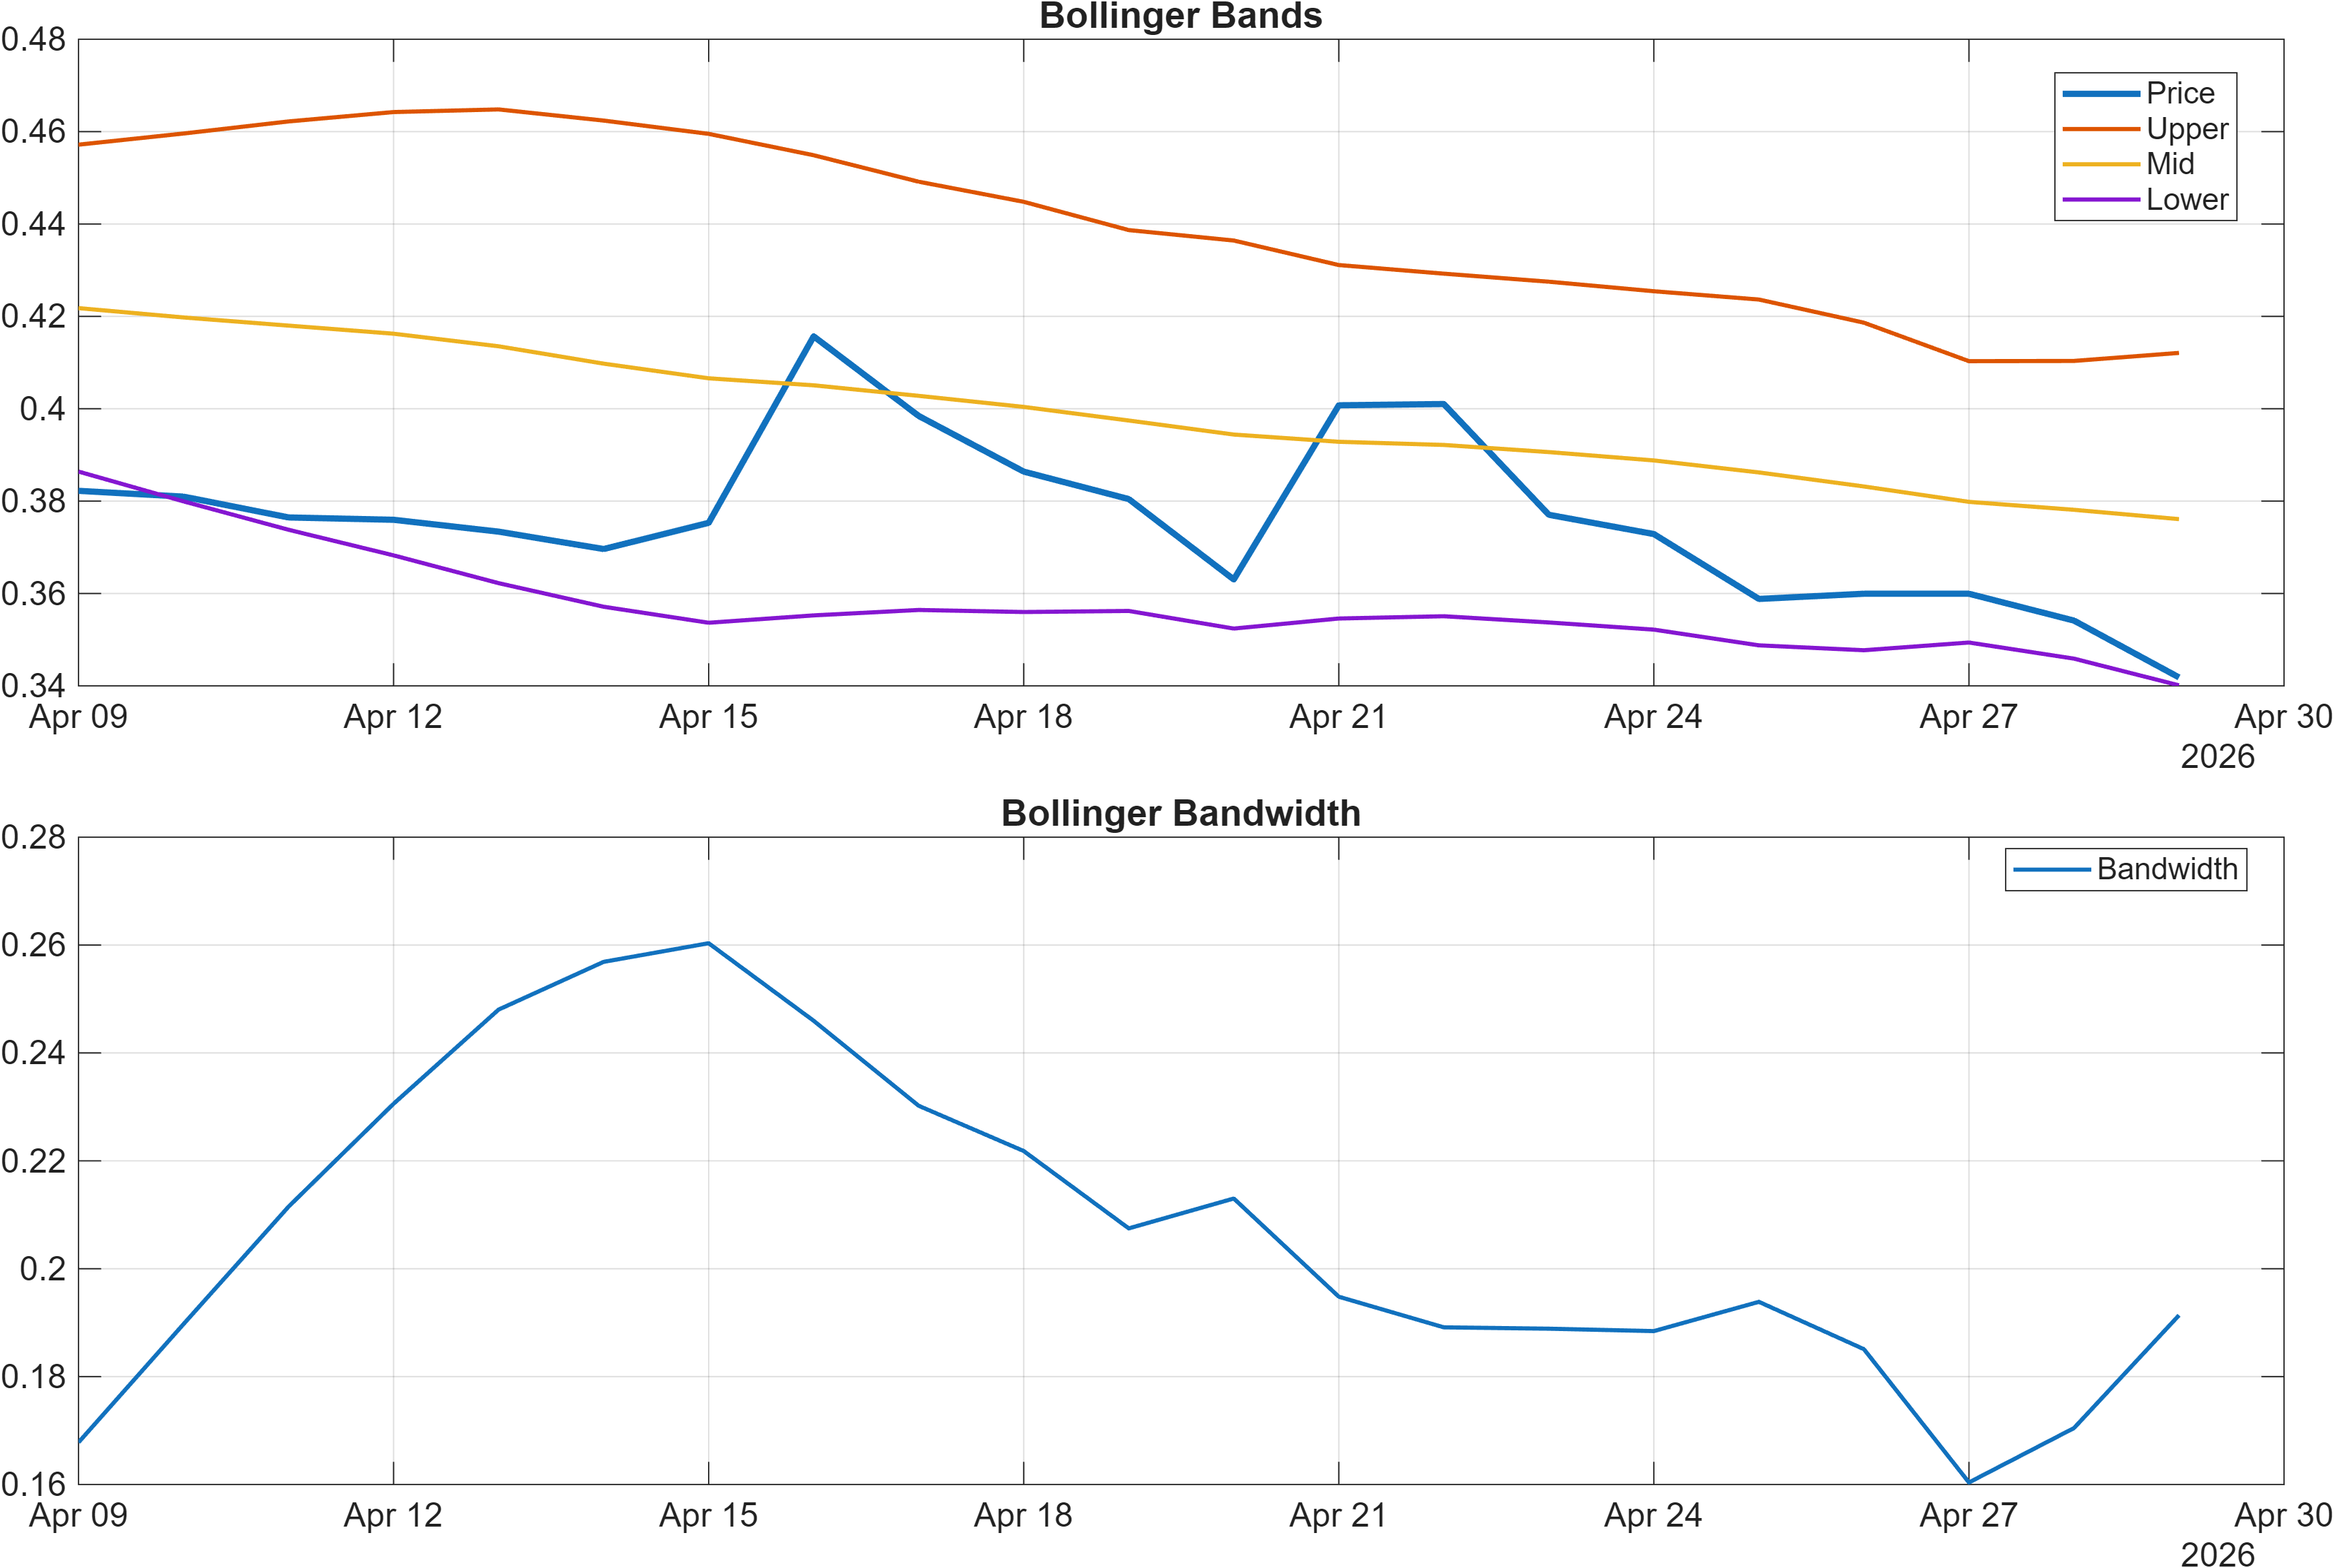
Volatility sits in a workable but not extreme regime: Bollinger bandwidth is 0.1914. That level does not, by itself, imply either imminent expansion or contraction, but it does support the idea that breakouts require validation. When volatility is moderate, false breaks can be common, making the support/resistance framework more useful than momentum oscillators alone. The practical takeaway is to watch for a momentum “flip” (MACD improving and RSI recovering) that occurs at or after a structural confirmation, not before it.
Interpretation: RSI bias = Neutral, MACD hist = -0.0007.
Interpretation: Bandwidth (volatility regime) latest = 0.1914.
4) Support / Resistance zones
Support ~ 0.3586 | Resistance ~ 0.5074
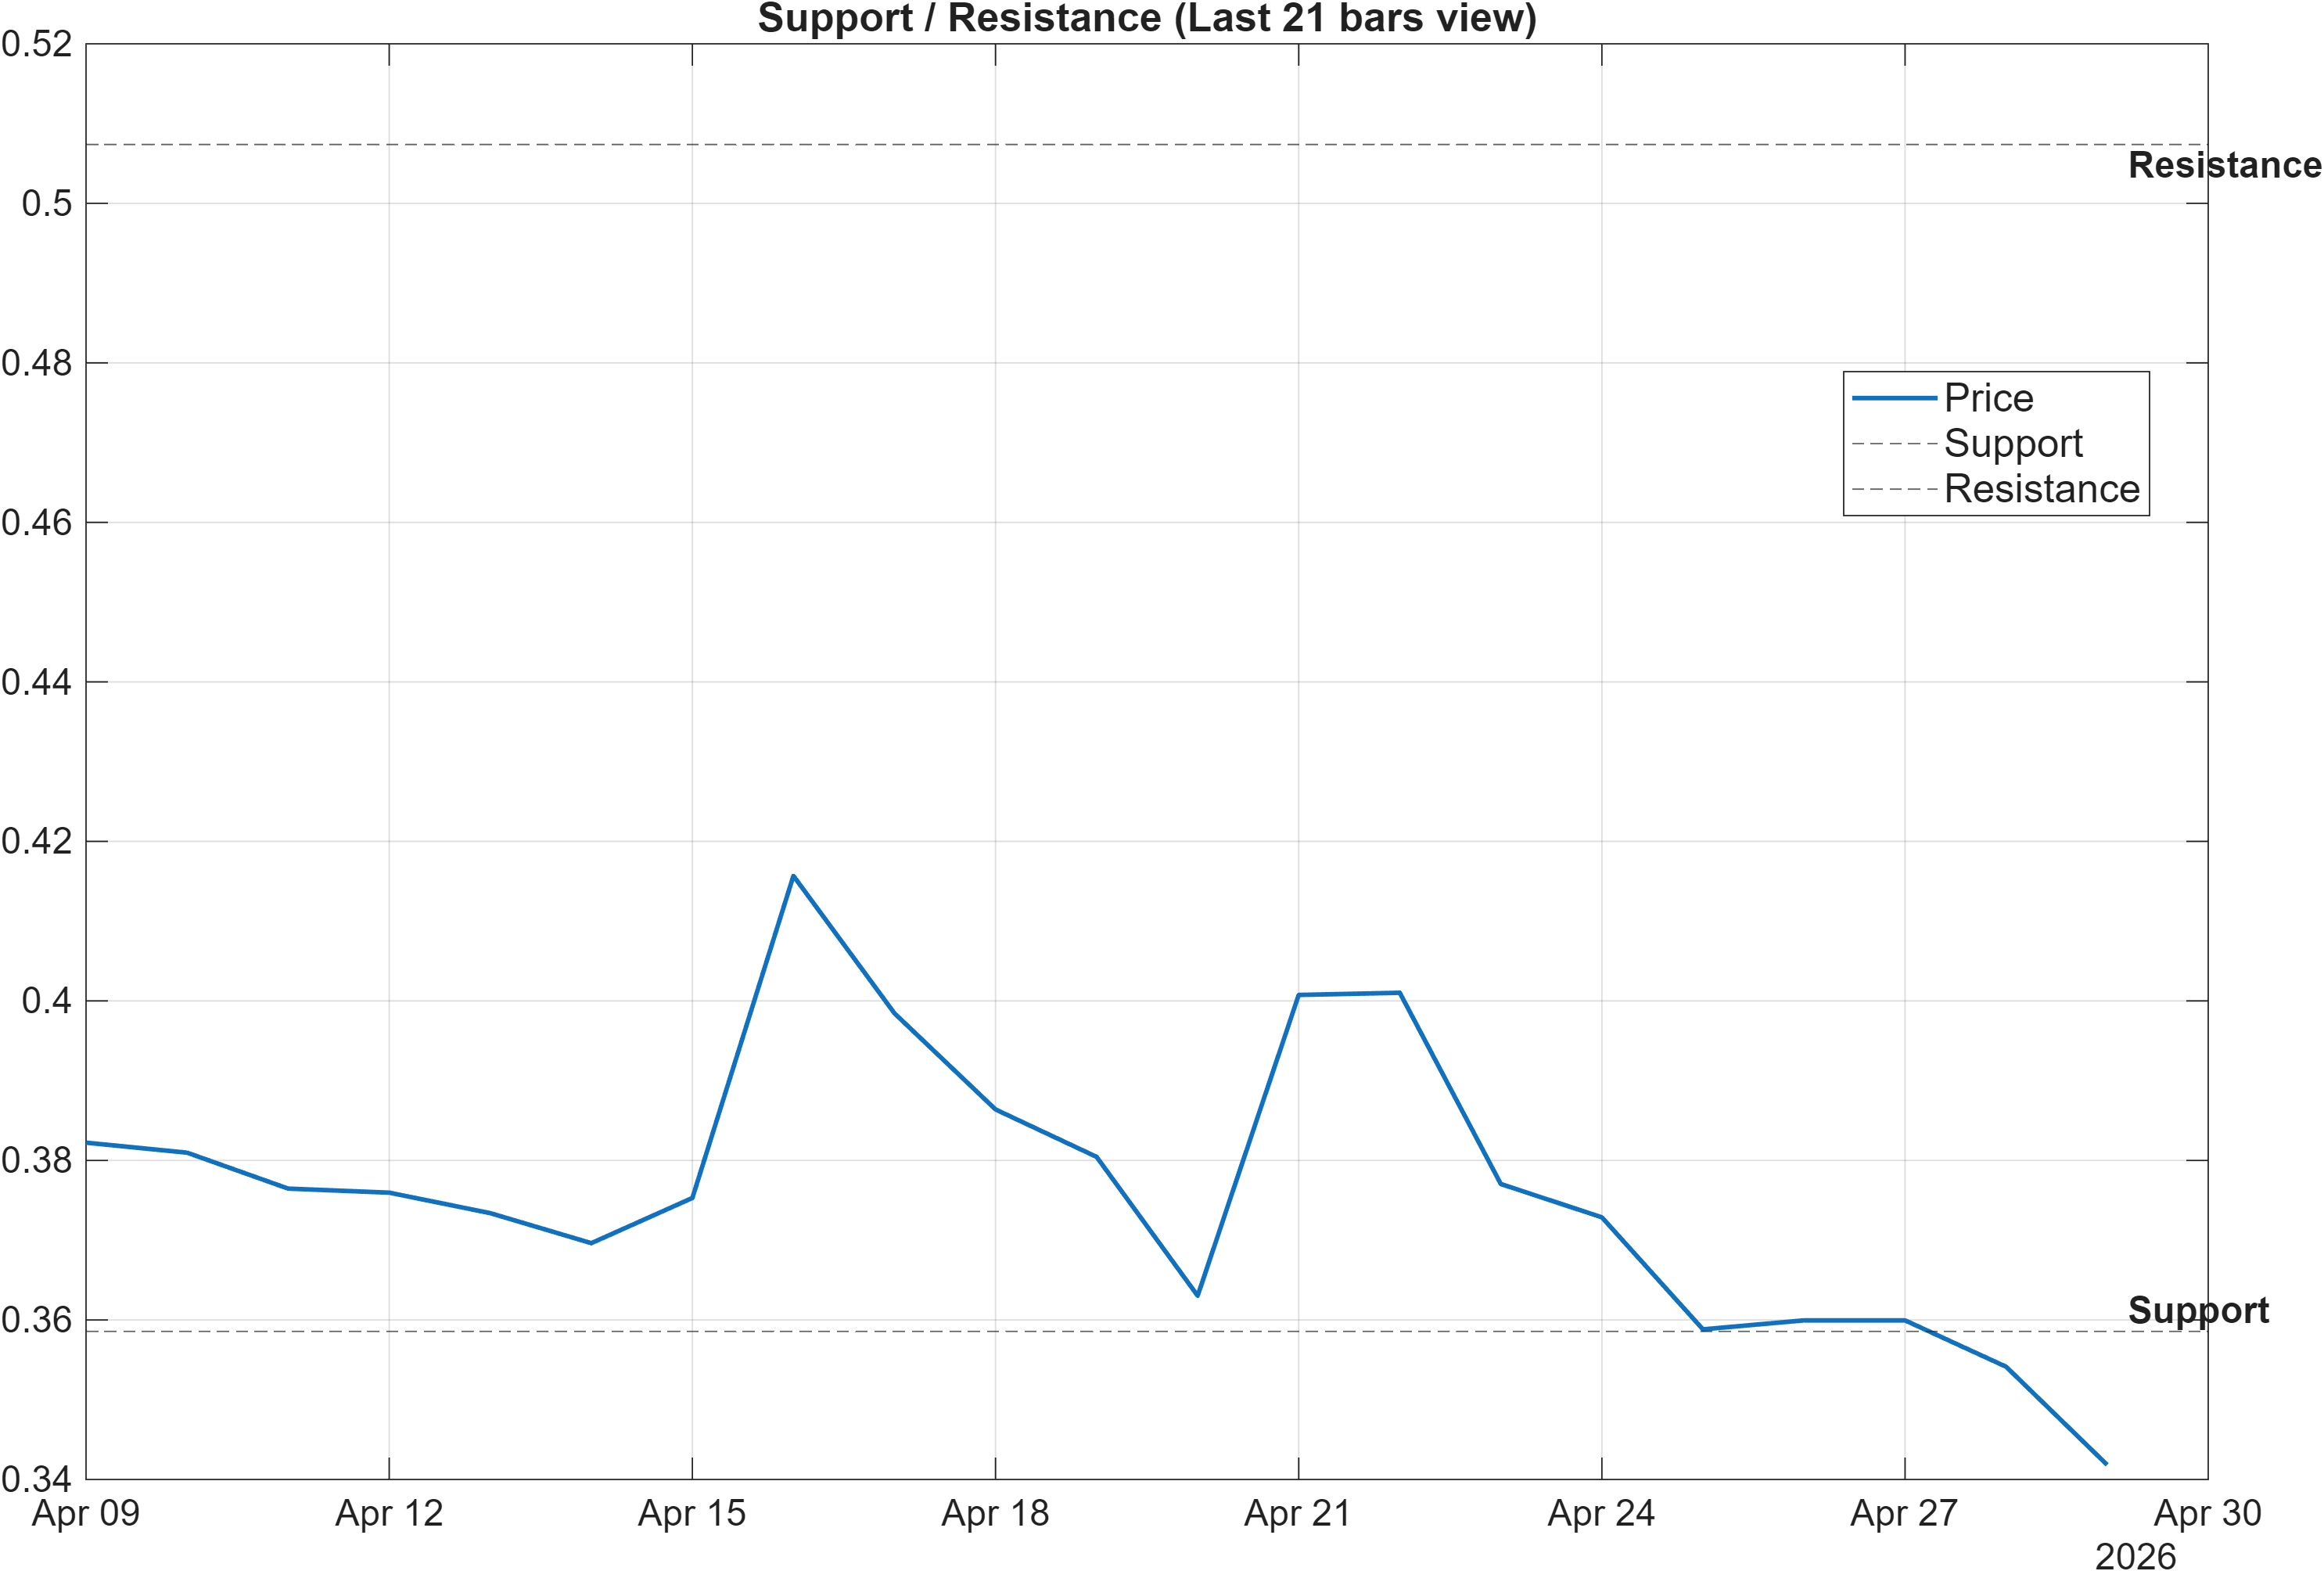
The current setup is best framed as a two-zone decision market. Support at 0.3586 is the primary level where risk typically shifts from “managed drawdown” to “regime deterioration,” particularly given the broader bearish trend filter (close below MA50; MA50 below MA200). A close below that area would be consistent with the already weak technical posture (DRL technical rank #754; overall technical score -0.538) becoming more firmly embedded.
Resistance at 0.5074 is the more meaningful confirmation threshold. In a bearish moving-average stack, price often needs to do more than tag resistance—it needs to hold above it to change participant behavior. A confirmed break, especially if accompanied by improvement in negative momentum readings (MACD histogram moving off -0.0007 and RSI rising from the low-40s), would be the first evidence that the market is transitioning from a weak tape into a more constructive range or trend.
The scenario language in the base framework is deliberately conditional, and the current indicator mix supports that: volatility is not unusually elevated (bandwidth 0.1914), so it is reasonable to expect price to respect these zones rather than gap through them. That said, multiple volume-derived signals in the technical table are bearish (e.g., Vol ROC(20) at -72.13), which argues for treating any upside probe into resistance as suspect unless participation improves.
Scenario view: Break above resistance with volume → continuation. Close below support → signal deterioration risk.
5) Quant Technical Dashboard (18 Signals)
KGNAI AI Technical Analysis Score (Deep Reinforcement Learning): Rank #754 out of 800 (Rank 1 represents the strongest technical positioning and a higher probability of favorable price behavior. As ranks increase toward the maximum, the probability of favorable outcomes weakens and bearish positioning becomes more dominant.) | Label: Bearish | Score: -0.885
18-Signal Technical Confluence Score: -0.389 (Bearish)
Overall Technical Score (18-signal confluence + DRL rank blend): -0.538 (Bearish)
Note: The blended score reflects signal strength weighted against broader AI technical ranking, which may temporarily diverge.
Blended technical score breakdown: -0.538 (Bearish | Bull 4 / Bear 11 / Neutral 3)
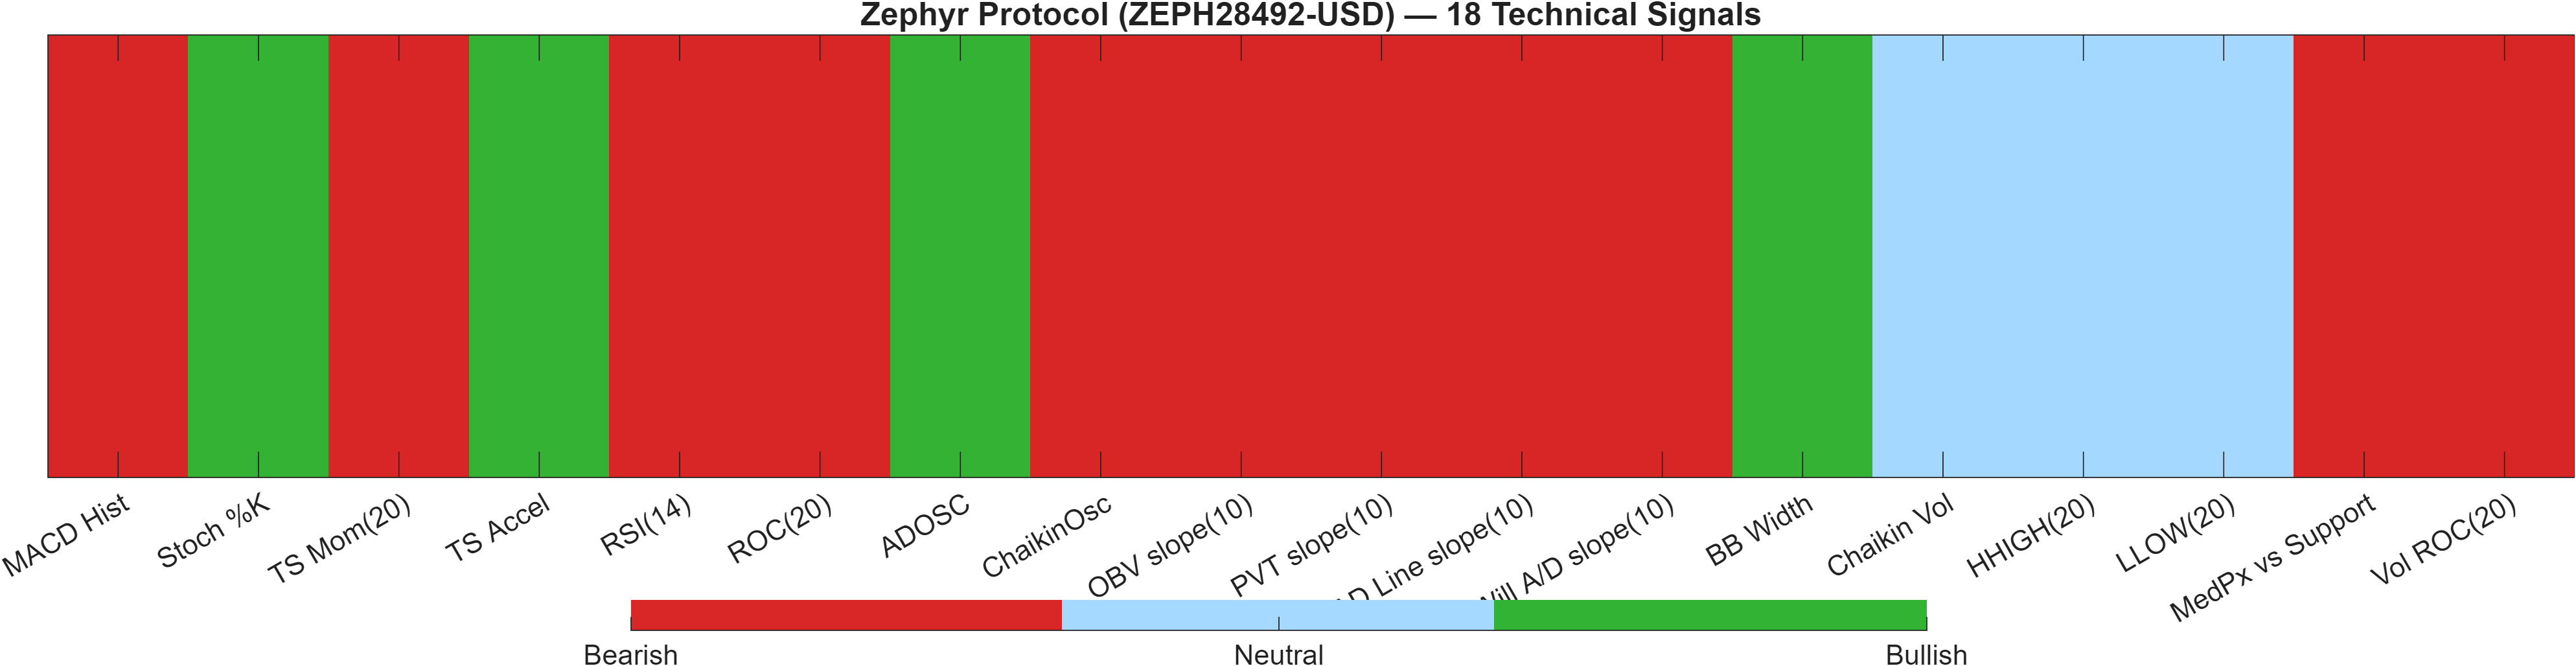
The technical layer is coherently bearish across both the confluence engine and the independent DRL ranking model. The DRL technical rank at #754 (out of 800) places ZEPH28492-USD near the bottom of the universe, and the DRL score of -0.885 indicates weak technical positioning relative to peers. Importantly, the simpler 18-signal confluence score is also bearish at -0.389, reducing the probability that the bearish read is a model artifact.
The blended breakdown shows Bear 11 / Bull 4 / Neutral 3. That skew matters more than any single indicator: it implies breadth of weakness across momentum, trend, and volume families rather than one problematic metric. For example, the table flags RSI(14) at 41.31 as bearish and MACD histogram at -0.0007306 as bearish, aligning with the momentum dashboard. Several participation measures also lean negative (e.g., OBV slope(10) at -2.016e+05), which can limit the durability of upside attempts.
There are, however, small counterpoints that fit a “stabilizing but not reversing” narrative. Stoch %K is 0 and labeled bullish, and TS Accel is 0.00398 and labeled bullish—signals that can appear near inflection attempts. BB Width at 0.1914 is marked bullish in the table, consistent with volatility being available for movement, but volatility alone does not specify direction. Taken together, the dashboard argues that technical confirmation must come from price acceptance above resistance rather than expecting oscillators to lead a durable trend shift.
Signal table (Bull/Bear/Neutral)
| Indicator | Value | Signal |
|---|---|---|
| MACD Hist | -0.0007306 | Bearish |
| Stoch %K | 0 | Bullish |
| TS Mom(20) | -0.02684 | Bearish |
| TS Accel | 0.00398 | Bullish |
| RSI(14) | 41.31 | Bearish |
| ROC(20) | -10.27 | Bearish |
| ADOSC | 8.226 | Bullish |
| ChaikinOsc | -1.243e+05 | Bearish |
| OBV slope(10) | -2.016e+05 | Bearish |
| PVT slope(10) | -5648 | Bearish |
| AD Line slope(10) | -3.214e+05 | Bearish |
| Will A/D slope(10) | -0.02989 | Bearish |
| BB Width | 0.1914 | Bullish |
| Chaikin Vol | -41.23 | Neutral |
| HHIGH(20) | 0.4251 | Neutral |
| LLOW(20) | 0.334 | Neutral |
| MedPx vs Support | -0.002371 | Bearish |
| Vol ROC(20) | -72.13 | Bearish |
Interpretation: Indicator-level signals form the base confluence, which is then adjusted using a separate AI-driven technical ranking model. The final technical score summarizes this combined view.
6) News sentiment + extractive gist
Note: Instrument-specific news matches were not found, so the digest includes broader market/sector headlines. Links are provided for verification.
Sentiment score (avg): -0.037 | Positive: 0% | Neutral: 88% | Negative: 12%
KGNAI AI News Sentiment Score (normalized -1 to +1): Not available (as of —) | Label: Not available | Overall news score: -0.04
Positive Developments
Recent coverage across major financial outlets indicates a constructive undercurrent focused on market plumbing and infrastructure progress rather than immediate price catalysts for smaller tokens. Discussion around settlement-layer improvements and efforts to reduce frictions in tokenized-asset lending highlight ongoing experimentation to address liquidity mismatches and redemption timing, a theme that can gradually improve sector resilience even if it does not translate into near-term price strength. In parallel, attention to spot-market demand signals (such as exchange-specific premium indicators) is being used as a practical gauge for whether dips are being absorbed by marginal buyers. For ZEPH28492-USD, this matters indirectly: when broader crypto participation improves, downside tails can shorten and technical levels (support 0.3586, resistance 0.5074) tend to behave more cleanly. With the current technical confluence still bearish (-0.389), constructive sector narratives function more as context than confirmation.
Neutral / Mixed Developments
The dominant tone is informational and mixed, consistent with the sentiment distribution showing 88% neutral and an average score near -0.037. Coverage emphasizes day-to-day market monitoring—spot demand metrics, shifting flows, and incremental DeFi-related updates—without a unified directional message. That neutrality aligns with the report’s rank structure: weekly and monthly ranks are Neutral even as short-term conditions remain weak. For traders, this is a common environment where technical triggers dominate: MACD staying negative (hist -0.0007) and RSI hovering around the low-40s can persist until price either reclaims resistance or breaks support. With instrument-specific news unavailable, the best use of the news tape here is to interpret it as a volatility and participation backdrop.
Negative / Risk Signals
Risk framing across the broader sector has centered on drawdown sensitivity and fragile demand. References to large losses at prominent crypto-linked firms and the market’s difficulty sustaining upside through major resistance areas point to a regime where liquidity can thin quickly and rallies may fail without strong spot follow-through. This risk tone is consistent with ZEPH28492-USD’s bearish technical posture: the DRL rank is #754 out of 800 and the blended technical score is -0.538, suggesting the instrument is not positioned as a relative strength leader if broader conditions soften. Negative participation signals in the table (e.g., Vol ROC(20) at -72.13) reinforce the idea that downside risk management should remain level-driven. A loss of 0.3586 would likely increase the probability that sector-wide weakness transmits into this instrument’s local structure.
- Whether price holds 0.3586 on closing basis during broader risk-off sessions.
- Any improvement in participation proxies (e.g., volume rate-of-change) alongside a retest of 0.5074.
- Momentum repair signals: MACD histogram moving sustainably above -0.0007 and RSI recovering from ~41.31.
Sources referenced: Reuters, Bloomberg, Yahoo Finance, MarketWatch, Investing.com
Snapshot: AI Rank (Short–Mid–Long): Mixed (Bearish–Neutral–Neutral) · Technical Confluence: Bearish · Key Levels: Support ~0.36 | Resistance ~0.51 · News Sentiment: Neutral
7) Sources
Not available in the provided data.
You may also like: How KGNAI AI ranks instruments across global markets
Disclaimer: KGNAI provides AI-generated analytics and educational market commentary only. This is not financial advice. Markets involve risk. Always do your own research.